Estimated zip code population in 2022: 4,745 Zip code population in 2010: 5,390 Zip code population in 2000: 6,672
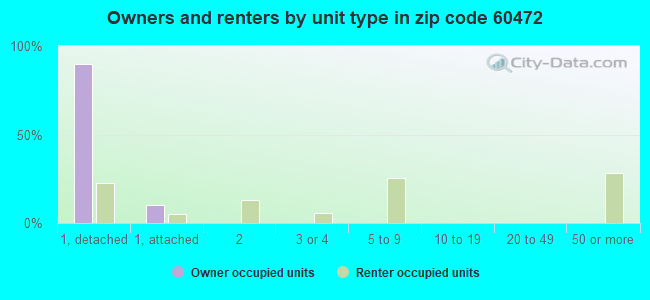
Houses and condos: 1,889 Renter-occupied apartments: 590
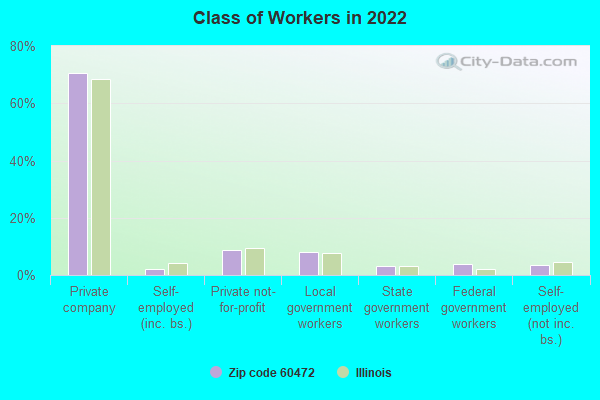
% of renters here:
41%
State:
33%
March 2022 cost of living index in zip code 60472: 98.5 (near average, U.S. average is 100)
Land area: 1.7 sq. mi. Water area: 0.1 sq. mi.
Population density: 2,868 people per square mile
(average).
OSM Map
General Map
Google Map
MSN Map
OSM Map
General Map
Google Map
MSN Map
OSM Map
General Map
Google Map
MSN Map
OSM Map
General Map
Google Map
MSN Map
Please wait while loading the map...
Real estate property taxes paid for housing units in 2022:
This zip code:
1.6% ($1,769)
Illinois:
2.0% ($4,912)
Median real estate property taxes paid for housing units with mortgages in 2022: $1,784 (1.6%) Median real estate property taxes paid for housing units with no mortgage in 2022: $1,718 (1.6%)
Business Search- 14 Million verified businesses
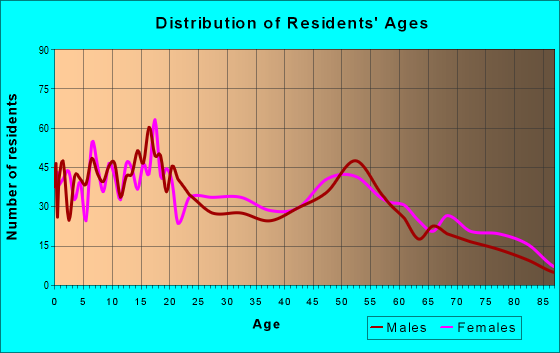
Males: 1,913
(40.3%)
Females: 2,832
(59.7%)
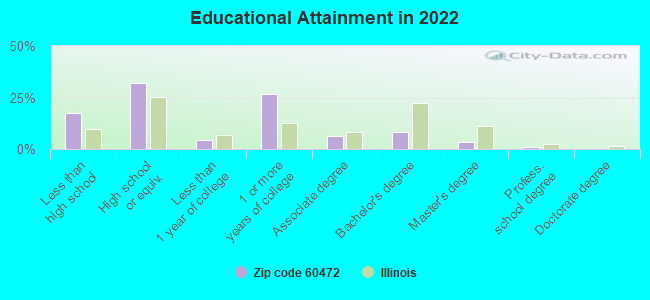
For population 25 years and over in 60472:
High school or higher: 80.4%
Bachelor's degree or higher: 12.4%
Graduate or professional degree: 4.4%
Unemployed: 12.0%
Mean travel time to work (commute): 27.0 minutes
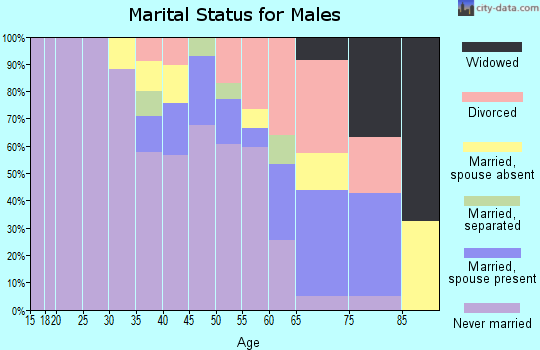
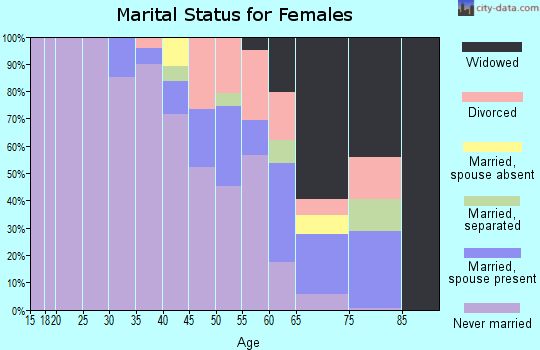
For population 15 years and over in 60472:
Never married: 55.1%
Now married: 31.6%
Separated: 3.4%
Widowed: 3.4%
Divorced: 6.6%
Zip code 60472 compared to state average:
Median household income below state average.
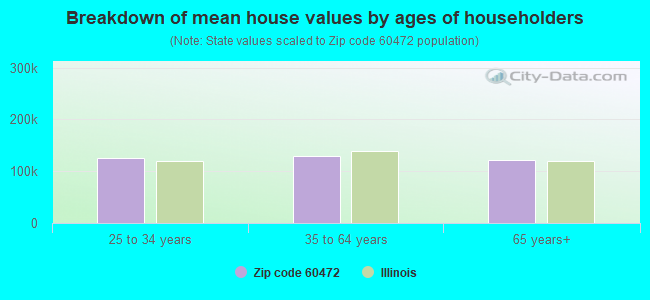
Median house value significantly below state average.
Unemployed percentage above state average.
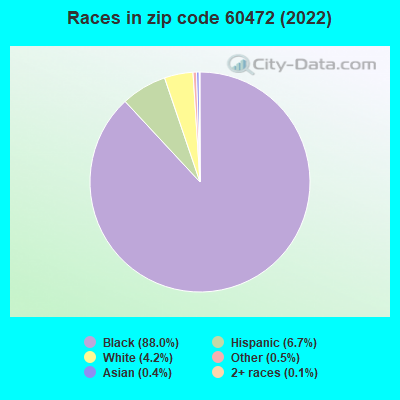
Black race population percentage significantly above state average.
Hispanic race population percentage below state average.
Median age below state average.
Foreign-born population percentage significantly below state average.
Length of stay since moving in above state average.
Percentage of population with a bachelor's degree or higher significantly below state average.
Averages for the 2020 tax year for zip code 60472, filed in 2021:
Average Adjusted Gross Income (AGI) in 2020: $31,670 (Individual Income Tax Returns)
Here:
$31,670
State:
$82,626
Salary/wage: $29,127 (reported on 84.5% of returns)
Here:
$29,127
State:
$66,640
(% of AGI for various income ranges: 1117.2% for AGIs below $25k, 3357.8% for AGIs $25k-50k, 6494.3% for AGIs $50k-75k, 11000.0% for AGIs $75k-100k, 11510.0% for AGIs $100k-200k)
Taxable interest for individuals: $258 (reported on 6.9% of returns)
This zip code:
$258
Illinois:
$2,376
(% of AGI for various income ranges: 0.7% for AGIs below $25k, 2.9% for AGIs $25k-50k, 30.0% for AGIs $75k-100k)
Ordinary dividends: $733 (reported on 3.4% of returns)
Here:
$733
State:
$9,061
(% of AGI for various income ranges: 4.3% for AGIs below $25k, 8.6% for AGIs $50k-75k)
Net capital gain/loss in AGI: +$250 (reported on 2.3% of returns)
Here:
+$250
State:
+$31,684
(% of AGI for various income ranges: 7.1% for AGIs $50k-75k)
Profit/loss from business: +$1,848 (reported on 17.8% of returns)
Here:
+$1,848
State:
+$12,175
(% of AGI for various income ranges: 60.0% for AGIs below $25k, 128.6% for AGIs $50k-75k)
Taxable individual retirement arrangement distribution: $8,933 (reported on 1.7% of returns)
60472:
$8,933
Illinois:
$21,613
(% of AGI for various income ranges: 54.7% for AGIs $25k-50k)
Total itemized deductions: $27,183 (reported on 3.4% of returns)
Here:
$27,183
State:
$34,948
(% of AGI for various income ranges: 199.0% for AGIs $25k-50k, 1640.0% for AGIs $75k-100k)
Charity contributions: $10,440 (reported on 2.9% of returns)
Here:
$10,440
State:
$13,122
(% of AGI for various income ranges: 372.9% for AGIs $50k-75k)
Taxes paid: $5,700 (reported on 3.4% of returns)
60472:
$5,700
State:
$8,563
(% of AGI for various income ranges: 38.8% for AGIs $25k-50k, 380.0% for AGIs $75k-100k)
Earned income credit: $2,751 (reported on 37.4% of returns)
Here:
$2,751
State:
$2,311
(% of AGI for various income ranges: 173.0% for AGIs below $25k, 103.7% for AGIs $25k-50k)
Percentage of individuals using paid preparers for their 2020 taxes: 92.5%
Here:
93%
State:
93%
(% for various income ranges: 92.9% for AGIs below $25k, 91.4% for AGIs $25k-50k, 89.5% for AGIs $50k-75k, 100.0% for AGIs $75k-100k, 100.0% for AGIs $100k-200k)
Averages for the 2012 tax year for zip code 60472, filed in 2013:
Average Adjusted Gross Income (AGI) in 2012: $26,291 (Individual Income Tax Returns)
Here:
$26,291
State:
$68,058
Salary/wage: $25,012 (reported on 80.2% of returns)
Here:
$25,012
State:
$55,396
(% of AGI for various income ranges: 69.7% for AGIs below $25k, 81.3% for AGIs $25k-50k, 82.4% for AGIs $50k-75k, 110.9% for AGIs $75k-100k)
Taxable interest for individuals: $300 (reported on 9.6% of returns)
This zip code:
$300
Illinois:
$1,969
(% of AGI for various income ranges: 0.1% for AGIs below $25k, 0.2% for AGIs $25k-50k, 0.1% for AGIs $75k-100k)
Ordinary dividends: $283 (reported on 3.2% of returns)
Here:
$283
State:
$7,786
(% of AGI for various income ranges: )
Profit/loss from business: +$5,478 (reported on 19.8% of returns)
Here:
+$5,478
State:
+$12,903
Taxable individual retirement arrangement distribution: $10,700 (reported on 3.2% of returns)
60472:
$10,700
Illinois:
$17,929
(% of AGI for various income ranges: 0.7% for AGIs below $25k, 1.2% for AGIs $25k-50k, 3.5% for AGIs $50k-75k)
Total itemized deductions: $15,978 (30% of AGI, reported on 14.4% of returns)
Here:
$15,978
State:
$26,433
Here:
30.2% of AGI
State:
19.2% of AGI
(% of AGI for various income ranges: 3.0% for AGIs below $25k, 8.6% for AGIs $25k-50k, 12.9% for AGIs $50k-75k, 23.5% for AGIs $75k-100k)
Charity contributions: $4,639 (reported on 12.3% of returns)
Here:
$4,639
State:
$4,525
(% of AGI for various income ranges: 0.6% for AGIs below $25k, 2.1% for AGIs $25k-50k, 2.8% for AGIs $50k-75k, 7.2% for AGIs $75k-100k)
Taxes paid: $4,196 (reported on 14.4% of returns)
60472:
$4,196
State:
$11,968
(% of AGI for various income ranges: 0.5% for AGIs below $25k, 2.0% for AGIs $25k-50k, 3.9% for AGIs $50k-75k, 6.8% for AGIs $75k-100k)
Earned income credit: $2,927 (reported on 44.4% of returns)
Here:
$2,927
State:
$2,349
(% of AGI for various income ranges: 14.6% for AGIs below $25k, 1.5% for AGIs $25k-50k)
Percentage of individuals using paid preparers for their 2012 taxes: 52.9%
Here:
53%
State:
57%
(% for various income ranges: 50.0% for AGIs below $25k, 57.4% for AGIs $25k-50k, 56.2% for AGIs $50k-75k, 83.3% for AGIs $75k-100k)
Averages for the 2004 tax year for zip code 60472, filed in 2005:
Average Adjusted Gross Income (AGI) in 2004: $22,678 (Individual Income Tax Returns)
Here:
$22,678
State:
$54,625
Salary/wage: $21,338 (reported on 85.9% of returns)
Here:
$21,338
State:
$46,811
(% of AGI for various income ranges: 73.5% for AGIs below $10k, 79.4% for AGIs $10k-25k, 88.6% for AGIs $25k-50k, 81.4% for AGIs $50k-75k, 62.4% for AGIs $75k-100k)
Taxable interest for individuals: $426 (reported on 16.3% of returns)
This zip code:
$426
Illinois:
$2,101
(% of AGI for various income ranges: 0.8% for AGIs below $10k, 0.4% for AGIs $10k-25k, 0.2% for AGIs $25k-50k, 0.3% for AGIs $50k-75k, 0.2% for AGIs $75k-100k)
Taxable dividends: $169 (reported on 3.8% of returns)
Here:
$169
State:
$4,306
(% of AGI for various income ranges: 0.0% for AGIs $10k-25k, 0.0% for AGIs $25k-50k, 0.0% for AGIs $50k-75k, 0.1% for AGIs $75k-100k)
Profit/loss from business: +$4,492 (reported on 12.7% of returns)
Here:
+$4,492
State:
+$11,771
(% of AGI for various income ranges: 15.4% for AGIs below $10k, 4.7% for AGIs $10k-25k, 0.1% for AGIs $25k-50k, 0.7% for AGIs $50k-75k)
IRA payment deduction: $1,100 (reported on 1.0% of returns)
60472:
$1,100
Illinois:
$3,087
Total itemized deductions: $14,242 (32% of AGI, reported on 15.6% of returns)
Here:
$14,242
State:
$20,239
Here:
32.2% of AGI
State:
19.5% of AGI
(% of AGI for various income ranges: 3.5% for AGIs below $10k, 4.4% for AGIs $10k-25k, 12.3% for AGIs $25k-50k, 12.9% for AGIs $50k-75k, 14.4% for AGIs $75k-100k)
Charity contributions deductions: $4,272 (9% of AGI, reported on 14.4% of returns)
Here:
$4,272
State:
$3,719
Here:
9.5% of AGI
State:
3.4% of AGI
(% of AGI for various income ranges: 1.2% for AGIs $10k-25k, 3.6% for AGIs $25k-50k, 3.6% for AGIs $50k-75k, 4.1% for AGIs $75k-100k)
Total tax: $2,326 (reported on 53.2% of returns)
60472:
$2,326
State:
$9,882
(% of AGI for various income ranges: 2.6% for AGIs below $10k, 2.5% for AGIs $10k-25k, 5.2% for AGIs $25k-50k, 8.7% for AGIs $50k-75k, 11.2% for AGIs $75k-100k)
Earned income credit: $2,224 (reported on 47.5% of returns)
Here:
$2,224
State:
$1,788
Percentage of individuals using paid preparers for their 2004 taxes: 67.5%
Here:
68%
State:
61%
(% for various income ranges: 61.3% for AGIs below $10k, 72.3% for AGIs $10k-25k, 67.6% for AGIs $25k-50k, 66.9% for AGIs $50k-75k, 58.8% for AGIs $75k-100k)
Likely homosexual households (counted as self-reported same-sex unmarried-partner households)
Lesbian couples: 0.9% of all households
Gay men: 0.0% of all households
Household received Food Stamps/SNAP in the past 12 months: 646 Household did not receive Food Stamps/SNAP in the past 12 months: 866
Women who had a birth in the past 12 months: 58 (0 now married, 59 unmarried) Women who did not have a birth in the past 12 months: 1,155 (270 now married, 891 unmarried)
Housing units in zip code 60472 with a mortgage: 327 (27 second mortgage, 8 both second mortgage and home equity loan) Median monthly owner costs for units with a mortgage: $1,343 Median monthly owner costs for units without a mortgage: $524
Residents with income below the poverty level in 2022:
This zip code:
35.1%
Whole state:
11.9%
Residents with income below 50% of the poverty level in 2022:
This zip code:
13.2%
Whole state:
5.7%
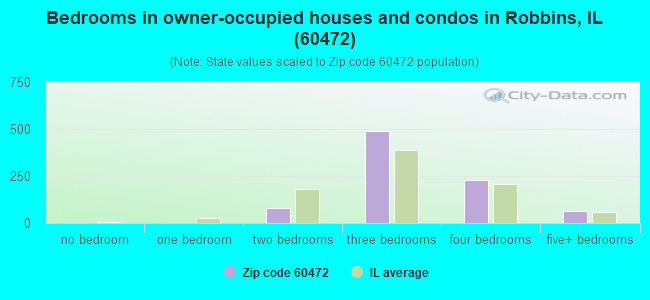
Median number of rooms in houses and condos:
Here:
6.5
State:
6.4
Median number of rooms in apartments:
Here:
4.8
State:
4.1
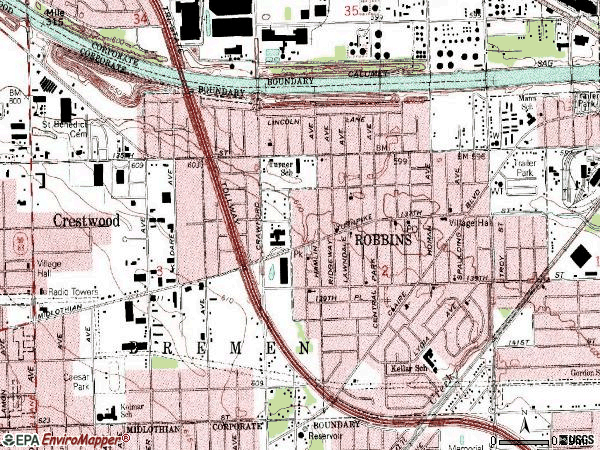
Notable locations in this zip code not listed on our city pages
Notable locations in zip code 60472: Robbins Village Hall (A), Community Economic Development Association (B), William Leonard Public Library (C), Robbins Fire Department (D). Display/hide their locations on the map
Churches in zip code 60472 include: Bethel African Methodist Episcopal Church (A), Christ Temple Church of Robbins (B), Gods House of Love Prayer (C), Great Hope Baptist Church (D), Mount Calvary Missionary Baptist Church (E), New Friendship Baptist Church (F), One Hundred Thirtyninth Street House of God (G), Robbins Church of Christ (H), Robbins Church of God in Christ (I). Display/hide their locations on the map
In group quarters: 428 (-1 institutionalized population)
Size of family households: 316 2-persons, 161 3-persons, 115 4-persons, 329 5-persons, 15 7-or-more-persons
Size of nonfamily households: 467 1-person, 28 2-persons
463 married couples with children.
447 single-parent households (59 men, 388 women).
90.2% of residents of 60472 zip code speak English at home.
8.6% of residents speak Spanish at home (44% very well, 13% well, 30% not well, 13% not at all).
0.6% of residents speak other Indo-European language at home (96% very well, 4% well).
0.2% of residents speak Asian or Pacific Island language at home (100% well).
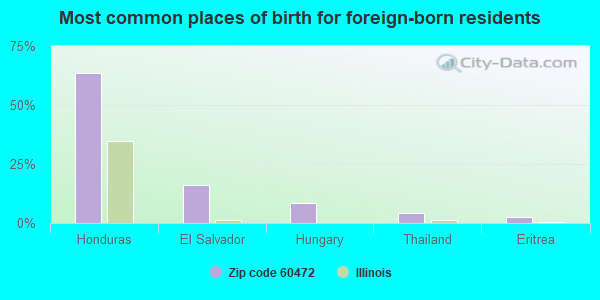
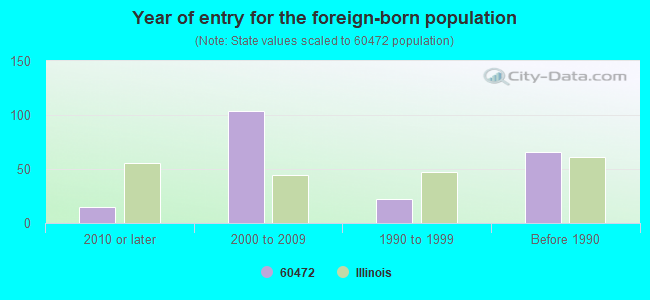
Foreign born population: 220 (4.6%) (25.6% of them are naturalized citizens)
This zip code:
4.6%
Whole state:
14.4%
64%Honduras
16%El Salvador
9%Hungary
4%Thailand
3%Eritrea
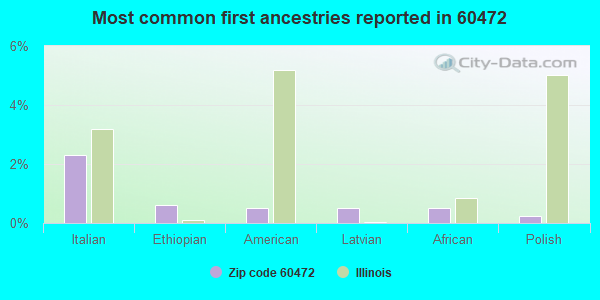
2%Italian
1%Ethiopian
0%American
0%Latvian
0%African
0%Polish
Year of entry for the foreign-born population
152010 or later
1042000 to 2009
221990 to 1999
66Before 1990
Facilities with environmental interests located in this zip code:
ROBBINS RECYCLING TRANSFER (13400 S KEDZIE AVE in ROBBINS, IL)
STATE MASTER (Illinois EPA Project) - HAZARDOUS WASTE PROGRAM, AIR PROGRAM, SOLID WASTE PROGRAM, National Pollutant Discharge Elimination System Permit AIR MAJOR (AIRS/AFS) CRITERIA AND HAZARDOUS AIR POLLUTANT INVENTORY (Inventory of air pollution sources) National Pollutant Discharge Elimination System NON-MAJOR (Tracking pollutant discharge elimination systems) - permit AIR MAJOR ("Best Available" air pollution technologies tracking) Small Quantity Generators, between 100 kg and 1000 kg of hazardous waste/month (Resource Conservation and Recovery Act (tracking hazardous waste)) - notification Business SIC classification: ELECTRIC SERVICES; REFUSE SYSTEMS Organizations: VILLAGE OF ROBBINS (CONTACT/OWNER)
Alternative names: ROBBINS RESOURCE & RECOVERY, ROBBINS RESOURCE RECOVERY, ROBBINS RESOURCE RECOVERY FACILITY
ASPEN HIGH SCHOOL (3940 W MIDLOTHIAN TURNPIKE in ROBBINS, IL)
STATE MASTER (Illinois EPA Project) - HAZARDOUS WASTE PROGRAM (Geographic Names Information System) Small Quantity Generators, between 100 kg and 1000 kg of hazardous waste/month (Resource Conservation and Recovery Act (tracking hazardous waste)) - notification Organizations: COMMUNITY HIGH SCH (CONTACT/OWNER)
HOUSING AUTHORITY OF COOK CTY (139TH AND GRACE ST in ROBBINS, IL)
STATE MASTER (Illinois EPA Project) - HAZARDOUS WASTE PROGRAM Small Quantity Generators, between 100 kg and 1000 kg of hazardous waste/month (Resource Conservation and Recovery Act (tracking hazardous waste)) - notification Organizations: HOUSING AUTHORITY OF COOK COUNTY (CONTACT/OWNER)
Alternative names: HOUSING AUTHORITY OF COOK CO
KELLAR SCHOOL (14123 LYDIA in ROBBINS, IL)
(National Center for Education Statistics) - STATE ID-1401614351003 Organizations: POSEN-ROBBINS EL SCH DIST 143-5 (SCHOOL DISTRICT)
CHILDS ELEM SCHOOL (14123 S LYDIA AVE in ROBBINS, IL)
(National Center for Education Statistics) - STATE ID-1401614352001 Organizations: POSEN-ROBBINS EL SCH DIST 143-5 (SCHOOL DISTRICT)
Housing units lacking complete plumbing facilities: 12.8% Housing units lacking complete kitchen facilities: 18.4%
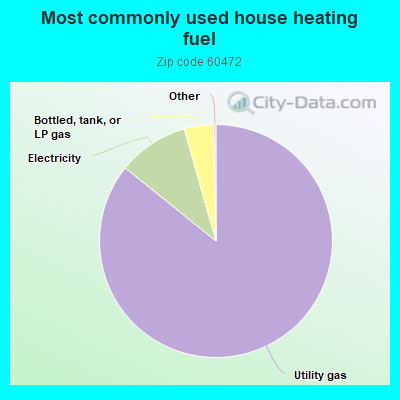
85.8%Utility gas
9.8%Electricity
4.1%Bottled, tank, or LP gas
Population in 1990: 7,132.
Place of birth for U.S.-born residents:
This state: 3,995
Northeast: 27
Midwest: 193
South: 277
West: 5
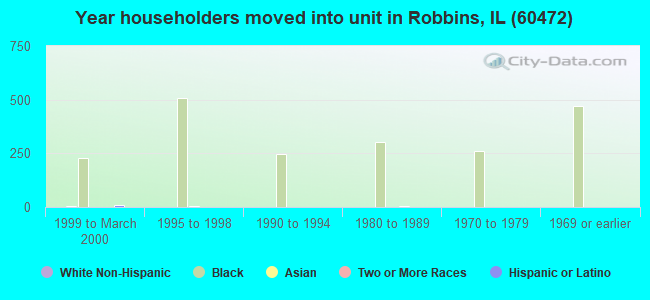
66% of the 60472 zip code residents lived in the same house 5 years ago. Out of people who lived in different houses, 88% lived in this county. Out of people who lived in different counties, 50% lived in Illinois.
90% of the 60472 zip code residents lived in the same house 1 year ago. Out of people who lived in different houses, 76% moved from this county. Out of people who lived in different houses, 3% moved from different county within same state. Out of people who lived in different houses, 18% moved from different state.
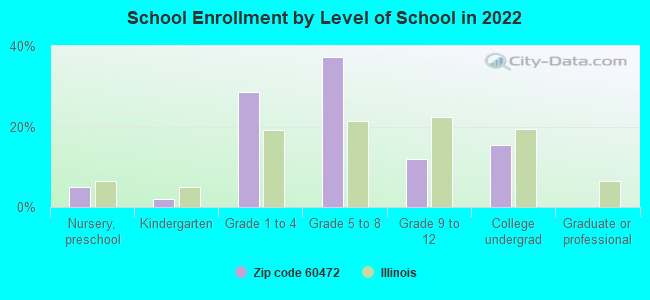
Private vs. public school enrollment:
Students in private schools in grades 1 to 8 (elementary and middle school): 17
Here:
2.6%
Illinois:
13.3%
Students in private schools in grades 9 to 12 (high school): 28
Here:
22.9%
Illinois:
9.9%
Students in private undergraduate colleges:
Here:
0.0%
Illinois:
27.4%
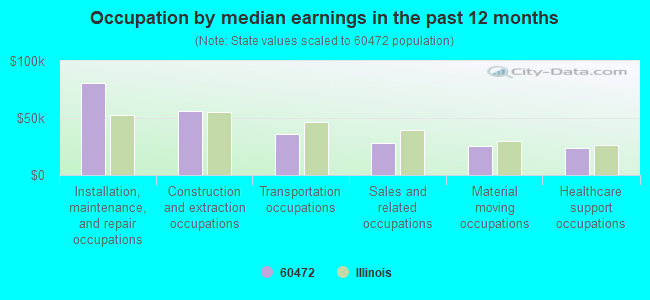
Occupation by median earnings in the past 12 months ($)
80,661Installation, maintenance, and repair occupations
56,122Construction and extraction occupations
35,957Transportation occupations
27,839Sales and related occupations
25,352Material moving occupations
23,268Healthcare support occupations
Top industries in this zip code by the number of employees in 2005:
Health Care and Social Assistance: Nursing Care Facilities (100-249 employees: 1 establishment)
Health Care and Social Assistance: Other Residential Care Facilities (20-49: 1)
Other Services (except Public Administration): Religious Organizations (20-49: 1)
Health Care and Social Assistance: Continuing Care Retirement Communities (20-49: 1)
Construction: Roofing Contractors (10-19: 1)
Administrative and Support and Waste Management and Remediation Services: Security Guards and Patrol Services (10-19: 1)
Health Care and Social Assistance: Child Day Care Services (10-19: 1)
Accommodation and Food Services: Drinking Places (Alcoholic Beverages) (1-4: 3)
People in group quarters in 2010:
401 people in mental (psychiatric) hospitals and psychiatric units in other hospitals
2 people in group homes for juveniles (non-correctional)
People in group quarters in 2000:
412 people in other nonhousehold living situations
13 people in other group homes
7 people in other noninstitutional group quarters
Fatal accident statistics in 2014:
Fatal accident count: 1
Vehicles involved in fatal accidents: 1
Fatal accidents caused by drunken drivers: 0
Fatalities: 1
Persons involved in fatal accidents: 1
Pedestrians involved in fatal accidents: 0
Fatal accident statistics in 2012:
Fatal accident count: 1
Vehicles involved in fatal accidents: 2
Fatal accidents caused by drunken drivers: 1
Fatalities: 1
Persons involved in fatal accidents: 3
Pedestrians involved in fatal accidents: 0
Home Mortgage Disclosure Act Aggregated Statistics For Year 2009 (Based on 6 partial tracts)
A) FHA, FSA/RHS & VA Home Purchase Loans
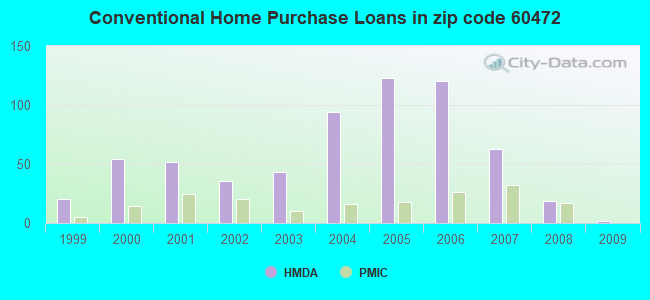
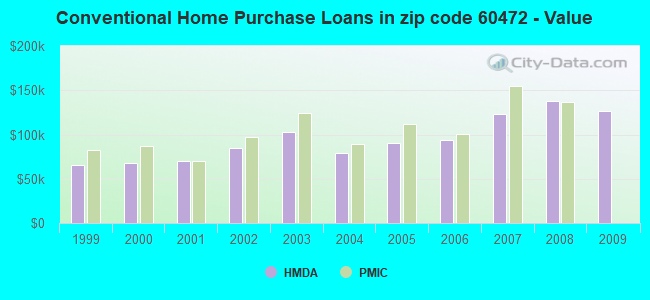
B) Conventional Home Purchase Loans
C) Refinancings
D) Home Improvement Loans
E) Loans on Dwellings For 5+ Families
F) Non-occupant Loans on < 5 Family Dwellings (A B C & D)
Number
Average Value
Number
Average Value
Number
Average Value
Number
Average Value
Number
Average Value
Number
Average Value
LOANS ORIGINATED
14
$117,203
2
$126,450
52
$156,404
14
$14,531
1
$371,500
5
$166,562
APPLICATIONS APPROVED, NOT ACCEPTED
2
$81,275
0
$0
23
$131,230
2
$5,780
1
$243,520
2
$58,070
APPLICATIONS DENIED
11
$147,018
7
$104,076
49
$119,544
17
$21,962
0
$0
16
$119,591
APPLICATIONS WITHDRAWN
4
$94,285
0
$0
20
$156,634
0
$0
0
$0
5
$181,064
FILES CLOSED FOR INCOMPLETENESS
4
$99,995
2
$157,975
7
$120,844
2
$21,255
0
$0
2
$157,975
Aggregated Statistics For Year 2008 (Based on 6 partial tracts)
A) FHA, FSA/RHS & VA Home Purchase Loans
B) Conventional Home Purchase Loans
C) Refinancings
D) Home Improvement Loans
E) Loans on Dwellings For 5+ Families
F) Non-occupant Loans on < 5 Family Dwellings (A B C & D)
G) Loans On Manufactured Home Dwelling (A B C & D)
Number
Average Value
Number
Average Value
Number
Average Value
Number
Average Value
Number
Average Value
Number
Average Value
Number
Average Value
LOANS ORIGINATED
21
$153,455
19
$137,299
64
$115,042
11
$47,475
1
$365,770
9
$74,260
0
$0
APPLICATIONS APPROVED, NOT ACCEPTED
0
$0
2
$196,060
14
$77,077
10
$25,900
0
$0
1
$320,940
0
$0
APPLICATIONS DENIED
11
$139,952
9
$130,633
104
$120,800
29
$54,491
0
$0
15
$62,754
1
$25,440
APPLICATIONS WITHDRAWN
1
$241,020
6
$117,595
22
$158,995
0
$0
0
$0
5
$55,360
0
$0
FILES CLOSED FOR INCOMPLETENESS
1
$233,530
1
$107,400
8
$99,118
1
$12,490
0
$0
2
$82,420
0
$0
Aggregated Statistics For Year 2007 (Based on 6 partial tracts)
A) FHA, FSA/RHS & VA Home Purchase Loans
B) Conventional Home Purchase Loans
C) Refinancings
D) Home Improvement Loans
F) Non-occupant Loans on < 5 Family Dwellings (A B C & D)
G) Loans On Manufactured Home Dwelling (A B C & D)
Number
Average Value
Number
Average Value
Number
Average Value
Number
Average Value
Number
Average Value
Number
Average Value
LOANS ORIGINATED
6
$231,860
63
$123,139
117
$113,038
20
$45,938
42
$94,762
0
$0
APPLICATIONS APPROVED, NOT ACCEPTED
0
$0
13
$100,350
28
$93,367
6
$26,283
6
$86,548
0
$0
APPLICATIONS DENIED
2
$100,590
37
$119,685
143
$114,075
70
$45,835
37
$67,116
1
$3,750
APPLICATIONS WITHDRAWN
1
$254,760
11
$124,430
49
$98,123
6
$102,445
9
$92,574
0
$0
FILES CLOSED FOR INCOMPLETENESS
0
$0
7
$134,789
25
$120,404
2
$42,245
4
$71,805
0
$0
Aggregated Statistics For Year 2006 (Based on 6 partial tracts)
A) FHA, FSA/RHS & VA Home Purchase Loans
B) Conventional Home Purchase Loans
C) Refinancings
D) Home Improvement Loans
E) Loans on Dwellings For 5+ Families
F) Non-occupant Loans on < 5 Family Dwellings (A B C & D)
G) Loans On Manufactured Home Dwelling (A B C & D)
Number
Average Value
Number
Average Value
Number
Average Value
Number
Average Value
Number
Average Value
Number
Average Value
Number
Average Value
LOANS ORIGINATED
11
$147,462
120
$93,813
202
$100,160
20
$46,739
0
$0
48
$71,587
0
$0
APPLICATIONS APPROVED, NOT ACCEPTED
1
$193,560
25
$81,518
49
$102,886
7
$31,574
2
$59,010
8
$87,392
0
$0
APPLICATIONS DENIED
0
$0
86
$75,628
180
$95,912
48
$27,187
0
$0
58
$60,122
3
$4,607
APPLICATIONS WITHDRAWN
1
$224,780
37
$89,663
71
$105,834
7
$92,990
0
$0
21
$79,428
0
$0
FILES CLOSED FOR INCOMPLETENESS
0
$0
7
$85,003
30
$109,670
2
$43,085
0
$0
11
$61,798
0
$0
Aggregated Statistics For Year 2005 (Based on 6 partial tracts)
A) FHA, FSA/RHS & VA Home Purchase Loans
B) Conventional Home Purchase Loans
C) Refinancings
D) Home Improvement Loans
E) Loans on Dwellings For 5+ Families
F) Non-occupant Loans on < 5 Family Dwellings (A B C & D)
Number
Average Value
Number
Average Value
Number
Average Value
Number
Average Value
Number
Average Value
Number
Average Value
LOANS ORIGINATED
7
$137,557
123
$90,364
182
$106,674
22
$39,169
2
$315,070
52
$64,643
APPLICATIONS APPROVED, NOT ACCEPTED
6
$193,980
30
$76,790
51
$89,647
5
$15,494
1
$126,130
13
$72,442
APPLICATIONS DENIED
2
$125,510
82
$75,212
210
$91,507
42
$45,190
0
$0
30
$59,522
APPLICATIONS WITHDRAWN
2
$83,205
21
$75,675
103
$102,566
9
$120,277
0
$0
27
$64,959
FILES CLOSED FOR INCOMPLETENESS
0
$0
10
$72,208
32
$95,205
0
$0
0
$0
2
$53,435
Aggregated Statistics For Year 2004 (Based on 6 partial tracts)
A) FHA, FSA/RHS & VA Home Purchase Loans
B) Conventional Home Purchase Loans
C) Refinancings
D) Home Improvement Loans
E) Loans on Dwellings For 5+ Families
F) Non-occupant Loans on < 5 Family Dwellings (A B C & D)
Number
Average Value
Number
Average Value
Number
Average Value
Number
Average Value
Number
Average Value
Number
Average Value
LOANS ORIGINATED
12
$159,849
94
$79,558
170
$87,345
18
$47,373
2
$199,525
47
$57,240
APPLICATIONS APPROVED, NOT ACCEPTED
2
$128,205
40
$72,140
45
$99,860
5
$23,516
0
$0
17
$59,270
APPLICATIONS DENIED
1
$71,180
48
$77,649
232
$88,599
41
$47,335
0
$0
29
$57,171
APPLICATIONS WITHDRAWN
3
$161,037
17
$82,054
79
$104,757
6
$37,123
0
$0
11
$74,591
FILES CLOSED FOR INCOMPLETENESS
0
$0
4
$72,325
19
$106,704
1
$135,440
0
$0
2
$75,895
Aggregated Statistics For Year 2003 (Based on 6 partial tracts)
A) FHA, FSA/RHS & VA Home Purchase Loans
B) Conventional Home Purchase Loans
C) Refinancings
D) Home Improvement Loans
E) Loans on Dwellings For 5+ Families
F) Non-occupant Loans on < 5 Family Dwellings (A B C & D)
Number
Average Value
Number
Average Value
Number
Average Value
Number
Average Value
Number
Average Value
Number
Average Value
LOANS ORIGINATED
31
$142,836
43
$102,889
190
$97,815
7
$17,941
4
$284,750
18
$50,863
APPLICATIONS APPROVED, NOT ACCEPTED
0
$0
23
$73,395
50
$90,294
4
$8,742
2
$84,055
8
$69,252
APPLICATIONS DENIED
3
$126,033
28
$76,121
182
$81,740
21
$14,209
0
$0
17
$63,552
APPLICATIONS WITHDRAWN
6
$138,825
14
$82,456
87
$93,632
6
$53,073
0
$0
8
$59,356
FILES CLOSED FOR INCOMPLETENESS
2
$123,630
1
$47,450
14
$110,326
0
$0
0
$0
0
$0
Aggregated Statistics For Year 2002 (Based on 6 partial tracts)
A) FHA, FSA/RHS & VA Home Purchase Loans
B) Conventional Home Purchase Loans
C) Refinancings
D) Home Improvement Loans
E) Loans on Dwellings For 5+ Families
F) Non-occupant Loans on < 5 Family Dwellings (A B C & D)
Number
Average Value
Number
Average Value
Number
Average Value
Number
Average Value
Number
Average Value
Number
Average Value
LOANS ORIGINATED
53
$135,591
36
$84,222
129
$77,059
25
$17,239
3
$175,537
23
$51,653
APPLICATIONS APPROVED, NOT ACCEPTED
0
$0
15
$56,337
32
$71,312
3
$8,490
2
$71,355
13
$46,928
APPLICATIONS DENIED
7
$116,341
38
$62,555
101
$70,605
31
$12,354
0
$0
18
$58,480
APPLICATIONS WITHDRAWN
1
$36,220
10
$52,949
71
$70,905
4
$27,785
0
$0
5
$40,890
FILES CLOSED FOR INCOMPLETENESS
1
$202,310
5
$34,114
25
$73,374
0
$0
0
$0
5
$57,694
Aggregated Statistics For Year 2001 (Based on 6 partial tracts)
A) FHA, FSA/RHS & VA Home Purchase Loans
B) Conventional Home Purchase Loans
C) Refinancings
D) Home Improvement Loans
E) Loans on Dwellings For 5+ Families
F) Non-occupant Loans on < 5 Family Dwellings (A B C & D)
Number
Average Value
Number
Average Value
Number
Average Value
Number
Average Value
Number
Average Value
Number
Average Value
LOANS ORIGINATED
27
$122,284
52
$70,367
122
$68,147
18
$21,705
2
$161,075
22
$52,542
APPLICATIONS APPROVED, NOT ACCEPTED
0
$0
13
$67,801
29
$70,709
15
$20,926
1
$101,150
9
$32,089
APPLICATIONS DENIED
5
$96,708
27
$85,006
168
$59,283
36
$23,394
0
$0
22
$47,239
APPLICATIONS WITHDRAWN
1
$164,840
12
$67,272
55
$66,711
2
$100,320
1
$146,150
1
$49,950
FILES CLOSED FOR INCOMPLETENESS
0
$0
3
$56,363
18
$70,010
2
$46,205
0
$0
2
$54,325
Aggregated Statistics For Year 2000 (Based on 6 partial tracts)
A) FHA, FSA/RHS & VA Home Purchase Loans
B) Conventional Home Purchase Loans
C) Refinancings
D) Home Improvement Loans
E) Loans on Dwellings For 5+ Families
F) Non-occupant Loans on < 5 Family Dwellings (A B C & D)
Number
Average Value
Number
Average Value
Number
Average Value
Number
Average Value
Number
Average Value
Number
Average Value
LOANS ORIGINATED
18
$98,586
54
$67,599
110
$54,581
28
$15,949
1
$161,460
18
$38,463
APPLICATIONS APPROVED, NOT ACCEPTED
2
$34,350
23
$58,828
31
$46,621
11
$13,701
0
$0
8
$40,458
APPLICATIONS DENIED
3
$95,580
34
$51,385
133
$59,089
43
$18,154
0
$0
15
$37,417
APPLICATIONS WITHDRAWN
3
$119,140
11
$71,239
73
$49,825
5
$12,544
0
$0
7
$37,464
FILES CLOSED FOR INCOMPLETENESS
1
$126,130
3
$48,277
43
$59,632
0
$0
0
$0
3
$54,797
Aggregated Statistics For Year 1999 (Based on 3 partial tracts)
A) FHA, FSA/RHS & VA Home Purchase Loans
B) Conventional Home Purchase Loans
C) Refinancings
D) Home Improvement Loans
E) Loans on Dwellings For 5+ Families
F) Non-occupant Loans on < 5 Family Dwellings (A B C & D)
2002 - 2018 National Fire Incident Reporting System (NFIRS) incidents
According to the data from the years 2002 - 2018 the average number of fires per year is 81. The highest number of fires - 158 took place in 2012, and the least - 37 in 2016. The data has a dropping trend.
When looking into fire subcategories, the most reports belonged to: Structure Fires (60.7%), and Outside Fires (16.6%).
Fire incident types reported to NFIRS in Zip Code 60472
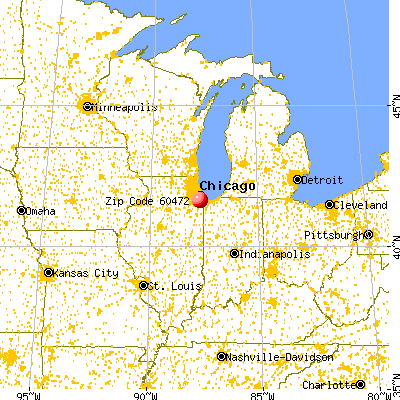


 Nearest zip codes: 60469, 60406, 60445, 60803, 60428, 60655.


 According to the data from the years 2002 - 2018 the average number of fires per year is 81. The highest number of fires - 158 took place in 2012, and the least - 37 in 2016. The data has a dropping trend.
 When looking into fire subcategories, the most reports belonged to: Structure Fires (60.7%), and Outside Fires (16.6%).