Robbins, Illinois Submit your own pictures of this village and show them to the world
OSM Map
General Map
Google Map
MSN Map
OSM Map
General Map
Google Map
MSN Map
OSM Map
General Map
Google Map
MSN Map
OSM Map
General Map
Google Map
MSN Map
Please wait while loading the map...
Population in 2022: 4,521 (100% urban, 0% rural). Population change since 2000: -31.9%Males: 1,816 Females: 2,705
March 2022 cost of living index in Robbins: 98.4 (near average, U.S. average is 100) Percentage of residents living in poverty in 2022: 34.1%for White Non-Hispanic residents , 36.4% for Black residents , 10.5% for Hispanic or Latino residents , 56.7% for other race residents )Business Search - 14 Million verified businesses
Data:
Median household income ($)
Median household income (% change since 2000)
Household income diversity
Ratio of average income to average house value (%)
Ratio of average income to average rent
Median household income ($) - White
Median household income ($) - Black or African American
Median household income ($) - Asian
Median household income ($) - Hispanic or Latino
Median household income ($) - American Indian and Alaska Native
Median household income ($) - Multirace
Median household income ($) - Other Race
Median household income for houses/condos with a mortgage ($)
Median household income for apartments without a mortgage ($)
Races - White alone (%)
Races - White alone (% change since 2000)
Races - Black alone (%)
Races - Black alone (% change since 2000)
Races - American Indian alone (%)
Races - American Indian alone (% change since 2000)
Races - Asian alone (%)
Races - Asian alone (% change since 2000)
Races - Hispanic (%)
Races - Hispanic (% change since 2000)
Races - Native Hawaiian and Other Pacific Islander alone (%)
Races - Native Hawaiian and Other Pacific Islander alone (% change since 2000)
Races - Two or more races (%)
Races - Two or more races (% change since 2000)
Races - Other race alone (%)
Races - Other race alone (% change since 2000)
Racial diversity
Unemployment (%)
Unemployment (% change since 2000)
Unemployment (%) - White
Unemployment (%) - Black or African American
Unemployment (%) - Asian
Unemployment (%) - Hispanic or Latino
Unemployment (%) - American Indian and Alaska Native
Unemployment (%) - Multirace
Unemployment (%) - Other Race
Population density (people per square mile)
Population - Males (%)
Population - Females (%)
Population - Males (%) - White
Population - Males (%) - Black or African American
Population - Males (%) - Asian
Population - Males (%) - Hispanic or Latino
Population - Males (%) - American Indian and Alaska Native
Population - Males (%) - Multirace
Population - Males (%) - Other Race
Population - Females (%) - White
Population - Females (%) - Black or African American
Population - Females (%) - Asian
Population - Females (%) - Hispanic or Latino
Population - Females (%) - American Indian and Alaska Native
Population - Females (%) - Multirace
Population - Females (%) - Other Race
Coronavirus confirmed cases (Apr 26, 2024)
Deaths caused by coronavirus (Apr 26, 2024)
Coronavirus confirmed cases (per 100k population) (Apr 26, 2024)
Deaths caused by coronavirus (per 100k population) (Apr 26, 2024)
Daily increase in number of cases (Apr 26, 2024)
Weekly increase in number of cases (Apr 26, 2024)
Cases doubled (in days) (Apr 26, 2024)
Hospitalized patients (Apr 18, 2022)
Negative test results (Apr 18, 2022)
Total test results (Apr 18, 2022)
COVID Vaccine doses distributed (per 100k population) (Sep 19, 2023)
COVID Vaccine doses administered (per 100k population) (Sep 19, 2023)
COVID Vaccine doses distributed (Sep 19, 2023)
COVID Vaccine doses administered (Sep 19, 2023)
Likely homosexual households (%)
Likely homosexual households (% change since 2000)
Likely homosexual households - Lesbian couples (%)
Likely homosexual households - Lesbian couples (% change since 2000)
Likely homosexual households - Gay men (%)
Likely homosexual households - Gay men (% change since 2000)
Cost of living index
Median gross rent ($)
Median contract rent ($)
Median monthly housing costs ($)
Median house or condo value ($)
Median house or condo value ($ change since 2000)
Mean house or condo value by units in structure - 1, detached ($)
Mean house or condo value by units in structure - 1, attached ($)
Mean house or condo value by units in structure - 2 ($)
Mean house or condo value by units in structure by units in structure - 3 or 4 ($)
Mean house or condo value by units in structure - 5 or more ($)
Mean house or condo value by units in structure - Boat, RV, van, etc. ($)
Mean house or condo value by units in structure - Mobile home ($)
Median house or condo value ($) - White
Median house or condo value ($) - Black or African American
Median house or condo value ($) - Asian
Median house or condo value ($) - Hispanic or Latino
Median house or condo value ($) - American Indian and Alaska Native
Median house or condo value ($) - Multirace
Median house or condo value ($) - Other Race
Median resident age
Resident age diversity
Median resident age - Males
Median resident age - Females
Median resident age - White
Median resident age - Black or African American
Median resident age - Asian
Median resident age - Hispanic or Latino
Median resident age - American Indian and Alaska Native
Median resident age - Multirace
Median resident age - Other Race
Median resident age - Males - White
Median resident age - Males - Black or African American
Median resident age - Males - Asian
Median resident age - Males - Hispanic or Latino
Median resident age - Males - American Indian and Alaska Native
Median resident age - Males - Multirace
Median resident age - Males - Other Race
Median resident age - Females - White
Median resident age - Females - Black or African American
Median resident age - Females - Asian
Median resident age - Females - Hispanic or Latino
Median resident age - Females - American Indian and Alaska Native
Median resident age - Females - Multirace
Median resident age - Females - Other Race
Commute - mean travel time to work (minutes)
Travel time to work - Less than 5 minutes (%)
Travel time to work - Less than 5 minutes (% change since 2000)
Travel time to work - 5 to 9 minutes (%)
Travel time to work - 5 to 9 minutes (% change since 2000)
Travel time to work - 10 to 19 minutes (%)
Travel time to work - 10 to 19 minutes (% change since 2000)
Travel time to work - 20 to 29 minutes (%)
Travel time to work - 20 to 29 minutes (% change since 2000)
Travel time to work - 30 to 39 minutes (%)
Travel time to work - 30 to 39 minutes (% change since 2000)
Travel time to work - 40 to 59 minutes (%)
Travel time to work - 40 to 59 minutes (% change since 2000)
Travel time to work - 60 to 89 minutes (%)
Travel time to work - 60 to 89 minutes (% change since 2000)
Travel time to work - 90 or more minutes (%)
Travel time to work - 90 or more minutes (% change since 2000)
Marital status - Never married (%)
Marital status - Now married (%)
Marital status - Separated (%)
Marital status - Widowed (%)
Marital status - Divorced (%)
Median family income ($)
Median family income (% change since 2000)
Median non-family income ($)
Median non-family income (% change since 2000)
Median per capita income ($)
Median per capita income (% change since 2000)
Median family income ($) - White
Median family income ($) - Black or African American
Median family income ($) - Asian
Median family income ($) - Hispanic or Latino
Median family income ($) - American Indian and Alaska Native
Median family income ($) - Multirace
Median family income ($) - Other Race
Median year house/condo built
Median year apartment built
Year house built - Built 2005 or later (%)
Year house built - Built 2000 to 2004 (%)
Year house built - Built 1990 to 1999 (%)
Year house built - Built 1980 to 1989 (%)
Year house built - Built 1970 to 1979 (%)
Year house built - Built 1960 to 1969 (%)
Year house built - Built 1950 to 1959 (%)
Year house built - Built 1940 to 1949 (%)
Year house built - Built 1939 or earlier (%)
Average household size
Household density (households per square mile)
Average household size - White
Average household size - Black or African American
Average household size - Asian
Average household size - Hispanic or Latino
Average household size - American Indian and Alaska Native
Average household size - Multirace
Average household size - Other Race
Occupied housing units (%)
Vacant housing units (%)
Owner occupied housing units (%)
Renter occupied housing units (%)
Vacancy status - For rent (%)
Vacancy status - For sale only (%)
Vacancy status - Rented or sold, not occupied (%)
Vacancy status - For seasonal, recreational, or occasional use (%)
Vacancy status - For migrant workers (%)
Vacancy status - Other vacant (%)
Residents with income below the poverty level (%)
Residents with income below 50% of the poverty level (%)
Children below poverty level (%)
Poor families by family type - Married-couple family (%)
Poor families by family type - Male, no wife present (%)
Poor families by family type - Female, no husband present (%)
Poverty status for native-born residents (%)
Poverty status for foreign-born residents (%)
Poverty among high school graduates not in families (%)
Poverty among people who did not graduate high school not in families (%)
Residents with income below the poverty level (%) - White
Residents with income below the poverty level (%) - Black or African American
Residents with income below the poverty level (%) - Asian
Residents with income below the poverty level (%) - Hispanic or Latino
Residents with income below the poverty level (%) - American Indian and Alaska Native
Residents with income below the poverty level (%) - Multirace
Residents with income below the poverty level (%) - Other Race
Air pollution - Air Quality Index (AQI)
Air pollution - CO
Air pollution - NO2
Air pollution - SO2
Air pollution - Ozone
Air pollution - PM10
Air pollution - PM25
Air pollution - Pb
Crime - Murders per 100,000 population
Crime - Rapes per 100,000 population
Crime - Robberies per 100,000 population
Crime - Assaults per 100,000 population
Crime - Burglaries per 100,000 population
Crime - Thefts per 100,000 population
Crime - Auto thefts per 100,000 population
Crime - Arson per 100,000 population
Crime - City-data.com crime index
Crime - Violent crime index
Crime - Property crime index
Crime - Murders per 100,000 population (5 year average)
Crime - Rapes per 100,000 population (5 year average)
Crime - Robberies per 100,000 population (5 year average)
Crime - Assaults per 100,000 population (5 year average)
Crime - Burglaries per 100,000 population (5 year average)
Crime - Thefts per 100,000 population (5 year average)
Crime - Auto thefts per 100,000 population (5 year average)
Crime - Arson per 100,000 population (5 year average)
Crime - City-data.com crime index (5 year average)
Crime - Violent crime index (5 year average)
Crime - Property crime index (5 year average)
1996 Presidential Elections Results (%) - Democratic Party (Clinton)
1996 Presidential Elections Results (%) - Republican Party (Dole)
1996 Presidential Elections Results (%) - Other
2000 Presidential Elections Results (%) - Democratic Party (Gore)
2000 Presidential Elections Results (%) - Republican Party (Bush)
2000 Presidential Elections Results (%) - Other
2004 Presidential Elections Results (%) - Democratic Party (Kerry)
2004 Presidential Elections Results (%) - Republican Party (Bush)
2004 Presidential Elections Results (%) - Other
2008 Presidential Elections Results (%) - Democratic Party (Obama)
2008 Presidential Elections Results (%) - Republican Party (McCain)
2008 Presidential Elections Results (%) - Other
2012 Presidential Elections Results (%) - Democratic Party (Obama)
2012 Presidential Elections Results (%) - Republican Party (Romney)
2012 Presidential Elections Results (%) - Other
2016 Presidential Elections Results (%) - Democratic Party (Clinton)
2016 Presidential Elections Results (%) - Republican Party (Trump)
2016 Presidential Elections Results (%) - Other
2020 Presidential Elections Results (%) - Democratic Party (Biden)
2020 Presidential Elections Results (%) - Republican Party (Trump)
2020 Presidential Elections Results (%) - Other
Ancestries Reported - Arab (%)
Ancestries Reported - Czech (%)
Ancestries Reported - Danish (%)
Ancestries Reported - Dutch (%)
Ancestries Reported - English (%)
Ancestries Reported - French (%)
Ancestries Reported - French Canadian (%)
Ancestries Reported - German (%)
Ancestries Reported - Greek (%)
Ancestries Reported - Hungarian (%)
Ancestries Reported - Irish (%)
Ancestries Reported - Italian (%)
Ancestries Reported - Lithuanian (%)
Ancestries Reported - Norwegian (%)
Ancestries Reported - Polish (%)
Ancestries Reported - Portuguese (%)
Ancestries Reported - Russian (%)
Ancestries Reported - Scotch-Irish (%)
Ancestries Reported - Scottish (%)
Ancestries Reported - Slovak (%)
Ancestries Reported - Subsaharan African (%)
Ancestries Reported - Swedish (%)
Ancestries Reported - Swiss (%)
Ancestries Reported - Ukrainian (%)
Ancestries Reported - United States (%)
Ancestries Reported - Welsh (%)
Ancestries Reported - West Indian (%)
Ancestries Reported - Other (%)
Educational Attainment - No schooling completed (%)
Educational Attainment - Less than high school (%)
Educational Attainment - High school or equivalent (%)
Educational Attainment - Less than 1 year of college (%)
Educational Attainment - 1 or more years of college (%)
Educational Attainment - Associate degree (%)
Educational Attainment - Bachelor's degree (%)
Educational Attainment - Master's degree (%)
Educational Attainment - Professional school degree (%)
Educational Attainment - Doctorate degree (%)
School Enrollment - Nursery, preschool (%)
School Enrollment - Kindergarten (%)
School Enrollment - Grade 1 to 4 (%)
School Enrollment - Grade 5 to 8 (%)
School Enrollment - Grade 9 to 12 (%)
School Enrollment - College undergrad (%)
School Enrollment - Graduate or professional (%)
School Enrollment - Not enrolled in school (%)
School enrollment - Public schools (%)
School enrollment - Private schools (%)
School enrollment - Not enrolled (%)
Median number of rooms in houses and condos
Median number of rooms in apartments
Housing units lacking complete plumbing facilities (%)
Housing units lacking complete kitchen facilities (%)
Density of houses
Urban houses (%)
Rural houses (%)
Households with people 60 years and over (%)
Households with people 65 years and over (%)
Households with people 75 years and over (%)
Households with one or more nonrelatives (%)
Households with no nonrelatives (%)
Population in households (%)
Family households (%)
Nonfamily households (%)
Population in families (%)
Family households with own children (%)
Median number of bedrooms in owner occupied houses
Mean number of bedrooms in owner occupied houses
Median number of bedrooms in renter occupied houses
Mean number of bedrooms in renter occupied houses
Median number of vehichles in owner occupied houses
Mean number of vehichles in owner occupied houses
Median number of vehichles in renter occupied houses
Mean number of vehichles in renter occupied houses
Mortgage status - with mortgage (%)
Mortgage status - with second mortgage (%)
Mortgage status - with home equity loan (%)
Mortgage status - with both second mortgage and home equity loan (%)
Mortgage status - without a mortgage (%)
Average family size
Average family size - White
Average family size - Black or African American
Average family size - Asian
Average family size - Hispanic or Latino
Average family size - American Indian and Alaska Native
Average family size - Multirace
Average family size - Other Race
Geographical mobility - Same house 1 year ago (%)
Geographical mobility - Moved within same county (%)
Geographical mobility - Moved from different county within same state (%)
Geographical mobility - Moved from different state (%)
Geographical mobility - Moved from abroad (%)
Place of birth - Born in state of residence (%)
Place of birth - Born in other state (%)
Place of birth - Native, outside of US (%)
Place of birth - Foreign born (%)
Housing units in structures - 1, detached (%)
Housing units in structures - 1, attached (%)
Housing units in structures - 2 (%)
Housing units in structures - 3 or 4 (%)
Housing units in structures - 5 to 9 (%)
Housing units in structures - 10 to 19 (%)
Housing units in structures - 20 to 49 (%)
Housing units in structures - 50 or more (%)
Housing units in structures - Mobile home (%)
Housing units in structures - Boat, RV, van, etc. (%)
House/condo owner moved in on average (years ago)
Renter moved in on average (years ago)
Year householder moved into unit - Moved in 1999 to March 2000 (%)
Year householder moved into unit - Moved in 1995 to 1998 (%)
Year householder moved into unit - Moved in 1990 to 1994 (%)
Year householder moved into unit - Moved in 1980 to 1989 (%)
Year householder moved into unit - Moved in 1970 to 1979 (%)
Year householder moved into unit - Moved in 1969 or earlier (%)
Means of transportation to work - Drove car alone (%)
Means of transportation to work - Carpooled (%)
Means of transportation to work - Public transportation (%)
Means of transportation to work - Bus or trolley bus (%)
Means of transportation to work - Streetcar or trolley car (%)
Means of transportation to work - Subway or elevated (%)
Means of transportation to work - Railroad (%)
Means of transportation to work - Ferryboat (%)
Means of transportation to work - Taxicab (%)
Means of transportation to work - Motorcycle (%)
Means of transportation to work - Bicycle (%)
Means of transportation to work - Walked (%)
Means of transportation to work - Other means (%)
Working at home (%)
Industry diversity
Most Common Industries - Agriculture, forestry, fishing and hunting, and mining (%)
Most Common Industries - Agriculture, forestry, fishing and hunting (%)
Most Common Industries - Mining, quarrying, and oil and gas extraction (%)
Most Common Industries - Construction (%)
Most Common Industries - Manufacturing (%)
Most Common Industries - Wholesale trade (%)
Most Common Industries - Retail trade (%)
Most Common Industries - Transportation and warehousing, and utilities (%)
Most Common Industries - Transportation and warehousing (%)
Most Common Industries - Utilities (%)
Most Common Industries - Information (%)
Most Common Industries - Finance and insurance, and real estate and rental and leasing (%)
Most Common Industries - Finance and insurance (%)
Most Common Industries - Real estate and rental and leasing (%)
Most Common Industries - Professional, scientific, and management, and administrative and waste management services (%)
Most Common Industries - Professional, scientific, and technical services (%)
Most Common Industries - Management of companies and enterprises (%)
Most Common Industries - Administrative and support and waste management services (%)
Most Common Industries - Educational services, and health care and social assistance (%)
Most Common Industries - Educational services (%)
Most Common Industries - Health care and social assistance (%)
Most Common Industries - Arts, entertainment, and recreation, and accommodation and food services (%)
Most Common Industries - Arts, entertainment, and recreation (%)
Most Common Industries - Accommodation and food services (%)
Most Common Industries - Other services, except public administration (%)
Most Common Industries - Public administration (%)
Occupation diversity
Most Common Occupations - Management, business, science, and arts occupations (%)
Most Common Occupations - Management, business, and financial occupations (%)
Most Common Occupations - Management occupations (%)
Most Common Occupations - Business and financial operations occupations (%)
Most Common Occupations - Computer, engineering, and science occupations (%)
Most Common Occupations - Computer and mathematical occupations (%)
Most Common Occupations - Architecture and engineering occupations (%)
Most Common Occupations - Life, physical, and social science occupations (%)
Most Common Occupations - Education, legal, community service, arts, and media occupations (%)
Most Common Occupations - Community and social service occupations (%)
Most Common Occupations - Legal occupations (%)
Most Common Occupations - Education, training, and library occupations (%)
Most Common Occupations - Arts, design, entertainment, sports, and media occupations (%)
Most Common Occupations - Healthcare practitioners and technical occupations (%)
Most Common Occupations - Health diagnosing and treating practitioners and other technical occupations (%)
Most Common Occupations - Health technologists and technicians (%)
Most Common Occupations - Service occupations (%)
Most Common Occupations - Healthcare support occupations (%)
Most Common Occupations - Protective service occupations (%)
Most Common Occupations - Fire fighting and prevention, and other protective service workers including supervisors (%)
Most Common Occupations - Law enforcement workers including supervisors (%)
Most Common Occupations - Food preparation and serving related occupations (%)
Most Common Occupations - Building and grounds cleaning and maintenance occupations (%)
Most Common Occupations - Personal care and service occupations (%)
Most Common Occupations - Sales and office occupations (%)
Most Common Occupations - Sales and related occupations (%)
Most Common Occupations - Office and administrative support occupations (%)
Most Common Occupations - Natural resources, construction, and maintenance occupations (%)
Most Common Occupations - Farming, fishing, and forestry occupations (%)
Most Common Occupations - Construction and extraction occupations (%)
Most Common Occupations - Installation, maintenance, and repair occupations (%)
Most Common Occupations - Production, transportation, and material moving occupations (%)
Most Common Occupations - Production occupations (%)
Most Common Occupations - Transportation occupations (%)
Most Common Occupations - Material moving occupations (%)
People in Group quarters - Institutionalized population (%)
People in Group quarters - Correctional institutions (%)
People in Group quarters - Federal prisons and detention centers (%)
People in Group quarters - Halfway houses (%)
People in Group quarters - Local jails and other confinement facilities (including police lockups) (%)
People in Group quarters - Military disciplinary barracks (%)
People in Group quarters - State prisons (%)
People in Group quarters - Other types of correctional institutions (%)
People in Group quarters - Nursing homes (%)
People in Group quarters - Hospitals/wards, hospices, and schools for the handicapped (%)
People in Group quarters - Hospitals/wards and hospices for chronically ill (%)
People in Group quarters - Hospices or homes for chronically ill (%)
People in Group quarters - Military hospitals or wards for chronically ill (%)
People in Group quarters - Other hospitals or wards for chronically ill (%)
People in Group quarters - Hospitals or wards for drug/alcohol abuse (%)
People in Group quarters - Mental (Psychiatric) hospitals or wards (%)
People in Group quarters - Schools, hospitals, or wards for the mentally retarded (%)
People in Group quarters - Schools, hospitals, or wards for the physically handicapped (%)
People in Group quarters - Institutions for the deaf (%)
People in Group quarters - Institutions for the blind (%)
People in Group quarters - Orthopedic wards and institutions for the physically handicapped (%)
People in Group quarters - Wards in general hospitals for patients who have no usual home elsewhere (%)
People in Group quarters - Wards in military hospitals for patients who have no usual home elsewhere (%)
People in Group quarters - Juvenile institutions (%)
People in Group quarters - Long-term care (%)
People in Group quarters - Homes for abused, dependent, and neglected children (%)
People in Group quarters - Residential treatment centers for emotionally disturbed children (%)
People in Group quarters - Training schools for juvenile delinquents (%)
People in Group quarters - Short-term care, detention or diagnostic centers for delinquent children (%)
People in Group quarters - Type of juvenile institution unknown (%)
People in Group quarters - Noninstitutionalized population (%)
People in Group quarters - College dormitories (includes college quarters off campus) (%)
People in Group quarters - Military quarters (%)
People in Group quarters - On base (%)
People in Group quarters - Barracks, unaccompanied personnel housing (UPH), (Enlisted/Officer), ;and similar group living quarters for military personnel (%)
People in Group quarters - Transient quarters for temporary residents (%)
People in Group quarters - Military ships (%)
People in Group quarters - Group homes (%)
People in Group quarters - Homes or halfway houses for drug/alcohol abuse (%)
People in Group quarters - Homes for the mentally ill (%)
People in Group quarters - Homes for the mentally retarded (%)
People in Group quarters - Homes for the physically handicapped (%)
People in Group quarters - Other group homes (%)
People in Group quarters - Religious group quarters (%)
People in Group quarters - Dormitories (%)
People in Group quarters - Agriculture workers' dormitories on farms (%)
People in Group quarters - Job Corps and vocational training facilities (%)
People in Group quarters - Other workers' dormitories (%)
People in Group quarters - Crews of maritime vessels (%)
People in Group quarters - Other nonhousehold living situations (%)
People in Group quarters - Other noninstitutional group quarters (%)
Residents speaking English at home (%)
Residents speaking English at home - Born in the United States (%)
Residents speaking English at home - Native, born elsewhere (%)
Residents speaking English at home - Foreign born (%)
Residents speaking Spanish at home (%)
Residents speaking Spanish at home - Born in the United States (%)
Residents speaking Spanish at home - Native, born elsewhere (%)
Residents speaking Spanish at home - Foreign born (%)
Residents speaking other language at home (%)
Residents speaking other language at home - Born in the United States (%)
Residents speaking other language at home - Native, born elsewhere (%)
Residents speaking other language at home - Foreign born (%)
Class of Workers - Employee of private company (%)
Class of Workers - Self-employed in own incorporated business (%)
Class of Workers - Private not-for-profit wage and salary workers (%)
Class of Workers - Local government workers (%)
Class of Workers - State government workers (%)
Class of Workers - Federal government workers (%)
Class of Workers - Self-employed workers in own not incorporated business and Unpaid family workers (%)
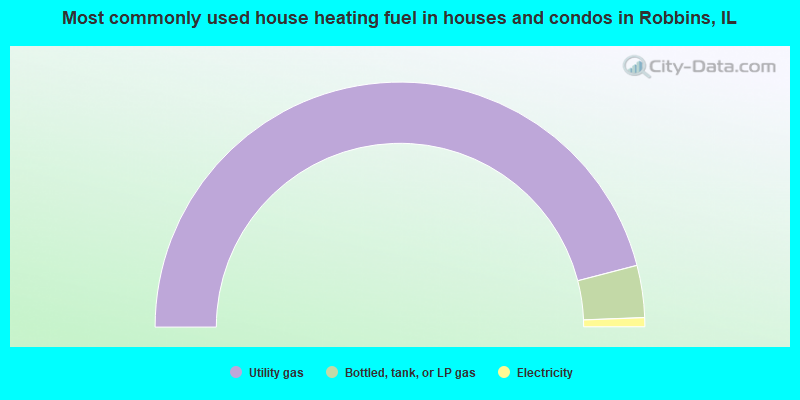
House heating fuel used in houses and condos - Utility gas (%)
House heating fuel used in houses and condos - Bottled, tank, or LP gas (%)
House heating fuel used in houses and condos - Electricity (%)
House heating fuel used in houses and condos - Fuel oil, kerosene, etc. (%)
House heating fuel used in houses and condos - Coal or coke (%)
House heating fuel used in houses and condos - Wood (%)
House heating fuel used in houses and condos - Solar energy (%)
House heating fuel used in houses and condos - Other fuel (%)
House heating fuel used in houses and condos - No fuel used (%)
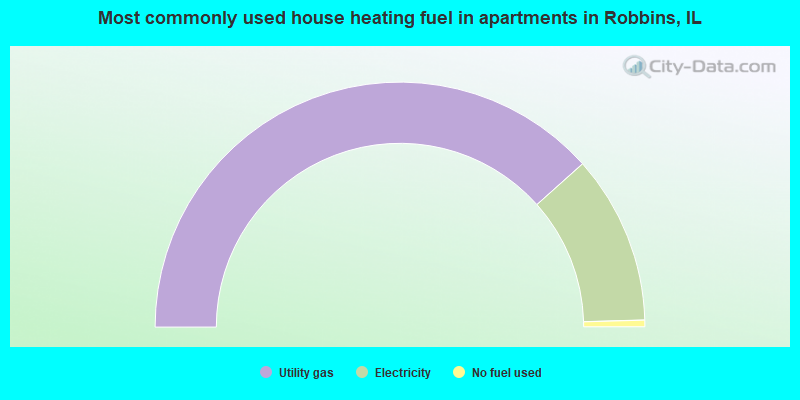
House heating fuel used in apartments - Utility gas (%)
House heating fuel used in apartments - Bottled, tank, or LP gas (%)
House heating fuel used in apartments - Electricity (%)
House heating fuel used in apartments - Fuel oil, kerosene, etc. (%)
House heating fuel used in apartments - Coal or coke (%)
House heating fuel used in apartments - Wood (%)
House heating fuel used in apartments - Solar energy (%)
House heating fuel used in apartments - Other fuel (%)
House heating fuel used in apartments - No fuel used (%)
Armed forces status - In Armed Forces (%)
Armed forces status - Civilian (%)
Armed forces status - Civilian - Veteran (%)
Armed forces status - Civilian - Nonveteran (%)
Fatal accidents locations in years 2005-2021
Fatal accidents locations in 2005
Fatal accidents locations in 2006
Fatal accidents locations in 2007
Fatal accidents locations in 2008
Fatal accidents locations in 2009
Fatal accidents locations in 2010
Fatal accidents locations in 2011
Fatal accidents locations in 2012
Fatal accidents locations in 2013
Fatal accidents locations in 2014
Fatal accidents locations in 2015
Fatal accidents locations in 2016
Fatal accidents locations in 2017
Fatal accidents locations in 2018
Fatal accidents locations in 2019
Fatal accidents locations in 2020
Fatal accidents locations in 2021
Alcohol use - People drinking some alcohol every month (%)
Alcohol use - People not drinking at all (%)
Alcohol use - Average days/month drinking alcohol
Alcohol use - Average drinks/week
Alcohol use - Average days/year people drink much
Audiometry - Average condition of hearing (%)
Audiometry - People that can hear a whisper from across a quiet room (%)
Audiometry - People that can hear normal voice from across a quiet room (%)
Audiometry - Ears ringing, roaring, buzzing (%)
Audiometry - Had a job exposure to loud noise (%)
Audiometry - Had off-work exposure to loud noise (%)
Blood Pressure & Cholesterol - Has high blood pressure (%)
Blood Pressure & Cholesterol - Checking blood pressure at home (%)
Blood Pressure & Cholesterol - Frequently checking blood cholesterol (%)
Blood Pressure & Cholesterol - Has high cholesterol level (%)
Consumer Behavior - Money monthly spent on food at supermarket/grocery store
Consumer Behavior - Money monthly spent on food at other stores
Consumer Behavior - Money monthly spent on eating out
Consumer Behavior - Money monthly spent on carryout/delivered foods
Consumer Behavior - Income spent on food at supermarket/grocery store (%)
Consumer Behavior - Income spent on food at other stores (%)
Consumer Behavior - Income spent on eating out (%)
Consumer Behavior - Income spent on carryout/delivered foods (%)
Current Health Status - General health condition (%)
Current Health Status - Blood donors (%)
Current Health Status - Has blood ever tested for HIV virus (%)
Current Health Status - Left-handed people (%)
Dermatology - People using sunscreen (%)
Diabetes - Diabetics (%)
Diabetes - Had a blood test for high blood sugar (%)
Diabetes - People taking insulin (%)
Diet Behavior & Nutrition - Diet health (%)
Diet Behavior & Nutrition - Milk product consumption (# of products/month)
Diet Behavior & Nutrition - Meals not home prepared (#/week)
Diet Behavior & Nutrition - Meals from fast food or pizza place (#/week)
Diet Behavior & Nutrition - Ready-to-eat foods (#/month)
Diet Behavior & Nutrition - Frozen meals/pizza (#/month)
Drug Use - People that ever used marijuana or hashish (%)
Drug Use - Ever used hard drugs (%)
Drug Use - Ever used any form of cocaine (%)
Drug Use - Ever used heroin (%)
Drug Use - Ever used methamphetamine (%)
Health Insurance - People covered by health insurance (%)
Kidney Conditions-Urology - Avg. # of times urinating at night
Medical Conditions - People with asthma (%)
Medical Conditions - People with anemia (%)
Medical Conditions - People with psoriasis (%)
Medical Conditions - People with overweight (%)
Medical Conditions - Elderly people having difficulties in thinking or remembering (%)
Medical Conditions - People who ever received blood transfusion (%)
Medical Conditions - People having trouble seeing even with glass/contacts (%)
Medical Conditions - People with arthritis (%)
Medical Conditions - People with gout (%)
Medical Conditions - People with congestive heart failure (%)
Medical Conditions - People with coronary heart disease (%)
Medical Conditions - People with angina pectoris (%)
Medical Conditions - People who ever had heart attack (%)
Medical Conditions - People who ever had stroke (%)
Medical Conditions - People with emphysema (%)
Medical Conditions - People with thyroid problem (%)
Medical Conditions - People with chronic bronchitis (%)
Medical Conditions - People with any liver condition (%)
Medical Conditions - People who ever had cancer or malignancy (%)
Mental Health - People who have little interest in doing things (%)
Mental Health - People feeling down, depressed, or hopeless (%)
Mental Health - People who have trouble sleeping or sleeping too much (%)
Mental Health - People feeling tired or having little energy (%)
Mental Health - People with poor appetite or overeating (%)
Mental Health - People feeling bad about themself (%)
Mental Health - People who have trouble concentrating on things (%)
Mental Health - People moving or speaking slowly or too fast (%)
Mental Health - People having thoughts they would be better off dead (%)
Oral Health - Average years since last visit a dentist
Oral Health - People embarrassed because of mouth (%)
Oral Health - People with gum disease (%)
Oral Health - General health of teeth and gums (%)
Oral Health - Average days a week using dental floss/device
Oral Health - Average days a week using mouthwash for dental problem
Oral Health - Average number of teeth
Pesticide Use - Households using pesticides to control insects (%)
Pesticide Use - Households using pesticides to kill weeds (%)
Physical Activity - People doing vigorous-intensity work activities (%)
Physical Activity - People doing moderate-intensity work activities (%)
Physical Activity - People walking or bicycling (%)
Physical Activity - People doing vigorous-intensity recreational activities (%)
Physical Activity - People doing moderate-intensity recreational activities (%)
Physical Activity - Average hours a day doing sedentary activities
Physical Activity - Average hours a day watching TV or videos
Physical Activity - Average hours a day using computer
Physical Functioning - People having limitations keeping them from working (%)
Physical Functioning - People limited in amount of work they can do (%)
Physical Functioning - People that need special equipment to walk (%)
Physical Functioning - People experiencing confusion/memory problems (%)
Physical Functioning - People requiring special healthcare equipment (%)
Prescription Medications - Average number of prescription medicines taking
Preventive Aspirin Use - Adults 40+ taking low-dose aspirin (%)
Reproductive Health - Vaginal deliveries (%)
Reproductive Health - Cesarean deliveries (%)
Reproductive Health - Deliveries resulted in a live birth (%)
Reproductive Health - Pregnancies resulted in a delivery (%)
Reproductive Health - Women breastfeeding newborns (%)
Reproductive Health - Women that had a hysterectomy (%)
Reproductive Health - Women that had both ovaries removed (%)
Reproductive Health - Women that have ever taken birth control pills (%)
Reproductive Health - Women taking birth control pills (%)
Reproductive Health - Women that have ever used Depo-Provera or injectables (%)
Reproductive Health - Women that have ever used female hormones (%)
Sexual Behavior - People 18+ that ever had sex (vaginal, anal, or oral) (%)
Sexual Behavior - Males 18+ that ever had vaginal sex with a woman (%)
Sexual Behavior - Males 18+ that ever performed oral sex on a woman (%)
Sexual Behavior - Males 18+ that ever had anal sex with a woman (%)
Sexual Behavior - Males 18+ that ever had any sex with a man (%)
Sexual Behavior - Females 18+ that ever had vaginal sex with a man (%)
Sexual Behavior - Females 18+ that ever performed oral sex on a man (%)
Sexual Behavior - Females 18+ that ever had anal sex with a man (%)
Sexual Behavior - Females 18+ that ever had any kind of sex with a woman (%)
Sexual Behavior - Average age people first had sex
Sexual Behavior - Average number of female sex partners in lifetime (males 18+)
Sexual Behavior - Average number of female vaginal sex partners in lifetime (males 18+)
Sexual Behavior - Average age people first performed oral sex on a woman (18+)
Sexual Behavior - Average number of woman performed oral sex on in lifetime (18+)
Sexual Behavior - Average number of male sex partners in lifetime (males 18+)
Sexual Behavior - Average number of male anal sex partners in lifetime (males 18+)
Sexual Behavior - Average age people first performed oral sex on a man (18+)
Sexual Behavior - Average number of male oral sex partners in lifetime (18+)
Sexual Behavior - People using protection when performing oral sex (%)
Sexual Behavior - Average number of times people have vaginal or anal sex a year
Sexual Behavior - People having sex without condom (%)
Sexual Behavior - Average number of male sex partners in lifetime (females 18+)
Sexual Behavior - Average number of male vaginal sex partners in lifetime (females 18+)
Sexual Behavior - Average number of female sex partners in lifetime (females 18+)
Sexual Behavior - Circumcised males 18+ (%)
Sleep Disorders - Average hours sleeping at night
Sleep Disorders - People that has trouble sleeping (%)
Smoking-Cigarette Use - People smoking cigarettes (%)
Taste & Smell - People 40+ having problems with smell (%)
Taste & Smell - People 40+ having problems with taste (%)
Taste & Smell - People 40+ that ever had wisdom teeth removed (%)
Taste & Smell - People 40+ that ever had tonsils teeth removed (%)
Taste & Smell - People 40+ that ever had a loss of consciousness because of a head injury (%)
Taste & Smell - People 40+ that ever had a broken nose or other serious injury to face or skull (%)
Taste & Smell - People 40+ that ever had two or more sinus infections (%)
Weight - Average height (inches)
Weight - Average weight (pounds)
Weight - Average BMI
Weight - People that are obese (%)
Weight - People that ever were obese (%)
Weight - People trying to lose weight (%)
Officers per 1,000 residents here:
0.56Illinois average:
2.78
Latest news from Robbins, IL collected exclusively by city-data.com from local newspapers, TV, and radio stations
Ancestries: Italian (2.3%).
Current Local Time:
Incorporated on 02/21/1918
Land area: 1.47 square miles.
Population density: 3,077 people per square mile (average).
218 residents are foreign born (3.7% Latin America , 0.5% Europe ).
This village:
4.6%Illinois:
14.1%
Median real estate property taxes paid for housing units with mortgages in 2022: $1,773 (1.6%)Median real estate property taxes paid for housing units with no mortgage in 2022: $1,696 (1.7%)
Nearest city with pop. 50,000+: Oak Lawn, IL
Nearest city with pop. 200,000+: Chicago, IL
Nearest cities:
Latitude: 41.64 N, Longitude: 87.71 W
Area code commonly used in this area: 708
Single-family new house construction building permits:
2022: 9 buildings , average cost: $130,3002021: 9 buildings , average cost: $130,3002020: 10 buildings , average cost: $130,3002019: 11 buildings , average cost: $130,3002018: 12 buildings , average cost: $130,3002017: 12 buildings , average cost: $130,3002016: 13 buildings , average cost: $130,3002015: 11 buildings , average cost: $130,3002014: 11 buildings , average cost: $130,3002013: 14 buildings , average cost: $130,3002012: 12 buildings , average cost: $130,3002011: 11 buildings , average cost: $130,3002010: 12 buildings , average cost: $130,5002009: 11 buildings , average cost: $129,4002008: 11 buildings , average cost: $132,5002007: 23 buildings , average cost: $121,1002006: 24 buildings , average cost: $183,9002005: 4 buildings , average cost: $102,5002004: 4 buildings , average cost: $102,5002003: 4 buildings , average cost: $102,5002002: 4 buildings , average cost: $102,5002001: 1 building , cost: $140,000Unemployment in December 2023:
Most common occupations in Robbins, IL (%)
Both Males Females
Nursing, psychiatric, and home health aides (6.4%)
Cashiers (4.9%)
Building and grounds cleaning and maintenance occupations (4.7%)
Material recording, scheduling, dispatching, and distributing workers (4.2%)
Other production occupations, including supervisors (3.5%)
Counselors, social workers, and other community and social service specialists (3.5%)
Other office and administrative support workers, including supervisors (3.2%)
Building and grounds cleaning and maintenance occupations (8.0%)
Driver/sales workers and truck drivers (7.6%)
Other material moving workers, except laborers (5.5%)
Material recording, scheduling, dispatching, and distributing workers (5.5%)
Electrical equipment mechanics and other installation, maintenance, and repair workers, including supervisors (5.2%)
Vehicle and mobile equipment mechanics, installers, and repairers (5.2%)
Other production occupations, including supervisors (4.7%)
Nursing, psychiatric, and home health aides (10.0%)
Cashiers (6.5%)
Other office and administrative support workers, including supervisors (5.2%)
Supervisors and other personal care and service workers, except child care workers (5.2%)
Counselors, social workers, and other community and social service specialists (4.6%)
Customer service representatives (4.1%)
Cooks and food preparation workers (3.6%)
Tornado activity:
Robbins-area historical tornado activity is near Illinois state average. It is 56% greater than the overall U.S. average.
On 8/28/1990, a category F5 (max. wind speeds 261-318 mph) tornado 22.0 miles away from the Robbins village center killed 29 people and injured 350 people and caused between $50,000 and $500,000 in damages.
On 4/21/1967, a category F4 (max. wind speeds 207-260 mph) tornado 6.6 miles away from the village center killed 33 people and injured 500 people and caused between $5,000,000 and $50,000,000 in damages.
Earthquake activity:
Robbins-area historical earthquake activity is significantly above Illinois state average. It is 43% greater than the overall U.S. average. On 4/18/2008 at 09:36:59, a magnitude 5.4 (5.1 MB, 4.8 MS, 5.4 MW, 5.2 MW, Class: Moderate, Intensity: VI - VII) earthquake occurred 220.9 miles away from the city center On 6/10/1987 at 23:48:54, a magnitude 5.1 (4.9 MB, 4.4 MS, 4.6 MS, 5.1 LG) earthquake occurred 195.4 miles away from the city center On 4/18/2008 at 09:36:59, a magnitude 5.2 (5.2 MW, Depth: 8.9 mi) earthquake occurred 220.9 miles away from Robbins center On 6/28/2004 at 06:10:52, a magnitude 4.2 (4.2 MW, Depth: 6.2 mi, Class: Light, Intensity: IV - V) earthquake occurred 63.0 miles away from Robbins center On 6/18/2002 at 17:37:15, a magnitude 5.0 (4.3 MB, 4.6 MW, 5.0 LG) earthquake occurred 252.9 miles away from Robbins center On 4/18/2008 at 15:14:16, a magnitude 4.8 (4.5 MB, 4.8 MW, 4.6 MW) earthquake occurred 219.2 miles away from the city center Magnitude types: regional Lg-wave magnitude (LG), body-wave magnitude (MB), surface-wave magnitude (MS), moment magnitude (MW) Natural disasters: The number of natural disasters in Cook County (20) is greater than the US average (15).Major Disasters (Presidential) Declared: 15Emergencies Declared: 4Floods: 13, Storms: 12, Tornadoes: 3, Snowstorms: 2, Winter Storms: 2, Blizzard: 1, Hurricane: 1, Snow: 1, Wind: 1, Other: 1 (Note: some incidents may be assigned to more than one category). Hospitals and medical centers in Robbins: LYDIA HEALTHCARE (13901 SOUTH LYDIA)
Other hospitals and medical centers near Robbins: ACE HEALTH CARE SERVICES, LLC (Home Health Center, about 2 miles away; MIDLOTHIAN, IL)
PLAZA NURSING AND REHAB CTR (Nursing Home, about 2 miles away; MIDLOTHIAN, IL)
FIRST HOME HEALTH CARE SERVICES, LLC (Home Health Center, about 2 miles away; MIDLOTHIAN, IL)
DIRECT DIALYSIS (Dialysis Facility, about 2 miles away; CRESTWOOD, IL)
SYMPHONY OF CRESTWOOD (Nursing Home, about 2 miles away; CRESTWOOD, IL)
PARK LAWN HOME (Hospital, about 2 miles away; ALSIP, IL)
FMC - CRESTWOOD (Dialysis Facility, about 2 miles away; CRESTWOOD, IL)
Amtrak stations near Robbins: 6 miles: HOMEWOOD (181 1ST ST. & PARK AVE.) Services: ticket office, enclosed waiting area, public restrooms, public payphones, paid short-term parking, paid long-term parking, public transit connection.
11 miles: HAMMOND-WHITING (HAMMOND, 1135 CALUMET AVE.) Services: ticket office, partially wheelchair accessible, enclosed waiting area, public restrooms, public payphones, free short-term parking, free long-term parking, call for taxi service.
12 miles: SUMMIT (ARCHER & CENTER AVE.) Services: public payphones, free short-term parking, free long-term parking, call for taxi service, public transit connection.
Colleges/universities with over 2000 students nearest to Robbins:
Saint Xavier University (about 5 miles; Chicago, IL ; Full-time enrollment: 3,576)
South Suburban College (about 6 miles; South Holland, IL ; FT enrollment: 3,972)
Chicago State University (about 8 miles; Chicago, IL ; FT enrollment: 4,352)
Moraine Valley Community College (about 8 miles; Palos Hills, IL ; FT enrollment: 12,008)
City Colleges of Chicago-Olive-Harvey College (about 8 miles; Chicago, IL ; FT enrollment: 4,110)
City Colleges of Chicago-Richard J Daley College (about 8 miles; Chicago, IL ; FT enrollment: 7,497)
Prairie State College (about 9 miles; Chicago Heights, IL ; FT enrollment: 4,050)
Public high school in Robbins: DELTA LEARNING CENTER Location: 3940 W MIDLOTHIAN TPKE, Grades: 9-12)
Public elementary/middle schools in Robbins:
See full list of schools located in Robbins Library in Robbins: WILLIAM LEONARD PUBLIC LIBRARY DISTRICT Operating income: $237,865; Location: 13820 CENTRAL PARK AVENUE; 28,294 books ; 135 audio materials ; 1,392 video materials ; 1 local licensed databases ; 62 print serial subscriptions ; 62 electronic serial subscriptions )
Notable locations in Robbins: (A) , Community Economic Development Association (B) , William Leonard Public Library (C) , Robbins Fire Department (D) . Display/hide their locations on the map
Churches in Robbins include: (A) , Christ Temple Church of Robbins (B) , Gods House of Love Prayer (C) , Great Hope Baptist Church (D) , Mount Calvary Missionary Baptist Church (E) , New Friendship Baptist Church (F) , One Hundred Thirtyninth Street House of God (G) , Robbins Church of Christ (H) , Robbins Church of God in Christ (I) . Display/hide their locations on the map
Park in Robbins: (1) . Display/hide its location on the map
Birthplace of: Nichelle Nichols - Actress, Joe Montgomery - Football player.
Cook County has a predicted average indoor radon screening level between 2 and 4 pCi/L (pico curies per liter) - Moderate Potential Average household size: This village:
2.8 peopleIllinois:
2.6 people
Percentage of family households: This village:
64.5%Whole state:
65.8%
Percentage of households with unmarried partners: This village:
6.0%Whole state:
6.3%
Likely homosexual households (counted as self-reported same-sex unmarried-partner households)
Lesbian couples: 0.2% of all households Gay men: 0.2% of all households
401 people in mental (psychiatric) hospitals and psychiatric units in other hospitals in 2010people in other nonhousehold living situations in 2000people in other noninstitutional group quarters in 2000
For population 15 years and over in Robbins:
Never married: 55.1%Now married: 31.3%Separated: 3.5%Widowed: 3.3%Divorced: 6.7% For population 25 years and over in Robbins:
High school or higher: 81.5%Bachelor's degree or higher: 12.0%Graduate or professional degree: 4.3%Unemployed: 22.9%Mean travel time to work (commute): 19.6 minutes
Education Gini index (Inequality in education) Here:
11.1Illinois average:
12.5
Religion statistics for Robbins, IL (based on Cook County data)
Religion Adherents Congregations Catholic 1,947,223 376 Evangelical Protestant 432,975 1,484 Other 312,636 403 Mainline Protestant 202,114 630 Black Protestant 148,895 395 Orthodox 53,276 66 None 2,097,556 -
Source: Clifford Grammich, Kirk Hadaway, Richard Houseal, Dale E.Jones, Alexei Krindatch, Richie Stanley and Richard H.Taylor. 2012. 2010 U.S.Religion Census: Religious Congregations & Membership Study. Association of Statisticians of American Religious Bodies. Jones, Dale E., et al. 2002. Congregations and Membership in the United States 2000. Nashville, TN: Glenmary Research Center. Graphs represent county-level data
Food Environment Statistics: Number of grocery stores : 1,460Cook County :
2.77 / 10,000 pop.State :
2.24 / 10,000 pop.
Number of supercenters and club stores : 23Cook County :
0.04 / 10,000 pop.Illinois :
0.08 / 10,000 pop.
Number of convenience stores (no gas) : 490Cook County :
0.93 / 10,000 pop.Illinois :
0.75 / 10,000 pop.
Number of convenience stores (with gas) : 806Here :
1.53 / 10,000 pop.Illinois :
2.61 / 10,000 pop.
Number of full-service restaurants : 3,516Here :
6.67 / 10,000 pop.Illinois :
6.86 / 10,000 pop.
Adult diabetes rate : Cook County :
8.4%Illinois :
8.3%
Adult obesity rate : Cook County :
23.5%Illinois :
25.2%
Low-income preschool obesity rate : Cook County :
16.3%Illinois :
14.5%
Health and Nutrition: Healthy diet rate : Robbins:
48.3%Illinois:
49.5%
Average overall health of teeth and gums : This city:
44.9%State:
47.2%
Average BMI : This city:
30.2Illinois:
28.6
People feeling badly about themselves : Robbins:
17.1%Illinois:
20.5%
People not drinking alcohol at all : This city:
14.3%State:
10.8%
Average hours sleeping at night : Overweight people : This city:
36.4%Illinois:
33.4%
General health condition : Robbins:
53.1%Illinois:
56.4%
Average condition of hearing : More about Health and Nutrition of Robbins, IL Residents
Local government employment and payroll (March 2022)
Function
Full-time employees
Monthly full-time payroll
Average yearly full-time wage
Part-time employees
Monthly part-time payroll
Police Protection - Officers
33 $61,399 $22,327 0 $0 Firefighters
14 $31,405 $26,919 0 $0 Other Government Administration
7 $17,867 $30,629 8 $9,642 Streets and Highways
4 $22,156 $66,468 0 $0 Water Supply
2 $5,008 $30,048 0 $0 Financial Administration
1 $4,650 $55,800 2 $5,587 Police - Other
1 $2,817 $33,804 0 $0
Totals for Government
62 $145,302 $28,123 10 $15,228
Robbins government finances - Expenditure in 2017 (per resident):
Current Operations - General - Other: $2,328,000 ($514.93)
Central Staff Services: $1,414,000 ($312.76)Regular Highways: $344,000 ($76.09)General - Interest on Debt: $499,000 ($110.37)
Total Salaries and Wages: $1,514,000 ($334.88)
Robbins government finances - Revenue in 2017 (per resident):
Charges - Sewerage: $353,000 ($78.08)
Miscellaneous - General Revenue - Other: $867,000 ($191.77)
Fines and Forfeits: $130,000 ($28.75)Revenue - Water Utilities: $948,000 ($209.69)
State Intergovernmental - General Local Government Support: $822,000 ($181.82)
Highways: $220,000 ($48.66)Other: $148,000 ($32.74)Tax - Property: $1,067,000 ($236.01)
Other License: $76,000 ($16.81)
Robbins government finances - Debt in 2017 (per resident):
Long Term Debt - Outstanding Unspecified Public Purpose: $18,659,000 ($4127.18)
Beginning Outstanding - Unspecified Public Purpose: $12,476,000 ($2759.57)Issue, Unspecified Public Purpose: $6,415,000 ($1418.93)Retired Unspecified Public Purpose: $233,000 ($51.54)
Robbins government finances - Cash and Securities in 2017 (per resident):
Bond Funds - Cash and Securities: $6,182,000 ($1367.40)
Other Funds - Cash and Securities: $1,267,000 ($280.25)
3.53% of this county's 2021 resident taxpayers lived in other counties in 2020 ($82,405 average adjusted gross income )
Here:
3.53%Illinois average:
5.09%
0.01% of residents moved from foreign countries ($114 average AGI )Cook County:
0.01%Illinois average:
0.01%
Top counties from which taxpayers relocated into this county between 2020 and 2021:
5.44% of this county's 2020 resident taxpayers moved to other counties in 2021 ($120,340 average adjusted gross income )
Here:
5.44%Illinois average:
6.10%
0.01% of residents moved to foreign countries ($140 average AGI )Cook County:
0.01%Illinois average:
0.01%
Top counties to which taxpayers relocated from this county between 2020 and 2021: Strongest AM radio stations in Robbins:
WVIV (1200 AM; 20 kW; CHICAGO, IL; Owner: WLXX-AM LICENSE CORP.)
WLS (890 AM; 50 kW; CHICAGO, IL; Owner: WLS, INC.)
WRDZ (1300 AM; 4 kW; LA GRANGE, IL; Owner: ABC, INC.)
WNWI (1080 AM; 3 kW; OAK LAWN, IL; Owner: BIRACH BROADCASTING CORPORATION)
WYLL (1160 AM; 50 kW; CHICAGO, IL; Owner: SCA LICENSE CORPORATION)
WMVP (1000 AM; 50 kW; CHICAGO, IL; Owner: ABC, INC.)
WSCR (670 AM; 50 kW; CHICAGO, IL; Owner: INFINITY BROADCASTING OPERATIONS, INC.)
WGCI (1390 AM; 5 kW; CHICAGO, IL; Owner: AMFM RADIO LICENSES, L.L.C.)
WNTD (950 AM; 5 kW; CHICAGO, IL; Owner: RADIO UNICA OF CHICAGO LICENSE CORP.)
WBBM (780 AM; 50 kW; CHICAGO, IL; Owner: INFINITY BROADCASTING OPERATIONS, INC.)
WGN (720 AM; 50 kW; CHICAGO, IL; Owner: WGN CONTINENTAL BROADCASTING CO.)
WBEE (1570 AM; 1 kW; HARVEY, IL)
WIND (560 AM; 5 kW; CHICAGO, IL; Owner: TICHENOR LICENSE CORPORATION ("TLC"))
Strongest FM radio stations in Robbins:
WCKG (105.9 FM; ELMWOOD PARK, IL; Owner: INFINITY HOLDINGS CORPORATION OF ORLANDO)
WLIT-FM (93.9 FM; CHICAGO, IL; Owner: AMFM RADIO LICENSES, L.L.C.)
WJMK (104.3 FM; CHICAGO, IL; Owner: INFINITY BROADCASTING CORP. OF ILLINOIS)
WNUA (95.5 FM; CHICAGO, IL; Owner: AMFM RADIO LICENSES, L.L.C.)
WTMX (101.9 FM; SKOKIE, IL; Owner: BONNEVILLE HOLDING COMPANY)
WBBM-FM (96.3 FM; CHICAGO, IL; Owner: INFINITY BROADCASTING OPERATIONS, INC.)
WKSC-FM (103.5 FM; CHICAGO, IL; Owner: AMFM RADIO LICENSES, L.L.C.)
WFMT (98.7 FM; CHICAGO, IL; Owner: WINDOW TO THE WORLD COMMUNICATIONS)
WZZN (94.7 FM; CHICAGO, IL; Owner: ABC CHICAGO FM RADIO,INC.)
WGCI-FM (107.5 FM; CHICAGO, IL; Owner: AMFM RADIO LICENSES, L.L.C.)
WDRV (97.1 FM; CHICAGO, IL; Owner: BONNEVILLE HOLDING COMPANY)
WBEZ (91.5 FM; CHICAGO, IL; Owner: THE WBEZ ALLIANCE, INC.)
WKQX (101.1 FM; CHICAGO, IL; Owner: EMMIS RADIO LICENSE CORPORATION)
WLUP-FM (97.9 FM; CHICAGO, IL; Owner: BONNEVILLE HOLDING COMPANY)
WNND (100.3 FM; CHICAGO, IL; Owner: BONNEVILLE HOLDING COMPANY)
WOJO (105.1 FM; EVANSTON, IL; Owner: TICHENOR LICENSE CORPORATION ("TLC"))
WUSN (99.5 FM; CHICAGO, IL; Owner: INFINITY BROADCASTING CORPORATION OF CHICAGO)
WVAZ (102.7 FM; OAK PARK, IL; Owner: AMFM RADIO LICENSES, L.L.C.)
WXRT-FM (93.1 FM; CHICAGO, IL; Owner: INFINITY BROADCASTING OPERATIONS, INC.)
WPWX (92.3 FM; HAMMOND, IN; Owner: DONTRON, INC.)
TV broadcast stations around Robbins:
WLS-TV (Channel 7; CHICAGO, IL; Owner: WLS TELEVISION, INC.)
WMAQ-TV (Channel 5; CHICAGO, IL; Owner: NBC SUBSIDIARY (WMAQ-TV), INC.)
WTTW (Channel 11; CHICAGO, IL; Owner: WINDOW TO THE WORLD COMMUNICATIONS, INC.)
WGN-TV (Channel 9; CHICAGO, IL; Owner: WGN CONTINENTAL BROADCASTING COMPANY)
WGBO-TV (Channel 66; JOLIET, IL; Owner: WGBO LICENSE PARTNERSHIP, G.P.)
WBBM-TV (Channel 2; CHICAGO, IL; Owner: CBS BROADCASTING INC.)
WPWR-TV (Channel 50; GARY, IN; Owner: FOX TELEVISION STATIONS, INC.)
WXFT (Channel 60; AURORA, IL; Owner: TELEFUTURA CHICAGO LLC)
WCIU-TV (Channel 26; CHICAGO, IL; Owner: WCIU-TV LIMITED PARTNERSHIP)
WCPX (Channel 38; CHICAGO, IL; Owner: PAXSON CHICAGO LICENSE, INC.)
WFLD (Channel 32; CHICAGO, IL; Owner: FOX TELEVISION STATIONS, INC.)
W68DO (Channel 68; PALATINE, IL; Owner: TRINITY BROADCASTING NETWORK)
WFBT-CA (Channel 23; CHICAGO, IL; Owner: CHANNEL 23 LIMITED PARTNERSHIP)
WJYS (Channel 62; HAMMOND, IN; Owner: JOVON BROADCASTING CORPORATION)
WSNS-TV (Channel 44; CHICAGO, IL; Owner: TELEMUNDO OF CHICAGO, INC.)
WOCH-LP (Channel 28; CHICAGO, IL; Owner: KM LPTV OF CHICAGO-28, L.L.C.)
WYCC (Channel 20; CHICAGO, IL; Owner: COLLEGE DIST. #508, COUNTY OF COOK)
WOCK-CA (Channel 13; CHICAGO, IL; Owner: KM LPTV OF CHICAGO-13, L.L.C.)
WYIN (Channel 56; GARY, IN; Owner: NORTHWEST INDIANA PUBLIC BROADCASTING, INC.)
W54AP (Channel 54; BLUE ISLAND, IL; Owner: CATHOLIC VIEWS BROADCASTS, INC.)
W34CK (Channel 34; ARLINGTON HEIGHTS, IL; Owner: FIRST UNITED, INC.)
W64CQ (Channel 64; ARLINGTON HEIGHTS, IL; Owner: TRINITY BROADCASTING NETWORK)
National Bridge Inventory (NBI) Statistics 16 Number of bridges394ft / 120m Total length $3,902,000 Total costs570,800 Total average daily traffic83,197 Total average daily truck traffic
New bridges - historical statistics
1 1930-1939 12 1950-1959 1 1960-1969 2 1980-1989
See full National Bridge Inventory statistics for Robbins, IL
FCC Registered Antenna Towers: 8 (
See the full list of FCC Registered Antenna Towers in Robbins )
FCC Registered Broadcast Land Mobile Towers: 2
WS 9001-018.770, Eb App To Robbins (Lat: 41.622000 Lon: -87.717333), Type: Building, Structure height: 3.5 m, Overall height: 6.5 m, Call Sign: WQHS396, Assigned Frequencies: 44.4800 MHz, Grant Date: 10/23/2007, Expiration Date: 10/23/2017, Cancellation Date: 05/11/2016, Certifier: Bruce M Marcheschi, Registrant: Northeast Illinois Regional Commuter Railroad Corporation, 547 West Jackson Boulevard, Chicago, IL 60661, Phone: (312) 322-8267, Fax: (312) 322-6919, Email:
WS 9002-015.600, Wb App To Cp 15.6 (Lat: 41.638583 Lon: -87.697139), Type: Building, Structure height: 3.5 m, Overall height: 5.1 m, Call Sign: WQII709, Assigned Frequencies: 44.4800 MHz, Grant Date: 02/21/2008, Expiration Date: 02/21/2018, Cancellation Date: 05/11/2016, Certifier: Bruce M Marcheschi, Registrant: Northeast Illinois Regional Commuter Railroad Corporation, 547 West Jackson Boulevard, Chicago, IL 60661, Phone: (312) 322-8267, Fax: (312) 322-6919, Email:
FCC Registered Microwave Towers: 5
Crestwood, Lincoln & 134th (Lat: 41.650556 Lon: -87.726111), Type: Tower, Structure height: 45 m, Overall height: 55 m, Call Sign: WQCB618, Licensee ID: L00901399, Assigned Frequencies: 18015.0 MHz, 18015.0 MHz, 18015.0 MHz, 18115.0 MHz, 18115.0 MHz, 18115.0 MHz, Grant Date: 02/24/2015, Expiration Date: 01/25/2025, Certifier: Edmund G Urban Iii, Registrant: Urbancom.Net Wireless LLC Crestwood 180, Lat: 41.650556 Lon: -87.726111, Type: Tower, Structure height: 54.8 m, Overall height: 60.3 m, Call Sign: WQIC636, Assigned Frequencies: 3650.00 MHz, Grant Date: 04/20/2018, Expiration Date: 10/17/2020, Cancellation Date: 12/19/2020, Certifier: Edmund G Urban Iii, Registrant: Urbancom.Net Wireless LLC, 5320 W 159th Street, Oak Forest, IL 60452, Phone: (708) 687-2090, Fax: (708) 687-8786, Email:
Crestwood 60, Lat: 41.650556 Lon: -87.726111, Type: Tower, Structure height: 54.8 m, Overall height: 60.3 m, Call Sign: WQIC636, Assigned Frequencies: 3650.00 MHz, Grant Date: 04/20/2018, Expiration Date: 10/17/2020, Cancellation Date: 12/19/2020, Certifier: Edmund G Urban Iii, Registrant: Urbancom.Net Wireless LLC, 5320 W 159th Street, Oak Forest, IL 60452, Phone: (708) 687-2090, Fax: (708) 687-8786, Email:
Crestwood 300, Lat: 41.650556 Lon: -87.726111, Type: Tower, Structure height: 54.8 m, Overall height: 60.3 m, Call Sign: WQIC636, Assigned Frequencies: 3650.00 MHz, Grant Date: 04/20/2018, Expiration Date: 10/17/2020, Cancellation Date: 12/19/2020, Certifier: Edmund G Urban Iii, Registrant: Urbancom.Net Wireless LLC, 5320 W 159th Street, Oak Forest, IL 60452, Phone: (708) 687-2090, Fax: (708) 687-8786, Email:
Crestwood, 4314 Lincoln Ave (Lat: 41.650556 Lon: -87.726111), Type: Tower, Structure height: 54.8 m, Overall height: 60.3 m, Call Sign: WQIU880, Assigned Frequencies: 11585.0 MHz, 11665.0 MHz, 11585.0 MHz, 11665.0 MHz, 11585.0 MHz, 11665.0 MHz, 11585.0 MHz, 11665.0 MHz, 11585.0 MHz, 11665.0 MHz... (+9 more), Grant Date: 05/15/2018, Expiration Date: 05/20/2028, Certifier: Edmund G Urban Iii, Registrant: Micronet Communications, Inc., 812 Lexington Dr, Plano, TX 75075, Phone: (972) 422-7200, Email:
FCC Registered Amateur Radio Licenses: 3
Call Sign: KA9FRM, Licensee ID: L00257344, Grant Date: 07/09/2014, Expiration Date: 08/08/2024, Certifier: Charles Wilson, Registrant: Charles Wilson, 14009 Grace St, Robbins, IL 60472-2252Call Sign: KB9SRT, Licensee ID: L00834852, Grant Date: 04/28/1998, Expiration Date: 04/28/2008, Cancellation Date: 04/29/2010, Certifier: Montague C Jackson, Registrant: Montague C Jackson, 13422 Springfield, Robbins, IL 60472Call Sign: KD9BIS, Licensee ID: L01867975, Grant Date: 05/21/2014, Expiration Date: 05/21/2024, Certifier: Marvin Jamerson Sr, Registrant: Marvin Jamerson Sr, Robbins, IL 60472
Home Mortgage Disclosure Act Aggregated Statistics For Year 2009(Based on 3 partial tracts) A) FHA, FSA/RHS & VA B) Conventional C) Refinancings D) Home Improvement Loans E) Loans on Dwellings For 5+ Families F) Non-occupant Loans on Number Average Value Number Average Value Number Average Value Number Average Value Number Average Value Number Average Value
LOANS ORIGINATED 6 $123,945 1 $71,850 22 $157,076 6 $15,382 0 $0 2 $193,495 APPLICATIONS APPROVED, NOT ACCEPTED 1 $49,310 0 $0 10 $129,310 1 $4,090 1 $120,430 1 $57,440 APPLICATIONS DENIED 6 $133,298 3 $109,607 23 $115,599 8 $19,289 0 $0 7 $131,931 APPLICATIONS WITHDRAWN 2 $93,260 0 $0 8 $167,466 0 $0 0 $0 2 $216,120 FILES CLOSED FOR INCOMPLETENESS 2 $94,830 1 $156,250 3 $110,463 1 $14,180 0 $0 1 $156,250
Aggregated Statistics For Year 2008(Based on 3 partial tracts) A) FHA, FSA/RHS & VA B) Conventional C) Refinancings D) Home Improvement Loans F) Non-occupant Loans on Number Average Value Number Average Value Number Average Value Number Average Value Number Average Value
LOANS ORIGINATED 10 $151,693 8 $144,569 28 $117,305 5 $41,418 4 $75,070 APPLICATIONS APPROVED, NOT ACCEPTED 0 $0 1 $193,930 6 $75,585 4 $28,392 1 $158,720 APPLICATIONS DENIED 5 $135,068 4 $142,235 46 $122,533 13 $58,806 6 $69,962 APPLICATIONS WITHDRAWN 1 $119,200 3 $116,313 9 $165,817 0 $0 3 $43,297 FILES CLOSED FOR INCOMPLETENESS 1 $115,490 1 $53,110 4 $91,535 1 $6,180 1 $81,520
Aggregated Statistics For Year 2007(Based on 3 partial tracts) A) FHA, FSA/RHS & VA B) Conventional C) Refinancings D) Home Improvement Loans F) Non-occupant Loans on G) Loans On Manufactured Number Average Value Number Average Value Number Average Value Number Average Value Number Average Value Number Average Value
LOANS ORIGINATED 3 $229,337 28 $125,609 51 $112,535 8 $43,370 18 $97,691 0 $0 APPLICATIONS APPROVED, NOT ACCEPTED 0 $0 6 $94,595 12 $95,563 2 $37,095 3 $71,167 0 $0 APPLICATIONS DENIED 1 $71,110 16 $123,659 64 $112,748 30 $47,909 16 $69,478 1 $1,850 APPLICATIONS WITHDRAWN 1 $125,990 5 $133,016 21 $97,992 2 $139,330 4 $88,635 0 $0 FILES CLOSED FOR INCOMPLETENESS 0 $0 3 $147,877 11 $119,150 1 $39,770 2 $71,025 0 $0
Aggregated Statistics For Year 2006(Based on 3 partial tracts) A) FHA, FSA/RHS & VA B) Conventional C) Refinancings D) Home Improvement Loans E) Loans on Dwellings For 5+ Families F) Non-occupant Loans on G) Loans On Manufactured Number Average Value Number Average Value Number Average Value Number Average Value Number Average Value Number Average Value Number Average Value
LOANS ORIGINATED 5 $152,482 51 $95,662 89 $98,498 8 $43,131 0 $0 21 $70,093 0 $0 APPLICATIONS APPROVED, NOT ACCEPTED 1 $95,730 11 $79,246 22 $102,336 3 $30,340 1 $51,930 3 $99,213 0 $0 APPLICATIONS DENIED 0 $0 38 $75,616 81 $94,285 22 $25,428 0 $0 27 $59,954 1 $6,030 APPLICATIONS WITHDRAWN 1 $111,170 17 $90,455 32 $104,166 3 $99,423 0 $0 10 $78,550 0 $0 FILES CLOSED FOR INCOMPLETENESS 0 $0 2 $118,915 12 $106,502 1 $28,970 0 $0 4 $59,012 0 $0
Aggregated Statistics For Year 2005(Based on 3 partial tracts) A) FHA, FSA/RHS & VA B) Conventional C) Refinancings D) Home Improvement Loans E) Loans on Dwellings For 5+ Families F) Non-occupant Loans on Number Average Value Number Average Value Number Average Value Number Average Value Number Average Value Number Average Value
LOANS ORIGINATED 3 $151,393 55 $89,881 79 $105,924 10 $36,014 1 $179,030 23 $63,173 APPLICATIONS APPROVED, NOT ACCEPTED 3 $191,867 13 $77,748 23 $91,135 2 $15,895 1 $62,380 6 $68,558 APPLICATIONS DENIED 1 $120,200 38 $74,728 92 $90,727 19 $43,641 0 $0 14 $60,326 APPLICATIONS WITHDRAWN 1 $71,860 9 $74,488 44 $104,342 4 $103,818 0 $0 12 $61,685 FILES CLOSED FOR INCOMPLETENESS 0 $0 5 $67,274 14 $96,584 0 $0 0 $0 1 $50,600
Aggregated Statistics For Year 2004(Based on 3 partial tracts) A) FHA, FSA/RHS & VA B) Conventional C) Refinancings D) Home Improvement Loans F) Non-occupant Loans on Number Average Value Number Average Value Number Average Value Number Average Value Number Average Value
LOANS ORIGINATED 5 $172,226 40 $78,430 72 $85,498 8 $47,758 21 $56,738 APPLICATIONS APPROVED, NOT ACCEPTED 1 $107,730 18 $69,816 19 $103,146 2 $24,325 8 $58,494 APPLICATIONS DENIED 1 $35,200 21 $77,056 105 $87,997 18 $49,349 12 $60,280 APPLICATIONS WITHDRAWN 1 $200,690 8 $80,405 34 $106,486 3 $34,760 5 $69,170 FILES CLOSED FOR INCOMPLETENESS 0 $0 1 $102,990 8 $112,024 0 $0 1 $65,280
Aggregated Statistics For Year 2003(Based on 3 partial tracts) A) FHA, FSA/RHS & VA B) Conventional C) Refinancings D) Home Improvement Loans E) Loans on Dwellings For 5+ Families F) Non-occupant Loans on Number Average Value Number Average Value Number Average Value Number Average Value Number Average Value Number Average Value
LOANS ORIGINATED 15 $141,917 18 $98,872 79 $96,561 3 $14,517 1 $323,600 8 $48,266 APPLICATIONS APPROVED, NOT ACCEPTED 0 $0 10 $75,405 22 $89,094 2 $8,645 1 $69,050 4 $58,062 APPLICATIONS DENIED 1 $159,060 13 $76,344 80 $83,243 9 $14,469 0 $0 7 $67,076 APPLICATIONS WITHDRAWN 3 $137,313 6 $84,920 38 $94,378 3 $52,497 0 $0 4 $49,370 FILES CLOSED FOR INCOMPLETENESS 1 $122,280 1 $23,470 6 $115,245 0 $0 0 $0 0 $0
Aggregated Statistics For Year 2002(Based on 3 partial tracts) A) FHA, FSA/RHS & VA B) Conventional C) Refinancings D) Home Improvement Loans E) Loans on Dwellings For 5+ Families F) Non-occupant Loans on Number Average Value Number Average Value Number Average Value Number Average Value Number Average Value Number Average Value
LOANS ORIGINATED 26 $133,400 15 $80,388 54 $76,356 11 $16,767 1 $189,820 10 $53,430 APPLICATIONS APPROVED, NOT ACCEPTED 0 $0 6 $61,448 14 $68,414 1 $9,510 1 $44,150 6 $46,448 APPLICATIONS DENIED 3 $128,490 17 $64,211 46 $70,129 13 $13,088 0 $0 8 $61,774 APPLICATIONS WITHDRAWN 1 $17,910 5 $48,588 31 $71,380 2 $27,485 0 $0 2 $46,650 FILES CLOSED FOR INCOMPLETENESS 1 $100,050 2 $38,425 11 $70,607 0 $0 0 $0 2 $71,335
Aggregated Statistics For Year 2001(Based on 3 partial tracts) A) FHA, FSA/RHS & VA B) Conventional C) Refinancings D) Home Improvement Loans E) Loans on Dwellings For 5+ Families F) Non-occupant Loans on Number Average Value Number Average Value Number Average Value Number Average Value Number Average Value Number Average Value
LOANS ORIGINATED 13 $117,815 22 $66,343 51 $65,998 8 $22,595 1 $91,530 10 $46,755 APPLICATIONS APPROVED, NOT ACCEPTED 0 $0 6 $67,377 13 $66,866 7 $20,140 1 $50,030 4 $35,298 APPLICATIONS DENIED 3 $77,593 12 $87,331 74 $58,252 16 $24,169 0 $0 10 $46,020 APPLICATIONS WITHDRAWN 1 $81,520 6 $62,783 24 $65,992 1 $91,890 0 $0 1 $24,700 FILES CLOSED FOR INCOMPLETENESS 0 $0 1 $51,490 7 $70,674 1 $45,700 0 $0 1 $53,730
Aggregated Statistics For Year 2000(Based on 3 partial tracts) A) FHA, FSA/RHS & VA B) Conventional C) Refinancings D) Home Improvement Loans F) Non-occupant Loans on Number Average Value Number Average Value Number Average Value Number Average Value Number Average Value
LOANS ORIGINATED 8 $102,209 23 $62,829 47 $54,743 13 $15,168 8 $36,424 APPLICATIONS APPROVED, NOT ACCEPTED 1 $30,030 11 $56,403 14 $43,519 5 $13,708 4 $39,150 APPLICATIONS DENIED 1 $101,360 15 $51,438 58 $59,607 19 $18,792 6 $41,287 APPLICATIONS WITHDRAWN 1 $147,540 5 $63,902 33 $49,878 3 $10,233 4 $32,425 FILES CLOSED FOR INCOMPLETENESS 1 $62,380 1 $60,590 20 $57,793 0 $0 1 $56,010
Aggregated Statistics For Year 1999(Based on 3 partial tracts) A) FHA, FSA/RHS & VA B) Conventional C) Refinancings D) Home Improvement Loans F) Non-occupant Loans on Number Average Value Number Average Value Number Average Value Number Average Value Number Average Value
LOANS ORIGINATED 9 $68,919 16 $59,527 62 $57,148 23 $12,572 6 $38,128 APPLICATIONS APPROVED, NOT ACCEPTED 1 $13,400 7 $63,907 25 $53,278 8 $18,014 3 $43,153 APPLICATIONS DENIED 1 $131,360 16 $58,200 67 $48,799 33 $13,075 11 $36,961 APPLICATIONS WITHDRAWN 1 $90,150 7 $61,427 32 $53,788 5 $25,546 5 $56,234 FILES CLOSED FOR INCOMPLETENESS 1 $37,590 0 $0 15 $63,091 1 $10,480 2 $80,190
Detailed HMDA statistics for the following Tracts:
8236.03
, 8243.00 , 8244.00
Private Mortgage Insurance Companies Aggregated Statistics For Year 2009(Based on 2 partial tracts) A) Conventional C) Non-occupant Loans on Number Average Value Number Average Value
LOANS ORIGINATED 0 $0 0 $0 APPLICATIONS APPROVED, NOT ACCEPTED 1 $57,440 1 $57,440 APPLICATIONS DENIED 0 $0 0 $0 APPLICATIONS WITHDRAWN 0 $0 0 $0 FILES CLOSED FOR INCOMPLETENESS 0 $0 0 $0
Aggregated Statistics For Year 2008(Based on 3 partial tracts) A) Conventional B) Refinancings C) Non-occupant Loans on Number Average Value Number Average Value Number Average Value
LOANS ORIGINATED 8 $139,129 2 $138,775 1 $85,850 APPLICATIONS APPROVED, NOT ACCEPTED 4 $150,850 6 $132,475 2 $78,435 APPLICATIONS DENIED 3 $183,403 1 $247,040 1 $111,170 APPLICATIONS WITHDRAWN 1 $66,700 2 $163,045 1 $103,140 FILES CLOSED FOR INCOMPLETENESS 0 $0 0 $0 0 $0
Aggregated Statistics For Year 2007(Based on 3 partial tracts) A) Conventional B) Refinancings C) Non-occupant Loans on Number Average Value Number Average Value Number Average Value
LOANS ORIGINATED 14 $162,912 4 $142,900 2 $131,000 APPLICATIONS APPROVED, NOT ACCEPTED 4 $152,892 3 $159,047 0 $0 APPLICATIONS DENIED 2 $84,635 0 $0 2 $42,945 APPLICATIONS WITHDRAWN 1 $123,520 1 $133,260 0 $0 FILES CLOSED FOR INCOMPLETENESS 0 $0 0 $0 0 $0
Aggregated Statistics For Year 2006(Based on 3 partial tracts) A) Conventional B) Refinancings C) Non-occupant Loans on Number Average Value Number Average Value Number Average Value
LOANS ORIGINATED 11 $99,095 4 $154,392 3 $50,310 APPLICATIONS APPROVED, NOT ACCEPTED 1 $68,780 1 $151,940 1 $43,850 APPLICATIONS DENIED 0 $0 0 $0 0 $0 APPLICATIONS WITHDRAWN 0 $0 1 $191,020 0 $0 FILES CLOSED FOR INCOMPLETENESS 0 $0 0 $0 0 $0
Aggregated Statistics For Year 2005(Based on 3 partial tracts) A) Conventional B) Refinancings C) Non-occupant Loans on Number Average Value Number Average Value Number Average Value
LOANS ORIGINATED 8 $104,136 5 $136,984 3 $48,933 APPLICATIONS APPROVED, NOT ACCEPTED 1 $108,080 1 $161,540 0 $0 APPLICATIONS DENIED 1 $50,640 0 $0 0 $0 APPLICATIONS WITHDRAWN 0 $0 0 $0 0 $0 FILES CLOSED FOR INCOMPLETENESS 0 $0 0 $0 0 $0
Aggregated Statistics For Year 2004(Based on 3 partial tracts) A) Conventional B) Refinancings C) Non-occupant Loans on Number Average Value Number Average Value Number Average Value
LOANS ORIGINATED 7 $78,263 3 $134,543 1 $65,780 APPLICATIONS APPROVED, NOT ACCEPTED 1 $134,640 4 $124,208 0 $0 APPLICATIONS DENIED 1 $76,840 0 $0 1 $33,570 APPLICATIONS WITHDRAWN 0 $0 1 $151,930 0 $0 FILES CLOSED FOR INCOMPLETENESS 1 $30,260 0 $0 0 $0
Aggregated Statistics For Year 2003(Based on 3 partial tracts) A) Conventional B) Refinancings C) Non-occupant Loans on Number Average Value Number Average Value Number Average Value
LOANS ORIGINATED 4 $113,155 10 $127,207 0 $0 APPLICATIONS APPROVED, NOT ACCEPTED 4 $122,598 3 $99,803 1 $24,700 APPLICATIONS DENIED 0 $0 1 $67,880 0 $0 APPLICATIONS WITHDRAWN 1 $43,770 1 $113,640 0 $0 FILES CLOSED FOR INCOMPLETENESS 0 $0 0 $0 0 $0
Aggregated Statistics For Year 2002(Based on 3 partial tracts) A) Conventional B) Refinancings C) Non-occupant Loans on Number Average Value Number Average Value Number Average Value
LOANS ORIGINATED 8 $99,286 8 $93,258 2 $54,295 APPLICATIONS APPROVED, NOT ACCEPTED 1 $98,820 2 $75,975 1 $50,270 APPLICATIONS DENIED 0 $0 1 $32,120 0 $0 APPLICATIONS WITHDRAWN 0 $0 1 $136,710 0 $0 FILES CLOSED FOR INCOMPLETENESS 0 $0 0 $0 0 $0
Aggregated Statistics For Year 2001(Based on 3 partial tracts) A) Conventional B) Refinancings C) Non-occupant Loans on Number Average Value Number Average Value Number Average Value
LOANS ORIGINATED 10 $69,033 5 $93,548 2 $30,600 APPLICATIONS APPROVED, NOT ACCEPTED 2 $54,775 2 $76,930 1 $21,620 APPLICATIONS DENIED 1 $30,140 1 $37,600 1 $37,600 APPLICATIONS WITHDRAWN 0 $0 1 $28,300 0 $0 FILES CLOSED FOR INCOMPLETENESS 0 $0 0 $0 0 $0
Aggregated Statistics For Year 2000(Based on 3 partial tracts) A) Conventional B) Refinancings C) Non-occupant Loans on Number Average Value Number Average Value Number Average Value
LOANS ORIGINATED 6 $83,400 8 $47,061 2 $38,400 APPLICATIONS APPROVED, NOT ACCEPTED 0 $0 0 $0 0 $0 APPLICATIONS DENIED 0 $0 0 $0 0 $0 APPLICATIONS WITHDRAWN 0 $0 0 $0 0 $0 FILES CLOSED FOR INCOMPLETENESS 0 $0 0 $0 0 $0
Aggregated Statistics For Year 1999(Based on 3 partial tracts) A) Conventional B) Refinancings Number Average Value Number Average Value
LOANS ORIGINATED 4 $75,758 5 $72,594 APPLICATIONS APPROVED, NOT ACCEPTED 0 $0 1 $45,270 APPLICATIONS DENIED 1 $17,420 0 $0 APPLICATIONS WITHDRAWN 0 $0 0 $0 FILES CLOSED FOR INCOMPLETENESS 0 $0 0 $0
Detailed PMIC statistics for the following Tracts:
8236.03
, 8243.00 , 8244.00
Most common first names in Robbins, IL among deceased individuals Name Count Lived (average)
James 73 70.6 years John 63 71.3 years Mary 58 77.5 years Willie 53 69.9 years William 50 72.9 years Robert 47 68.3 years George 39 70.8 years Charles 34 69.2 years Annie 27 74.9 years Joseph 25 70.7 years
Most common last names in Robbins, IL among deceased individuals Last name Count Lived (average)
Williams 66 74.2 years Smith 54 74.5 years Jones 49 72.1 years Johnson 46 69.5 years Brown 44 70.1 years Jackson 40 73.0 years Moore 38 69.7 years Davis 29 66.9 years Thomas 27 73.1 years Harris 20 71.6 years
Robbins compared to Illinois state average:
Median household income below state average. Median house value significantly below state average. Black race population percentage significantly above state average. Hispanic race population percentage significantly below state average. Foreign-born population percentage significantly below state average. Renting percentage above state average. Length of stay since moving in significantly above state average. Institutionalized population percentage significantly above state average. Number of college students below state average. Percentage of population with a bachelor's degree or higher below state average.
#1 on the list of "Top 101 cities with largest percentage of females in occupations: personal care and service occupations (population 5,000+)"
#5 on the list of "Top 101 cities with the highest percentage of single-parent households, population 5,000+"
#10 on the list of "Top 101 cities with the largest city-data.com crime index per police officer (population 5,000+)"
#11 on the list of "Top 101 cities with the largest percentage of people in other nonhousehold living situations (population 1,000+)"
#19 on the list of "Top 101 cities with the lowest number of police officers per 1000 residents (population 5,000+)"
#29 on the list of "Top 101 cities with largest percentage of males in industries: transportation and warehousing (population 5,000+)"
#54 on the list of "Top 101 cities with largest percentage of males in occupations: transportation occupations (population 5,000+)"
#55 on the list of "Top 101 cities with the largest percentage population decrease from 2000 (population 5,000+)"
#58 on the list of "Top 101 cities with largest percentage of males in industries: administrative and support and waste management services (population 5,000+)"
#68 on the list of "Top 101 cities with the least people having Master's or Doctorate degrees (population 5,000+)"
#80 on the list of "Top 101 cities with the least cars per house, population 5,000+"
#90 on the list of "Top 101 cities with largest percentage of males in occupations: material moving occupations (population 5,000+)"
#92 on the list of "Top 100 cities with declining populations from 2000 to 2014 (pop. 5,000+)"
#68 (60472) on the list of "Top 101 zip codes with the largest percentage of Subsaharan African first ancestries"
#1 on the list of "Top 101 counties with the most Black Protestant congregations"
#1 on the list of "Top 101 counties with the most Catholic congregations"
#1 on the list of "Top 101 counties with the highest surface withdrawal of fresh water for public supply"
#2 on the list of "Top 101 counties with the most Black Protestant adherents"
#2 on the list of "Top 101 counties with the most Orthodox congregations (pop. 50,000+)"
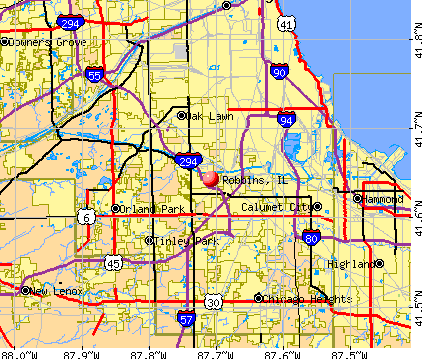


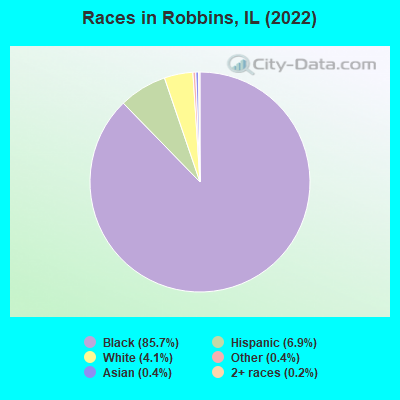
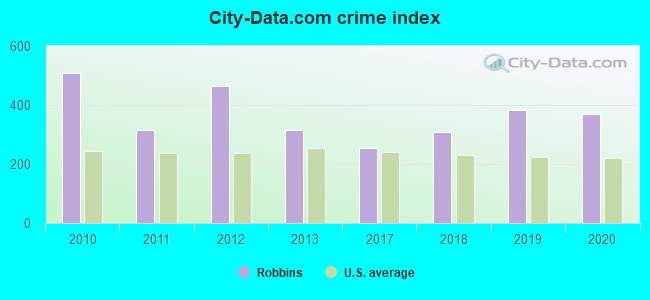
 Recent articles from our blog. Our writers, many of them Ph.D. graduates or candidates, create easy-to-read articles on a wide variety of topics.

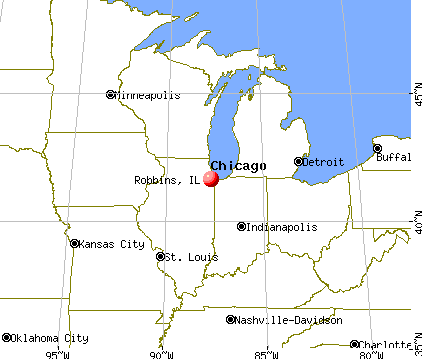
 (5.5 miles
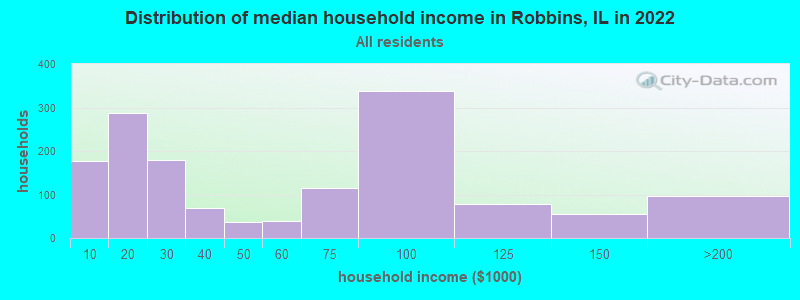
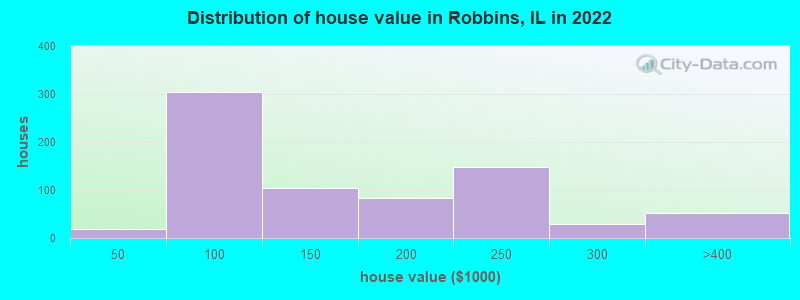

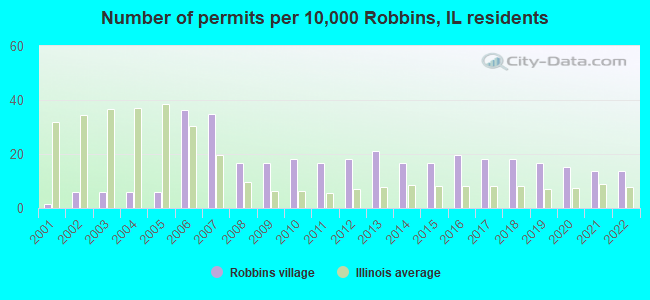
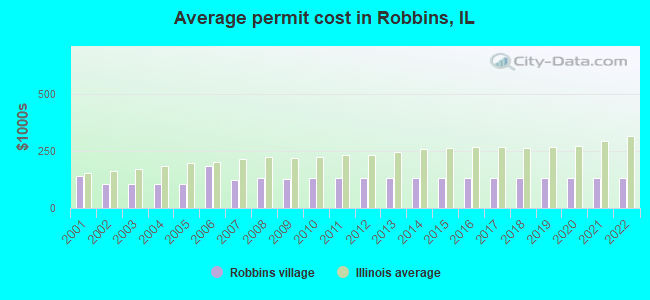
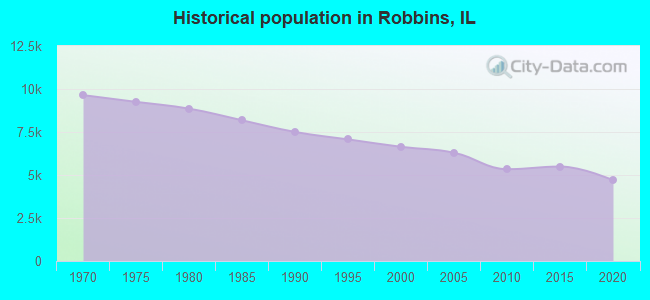
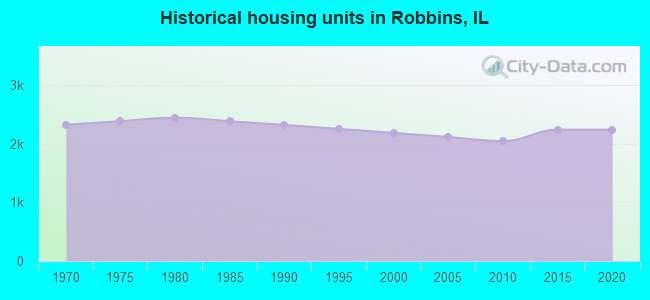
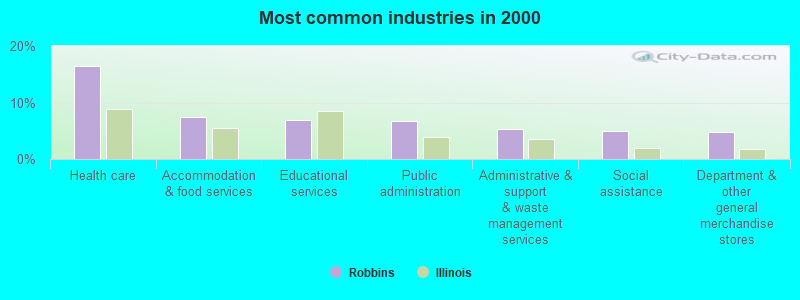
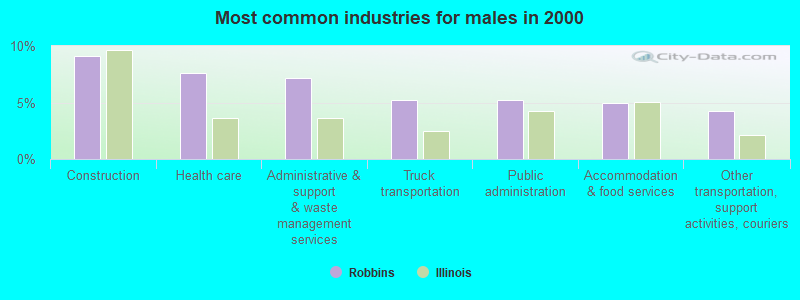
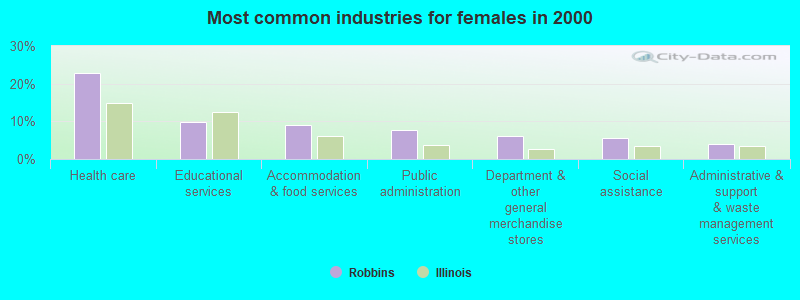
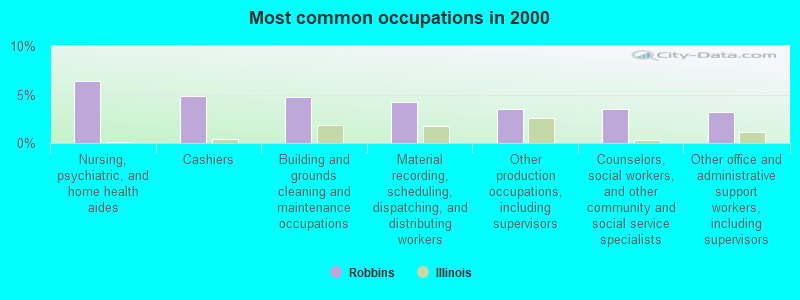
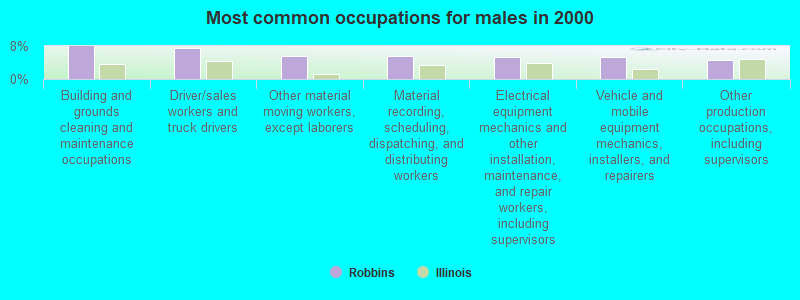
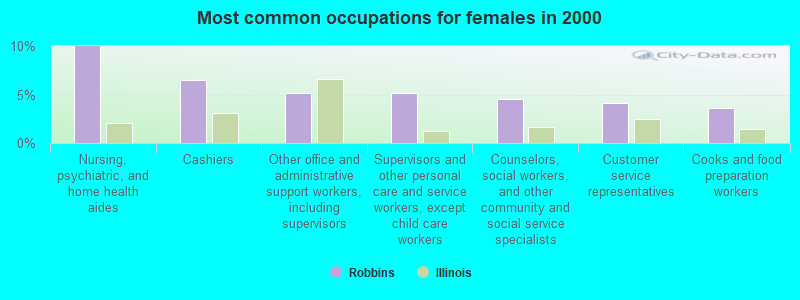
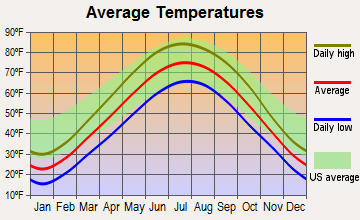
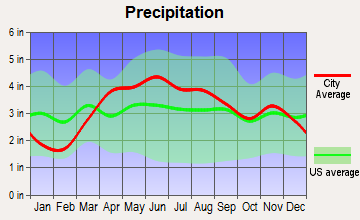
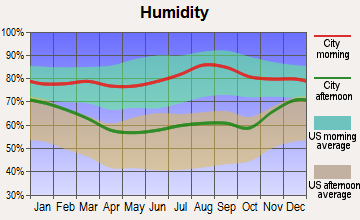
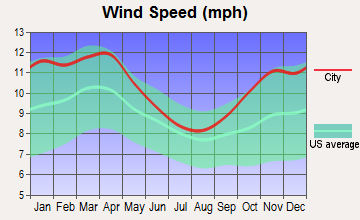
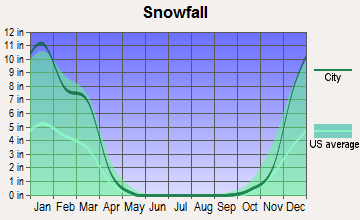
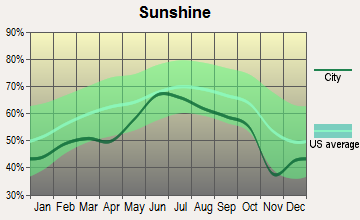
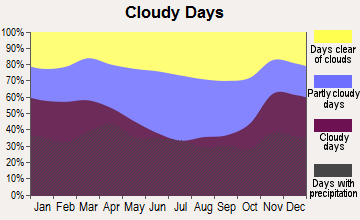


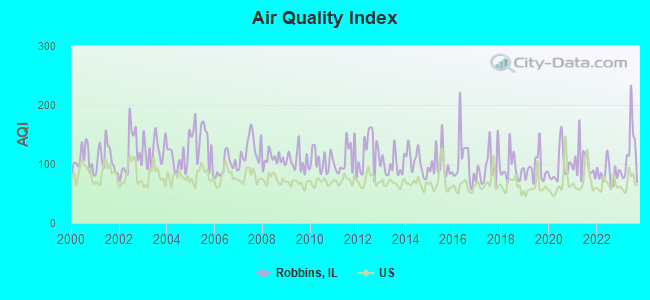
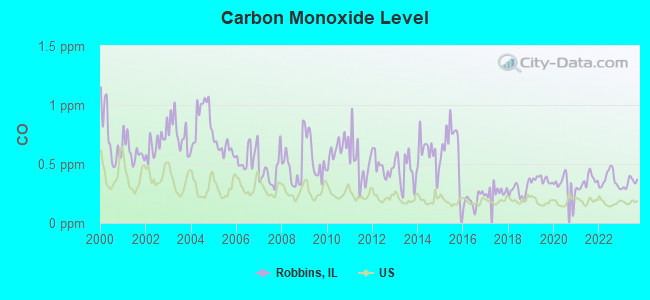
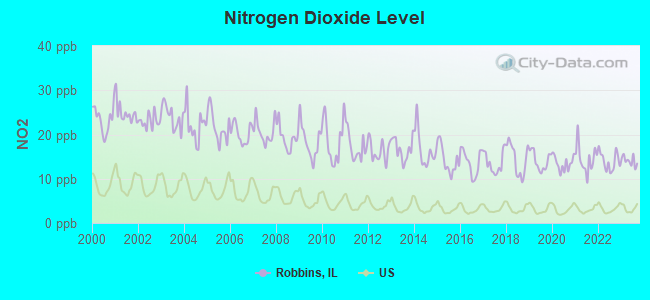
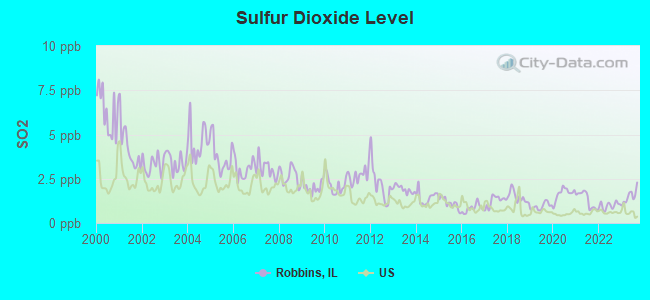
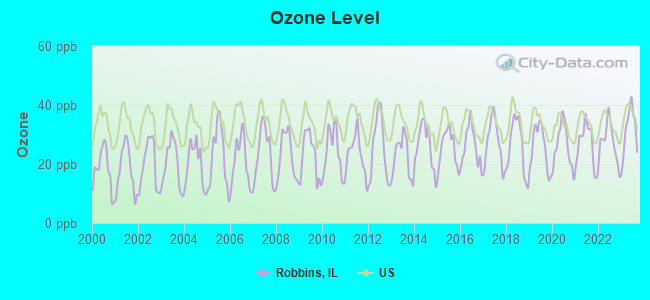
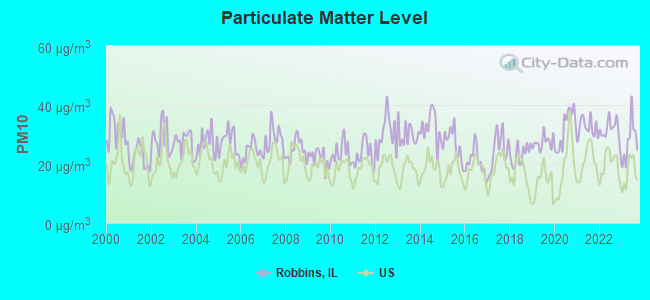
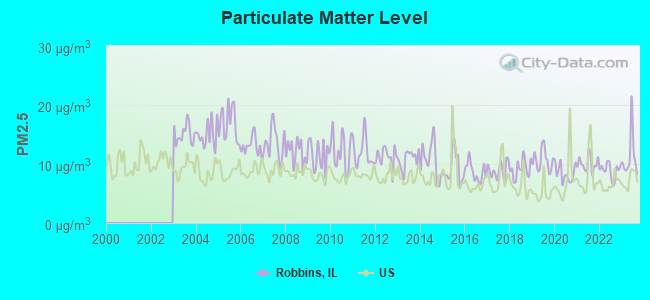
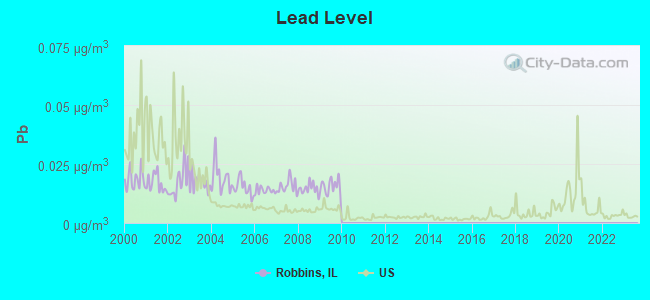

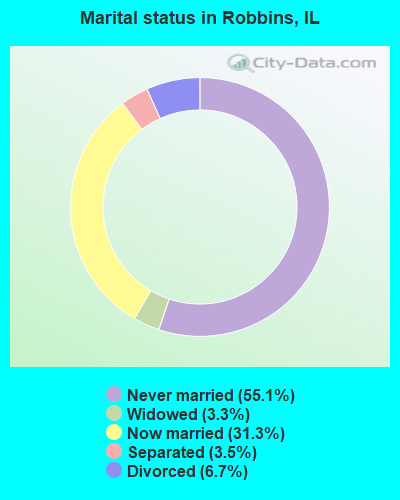

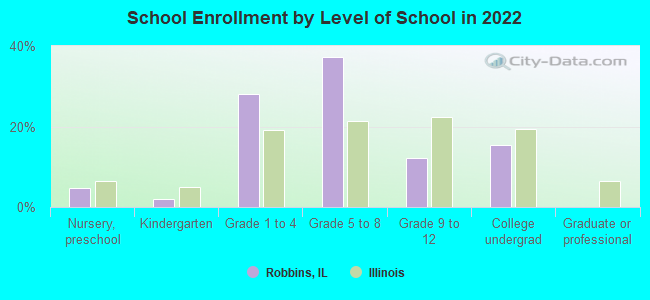


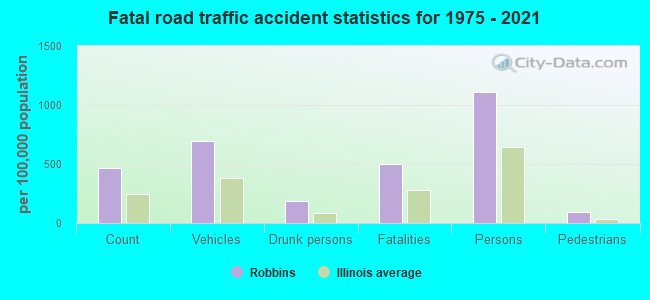
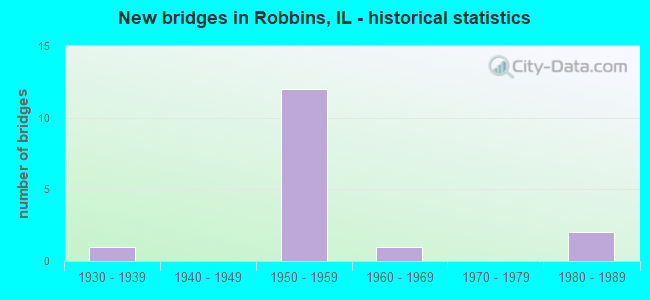
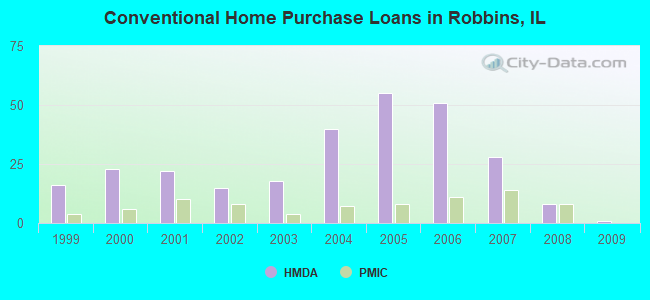
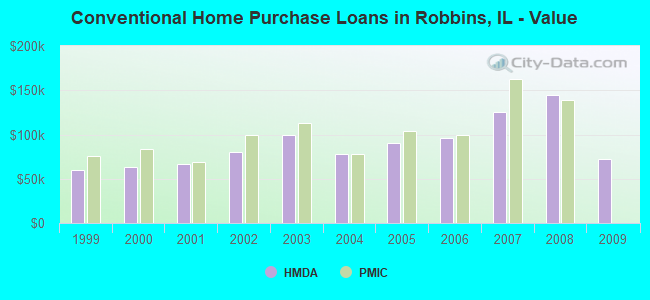
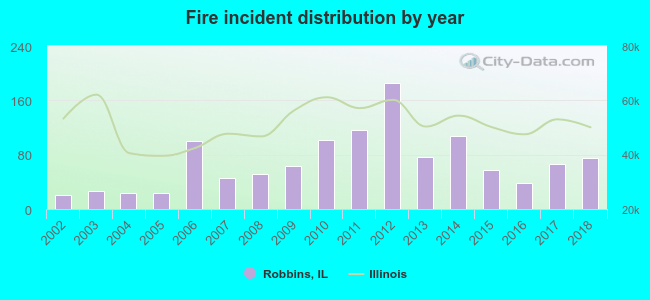 Based on the data from the years 2002 - 2018 the average number of fires per year is 69. The highest number of fire incidents - 185 took place in 2012, and the least - 21 in 2002. The data has a growing trend.
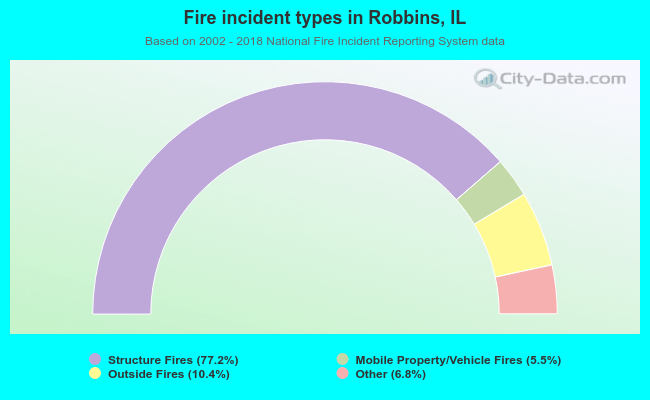 When looking into fire subcategories, the most reports belonged to: Structure Fires (77.2%), and Outside Fires (10.4%).