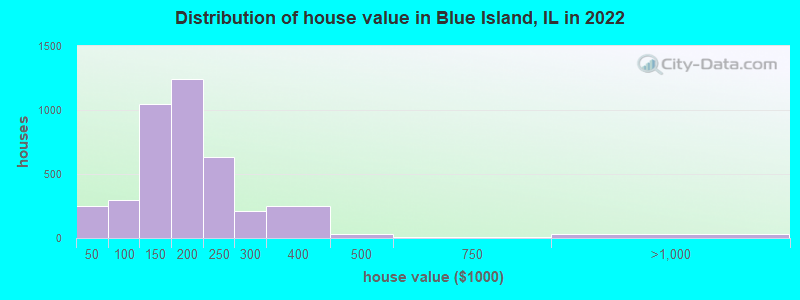
Estimated median house or condo value in 2022: $168,607 (it was $102,200 in 2000)
Blue Island:
$168,607
IL:
$251,600
Mean prices in 2022:all housing units: $174,677; detached houses: $168,681; townhouses or other attached units: $165,691; in 2-unit structures: $287,777; in 3-to-4-unit structures: $385,512; in 5-or-more-unit structures: $108,186; mobile homes: $67,137
Median gross rent in 2022: $1,020.
March 2022 cost of living index in Blue Island: 99.5 (near average, U.S. average is 100)
Percentage of residents living in poverty in 2022: 18.7%
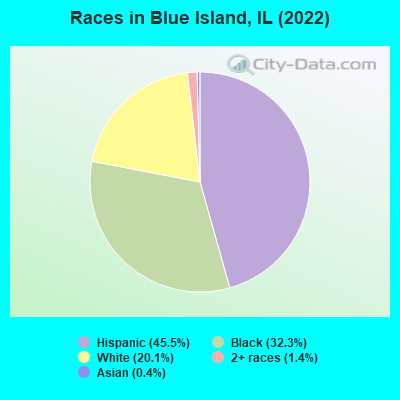
(13.5% for White Non-Hispanic residents, 24.4% for Black residents, 18.0% for Hispanic or Latino residents, 25.2% for other race residents, 10.5% for two or more races residents)
According to our research of Illinois and other state lists, there were 33 registered sex offenders living in Blue Island, Illinois as of April 28, 2024. The ratio of all residents to sex offenders in Blue Island is 677 to 1. The ratio of registered sex offenders to all residents in this city is near the state average.
Crime rates in Blue Island by year
Type
2009
2010
2011
2012
2013
2014
2015
2016
2017
2018
2019
2020
2021
2022
Murders (per 100,000)
3 (13.5)
1 (4.2)
0 (0.0)
3 (12.6)
0 (0.0)
1 (4.2)
1 (4.2)
1 (4.2)
1 (4.3)
1 (4.3)
1 (4.3)
1 (4.4)
3 (13.3)
2 (9.3)
Rapes (per 100,000)
0 (0.0)
5 (21.1)
11 (46.3)
2 (8.4)
6 (25.2)
12 (50.4)
11 (46.2)
11 (46.5)
16 (68.5)
10 (42.9)
17 (73.8)
12 (52.6)
8 (35.5)
13 (60.2)
Robberies (per 100,000)
61 (274.7)
66 (278.4)
61 (256.6)
51 (214.1)
57 (239.0)
54 (226.8)
62 (260.5)
49 (207.3)
47 (201.3)
32 (137.3)
54 (234.4)
42 (184.1)
12 (53.3)
28 (129.8)
Assaults (per 100,000)
57 (256.7)
38 (160.3)
40 (168.2)
33 (138.5)
45 (188.7)
69 (289.8)
66 (277.3)
54 (228.5)
97 (415.5)
50 (214.5)
55 (238.7)
13 (57.0)
29 (128.8)
83 (384.7)
Burglaries (per 100,000)
281 (1,266)
193 (814.1)
181 (761.2)
161 (675.9)
163 (683.6)
147 (617.4)
113 (474.8)
127 (537.3)
64 (274.1)
68 (291.7)
79 (342.9)
29 (127.1)
42 (186.6)
87 (403.2)
Thefts (per 100,000)
431 (1,941)
406 (1,713)
405 (1,703)
285 (1,196)
407 (1,707)
430 (1,806)
407 (1,710)
381 (1,612)
282 (1,208)
168 (720.7)
201 (872.5)
108 (473.5)
161 (715.3)
338 (1,566)
Auto thefts (per 100,000)
107 (481.9)
80 (337.5)
100 (420.6)
89 (373.6)
78 (327.1)
60 (252.0)
66 (277.3)
59 (249.6)
74 (316.9)
52 (223.1)
49 (212.7)
31 (135.9)
50 (222.1)
202 (936.2)
Arson (per 100,000)
3 (13.5)
1 (4.2)
1 (4.2)
0 (0.0)
0 (0.0)
3 (12.6)
3 (12.6)
1 (4.2)
2 (8.6)
0 (0.0)
1 (4.3)
0 (0.0)
2 (8.9)
7 (32.4)
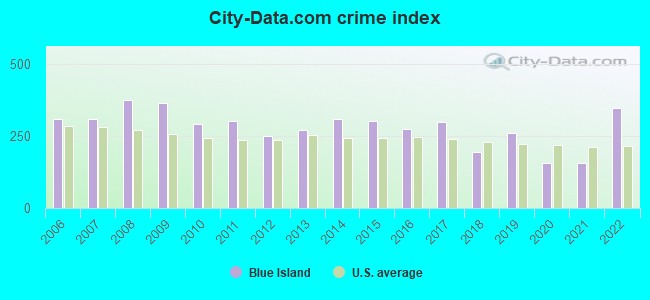
City-Data.com crime index
365.6
293.4
302.7
248.9
271.9
310.3
302.8
275.6
299.7
194.1
261.7
156.2
156.3
348.4
The City-Data.com crime index weighs serious crimes and violent crimes more heavily. Higher means more crime, U.S. average is 246.1. It adjusts for the number of visitors and daily workers commuting into cities.
Latest news from Blue Island, IL collected exclusively by city-data.com from local newspapers, TV, and radio stations
Ancestries: German (2.3%), Irish (2.0%), Polish (1.4%), Italian (1.3%).
Current Local Time: CST time zone
Incorporated on 09/05/1894
Elevation: 635 feet
Land area: 4.03 square miles.
Population density: 5,388 people per square mile (average).
4,783 residents are foreign born (19.8% Latin America).
This city:
21.3%
Illinois:
14.1%
Median real estate property taxes paid for housing units with mortgages in 2022: $4,214 (2.4%) Median real estate property taxes paid for housing units with no mortgage in 2022: $3,958 (2.6%)
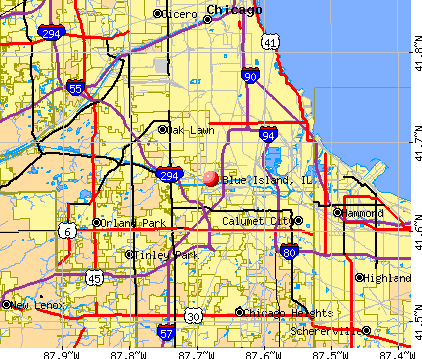
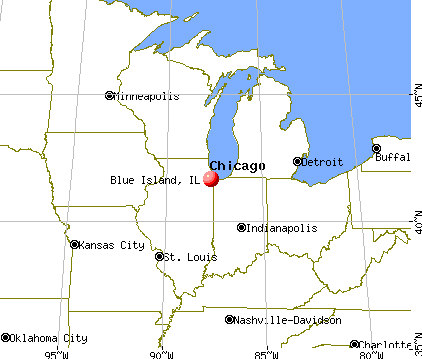
Nearest city with pop. 50,000+: Oak Lawn, IL (5.5 miles , pop. 55,245).
Nearest city with pop. 200,000+: Chicago, IL (12.6 miles , pop. 2,896,016).
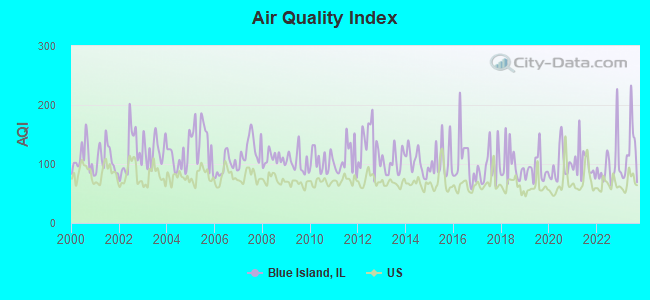
Air Quality Index (AQI) level in 2023 was 118. This is significantly worse than average.
City:
118
U.S.:
73
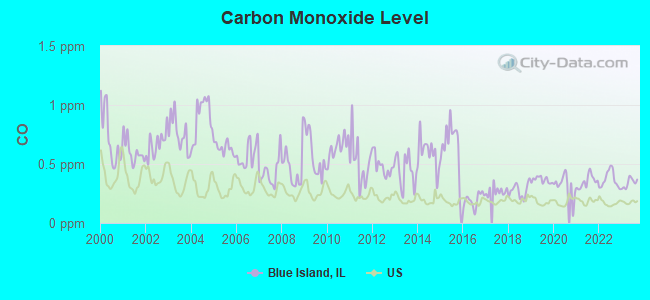
Carbon Monoxide (CO) [ppm] level in 2023 was 0.339. This is worse than average.Closest monitor was 3.1 miles away from the city center.
City:
0.339
U.S.:
0.251
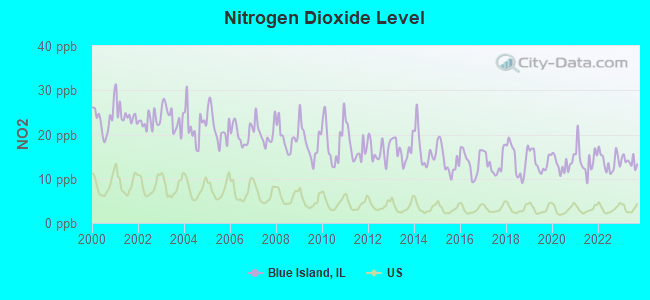
Nitrogen Dioxide (NO2) [ppb] level in 2023 was 13.9. This is significantly worse than average.Closest monitor was 0.9 miles away from the city center.
City:
13.9
U.S.:
5.1
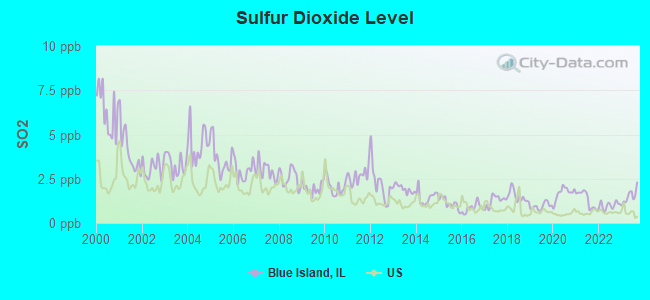
Sulfur Dioxide (SO2) [ppb] level in 2023 was 1.51. This is about average.Closest monitor was 0.9 miles away from the city center.
City:
1.51
U.S.:
1.51
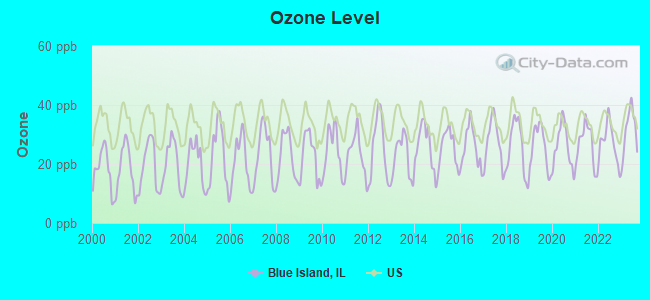
Ozone [ppb] level in 2023 was 31.4. This is about average.Closest monitor was 2.9 miles away from the city center.
City:
31.4
U.S.:
33.3
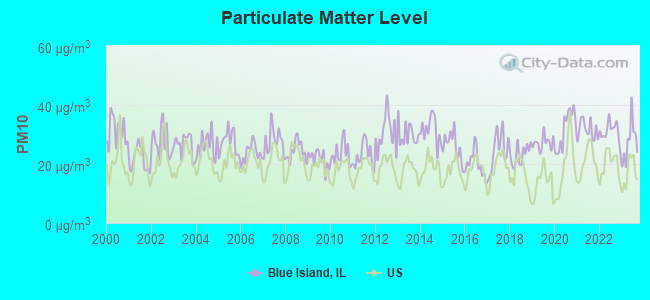
Particulate Matter (PM10) [µg/m3] level in 2023 was 27.4. This is significantly worse than average.Closest monitor was 0.9 miles away from the city center.
City:
27.4
U.S.:
19.2
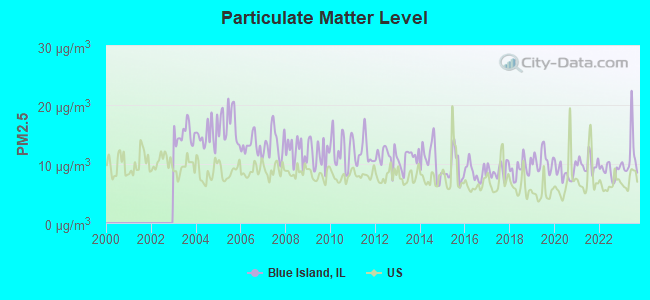
Particulate Matter (PM2.5) [µg/m3] level in 2023 was 11.4. This is significantly worse than average.Closest monitor was 0.9 miles away from the city center.
City:
11.4
U.S.:
8.1
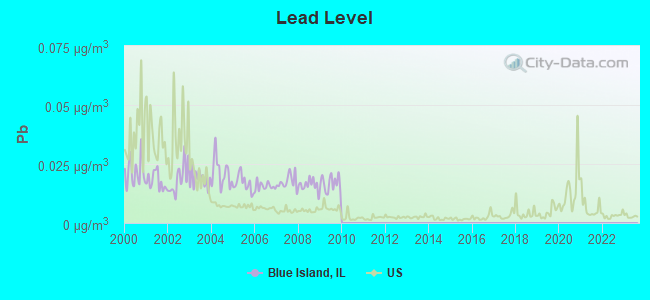
Lead (Pb) [µg/m3] level in 2009 was 0.0168. This is significantly worse than average.Closest monitor was 0.9 miles away from the city center.
City:
0.0168
U.S.:
0.0093
Tornado activity:
Blue Island-area historical tornado activity is near Illinois state average. It is 55% greater than the overall U.S. average.
On 8/28/1990, a category F5 (max. wind speeds 261-318 mph) tornado 23.8 miles away from the Blue Island city center killed 29 peopleand injured 350 peopleand causedbetween $50,000 and $500,000 in damages.
On 4/21/1967, a category F4 (max. wind speeds 207-260 mph) tornado 7.8 miles away from the city center killed 33 peopleand injured 500 peopleand causedbetween $5,000,000 and $50,000,000 in damages.
Earthquake activity:
Blue Island-area historical earthquake activity is significantly above Illinois state average. It is 42% greater than the overall U.S. average.
On 4/18/2008 at 09:36:59, a magnitude 5.4 (5.1 MB, 4.8 MS, 5.4 MW, 5.2 MW, Class: Moderate, Intensity: VI - VII) earthquake occurred 222.0 miles away from Blue Island center On 6/10/1987 at 23:48:54, a magnitude 5.1 (4.9 MB, 4.4 MS, 4.6 MS, 5.1 LG) earthquake occurred 196.6 miles away from the city center On 4/18/2008 at 09:36:59, a magnitude 5.2 (5.2 MW, Depth: 8.9 mi) earthquake occurred 222.1 miles away from Blue Island center On 6/28/2004 at 06:10:52, a magnitude 4.2 (4.2 MW, Depth: 6.2 mi, Class: Light, Intensity: IV - V) earthquake occurred 64.6 miles away from the city center On 6/18/2002 at 17:37:15, a magnitude 5.0 (4.3 MB, 4.6 MW, 5.0 LG) earthquake occurred 254.0 miles away from Blue Island center On 4/18/2008 at 15:14:16, a magnitude 4.8 (4.5 MB, 4.8 MW, 4.6 MW) earthquake occurred 220.3 miles away from Blue Island center Magnitude types: regional Lg-wave magnitude (LG), body-wave magnitude (MB), surface-wave magnitude (MS), moment magnitude (MW)
Natural disasters:
The number of natural disasters in Cook County (20) is greater than the US average (15). Major Disasters (Presidential) Declared: 15 Emergencies Declared: 4
Causes of natural disasters: Floods: 13, Storms: 12, Tornadoes: 3, Snowstorms: 2, Winter Storms: 2, Blizzard: 1, Hurricane: 1, Snow: 1, Wind: 1, Other: 1 (Note: some incidents may be assigned to more than one category).
Hospitals and medical centers in Blue Island:
METROSOUTH MEDICAL CENTER (Proprietary, 12935 S GREGORY)
SSM HOSPICE AT ST FRANCIS BLUE ISLAND (12935 SOUTH GREGORY, ROOM 612)
BLUE ISLAND NURSING HOME (2427 WEST 127TH STREET)
FMC - BLUE ISLAND DIALYSIS CENTER (12200 SOUTH WESTERN AVE.)
MSMC HOME CARE, LLC (12935 S GREGORY)
Amtrak stations near Blue Island:
7 miles: HOMEWOOD (181 1ST ST. & PARK AVE.) . Services: ticket office, enclosed waiting area, public restrooms, public payphones, paid short-term parking, paid long-term parking, public transit connection.
ETI School of Skilled Trades (Full-time enrollment: 169; Location: 13010 S Division St; Private, for-profit; Website: www.eticampus.com)
Cannella School of Hair Design-Blue Island (Full-time enrollment: 57; Location: 12943 S Western Ave; Private, for-profit; Website: cannellabeautyschools.com)
Colleges/universities with over 2000 students nearest to Blue Island:
Saint Xavier University (about 4 miles; Chicago, IL; Full-time enrollment: 3,576)
South Suburban College (about 5 miles; South Holland, IL; FT enrollment: 3,972)
Chicago State University (about 6 miles; Chicago, IL; FT enrollment: 4,352)
City Colleges of Chicago-Olive-Harvey College (about 6 miles; Chicago, IL; FT enrollment: 4,110)
City Colleges of Chicago-Richard J Daley College (about 8 miles; Chicago, IL; FT enrollment: 7,497)
Moraine Valley Community College (about 9 miles; Palos Hills, IL; FT enrollment: 12,008)
City Colleges of Chicago-Kennedy-King College (about 9 miles; Chicago, IL; FT enrollment: 5,044)
BLUE ISLAND PUBLIC LIBRARY (Operating income: $1,509,091; Location: 2433 YORK STREET; 74,201 books; 3,974 audio materials; 5,561 video materials; 7 local licensed databases; 16 state licensed databases; 2 other licensed databases; 307 print serial subscriptions)
User-submitted facts and corrections:
TLC Learning Center is a private pre school and kindergarten student population is 155
WFBT-CA (Channel 23; CHICAGO, IL; Owner: CHANNEL 23 is now WWME (ME-TV). WFBT is now Channel 48 W54AP no longer broadcasts
Orchard Street Christian Church is now Family of Hope Christian Church! For more information, please see www.familyofhopechristianchurch.com.
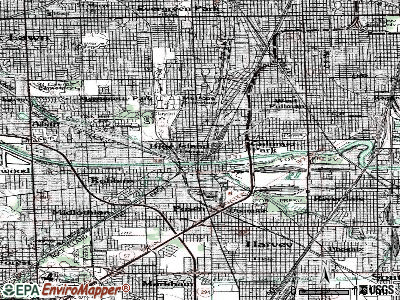
Notable locations in Blue Island: Blue Island Water Works (A), Blue Island Fire Department Station 2 (B), Blue Island Fire Department Station 1 (C), Blue Island Public Library (D). Display/hide their locations on the map
Churches in Blue Island include: Church of Christ (A), Church of the Nazarene (B), Evangelical Community Church (C), First Church of Christ Scientist (D), First Congregational Church (E), First Evangelical Lutheran Church (F), Grace Methodist Church (G), Orchard Street Christian Church (H), Saint Aidan's Episcopal Church (I). Display/hide their locations on the map
Birthplace of: Robert Seyfarth - Architect, Marcheline Bertrand - Actress and producer, Peter Brown (singer) - Male singer, Anthony E. Zuiker - Producer of CSI, Christian Picciolini - Television producer, Curtis Granderson - 2005 Major League Baseball player (Detroit Tigers, born: Mar 16, 1981), Danny Clark - 2005 NFL player (Oakland Raiders, born: May 9, 1977), Danny Clark (American football) - Football player, Eugene Rousseau (saxophonist) - Classical musician, Gary Sinise - (born 1955), actor.
Cook County has a predicted average indoor radon screening level between 2 and 4 pCi/L (pico curies per liter) - Moderate Potential
Drinking water stations with addresses in Blue Island that have no violations reported:
BLUE ISLAND (Population served: 23,463,Primary Water Source Type: Purch surface water)
Average household size:
This city:
3.0 people
Illinois:
2.6 people
Percentage of family households:
This city:
68.0%
Whole state:
65.8%
Percentage of households with unmarried partners:
This city:
7.4%
Whole state:
6.3%
Likely homosexual households (counted as self-reported same-sex unmarried-partner households)
Lesbian couples: 0.5% of all households
Gay men: 0.3% of all households
People in group quarters in Blue Island in 2010:
28 people in nursing facilities/skilled-nursing facilities
27 people in other noninstitutional facilities
24 people in residential treatment centers for adults
People in group quarters in Blue Island in 2000:
22 people in nursing homes
22 people in homes or halfway houses for drug/alcohol abuse
3 people in religious group quarters
Banks with branches in Blue Island (2011 data):
RBS Citizens, National Association: Blue Island at 11960 South Western Avenue, branch established on 1887/01/01. Info updated 2007/09/19: Bank assets: $106,940.6 mil, Deposits: $75,690.2 mil, headquarters in Providence, RI, positive income, 1135 total offices, Holding Company: Uk Financial Investments Limited
First Midwest Bank: Blue Island Branch at 12015 South Western Avenue, branch established on 1912/09/12. Info updated 2011/12/22: Bank assets: $7,848.0 mil, Deposits: $6,529.2 mil, headquarters in Itasca, IL, positive income, Commercial Lending Specialization, 100 total offices, Holding Company: First Midwest Bancorp, Inc.
Great Lakes Bank, National Association: at 13057 South Western Avenue, branch established on 1896/06/01. Info updated 2007/12/05: Bank assets: $627.2 mil, Deposits: $501.8 mil, local headquarters, positive income, Commercial Lending Specialization, 8 total offices, Holding Company: Great Lakes Financial Resources, Inc. Employee Stock Ownership Plan
Religion statistics for Blue Island, IL (based on Cook County data)
Religion
Adherents
Congregations
Catholic
1,947,223
376
Evangelical Protestant
432,975
1,484
Other
312,636
403
Mainline Protestant
202,114
630
Black Protestant
148,895
395
Orthodox
53,276
66
None
2,097,556
-
Source: Clifford Grammich, Kirk Hadaway, Richard Houseal, Dale E.Jones, Alexei Krindatch, Richie Stanley and Richard H.Taylor. 2012. 2010 U.S.Religion Census: Religious Congregations & Membership Study. Association of Statisticians of American Religious Bodies. Jones, Dale E., et al. 2002. Congregations and Membership in the United States 2000. Nashville, TN: Glenmary Research Center. Graphs represent county-level data
Aircraft: BEECH 58P (Category: Land, Engines: 2, Seats: 6, Weight: Up to 12,499 Pounds, Speed: 123 mph), Engine: Reciprocating N-Number: 555CS, N555CS, N-555CS, Serial Number: TJ-385, Certificate Issue Date: 09/28/2020 Registrant (Individual): Daniel J Trustee Krause, 3330 Edison Ave, Blue Island, IL 60406
Aircraft: PIPER PA-22-160 (Category: Land, Seats: 4, Weight: Up to 12,499 Pounds, Speed: 94 mph), Engine: LYCOMING 0-320 SERIES (180 HP) (Reciprocating) N-Number: 9416D, N9416D, N-9416D, Serial Number: 22-6390, Year manufactured: 1958 Registrant (Individual): Lloyd C Miller, 11955 Vincennes Ave, Blue Island, IL 60406 Deregistered:Cancel Date: 11/21/2017
Aircraft: AERONCA 11AC (Category: Land, Seats: 2, Weight: Up to 12,499 Pounds, Speed: 75 mph), Engine: CONT MOTOR A&C65 SERIES (65 HP) (Reciprocating) N-Number: 9648E, N9648E, N-9648E, Serial Number: 11AC1289, Year manufactured: 1946 Registrant (Individual): George Marks, 2659 W 122nd Place, Blue Island, IL 60406 Deregistered:Cancel Date: 01/24/2017
Home Mortgage Disclosure Act Aggregated Statistics For Year 2009 (Based on 2 full and 5 partial tracts)
A) FHA, FSA/RHS & VA Home Purchase Loans
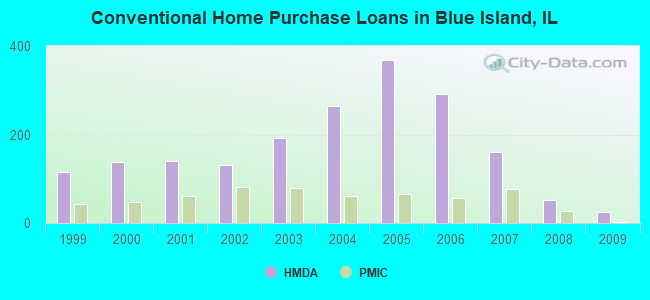
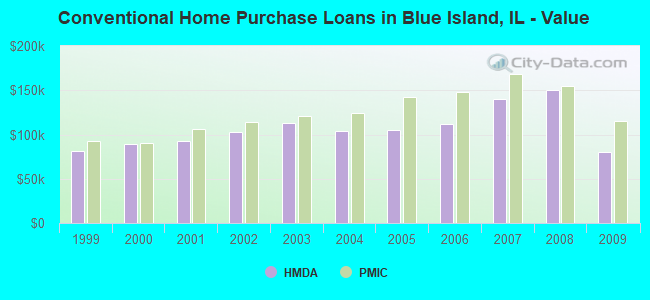
B) Conventional Home Purchase Loans
C) Refinancings
D) Home Improvement Loans
E) Loans on Dwellings For 5+ Families
F) Non-occupant Loans on < 5 Family Dwellings (A B C & D)
G) Loans On Manufactured Home Dwelling (A B C & D)
Number
Average Value
Number
Average Value
Number
Average Value
Number
Average Value
Number
Average Value
Number
Average Value
Number
Average Value
LOANS ORIGINATED
37
$119,961
25
$80,011
154
$133,010
14
$18,056
8
$226,706
15
$100,619
1
$21,000
APPLICATIONS APPROVED, NOT ACCEPTED
4
$127,558
2
$282,000
27
$130,167
4
$38,482
0
$0
3
$88,083
0
$0
APPLICATIONS DENIED
18
$139,903
14
$106,121
110
$135,346
33
$24,154
1
$375,770
16
$131,542
2
$27,760
APPLICATIONS WITHDRAWN
5
$114,974
1
$161,000
49
$149,439
0
$0
1
$240,000
2
$155,710
0
$0
FILES CLOSED FOR INCOMPLETENESS
3
$133,857
4
$187,385
15
$142,460
0
$0
0
$0
1
$100,520
0
$0
Aggregated Statistics For Year 2008 (Based on 2 full and 5 partial tracts)
A) FHA, FSA/RHS & VA Home Purchase Loans
B) Conventional Home Purchase Loans
C) Refinancings
D) Home Improvement Loans
E) Loans on Dwellings For 5+ Families
F) Non-occupant Loans on < 5 Family Dwellings (A B C & D)
Number
Average Value
Number
Average Value
Number
Average Value
Number
Average Value
Number
Average Value
Number
Average Value
LOANS ORIGINATED
40
$139,872
53
$150,436
190
$136,390
23
$45,036
12
$651,528
28
$135,958
APPLICATIONS APPROVED, NOT ACCEPTED
3
$138,440
11
$147,693
36
$122,865
9
$46,184
1
$193,000
1
$179,370
APPLICATIONS DENIED
24
$152,822
33
$166,357
219
$148,489
65
$43,295
1
$396,750
26
$117,126
APPLICATIONS WITHDRAWN
11
$170,595
15
$180,863
43
$160,199
8
$119,420
1
$287,790
10
$107,362
FILES CLOSED FOR INCOMPLETENESS
7
$134,699
8
$182,799
18
$151,917
4
$53,812
0
$0
4
$95,968
Aggregated Statistics For Year 2007 (Based on 2 full and 5 partial tracts)
A) FHA, FSA/RHS & VA Home Purchase Loans
B) Conventional Home Purchase Loans
C) Refinancings
D) Home Improvement Loans
E) Loans on Dwellings For 5+ Families
F) Non-occupant Loans on < 5 Family Dwellings (A B C & D)
G) Loans On Manufactured Home Dwelling (A B C & D)
Number
Average Value
Number
Average Value
Number
Average Value
Number
Average Value
Number
Average Value
Number
Average Value
Number
Average Value
LOANS ORIGINATED
13
$191,937
160
$140,660
305
$132,054
55
$60,173
14
$343,409
65
$128,709
1
$44,200
APPLICATIONS APPROVED, NOT ACCEPTED
1
$295,000
28
$147,510
78
$135,263
9
$65,016
0
$0
12
$126,912
0
$0
APPLICATIONS DENIED
8
$145,375
79
$146,525
282
$141,660
75
$55,078
2
$253,000
67
$132,185
3
$22,707
APPLICATIONS WITHDRAWN
1
$317,690
21
$181,101
113
$140,854
6
$121,927
3
$364,560
10
$157,247
0
$0
FILES CLOSED FOR INCOMPLETENESS
1
$182,710
11
$156,065
50
$143,970
1
$82,100
0
$0
3
$96,180
0
$0
Aggregated Statistics For Year 2006 (Based on 2 full and 5 partial tracts)
A) FHA, FSA/RHS & VA Home Purchase Loans
B) Conventional Home Purchase Loans
C) Refinancings
D) Home Improvement Loans
E) Loans on Dwellings For 5+ Families
F) Non-occupant Loans on < 5 Family Dwellings (A B C & D)
G) Loans On Manufactured Home Dwelling (A B C & D)
Number
Average Value
Number
Average Value
Number
Average Value
Number
Average Value
Number
Average Value
Number
Average Value
Number
Average Value
LOANS ORIGINATED
16
$157,273
292
$111,498
410
$125,385
73
$64,507
9
$250,787
101
$123,410
5
$44,382
APPLICATIONS APPROVED, NOT ACCEPTED
0
$0
76
$113,744
99
$129,184
14
$54,494
0
$0
28
$116,064
0
$0
APPLICATIONS DENIED
4
$138,178
196
$104,527
324
$125,005
78
$44,416
3
$275,700
76
$107,281
4
$18,270
APPLICATIONS WITHDRAWN
3
$131,220
62
$118,455
150
$132,286
14
$89,305
0
$0
30
$123,291
0
$0
FILES CLOSED FOR INCOMPLETENESS
1
$78,630
28
$96,111
59
$134,137
1
$107,340
0
$0
7
$104,684
0
$0
Aggregated Statistics For Year 2005 (Based on 2 full and 5 partial tracts)
A) FHA, FSA/RHS & VA Home Purchase Loans
B) Conventional Home Purchase Loans
C) Refinancings
D) Home Improvement Loans
E) Loans on Dwellings For 5+ Families
F) Non-occupant Loans on < 5 Family Dwellings (A B C & D)
G) Loans On Manufactured Home Dwelling (A B C & D)
Number
Average Value
Number
Average Value
Number
Average Value
Number
Average Value
Number
Average Value
Number
Average Value
Number
Average Value
LOANS ORIGINATED
20
$151,418
368
$105,382
431
$119,446
49
$48,409
14
$581,146
103
$106,768
2
$13,685
APPLICATIONS APPROVED, NOT ACCEPTED
4
$177,505
82
$111,669
112
$118,901
4
$55,015
2
$2,102,100
31
$110,548
1
$12,000
APPLICATIONS DENIED
4
$162,390
183
$105,601
358
$121,960
66
$50,820
1
$125,810
55
$120,790
3
$18,047
APPLICATIONS WITHDRAWN
1
$105,650
70
$112,569
156
$133,268
19
$203,625
3
$347,623
33
$102,948
1
$169,000
FILES CLOSED FOR INCOMPLETENESS
2
$129,520
26
$91,124
71
$127,497
2
$28,390
0
$0
9
$115,099
1
$31,000
Aggregated Statistics For Year 2004 (Based on 2 full and 5 partial tracts)
A) FHA, FSA/RHS & VA Home Purchase Loans
B) Conventional Home Purchase Loans
C) Refinancings
D) Home Improvement Loans
E) Loans on Dwellings For 5+ Families
F) Non-occupant Loans on < 5 Family Dwellings (A B C & D)
G) Loans On Manufactured Home Dwelling (A B C & D)
Number
Average Value
Number
Average Value
Number
Average Value
Number
Average Value
Number
Average Value
Number
Average Value
Number
Average Value
LOANS ORIGINATED
43
$142,436
265
$103,411
463
$110,016
40
$59,940
16
$407,068
74
$92,885
4
$53,215
APPLICATIONS APPROVED, NOT ACCEPTED
4
$144,662
74
$107,182
128
$120,110
7
$48,716
0
$0
27
$108,803
0
$0
APPLICATIONS DENIED
4
$177,772
105
$100,175
365
$114,143
65
$45,465
3
$286,343
42
$86,598
4
$27,572
APPLICATIONS WITHDRAWN
4
$116,608
40
$105,847
159
$120,388
14
$78,511
1
$240,760
16
$112,397
0
$0
FILES CLOSED FOR INCOMPLETENESS
5
$119,388
16
$102,956
48
$118,468
3
$94,667
1
$510,970
4
$121,548
0
$0
Aggregated Statistics For Year 2003 (Based on 2 full and 5 partial tracts)
A) FHA, FSA/RHS & VA Home Purchase Loans
B) Conventional Home Purchase Loans
C) Refinancings
D) Home Improvement Loans
E) Loans on Dwellings For 5+ Families
F) Non-occupant Loans on < 5 Family Dwellings (A B C & D)
Number
Average Value
Number
Average Value
Number
Average Value
Number
Average Value
Number
Average Value
Number
Average Value
LOANS ORIGINATED
54
$125,986
193
$113,142
599
$102,060
23
$54,561
24
$286,148
60
$98,680
APPLICATIONS APPROVED, NOT ACCEPTED
5
$124,292
37
$109,266
104
$104,606
5
$42,874
0
$0
12
$99,777
APPLICATIONS DENIED
8
$123,246
59
$107,274
326
$103,435
33
$14,213
3
$1,446,757
20
$115,990
APPLICATIONS WITHDRAWN
7
$126,094
32
$105,455
172
$108,007
6
$37,325
1
$290,980
11
$112,161
FILES CLOSED FOR INCOMPLETENESS
3
$91,307
9
$127,824
31
$108,656
2
$17,500
0
$0
2
$130,985
Aggregated Statistics For Year 2002 (Based on 2 full and 5 partial tracts)
A) FHA, FSA/RHS & VA Home Purchase Loans
B) Conventional Home Purchase Loans
C) Refinancings
D) Home Improvement Loans
E) Loans on Dwellings For 5+ Families
F) Non-occupant Loans on < 5 Family Dwellings (A B C & D)
Number
Average Value
Number
Average Value
Number
Average Value
Number
Average Value
Number
Average Value
Number
Average Value
LOANS ORIGINATED
89
$119,864
132
$102,600
435
$96,014
22
$19,265
12
$640,434
38
$103,250
APPLICATIONS APPROVED, NOT ACCEPTED
4
$157,162
26
$105,187
82
$99,791
5
$21,950
2
$196,195
9
$87,103
APPLICATIONS DENIED
12
$136,491
66
$83,668
202
$88,746
33
$19,116
0
$0
27
$79,350
APPLICATIONS WITHDRAWN
10
$130,402
22
$106,885
125
$96,795
3
$24,660
2
$159,035
8
$100,846
FILES CLOSED FOR INCOMPLETENESS
3
$136,613
6
$104,767
46
$106,152
1
$10,000
0
$0
3
$118,090
Aggregated Statistics For Year 2001 (Based on 2 full and 5 partial tracts)
A) FHA, FSA/RHS & VA Home Purchase Loans
B) Conventional Home Purchase Loans
C) Refinancings
D) Home Improvement Loans
E) Loans on Dwellings For 5+ Families
F) Non-occupant Loans on < 5 Family Dwellings (A B C & D)
Number
Average Value
Number
Average Value
Number
Average Value
Number
Average Value
Number
Average Value
Number
Average Value
LOANS ORIGINATED
102
$108,677
140
$92,688
404
$89,686
35
$23,046
9
$247,759
38
$84,383
APPLICATIONS APPROVED, NOT ACCEPTED
5
$106,196
20
$83,130
66
$81,245
11
$17,819
2
$206,205
9
$83,677
APPLICATIONS DENIED
10
$101,860
56
$69,768
255
$81,467
63
$19,692
2
$407,845
22
$82,556
APPLICATIONS WITHDRAWN
16
$89,124
20
$93,437
103
$82,695
10
$21,588
0
$0
9
$73,512
FILES CLOSED FOR INCOMPLETENESS
5
$153,962
5
$77,594
43
$94,598
2
$14,125
0
$0
2
$81,230
Aggregated Statistics For Year 2000 (Based on 2 full and 5 partial tracts)
A) FHA, FSA/RHS & VA Home Purchase Loans
B) Conventional Home Purchase Loans
C) Refinancings
D) Home Improvement Loans
E) Loans on Dwellings For 5+ Families
F) Non-occupant Loans on < 5 Family Dwellings (A B C & D)
Number
Average Value
Number
Average Value
Number
Average Value
Number
Average Value
Number
Average Value
Number
Average Value
LOANS ORIGINATED
93
$93,467
138
$89,068
174
$77,815
56
$21,572
9
$352,208
29
$76,684
APPLICATIONS APPROVED, NOT ACCEPTED
3
$84,833
22
$75,891
47
$70,406
19
$19,994
1
$156,000
4
$45,902
APPLICATIONS DENIED
12
$108,532
69
$73,410
196
$72,222
59
$23,160
2
$479,800
20
$56,118
APPLICATIONS WITHDRAWN
16
$85,977
33
$78,780
93
$66,228
12
$16,415
0
$0
12
$46,840
FILES CLOSED FOR INCOMPLETENESS
2
$133,430
7
$80,963
54
$87,753
1
$15,000
0
$0
4
$67,160
Aggregated Statistics For Year 1999 (Based on 2 full and 5 partial tracts)
A) FHA, FSA/RHS & VA Home Purchase Loans
B) Conventional Home Purchase Loans
C) Refinancings
D) Home Improvement Loans
E) Loans on Dwellings For 5+ Families
F) Non-occupant Loans on < 5 Family Dwellings (A B C & D)
2002 - 2018 National Fire Incident Reporting System (NFIRS) incidents
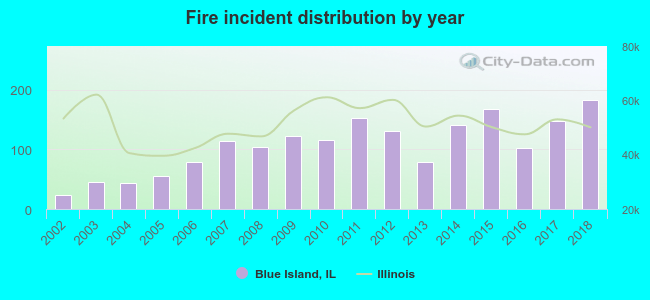
Based on the data from the years 2002 - 2018 the average number of fire incidents per year is 106. The highest number of reported fires - 182 took place in 2018, and the least - 24 in 2002. The data has a rising trend.
When looking into fire subcategories, the most reports belonged to: Structure Fires (53.5%), and Outside Fires (21.8%).
Fire incident types reported to NFIRS in Blue Island, IL
#54 on the list of "Top 101 cities with largest percentage of females in industries: transportation and warehousing (population 5,000+)"
#64 on the list of "Top 101 cities with the smallest racial income disparities between White and Black householders (with at least 2,000 householders)"
#74 on the list of "Top 101 cities with the most full-time local library workers per 1000 residents (population 5,000+)"
#22 (60827) on the list of "Top 101 zip codes with the lowest 2012 average net capital gain/loss (pop 5,000+)"
#68 (60472) on the list of "Top 101 zip codes with the largest percentage of Subsaharan African first ancestries"
#1 on the list of "Top 101 counties with the most Black Protestant congregations"
#1 on the list of "Top 101 counties with the most Catholic congregations"
#1 on the list of "Top 101 counties with the highest surface withdrawal of fresh water for public supply"
#2 on the list of "Top 101 counties with the most Black Protestant adherents"
#2 on the list of "Top 101 counties with the most Orthodox congregations (pop. 50,000+)"


 Recent articles from our blog. Our writers, many of them Ph.D. graduates or candidates, create easy-to-read articles on a wide variety of topics.

 (5.5 miles


 Based on the data from the years 2002 - 2018 the average number of fire incidents per year is 106. The highest number of reported fires - 182 took place in 2018, and the least - 24 in 2002. The data has a rising trend.
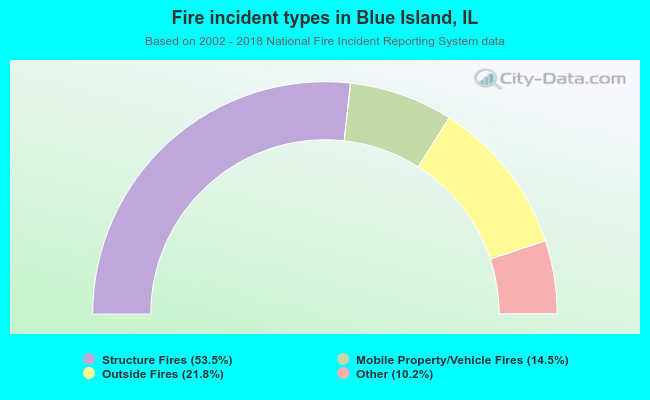 When looking into fire subcategories, the most reports belonged to: Structure Fires (53.5%), and Outside Fires (21.8%).