Estimated zip code population in 2022: 34,020 Zip code population in 2010: 34,882 Zip code population in 2000: 30,727
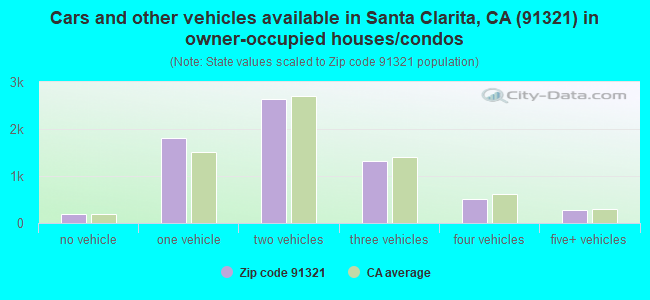
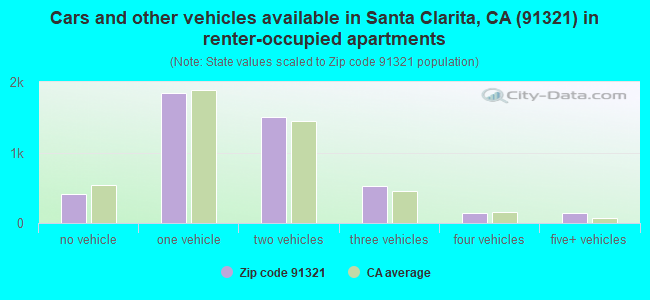
Houses and condos: 11,622 Renter-occupied apartments: 4,547
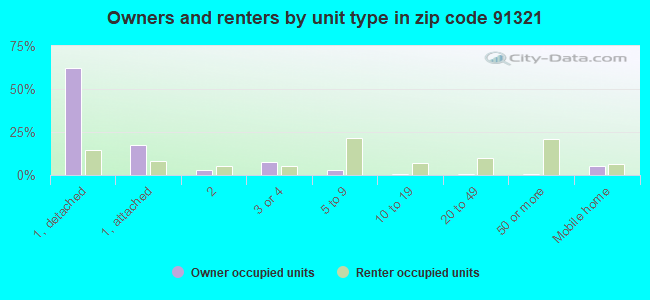
% of renters here:
40%
State:
44%
March 2022 cost of living index in zip code 91321: 133.7 (high, U.S. average is 100)
Land area: 25.9 sq. mi. Water area: 0.0 sq. mi.
Population density: 1,314 people per square mile
(low).
OSM Map
General Map
Google Map
MSN Map
OSM Map
General Map
Google Map
MSN Map
OSM Map
General Map
Google Map
MSN Map
OSM Map
General Map
Google Map
MSN Map
Please wait while loading the map...
Real estate property taxes paid for housing units in 2022:
This zip code:
0.8% ($5,166)
California:
0.7% ($4,831)
Median real estate property taxes paid for housing units with mortgages in 2022: $6,141 (0.9%) Median real estate property taxes paid for housing units with no mortgage in 2022: $3,886 (0.7%)
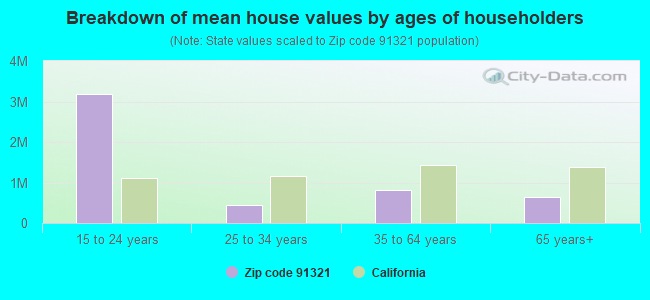
Estimated median house/condo value in 2022: $655,092
91321:
$655,092
California:
$715,900
According to our research of California and other state lists, there were 20 registered sex offenders living in 91321 zip code as of April 27, 2024. The ratio of all residents to sex offenders in zip code 91321 is 1,758 to 1. The ratio of registered sex offenders to all residents in this zip code is lower than the state average.
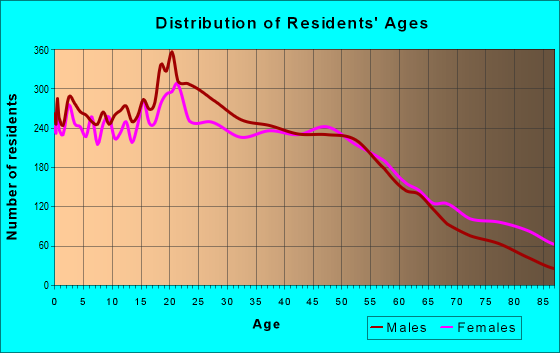
Median resident age:
This zip code:
34.4 years
California median age:
37.9 years
Average household size:
This zip code:
3.0 people
California:
2.8 people
Averages for the 2020 tax year for zip code 91321, filed in 2021:
Average Adjusted Gross Income (AGI) in 2020: $70,506 (Individual Income Tax Returns)
Here:
$70,506
State:
$95,910
Salary/wage: $61,340 (reported on 79.3% of returns)
Here:
$61,340
State:
$77,331
(% of AGI for various income ranges: 1307.0% for AGIs below $25k, 3920.9% for AGIs $25k-50k, 7087.2% for AGIs $50k-75k, 10720.8% for AGIs $75k-100k, 19552.8% for AGIs $100k-200k, 76054.1% for AGIs over 200k)
Taxable interest for individuals: $1,545 (reported on 33.6% of returns)
This zip code:
$1,545
California:
$2,294
(% of AGI for various income ranges: 14.4% for AGIs below $25k, 23.3% for AGIs $25k-50k, 49.4% for AGIs $50k-75k, 66.7% for AGIs $75k-100k, 148.6% for AGIs $100k-200k, 1557.8% for AGIs over 200k)
Ordinary dividends: $5,107 (reported on 15.8% of returns)
Here:
$5,107
State:
$10,949
(% of AGI for various income ranges: 21.9% for AGIs below $25k, 21.3% for AGIs $25k-50k, 64.9% for AGIs $50k-75k, 145.5% for AGIs $75k-100k, 235.2% for AGIs $100k-200k, 2501.9% for AGIs over 200k)
Net capital gain/loss in AGI: +$13,307 (reported on 16.1% of returns)
Here:
+$13,307
State:
+$49,306
(% of AGI for various income ranges: 3.8% for AGIs below $25k, 23.0% for AGIs $25k-50k, 91.6% for AGIs $50k-75k, 201.8% for AGIs $75k-100k, 540.7% for AGIs $100k-200k, 9034.4% for AGIs over 200k)
Profit/loss from business: +$11,666 (reported on 20.5% of returns)
Here:
+$11,666
State:
+$15,671
(% of AGI for various income ranges: 278.4% for AGIs below $25k, 224.8% for AGIs $25k-50k, 272.9% for AGIs $50k-75k, 369.0% for AGIs $75k-100k, 610.0% for AGIs $100k-200k, 3303.3% for AGIs over 200k)
Taxable individual retirement arrangement distribution: $17,941 (reported on 6.9% of returns)
91321:
$17,941
California:
$23,505
(% of AGI for various income ranges: 45.9% for AGIs below $25k, 80.5% for AGIs $25k-50k, 176.4% for AGIs $50k-75k, 298.2% for AGIs $75k-100k, 590.4% for AGIs $100k-200k, 1575.9% for AGIs over 200k)
Self-employed (Keogh) retirement plans: $17,578 (reported on 0.6% of returns)
91321:
$17,578
California:
$30,163
(% of AGI for various income ranges: 7.2% for AGIs $25k-50k, 24.6% for AGIs $100k-200k, 403.0% for AGIs over 200k)
Total itemized deductions: $31,936 (reported on 16.7% of returns)
Here:
$31,936
State:
$39,517
(% of AGI for various income ranges: 99.8% for AGIs below $25k, 237.4% for AGIs $25k-50k, 662.0% for AGIs $50k-75k, 1319.5% for AGIs $75k-100k, 2693.1% for AGIs $100k-200k, 8636.7% for AGIs over 200k)
Charity contributions: $6,930 (reported on 14.0% of returns)
Here:
$6,930
State:
$12,598
(% of AGI for various income ranges: 4.5% for AGIs below $25k, 24.5% for AGIs $25k-50k, 76.5% for AGIs $50k-75k, 197.0% for AGIs $75k-100k, 455.8% for AGIs $100k-200k, 2466.3% for AGIs over 200k)
Taxes paid: $8,735 (reported on 16.5% of returns)
91321:
$8,735
State:
$8,807
(% of AGI for various income ranges: 18.4% for AGIs below $25k, 63.4% for AGIs $25k-50k, 176.3% for AGIs $50k-75k, 402.5% for AGIs $75k-100k, 811.3% for AGIs $100k-200k, 1958.1% for AGIs over 200k)
Earned income credit: $2,078 (reported on 13.0% of returns)
Here:
$2,078
State:
$2,074
(% of AGI for various income ranges: 81.8% for AGIs below $25k, 59.5% for AGIs $25k-50k, 0.9% for AGIs $50k-75k)
Percentage of individuals using paid preparers for their 2020 taxes: 92.4%
Here:
92%
State:
92%
(% for various income ranges: 89.7% for AGIs below $25k, 92.3% for AGIs $25k-50k, 94.2% for AGIs $50k-75k, 94.3% for AGIs $75k-100k, 94.7% for AGIs $100k-200k, 95.3% for AGIs over 200k)
Averages for the 2012 tax year for zip code 91321, filed in 2013:
Average Adjusted Gross Income (AGI) in 2012: $55,949 (Individual Income Tax Returns)
Here:
$55,949
State:
$72,726
Salary/wage: $50,192 (reported on 81.6% of returns)
Here:
$50,192
State:
$59,079
(% of AGI for various income ranges: 73.8% for AGIs below $25k, 79.7% for AGIs $25k-50k, 75.1% for AGIs $50k-75k, 75.1% for AGIs $75k-100k, 76.3% for AGIs $100k-200k, 63.4% for AGIs over 200k)
Taxable interest for individuals: $1,168 (reported on 33.9% of returns)
This zip code:
$1,168
California:
$2,146
(% of AGI for various income ranges: 0.9% for AGIs below $25k, 0.5% for AGIs $25k-50k, 0.7% for AGIs $50k-75k, 0.5% for AGIs $75k-100k, 0.6% for AGIs $100k-200k, 1.0% for AGIs over 200k)
Ordinary dividends: $4,861 (reported on 16.2% of returns)
Here:
$4,861
State:
$9,308
(% of AGI for various income ranges: 1.1% for AGIs below $25k, 0.8% for AGIs $25k-50k, 1.0% for AGIs $50k-75k, 1.2% for AGIs $75k-100k, 1.0% for AGIs $100k-200k, 2.7% for AGIs over 200k)
Net capital gain/loss in AGI: +$3,578 (reported on 13.6% of returns)
Here:
+$3,578
State:
+$30,460
(% of AGI for various income ranges: 0.1% for AGIs $25k-50k, 0.4% for AGIs $75k-100k, 0.7% for AGIs $100k-200k, 2.7% for AGIs over 200k)
Profit/loss from business: +$13,621 (reported on 18.4% of returns)
Here:
+$13,621
State:
+$17,064
(% of AGI for various income ranges: 12.3% for AGIs below $25k, 5.6% for AGIs $25k-50k, 3.4% for AGIs $50k-75k, 3.1% for AGIs $75k-100k, 3.0% for AGIs $100k-200k, 3.4% for AGIs over 200k)
Taxable individual retirement arrangement distribution: $14,427 (reported on 8.5% of returns)
91321:
$14,427
California:
$19,557
(% of AGI for various income ranges: 2.6% for AGIs below $25k, 1.9% for AGIs $25k-50k, 2.5% for AGIs $50k-75k, 2.4% for AGIs $75k-100k, 2.3% for AGIs $100k-200k, 1.7% for AGIs over 200k)
Self-employment retirement plans: $19,578 (reported on 0.6% of returns)
91321:
$19,578
California:
$24,530
(% of AGI for various income ranges: 0.2% for AGIs $25k-50k, 0.2% for AGIs $100k-200k, 0.6% for AGIs over 200k)
Total itemized deductions: $29,523 (26% of AGI, reported on 34.7% of returns)
Here:
$29,523
State:
$34,004
Here:
26.3% of AGI
State:
22.7% of AGI
(% of AGI for various income ranges: 10.0% for AGIs below $25k, 12.4% for AGIs $25k-50k, 19.1% for AGIs $50k-75k, 22.5% for AGIs $75k-100k, 22.2% for AGIs $100k-200k, 18.3% for AGIs over 200k)
Charity contributions: $3,765 (reported on 29.9% of returns)
Here:
$3,765
State:
$4,659
(% of AGI for various income ranges: 0.5% for AGIs below $25k, 1.0% for AGIs $25k-50k, 2.0% for AGIs $50k-75k, 2.4% for AGIs $75k-100k, 2.3% for AGIs $100k-200k, 2.7% for AGIs over 200k)
Taxes paid: $10,911 (reported on 34.6% of returns)
91321:
$10,911
State:
$14,448
(% of AGI for various income ranges: 1.9% for AGIs below $25k, 3.1% for AGIs $25k-50k, 5.3% for AGIs $50k-75k, 7.3% for AGIs $75k-100k, 8.3% for AGIs $100k-200k, 9.8% for AGIs over 200k)
Earned income credit: $2,320 (reported on 15.9% of returns)
Here:
$2,320
State:
$2,286
(% of AGI for various income ranges: 5.0% for AGIs below $25k, 1.1% for AGIs $25k-50k)
Percentage of individuals using paid preparers for their 2012 taxes: 71.0%
Here:
71%
State:
64%
(% for various income ranges: 68.4% for AGIs below $25k, 72.4% for AGIs $25k-50k, 70.9% for AGIs $50k-75k, 74.3% for AGIs $75k-100k, 73.5% for AGIs $100k-200k, 80.9% for AGIs over 200k)
Averages for the 2004 tax year for zip code 91321, filed in 2005:
Average Adjusted Gross Income (AGI) in 2004: $54,422 (Individual Income Tax Returns)
Here:
$54,422
State:
$58,600
Salary/wage: $49,631 (reported on 81.6% of returns)
Here:
$49,631
State:
$49,455
(% of AGI for various income ranges: 188.3% for AGIs below $10k, 75.3% for AGIs $10k-25k, 79.5% for AGIs $25k-50k, 79.8% for AGIs $50k-75k, 79.3% for AGIs $75k-100k, 68.1% for AGIs over 100k)
Taxable interest for individuals: $1,667 (reported on 47.5% of returns)
This zip code:
$1,667
California:
$2,365
(% of AGI for various income ranges: 15.0% for AGIs below $10k, 2.2% for AGIs $10k-25k, 1.5% for AGIs $25k-50k, 1.1% for AGIs $50k-75k, 0.9% for AGIs $75k-100k, 1.4% for AGIs over 100k)
Taxable dividends: $3,077 (reported on 22.3% of returns)
Here:
$3,077
State:
$4,746
(% of AGI for various income ranges: 10.2% for AGIs below $10k, 1.4% for AGIs $10k-25k, 1.1% for AGIs $25k-50k, 0.7% for AGIs $50k-75k, 1.2% for AGIs $75k-100k, 1.4% for AGIs over 100k)
Net capital gain/loss: +$17,854 (reported on 19.3% of returns)
Here:
+$17,854
State:
+$23,418
(% of AGI for various income ranges: -0.9% for AGIs below $10k, 0.2% for AGIs $10k-25k, 0.5% for AGIs $25k-50k, 0.7% for AGIs $50k-75k, 1.6% for AGIs $75k-100k, 12.3% for AGIs over 100k)
Profit/loss from business: +$15,726 (reported on 17.8% of returns)
Here:
+$15,726
State:
+$16,826
(% of AGI for various income ranges: 15.1% for AGIs below $10k, 7.4% for AGIs $10k-25k, 5.3% for AGIs $25k-50k, 3.9% for AGIs $50k-75k, 4.8% for AGIs $75k-100k, 5.0% for AGIs over 100k)
IRA payment deduction: $3,169 (reported on 2.7% of returns)
91321:
$3,169
California:
$3,192
(% of AGI for various income ranges: 0.2% for AGIs $10k-25k, 0.2% for AGIs $25k-50k, 0.2% for AGIs $50k-75k, 0.2% for AGIs $75k-100k, 0.1% for AGIs over 100k)
Self-employed pension: $18,007 (reported on 1.1% of returns)
Here:
$18,007
California:
$17,688
(% of AGI for various income ranges: 0.1% for AGIs $25k-50k, 0.1% for AGIs $50k-75k, 0.4% for AGIs $75k-100k, 0.6% for AGIs over 100k)
Total itemized deductions: $32,854 (33% of AGI, reported on 42.1% of returns)
Here:
$32,854
State:
$28,113
Here:
33.2% of AGI
State:
25.3% of AGI
(% of AGI for various income ranges: 42.7% for AGIs below $10k, 12.7% for AGIs $10k-25k, 18.1% for AGIs $25k-50k, 23.0% for AGIs $50k-75k, 25.6% for AGIs $75k-100k, 30.4% for AGIs over 100k)
Charity contributions deductions: $4,228 (4% of AGI, reported on 37.9% of returns)
Here:
$4,228
State:
$3,923
Here:
4.0% of AGI
State:
3.3% of AGI
(% of AGI for various income ranges: 2.3% for AGIs below $10k, 1.1% for AGIs $10k-25k, 1.8% for AGIs $25k-50k, 2.4% for AGIs $50k-75k, 3.1% for AGIs $75k-100k, 3.8% for AGIs over 100k)
Total tax: $9,261 (reported on 73.7% of returns)
91321:
$9,261
State:
$10,761
(% of AGI for various income ranges: 8.7% for AGIs below $10k, 3.8% for AGIs $10k-25k, 6.5% for AGIs $25k-50k, 8.9% for AGIs $50k-75k, 9.8% for AGIs $75k-100k, 17.9% for AGIs over 100k)
Earned income credit: $1,741 (reported on 12.4% of returns)
Here:
$1,741
State:
$1,763
Percentage of individuals using paid preparers for their 2004 taxes: 72.5%
Here:
73%
State:
66%
(% for various income ranges: 62.3% for AGIs below $10k, 75.5% for AGIs $10k-25k, 72.2% for AGIs $25k-50k, 73.4% for AGIs $50k-75k, 76.3% for AGIs $75k-100k, 78.0% for AGIs over 100k)
Likely homosexual households (counted as self-reported same-sex unmarried-partner households)
Lesbian couples: 0.1% of all households
Gay men: 0.0% of all households
Household received Food Stamps/SNAP in the past 12 months: 1,108 Household did not receive Food Stamps/SNAP in the past 12 months: 10,085
Women who had a birth in the past 12 months: 501 (389 now married, 111 unmarried) Women who did not have a birth in the past 12 months: 7,860 (3,185 now married, 4,672 unmarried)
Housing units in zip code 91321 with a mortgage: 4,593 (396 second mortgage, 55 home equity loan, 273 both second mortgage and home equity loan) Houses without a mortgage: 37
Median monthly owner costs for units with a mortgage: $2,676 Median monthly owner costs for units without a mortgage: $901
Residents with income below the poverty level in 2022:
This zip code:
9.8%
Whole state:
12.2%
Residents with income below 50% of the poverty level in 2022:
This zip code:
6.3%
Whole state:
6.2%
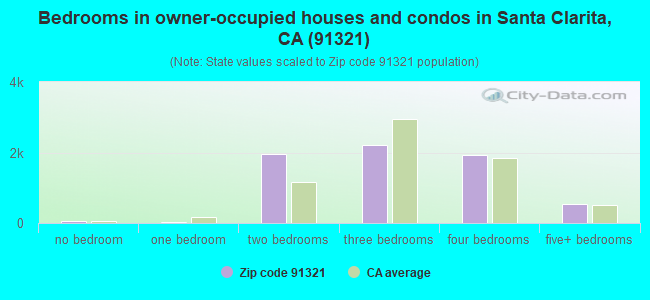
Median number of rooms in houses and condos:
Here:
5.9
State:
6.0
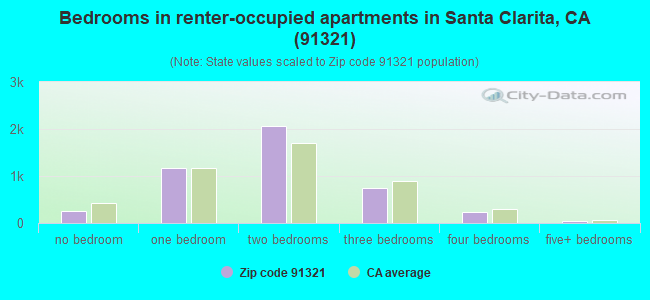
Median number of rooms in apartments:
Here:
3.8
State:
3.9
Notable locations in this zip code not listed on our city pages
Notable locations in zip code 91321: Live Oak Campground (A), Placeritos Ranch (B), Vista Valencia Golf Course (C), Friendly Valley Golf Course (D), Newhall Branch County of Los Angeles Public Library (E), Los Angeles County Fire Department Station 73 (F), R L Powell Library (G), Rutherford Hall (H), Hotchkiss Hall (I), Slight Hall (J), Bross Gymnasium (K). Display/hide their locations on the map
Churches in zip code 91321 include: Queen of Angels Catholic Church (A), First Presbyterian Church (B), Valley Worship Center (C), Centro De Amor Cristiano (D), Destiny Christian Center (E), Ministries of Encouragement (F), Home of Christ (G), Placerita Baptist Church (H), Village Church (I). Display/hide their locations on the map
Parks in zip code 91321 include: Placerita Canyon State Park (1), Emmaus Park (2), William S Hart Park (3), Placerita Nature Center (4). Display/hide their locations on the map
5,880 married couples with children.
1,908 single-parent households (655 men, 1,253 women).
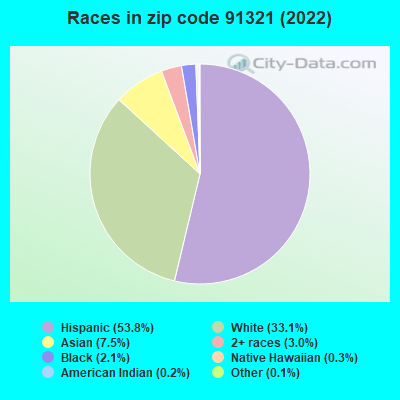
52.4% of residents of 91321 zip code speak English at home.
39.2% of residents speak Spanish at home (65% very well, 16% well, 14% not well, 5% not at all).
3.2% of residents speak other Indo-European language at home (78% very well, 17% well, 4% not well, 2% not at all).
4.3% of residents speak Asian or Pacific Island language at home (66% very well, 21% well, 11% not well, 2% not at all).
0.6% of residents speak other language at home (67% very well, 27% well, 5% not well).
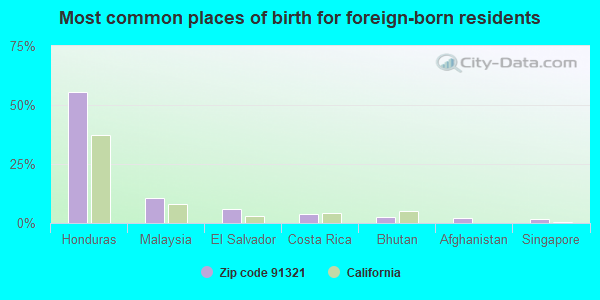
Foreign born population: 7,936 (23.3%) (52.4% of them are naturalized citizens)
This zip code:
23.3%
Whole state:
26.7%
56%Honduras
10%Malaysia
6%El Salvador
4%Costa Rica
3%Bhutan
2%Afghanistan
2%Singapore
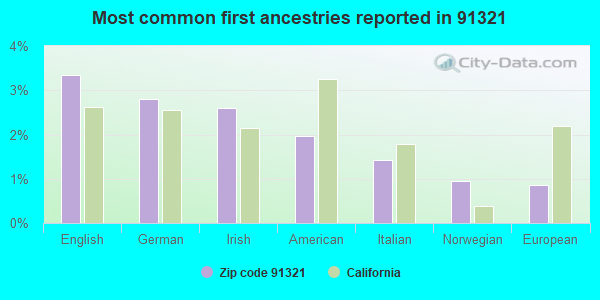
3%English
3%German
3%Irish
2%American
1%Italian
1%Norwegian
1%European
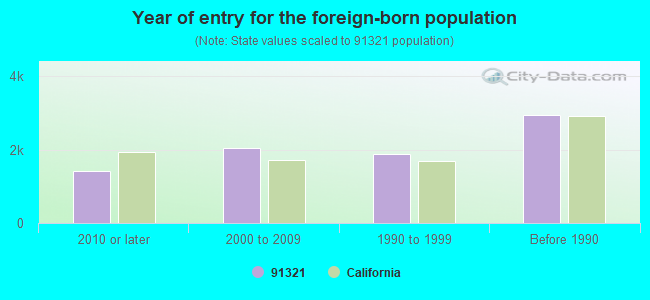
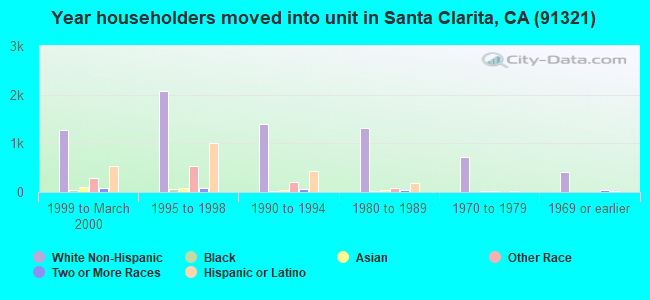
Year of entry for the foreign-born population
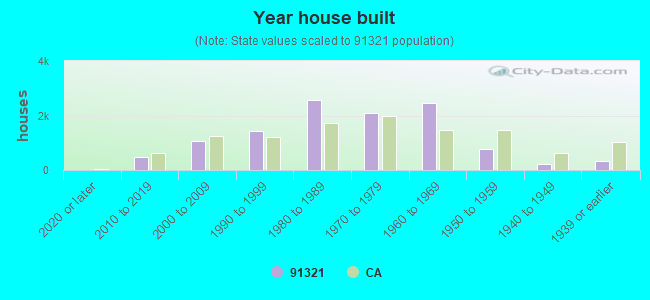
1,4282010 or later
2,0512000 to 2009
1,8701990 to 1999
2,941Before 1990
Major facilities with environmental interests located in this zip code:
AES PLACERITA (20885 PLACERITA CANYON RD in NEWHALL, CA)
AIR MAJOR (AIRS/AFS) STATE MASTER (California - Hazardous Waste Tracking) - HAZARDOU WASTE PROGRAM CRITERIA AND HAZARDOUS AIR POLLUTANT INVENTORY (Inventory of air pollution sources) AIR MAJOR ("Best Available" air pollution technologies tracking) Small Quantity Generators, between 100 kg and 1000 kg of hazardous waste/month (Resource Conservation and Recovery Act (tracking hazardous waste)) - notification Business SIC classification: ELECTRIC AND OTHER SERVICES COMBINED Organizations: A E S PLACERITA INC (CONTACT/OWNER)
Alternative names: A E S PLACERITA INC, AES PLACERITA, INC.
MILES CHEMICAL CO (24876 N APPLE ST STE F in NEWHALL, CA)
STATE MASTER (California - Hazardous Waste Tracking) - HAZARDOU WASTE PROGRAM (Resource Conservation and Recovery Act (tracking hazardous waste)) Organizations: ANTHONY MILES (CONTACT/OWNER)
MINNIE MAX CLEANERS (23214 LYONS AVE in NEWHALL, CA)
STATE MASTER (California - Hazardous Waste Tracking) - HAZARDOU WASTE PROGRAM Small Quantity Generators, between 100 kg and 1000 kg of hazardous waste/month (Resource Conservation and Recovery Act (tracking hazardous waste)) - notification Organizations: RAFAEL GARCIA (CONTACT/OWNER)
NEWHALL HARDWARE (24322 SAN FERNANDO RD in NEWHALL, CA)
STATE MASTER (California - Hazardous Waste Tracking) - HAZARDOU WASTE PROGRAM Small Quantity Generators, between 100 kg and 1000 kg of hazardous waste/month (Resource Conservation and Recovery Act (tracking hazardous waste)) - notification Organizations: DON F GUGLIELMINO (CONTACT/OWNER)
Alternative names: VICTOR E FEANY DBA NEWHALL HARDWARE
NEWHALL CO WATER DIST (23780 N PINE ST in SANTA CLARITA, CA)
STATE MASTER (California - Hazardous Waste Tracking) - HAZARDOU WASTE PROGRAM Small Quantity Generators, between 100 kg and 1000 kg of hazardous waste/month (Resource Conservation and Recovery Act (tracking hazardous waste)) - notification USED OIL PROGRAM (Resource Conservation and Recovery Act (tracking hazardous waste)) Organizations: NEWHALL COUNTY WATER DISTRICT (CONTACT/OWNER)
Alternative names: NEWHALL COUNTY WATER DIST
CARRIAGE CLEANERS (24140 LYONS AVE in NEWHALL, CA)
STATE MASTER (California - Hazardous Waste Tracking) - HAZARDOU WASTE PROGRAM Small Quantity Generators, between 100 kg and 1000 kg of hazardous waste/month (Resource Conservation and Recovery Act (tracking hazardous waste)) - notification Organizations: SUNG TAE KIM (CONTACT/OWNER)
J M G MOTOR SPORTS (24601 ARCH ST in NEWHALL, CA)
STATE MASTER (California - Hazardous Waste Tracking) - HAZARDOU WASTE PROGRAM Small Quantity Generators, between 100 kg and 1000 kg of hazardous waste/month (Resource Conservation and Recovery Act (tracking hazardous waste)) - notification Organizations: JOSEPH GAGE (CONTACT/OWNER)
MALAMS AUTO (24622 N PINE D THRU F in NEWHALL, CA)
STATE MASTER (California - Hazardous Waste Tracking) - HAZARDOU WASTE PROGRAM Small Quantity Generators, between 100 kg and 1000 kg of hazardous waste/month (Resource Conservation and Recovery Act (tracking hazardous waste)) - notification Organizations: TERRIL E MALAM (CONTACT/OWNER)
GERMAN AUTOHAUS (22510 9TH ST in NEWHALL, CA)
STATE MASTER (California - Hazardous Waste Tracking) - HAZARDOU WASTE PROGRAM Small Quantity Generators, between 100 kg and 1000 kg of hazardous waste/month (Resource Conservation and Recovery Act (tracking hazardous waste)) - notification Business NAICS classification: GENERAL AUTOMOTIVE REPAIR. Organizations: JOSEPH JASIK (CONTACT/OWNER)
NEWHALL ELEMENTARY (24607 N. WALNUT ST. in NEWHALL, CA)
(National Center for Education Statistics) - STATE ID-6020796
ENVIRONMENTAL CLEAN SOLUTIONS INC (24953 SAN FERNANDO RD in NEWHALL, CA)
Conditionally Exempt Small Quantity Generators, less than 100 kg/month of hazardous waste (Resource Conservation and Recovery Act (tracking hazardous waste)) TRANSPORTER (Resource Conservation and Recovery Act (tracking hazardous waste)) USED OIL PROGRAM (Resource Conservation and Recovery Act (tracking hazardous waste)) Organizations: RICK DEPAIVA (CONTACT/OPERATOR)
, MICHAEL STERN (CONTACT/OWNER)
EXXONMOBIL OIL CORP. (22917 LYONS AVE in NEWHALL, CA)
HAZARDOUS WASTE BIENNIAL REPORTER (Resource Conservation and Recovery Act (tracking hazardous waste)) Large Quantity Generators, more that 1000 kg of hazardous waste/month (Resource Conservation and Recovery Act (tracking hazardous waste)) Organizations: EXXONMOBIL OIL CORPORATION (CONTACT/OWNER)
A&H RADIATOR SERVICE (24605 SAN FERNANDO in NEWHALL, CA)
Small Quantity Generators, between 100 kg and 1000 kg of hazardous waste/month (Resource Conservation and Recovery Act (tracking hazardous waste)) Organizations: P HOGANSON & C HALASZ (CONTACT/OWNER)
Housing units lacking complete plumbing facilities: 0.8% Housing units lacking complete kitchen facilities: 2.9%
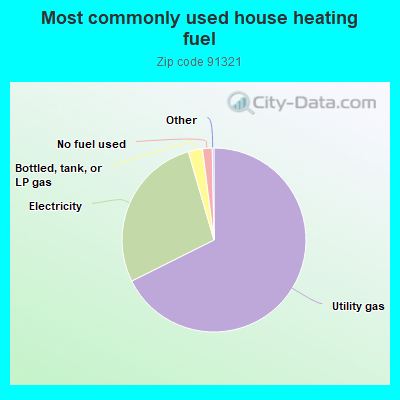
67.7%Utility gas
27.9%Electricity
2.5%Bottled, tank, or LP gas
1.7%No fuel used
Population in 1990: 23,520. Population change in the 1990s: +7,207 (+30.6%).
Place of birth for U.S.-born residents:
This state: 21,367
Northeast: 1,288
Midwest: 1,522
South: 773
West: 714
52% of the 91321 zip code residents lived in the same house 5 years ago. Out of people who lived in different houses, 78% lived in this county. Out of people who lived in different counties, 50% lived in California.
93% of the 91321 zip code residents lived in the same house 1 year ago. Out of people who lived in different houses, 83% moved from this county. Out of people who lived in different houses, 10% moved from different county within same state. Out of people who lived in different houses, 3% moved from different state. Out of people who lived in different houses, 4% moved from abroad.
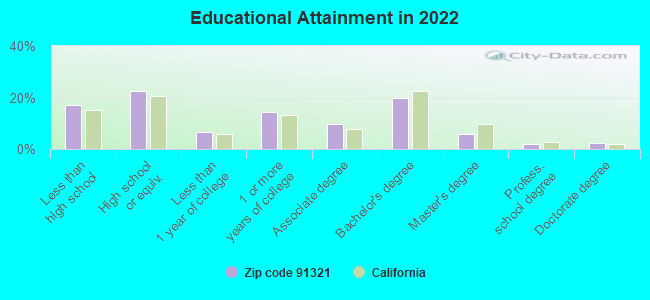
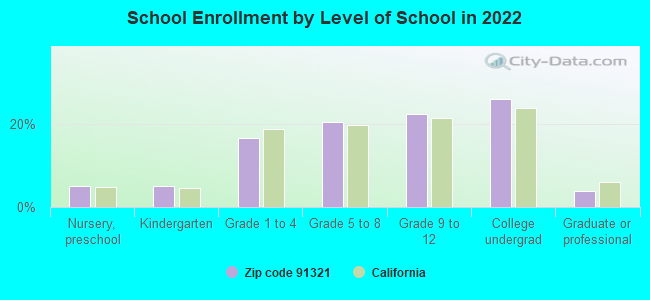
Private vs. public school enrollment:
Students in private schools in grades 1 to 8 (elementary and middle school): 291
Here:
8.3%
California:
10.5%
Students in private schools in grades 9 to 12 (high school): 71
Here:
3.4%
California:
8.5%
Students in private undergraduate colleges: 864
Here:
35.1%
California:
15.9%
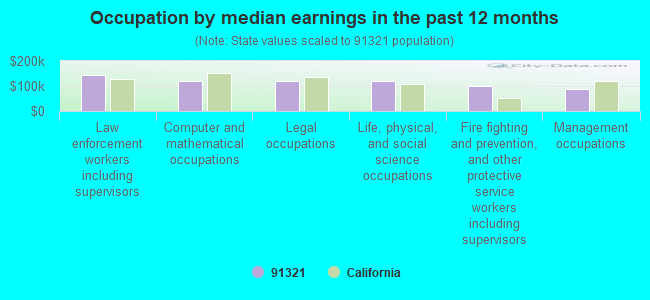
Occupation by median earnings in the past 12 months ($)
143,103Law enforcement workers including supervisors
121,185Computer and mathematical occupations
119,487Legal occupations
118,632Life, physical, and social science occupations
101,550Fire fighting and prevention, and other protective service workers including supervisors
89,410Management occupations
Companies with federal contracts located in this zip code:
RODGERS, STEVEN R GENERAL ENGI (2221 12TH ST LOT 10 in NEWHALL, CA; small business) : $871,000 in 3 contractsfrom 2001 to 2002
$353,000 with Forest Service (disused code: now 12C2) for Construction of Structures and Facilities -- Recreation Facilities (Non-Building). Signed on 2002-06-15. Completion date: 2002-12-15.
$353,000, same as above.Signed on 2002-06-15. Completion date: 2002-09-15.
$165,000 with Forest Service (disused code: now 12C2) for Construction of Structures and Facilities -- Highways, Roads, Streets, Bridges, and Railways (includes resurfacing). Signed on 2001-09-15. Completion date: 2002-06-15.
A-V ENVIRONMENTAL SITE SERVICE (24265 LA GLORITA CIRCLE in SANTA CLARITA, CA; small business) : $98,204 in 8 contractsfrom 2003 to 2005
Contracts for Maintenance, Repair or Alteration of Real Property -- Highways, Roads, Streets, Bridges, and Railways (includes resurfacing), Other Housekeeping Services by Navy Signed by year:2000: $0; 2001: $0; 2002: $0; 2003: $31,372; 2004: $27,864; 2005: $38,968; 2006: $0.
Biggest contracts:
$31,372 with Navy for Maintenance, Repair or Alteration of Real Property -- Highways, Roads, Streets, Bridges, and Railways (includes resurfacing). Signed on 2003-04-22. Completion date: 2004-04-30.
$28,704 with Navy for Other Housekeeping Services. Signed on 2005-04-12. Completion date: 2004-04-30.
$27,864 with Navy for Maintenance, Repair or Alteration of Real Property -- Highways, Roads, Streets, Bridges, and Railways (includes resurfacing). Signed on 2004-04-22. Completion date: 2004-04-30.
$7,504 with Navy for Other Housekeeping Services. Signed on 2005-08-04. Completion date: 2004-04-30.
MASTERS COLLEGE AND SEMINARY, (21726 PLACERITA CANYON RD in SANTA CLARITA, CA)
$34,000 with Army for Educational Services. Signed on 2004-09-23. Completion date: 2004-09-23.
H & B AIRCRAFT PARTS INC (24887 SAN FERNANDO RD in SANTA CLARITA, CA; small business)
$4,950 with Navy for Studs. Signed on 2004-03-15. Completion date: 2004-03-19.
Top industries in this zip code by the number of employees in 2005:


 Nearest zip codes: 91350, 91344, 91351, 91340, 91345, 91326.