Estimated zip code population in 2022: 58,399 Zip code population in 2010: 61,386 Zip code population in 2000: 62,659
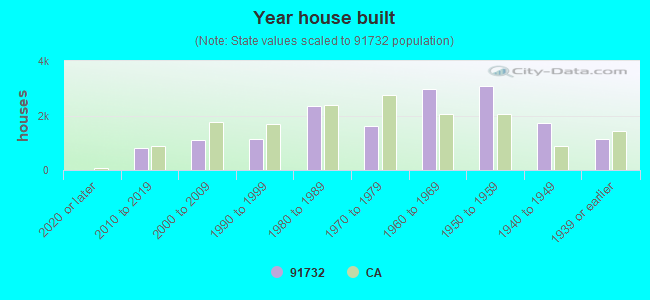
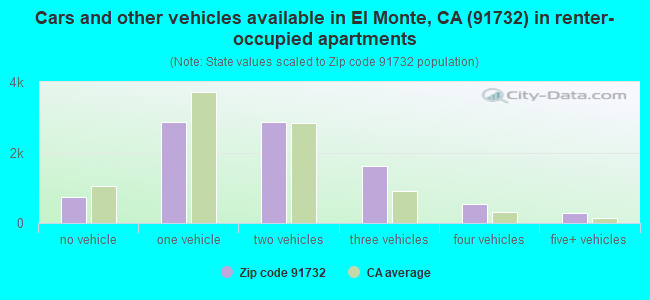
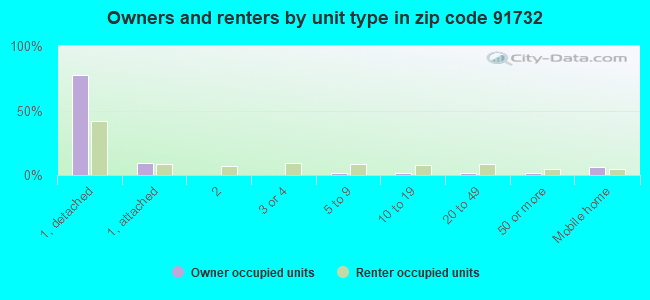
Houses and condos: 16,235 Renter-occupied apartments: 8,952
% of renters here:
56%
State:
44%
March 2022 cost of living index in zip code 91732: 137.3 (high, U.S. average is 100)
Land area: 4.6 sq. mi. Water area: 0.1 sq. mi.
Population density: 12,654 people per square mile
(very high).
OSM Map
General Map
Google Map
MSN Map
OSM Map
General Map
Google Map
MSN Map
OSM Map
General Map
Google Map
MSN Map
OSM Map
General Map
Google Map
MSN Map
Please wait while loading the map...
Real estate property taxes paid for housing units in 2022:
This zip code:
0.7% ($4,851)
California:
0.7% ($4,831)
Median real estate property taxes paid for housing units with mortgages in 2022: $5,788 (0.9%) Median real estate property taxes paid for housing units with no mortgage in 2022: $3,806 (0.6%)
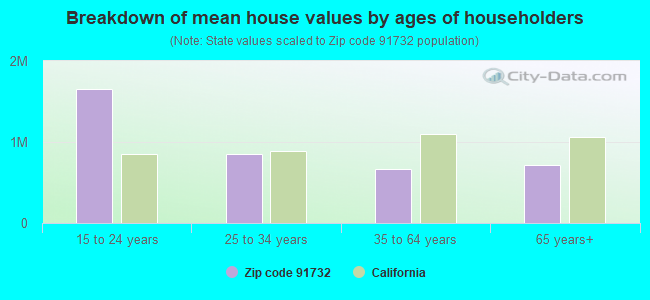
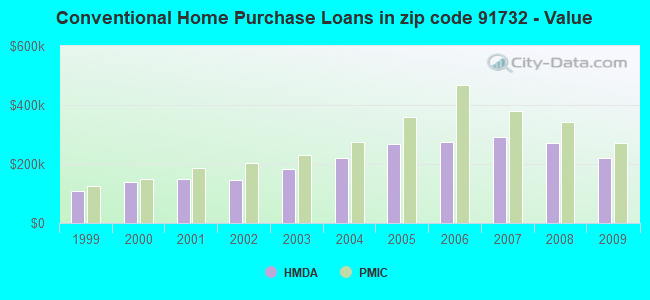
Estimated median house/condo value in 2022: $656,178
91732:
$656,178
California:
$715,900
According to our research of California and other state lists, there were 101 registered sex offenders living in 91732 zip code as of April 26, 2024. The ratio of all residents to sex offenders in zip code 91732 is 631 to 1. The ratio of registered sex offenders to all residents in this zip code is near the state average.
Median resident age:
This zip code:
38.2 years
California median age:
37.9 years
Average household size:
This zip code:
3.6 people
California:
2.8 people
Averages for the 2020 tax year for zip code 91732, filed in 2021:
Average Adjusted Gross Income (AGI) in 2020: $40,007 (Individual Income Tax Returns)
Here:
$40,007
State:
$95,910
Salary/wage: $37,924 (reported on 83.2% of returns)
Here:
$37,924
State:
$77,331
(% of AGI for various income ranges: 1245.0% for AGIs below $25k, 4066.3% for AGIs $25k-50k, 7710.0% for AGIs $50k-75k, 11450.9% for AGIs $75k-100k, 20897.8% for AGIs $100k-200k, 83614.0% for AGIs over 200k)
Taxable interest for individuals: $748 (reported on 18.3% of returns)
This zip code:
$748
California:
$2,294
(% of AGI for various income ranges: 8.8% for AGIs below $25k, 10.6% for AGIs $25k-50k, 22.6% for AGIs $50k-75k, 56.9% for AGIs $75k-100k, 90.5% for AGIs $100k-200k, 1142.0% for AGIs over 200k)
Ordinary dividends: $1,293 (reported on 7.3% of returns)
Here:
$1,293
State:
$10,949
(% of AGI for various income ranges: 3.8% for AGIs below $25k, 4.5% for AGIs $25k-50k, 11.2% for AGIs $50k-75k, 40.1% for AGIs $75k-100k, 93.4% for AGIs $100k-200k, 1216.0% for AGIs over 200k)
Net capital gain/loss in AGI: +$8,084 (reported on 9.2% of returns)
Here:
+$8,084
State:
+$49,306
(% of AGI for various income ranges: 4.1% for AGIs below $25k, 10.1% for AGIs $25k-50k, 53.5% for AGIs $50k-75k, 143.8% for AGIs $75k-100k, 664.6% for AGIs $100k-200k, 23386.0% for AGIs over 200k)
Profit/loss from business: +$8,274 (reported on 19.1% of returns)
Here:
+$8,274
State:
+$15,671
(% of AGI for various income ranges: 241.0% for AGIs below $25k, 173.0% for AGIs $25k-50k, 221.0% for AGIs $50k-75k, 205.9% for AGIs $75k-100k, 455.7% for AGIs $100k-200k, 5776.0% for AGIs over 200k)
Taxable individual retirement arrangement distribution: $12,544 (reported on 2.2% of returns)
91732:
$12,544
California:
$23,505
(% of AGI for various income ranges: 12.2% for AGIs below $25k, 22.4% for AGIs $25k-50k, 54.6% for AGIs $50k-75k, 96.2% for AGIs $75k-100k, 360.5% for AGIs $100k-200k)
Total itemized deductions: $28,063 (reported on 5.8% of returns)
Here:
$28,063
State:
$39,517
(% of AGI for various income ranges: 32.9% for AGIs below $25k, 119.2% for AGIs $25k-50k, 358.4% for AGIs $50k-75k, 686.3% for AGIs $75k-100k, 1543.7% for AGIs $100k-200k, 14434.0% for AGIs over 200k)
Charity contributions: $4,106 (reported on 4.1% of returns)
Here:
$4,106
State:
$12,598
(% of AGI for various income ranges: 0.8% for AGIs below $25k, 10.4% for AGIs $25k-50k, 36.8% for AGIs $50k-75k, 78.1% for AGIs $75k-100k, 188.9% for AGIs $100k-200k, 1558.0% for AGIs over 200k)
Taxes paid: $8,267 (reported on 5.8% of returns)
91732:
$8,267
State:
$8,807
(% of AGI for various income ranges: 9.3% for AGIs below $25k, 37.6% for AGIs $25k-50k, 116.0% for AGIs $50k-75k, 227.7% for AGIs $75k-100k, 519.6% for AGIs $100k-200k, 1904.0% for AGIs over 200k)
Earned income credit: $2,162 (reported on 23.7% of returns)
Here:
$2,162
State:
$2,074
(% of AGI for various income ranges: 115.1% for AGIs below $25k, 81.0% for AGIs $25k-50k, 1.4% for AGIs $50k-75k)
Percentage of individuals using paid preparers for their 2020 taxes: 90.2%
Here:
90%
State:
92%
(% for various income ranges: 88.3% for AGIs below $25k, 91.2% for AGIs $25k-50k, 92.5% for AGIs $50k-75k, 90.9% for AGIs $75k-100k, 90.9% for AGIs $100k-200k, 95.7% for AGIs over 200k)
Averages for the 2012 tax year for zip code 91732, filed in 2013:
Average Adjusted Gross Income (AGI) in 2012: $31,099 (Individual Income Tax Returns)
Here:
$31,099
State:
$72,726
Salary/wage: $30,377 (reported on 86.5% of returns)
Here:
$30,377
State:
$59,079
(% of AGI for various income ranges: 78.9% for AGIs below $25k, 89.5% for AGIs $25k-50k, 88.0% for AGIs $50k-75k, 85.4% for AGIs $75k-100k, 83.6% for AGIs $100k-200k, 51.5% for AGIs over 200k)
Taxable interest for individuals: $451 (reported on 18.8% of returns)
This zip code:
$451
California:
$2,146
(% of AGI for various income ranges: 0.3% for AGIs below $25k, 0.2% for AGIs $25k-50k, 0.2% for AGIs $50k-75k, 0.3% for AGIs $75k-100k, 0.5% for AGIs $100k-200k, 0.4% for AGIs over 200k)
Ordinary dividends: $1,298 (reported on 5.1% of returns)
Here:
$1,298
State:
$9,308
(% of AGI for various income ranges: 0.2% for AGIs below $25k, 0.1% for AGIs $25k-50k, 0.2% for AGIs $50k-75k, 0.2% for AGIs $75k-100k, 0.5% for AGIs $100k-200k, 0.6% for AGIs over 200k)
Profit/loss from business: +$9,880 (reported on 17.7% of returns)
Here:
+$9,880
State:
+$17,064
(% of AGI for various income ranges: 13.8% for AGIs below $25k, 4.1% for AGIs $25k-50k, 2.6% for AGIs $50k-75k, 2.1% for AGIs $75k-100k, 2.7% for AGIs $100k-200k)
Taxable individual retirement arrangement distribution: $10,881 (reported on 2.4% of returns)
91732:
$10,881
California:
$19,557
(% of AGI for various income ranges: 0.7% for AGIs below $25k, 0.6% for AGIs $25k-50k, 0.8% for AGIs $50k-75k, 1.2% for AGIs $75k-100k, 1.7% for AGIs $100k-200k)
Total itemized deductions: $20,647 (32% of AGI, reported on 18.9% of returns)
Here:
$20,647
State:
$34,004
Here:
32.3% of AGI
State:
22.7% of AGI
(% of AGI for various income ranges: 5.1% for AGIs below $25k, 10.6% for AGIs $25k-50k, 15.5% for AGIs $50k-75k, 18.5% for AGIs $75k-100k, 19.7% for AGIs $100k-200k, 21.9% for AGIs over 200k)
Charity contributions: $2,168 (reported on 13.8% of returns)
Here:
$2,168
State:
$4,659
(% of AGI for various income ranges: 0.2% for AGIs below $25k, 0.8% for AGIs $25k-50k, 1.2% for AGIs $50k-75k, 1.5% for AGIs $75k-100k, 1.8% for AGIs $100k-200k, 1.5% for AGIs over 200k)
Taxes paid: $6,364 (reported on 18.8% of returns)
91732:
$6,364
State:
$14,448
(% of AGI for various income ranges: 1.1% for AGIs below $25k, 2.7% for AGIs $25k-50k, 4.6% for AGIs $50k-75k, 6.3% for AGIs $75k-100k, 7.6% for AGIs $100k-200k, 8.6% for AGIs over 200k)
Earned income credit: $2,484 (reported on 33.7% of returns)
Here:
$2,484
State:
$2,286
(% of AGI for various income ranges: 9.1% for AGIs below $25k, 1.7% for AGIs $25k-50k)
Percentage of individuals using paid preparers for their 2012 taxes: 75.0%
Here:
75%
State:
64%
(% for various income ranges: 73.6% for AGIs below $25k, 77.4% for AGIs $25k-50k, 76.6% for AGIs $50k-75k, 73.7% for AGIs $75k-100k, 74.3% for AGIs $100k-200k, 83.3% for AGIs over 200k)
Averages for the 2004 tax year for zip code 91732, filed in 2005:
Average Adjusted Gross Income (AGI) in 2004: $27,724 (Individual Income Tax Returns)
Here:
$27,724
State:
$58,600
Salary/wage: $27,360 (reported on 89.2% of returns)
Here:
$27,360
State:
$49,455
(% of AGI for various income ranges: 98.5% for AGIs below $10k, 86.7% for AGIs $10k-25k, 92.2% for AGIs $25k-50k, 91.7% for AGIs $50k-75k, 88.2% for AGIs $75k-100k, 65.7% for AGIs over 100k)
Taxable interest for individuals: $693 (reported on 25.4% of returns)
This zip code:
$693
California:
$2,365
(% of AGI for various income ranges: 1.8% for AGIs below $10k, 0.5% for AGIs $10k-25k, 0.4% for AGIs $25k-50k, 0.5% for AGIs $50k-75k, 0.7% for AGIs $75k-100k, 1.4% for AGIs over 100k)
Taxable dividends: $827 (reported on 6.3% of returns)
Here:
$827
State:
$4,746
(% of AGI for various income ranges: 0.4% for AGIs below $10k, 0.2% for AGIs $10k-25k, 0.1% for AGIs $25k-50k, 0.2% for AGIs $50k-75k, 0.2% for AGIs $75k-100k, 0.3% for AGIs over 100k)
Net capital gain/loss: +$6,733 (reported on 6.2% of returns)
Here:
+$6,733
State:
+$23,418
(% of AGI for various income ranges: -0.9% for AGIs below $10k, -0.1% for AGIs $10k-25k, -0.1% for AGIs $25k-50k, 0.2% for AGIs $50k-75k, 1.6% for AGIs $75k-100k, 14.0% for AGIs over 100k)
Profit/loss from business: +$8,671 (reported on 14.7% of returns)
Here:
+$8,671
State:
+$16,826
(% of AGI for various income ranges: 20.0% for AGIs below $10k, 8.0% for AGIs $10k-25k, 3.5% for AGIs $25k-50k, 1.6% for AGIs $50k-75k, 1.9% for AGIs $75k-100k, 3.8% for AGIs over 100k)
IRA payment deduction: $3,088 (reported on 2.5% of returns)
91732:
$3,088
California:
$3,192
(% of AGI for various income ranges: 0.2% for AGIs below $10k, 0.2% for AGIs $10k-25k, 0.3% for AGIs $25k-50k, 0.3% for AGIs $50k-75k, 0.3% for AGIs $75k-100k, 0.2% for AGIs over 100k)
Self-employed pension: $9,115 (reported on 0.1% of returns)
Here:
$9,115
California:
$17,688
Total itemized deductions: $17,556 (33% of AGI, reported on 22.6% of returns)
Here:
$17,556
State:
$28,113
Here:
33.2% of AGI
State:
25.3% of AGI
(% of AGI for various income ranges: 7.4% for AGIs below $10k, 6.6% for AGIs $10k-25k, 14.3% for AGIs $25k-50k, 19.0% for AGIs $50k-75k, 20.3% for AGIs $75k-100k, 19.6% for AGIs over 100k)
Charity contributions deductions: $2,006 (4% of AGI, reported on 18.4% of returns)
Here:
$2,006
State:
$3,923
Here:
3.6% of AGI
State:
3.3% of AGI
(% of AGI for various income ranges: 0.2% for AGIs below $10k, 0.4% for AGIs $10k-25k, 1.2% for AGIs $25k-50k, 1.8% for AGIs $50k-75k, 2.2% for AGIs $75k-100k, 2.7% for AGIs over 100k)
Total tax: $2,892 (reported on 59.1% of returns)
91732:
$2,892
State:
$10,761
(% of AGI for various income ranges: 4.2% for AGIs below $10k, 3.2% for AGIs $10k-25k, 4.7% for AGIs $25k-50k, 7.1% for AGIs $50k-75k, 9.3% for AGIs $75k-100k, 14.0% for AGIs over 100k)
Earned income credit: $1,958 (reported on 31.4% of returns)
Here:
$1,958
State:
$1,763
Percentage of individuals using paid preparers for their 2004 taxes: 74.6%
Here:
75%
State:
66%
(% for various income ranges: 68.8% for AGIs below $10k, 77.5% for AGIs $10k-25k, 75.8% for AGIs $25k-50k, 74.1% for AGIs $50k-75k, 70.4% for AGIs $75k-100k, 75.5% for AGIs over 100k)
Likely homosexual households (counted as self-reported same-sex unmarried-partner households)
Lesbian couples: 0.3% of all households
Gay men: 0.0% of all households
Household received Food Stamps/SNAP in the past 12 months: 3,736 Household did not receive Food Stamps/SNAP in the past 12 months: 12,517
Women who had a birth in the past 12 months: 478 (288 now married, 190 unmarried) Women who did not have a birth in the past 12 months: 13,767 (4,366 now married, 9,446 unmarried)
Housing units in zip code 91732 with a mortgage: 3,935 (299 second mortgage, 11 home equity loan, 220 both second mortgage and home equity loan) Houses without a mortgage: 68
Median monthly owner costs for units with a mortgage: $2,315 Median monthly owner costs for units without a mortgage: $621
Residents with income below the poverty level in 2022:
This zip code:
16.5%
Whole state:
12.2%
Residents with income below 50% of the poverty level in 2022:
This zip code:
8.9%
Whole state:
6.2%
Median number of rooms in houses and condos:
Here:
5.4
State:
6.0
Median number of rooms in apartments:
Here:
4.1
State:
3.9
Notable locations in this zip code not listed on our city pages
Notable locations in zip code 91732: Norwood Branch County of Los Angeles Public Library (A), MacLaren Hall (B), Los Angeles County Fire Department Station 169 (C), Los Angeles County Fire Department Station 168 (D), Los Angeles County Fire Department Station 167 (E). Display/hide their locations on the map
Churches in zip code 91732 include: Assembly Pentecostal Church (A), Calvary Southern Baptist Church (B), Community Presbyterian Church (C), Divine Light Presbyterian Church (D), Estudiando Las Escrituras (E), Evangelical Methodist Church (F), Los Angeles Hanmi Presbyterian Church (G), Principe De Paz Wesleyan Church (H), Truth Chinese Alliance Church (I). Display/hide their locations on the map
5,760 married couples with children.
3,721 single-parent households (1,555 men, 2,166 women).
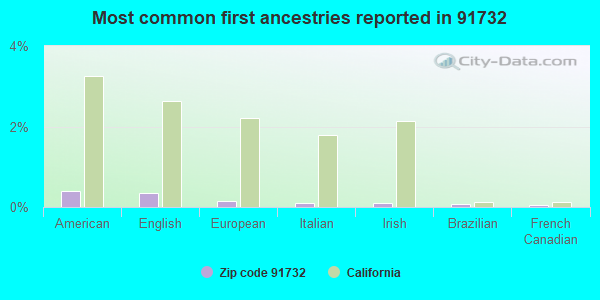
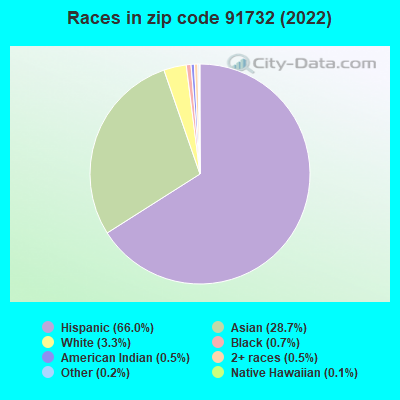
18.2% of residents of 91732 zip code speak English at home.
55.2% of residents speak Spanish at home (57% very well, 13% well, 18% not well, 12% not at all).
0.2% of residents speak other Indo-European language at home (77% very well, 20% well, 3% not well).
26.1% of residents speak Asian or Pacific Island language at home (32% very well, 24% well, 28% not well, 15% not at all).
0.4% of residents speak other language at home (18% very well, 82% not at all).
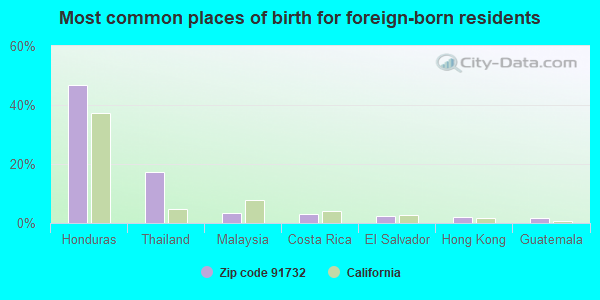
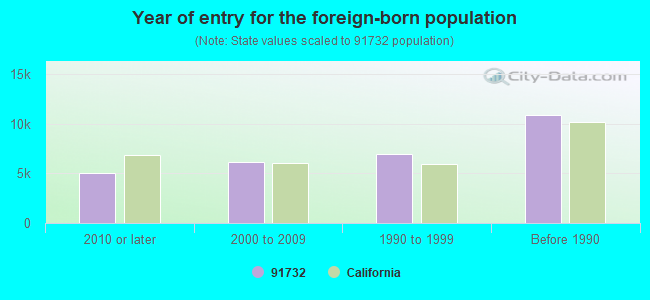
Foreign born population: 28,585 (48.9%) (51.9% of them are naturalized citizens)
Major facilities with environmental interests located in this zip code:
KOTOFF AND COMPANY INCORPORATED (2620 DURFEE AVENUE in EL MONTE, CA)
STATE MASTER (California - Hazardous Waste Tracking) - HAZARDOU WASTE PROGRAM CRITERIA AND HAZARDOUS AIR POLLUTANT INVENTORY (Inventory of air pollution sources) HAZARDOUS WASTE BIENNIAL REPORTER (Resource Conservation and Recovery Act (tracking hazardous waste)) Small Quantity Generators, between 100 kg and 1000 kg of hazardous waste/month (Resource Conservation and Recovery Act (tracking hazardous waste)) TRI REPORTER (Tracking of toxic chemicals releasing facilities) Business SIC and NAICS classification: ELECTROPLATING, PLATING, POLISHING, ANODIZING, AND COLORING Organizations: MARYANN KOTOFF (CONTACT/OPERATOR)
Alternative names: KOLOFF & COMPANY
MCCONNELL CABINETS INCORPORATED (3017 N. RUMFORD AVE. in EL MONTE, CA)
AIR MAJOR (AIRS/AFS) STATE MASTER (California - Hazardous Waste Tracking) - HAZARDOU WASTE PROGRAM CRITERIA AND HAZARDOUS AIR POLLUTANT INVENTORY (Inventory of air pollution sources) Small Quantity Generators, between 100 kg and 1000 kg of hazardous waste/month (Resource Conservation and Recovery Act (tracking hazardous waste)) TRI REPORTER (Tracking of toxic chemicals releasing facilities) Business SIC classification: WOOD KITCHEN CABINETS; WOOD HOUSEHOLD FURNITURE, EXCEPT UPHOLSTERED; NONCLASSIFIABLE ESTABLISHMENTS Business NAICS classification: NONUPHOLSTERED WOOD HOUSEHOLD FURNITURE MANUFACTURING.
MAJOR CLEANUP INC (3150 MAXSON RD in EL MONTE, CA)
STATE MASTER (California - Hazardous Waste Tracking) - HAZARDOU WASTE PROGRAM TRANSPORTER (Resource Conservation and Recovery Act (tracking hazardous waste)) Organizations: LAWRENCE POLZIN (CONTACT/OWNER)
A AND J AUTO RPR (2717 S PECK in EL MONTE, CA)
STATE MASTER (California - Hazardous Waste Tracking) - HAZARDOU WASTE PROGRAM Small Quantity Generators, between 100 kg and 1000 kg of hazardous waste/month (Resource Conservation and Recovery Act (tracking hazardous waste)) - notification Organizations: ALEX PALACIOS (CONTACT/OWNER)
FIVE POINT AUTO SALVAGE (11847 VALLEY BLVD in EL MONTE, CA)
STATE MASTER (California - Hazardous Waste Tracking) - HAZARDOU WASTE PROGRAM Small Quantity Generators, between 100 kg and 1000 kg of hazardous waste/month (Resource Conservation and Recovery Act (tracking hazardous waste)) - notification Organizations: YOUNG S LEE (CONTACT/OWNER)
ANZON CO (12326 DENHOLM DR in EL MONTE, CA)
STATE MASTER (California - Hazardous Waste Tracking) - HAZARDOU WASTE PROGRAM Small Quantity Generators, between 100 kg and 1000 kg of hazardous waste/month (Resource Conservation and Recovery Act (tracking hazardous waste)) Business NAICS classification: OTHER COMMERCIAL AND SERVICE INDUSTRY MACHINERY MANUFACTURING.
HARLOW PLATING CO (12240 MAGNOLIA AVE in EL MONTE, CA)
STATE MASTER (California - Hazardous Waste Tracking) - HAZARDOU WASTE PROGRAM Small Quantity Generators, between 100 kg and 1000 kg of hazardous waste/month (Resource Conservation and Recovery Act (tracking hazardous waste)) Business NAICS classification: ELECTROPLATING, PLATING, POLISHING, ANODIZING, AND COLORING.
MORENO AUTO (12312 RAMONA BLVD in EL MONTE, CA)
STATE MASTER (California - Hazardous Waste Tracking) - HAZARDOU WASTE PROGRAM Small Quantity Generators, between 100 kg and 1000 kg of hazardous waste/month (Resource Conservation and Recovery Act (tracking hazardous waste)) - notification Business NAICS classification: AUTOMOTIVE TRANSMISSION REPAIR.
LA PRIMARIA ELEMENTARY (4220 GILMAN ROAD in EL MONTE, CA)
(National Center for Education Statistics) - STATE ID-6020721 Organizations: MOUNTAIN VIEW ELEMENTARY (SCHOOL DISTRICT)
MADRID (ALFRED S.) MIDDLE (3300 GILMAN ROAD in EL MONTE, CA)
(National Center for Education Statistics) - STATE ID-6110571 Organizations: MOUNTAIN VIEW ELEMENTARY (SCHOOL DISTRICT)
MAXSON ELEMENTARY (12380 FELIPE ST. in EL MONTE, CA)
(National Center for Education Statistics) - STATE ID-6020747 Organizations: MOUNTAIN VIEW ELEMENTARY (SCHOOL DISTRICT)
CHERRYLEE ELEMENTARY (5025 BUFFINGTON ROAD in EL MONTE, CA)
(National Center for Education Statistics) - STATE ID-6013130 Organizations: EL MONTE CITY ELEMENTARY (SCHOOL DISTRICT)
BAKER ELEMENTARY (12043 EXLINE ST. in EL MONTE, CA)
(National Center for Education Statistics) - STATE ID-6020697 Organizations: MOUNTAIN VIEW ELEMENTARY (SCHOOL DISTRICT)
Housing units lacking complete plumbing facilities: 0.9% Housing units lacking complete kitchen facilities: 2.2%
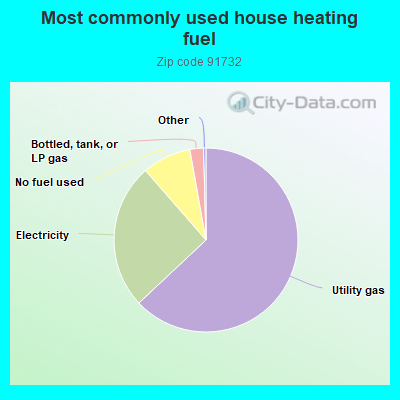
63.0%Utility gas
25.6%Electricity
8.6%No fuel used
2.4%Bottled, tank, or LP gas
Population in 1990: 58,059. Population change in the 1990s: +4,600 (+7.9%).
Place of birth for U.S.-born residents:
This state: 28,006
Northeast: 230
Midwest: 199
South: 568
West: 405
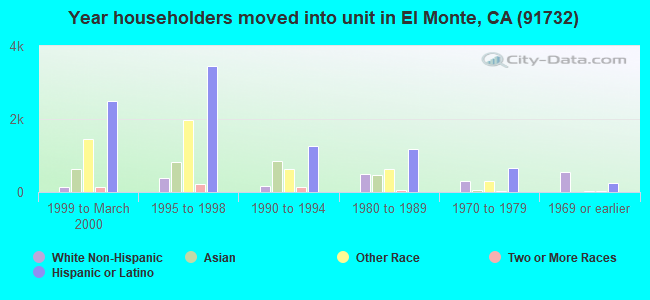
54% of the 91732 zip code residents lived in the same house 5 years ago. Out of people who lived in different houses, 91% lived in this county. Out of people who lived in different counties, 50% lived in California.
93% of the 91732 zip code residents lived in the same house 1 year ago. Out of people who lived in different houses, 88% moved from this county. Out of people who lived in different houses, 8% moved from different county within same state. Out of people who lived in different houses, 1% moved from different state. Out of people who lived in different houses, 3% moved from abroad.
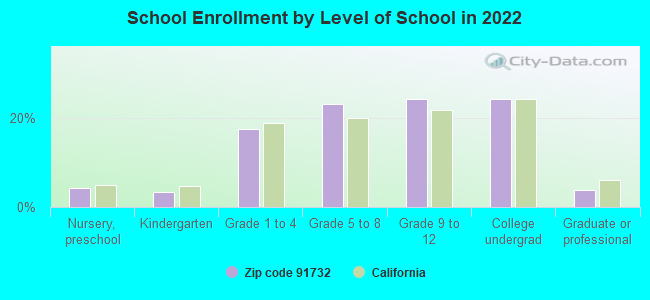
Private vs. public school enrollment:
Students in private schools in grades 1 to 8 (elementary and middle school): 83
Here:
1.4%
California:
10.5%
Students in private schools in grades 9 to 12 (high school): 108
Here:
3.1%
California:
8.5%
Students in private undergraduate colleges: 305
Here:
8.8%
California:
15.9%
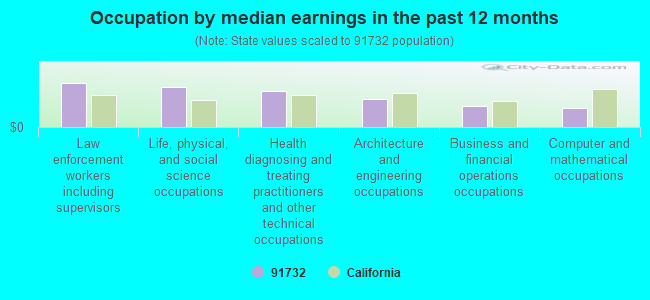
Occupation by median earnings in the past 12 months ($)
111,725Law enforcement workers including supervisors
101,954Life, physical, and social science occupations
90,201Health diagnosing and treating practitioners and other technical occupations
70,422Architecture and engineering occupations
52,789Business and financial operations occupations
49,421Computer and mathematical occupations
Companies with federal contracts located in this zip code:
ANK TECHNOLOGIES INC (11645 MCBEAN DRIVE in EL MONTE, CA; small business)
$156,340 with Defense Logistics Agency for Miscellaneous Electric Power and Distribution Equipment. Signed on 2003-11-26. Completion date: 2005-02-11.
Top industries in this zip code by the number of employees in 2005:
Health Care and Social Assistance: Nursing Care Facilities (100-249 employees: 2 establishments, 50-99 employees: 2 establishments, 1-4 employees: 1 establishment)


 Nearest zip codes: 91731, 91746, 91733, 91780, 91706, 91007.