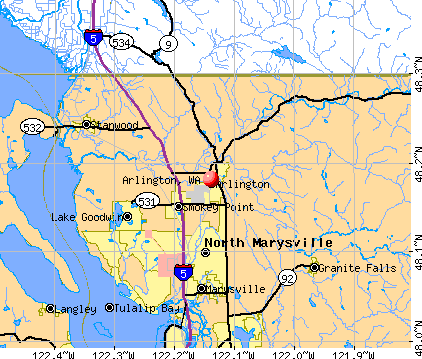
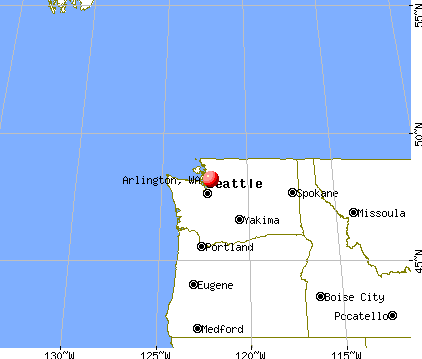
Arlington, Washington
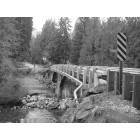
Arlington: One Lane Bridge
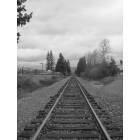
Arlington: Arlington Railroad
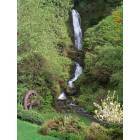
Arlington: Ryan Falls, 5.5 miles north of Arlington, Washington
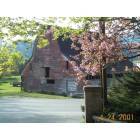
Arlington: Barn on Hwy 530, 5.5 miles north of Arlington, Washington
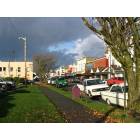
Arlington: downtown
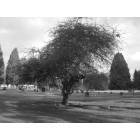
Arlington: Arlington Cemetary
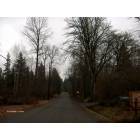
Arlington: View down Russian Road from Jordan Road
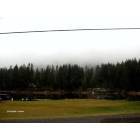
Arlington: View from Russian Road of Spring Lake
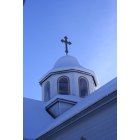
Arlington: The Orthodox Church on Burke Ave December 20, 2008
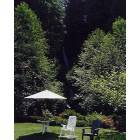
Arlington: Backyard and Waterfall 5.5 miles north of Arlington, Washington
- add
your
Submit your own pictures of this city and show them to the world
- OSM Map
- General Map
- Google Map
- MSN Map
Population change since 2000: +79.8%
| Males: 10,202 | |
| Females: 10,857 |
| Median resident age: | 37.4 years |
| Washington median age: | 38.4 years |
Zip codes: 98223.
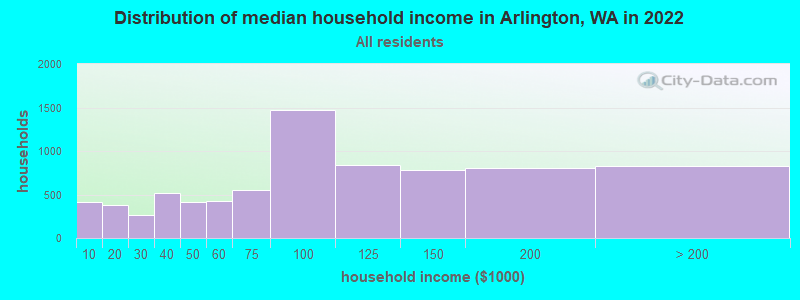
| Arlington: | $87,391 |
| WA: | $91,306 |
Estimated per capita income in 2022: $45,673 (it was $19,146 in 2000)
Arlington city income, earnings, and wages data
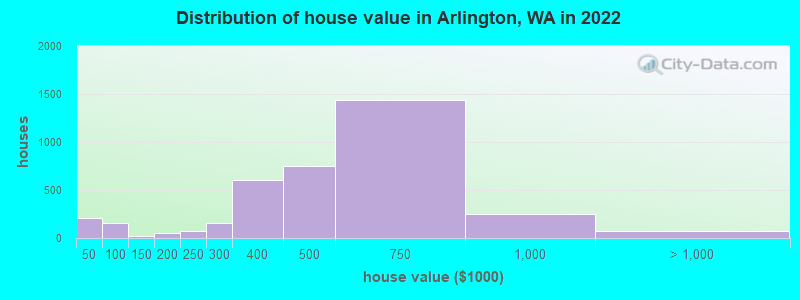
Estimated median house or condo value in 2022: $539,592 (it was $168,200 in 2000)
| Arlington: | $539,592 |
| WA: | $569,500 |
Mean prices in 2022: all housing units: $766,619; detached houses: $825,949; townhouses or other attached units: $643,803; in 2-unit structures: $530,516; in 3-to-4-unit structures: $479,562; in 5-or-more-unit structures: $400,308; mobile homes: $303,974; occupied boats, rvs, vans, etc.: $101,172
Median gross rent in 2022: $1,729.
(4.3% for White Non-Hispanic residents, 26.4% for Hispanic or Latino residents, 56.0% for other race residents, 9.5% for two or more races residents)
Detailed information about poverty and poor residents in Arlington, WA


Compare current foreclosures in Arlington, WA:
| Photo | Address | Area | Beds / Baths | Price | Details |
|---|---|---|---|---|---|

|
#1
120th Pl NE
Arlington, WA 98223
|
1,200 sq. feet
|
2 baths 3 beds |
show details | |

|
#2
135th Ave NE
Arlington, WA 98223
|
2,500 sq. feet
|
2 baths 3 beds |
show details | |

|
#3
200th St NE
Arlington, WA 98223
|
1,452 sq. feet
|
2 baths 3 beds |
show details | |

|
#4
19th Dr NE
Arlington, WA 98223
|
1,877 sq. feet
|
1 baths 2 beds |
show details | |

|
#5
121st Ave NE
Arlington, WA 98223
|
936 sq. feet
|
1 baths 3 beds |
show details | |

|
#6
Burn Rd
Arlington, WA 98223
|
1,512 sq. feet
|
2 baths 3 beds |
show details | |

|
#7
130th St NE
Arlington, WA 98223
|
1,481 sq. feet
|
2 baths 3 beds |
show details | |

|
#8
117th St NE
Arlington, WA 98223
|
3,452 sq. feet
|
2 baths 4 beds |
show details | |

|
#9
200th Pl NE
Arlington, WA 98223
|
1,200 sq. feet
|
1 baths 3 beds |
show details | |

|
#10
Jim Creek Rd
Arlington, WA 98223
|
1,144 sq. feet
|
2 baths 2 beds |
show details |
| Photo | Address | Area | Beds / Baths | Price | Details |
|---|---|---|---|---|---|

|
#11
193rd Pl NE
Arlington, WA 98223
|
1,300 sq. feet
|
2 baths 3 beds |
show details | |

|
#12
172nd Pl NE
Arlington, WA 98223
|
2,215 sq. feet
|
2 baths 4 beds |
show details | |

|
#13
65th Dr NE
Arlington, WA 98223
|
1,627 sq. feet
|
2 baths 3 beds |
show details | |

|
#14
95th Ave NE
Arlington, WA 98223
|
1,740 sq. feet
|
4 baths 6 beds |
show details | |

|
#15
W Country Club Dr
Arlington, WA 98223
|
3,210 sq. feet
|
2 baths 3 beds |
show details | |

|
#16
41st Dr NE
Arlington, WA 98223
|
1,060 sq. feet
|
1 baths 3 beds |
show details | |

|
#17
E Highland Dr
Arlington, WA 98223
|
1,620 sq. feet
|
2 baths 3 beds |
show details | |

|
#18
113th Pl NE
Arlington, WA 98223
|
2,452 sq. feet
|
3 baths 4 beds |
show details | |

|
#19
Boreal Ct
Arlington, WA 98223
|
1,416 sq. feet
|
2 baths 3 beds |
show details | |

|
#20
134th St NE
Arlington, WA 98223
|
2,170 sq. feet
|
2 baths 3 beds |
show details |
| Photo | Address | Area | Beds / Baths | Price | Details |
|---|---|---|---|---|---|

|
#21
Osprey Rd
Arlington, WA 98223
|
1,758 sq. feet
|
2 baths 3 beds |
show details | |

|
#22
135th Ave NE
Arlington, WA 98223
|
2,085 sq. feet
|
2 baths 3 beds |
show details | |

|
#23
257th St NE
Arlington, WA 98223
|
1,602 sq. feet
|
2 baths 3 beds |
show details | |

|
#24
N Dunham Ave
Arlington, WA 98223
|
1,666 sq. feet
|
1 baths 3 beds |
show details | |

|
#25
127th Ave NE
Arlington, WA 98223
|
1,428 sq. feet
|
2 baths 3 beds |
show details | |

|
#26
282nd St NE
Arlington, WA 98223
|
1,080 sq. feet
|
1 baths 2 beds |
show details | |

|
#27
99th Ave NE
Arlington, WA 98223
|
1,112 sq. feet
|
1 baths 1 beds |
show details | |

|
#28
Highland View Dr
Arlington, WA 98223
|
2,429 sq. feet
|
3 baths 4 beds |
show details | |

|
#29
Ebey Mountain Rd
Arlington, WA 98223
|
1,764 sq. feet
|
2 baths 3 beds |
show details | |

|
#30
Inverness Dr
Arlington, WA 98223
|
1,820 sq. feet
|
2 baths 3 beds |
show details |
| Photo | Address | Area | Beds / Baths | Price | Details |
|---|---|---|---|---|---|

|
#31
71st Dr NE
Arlington, WA 98223
|
3,050 sq. feet
|
2 baths 3 beds |
show details | |

|
#32
99th Ave NE
Arlington, WA 98223
|
2,528 sq. feet
|
2 baths 4 beds |
show details | |

|
#33
116th St NE
Arlington, WA 98223
|
1,440 sq. feet
|
2 baths - beds |
show details | |

|
#34
200th St NE
Arlington, WA 98223
|
1,360 sq. feet
|
2 baths 3 beds |
show details | |

|
#35
W Marion St
Arlington, WA 98223
|
840 sq. feet
|
1 baths 2 beds |
show details | |

|
#36
Upland Dr
Arlington, WA 98223
|
1,232 sq. feet
|
3 baths 3 beds |
show details | |

|
#37
121st Dr NE
Arlington, WA 98223
|
960 sq. feet
|
1 baths 3 beds |
show details | |

|
#38
195th St NE
Arlington, WA 98223
|
2,002 sq. feet
|
2 baths 3 beds |
show details | |

|
#39
Carlisle Pl
Arlington, WA 98223
|
2,149 sq. feet
|
2 baths 4 beds |
show details | |

|
#40
197th Pl NE
Arlington, WA 98223
|
1,180 sq. feet
|
2 baths 3 beds |
show details |
| Photo | Address | Area | Beds / Baths | Price | Details |
|---|---|---|---|---|---|

|
#41
45th Dr NE
Arlington, WA 98223
|
1,657 sq. feet
|
2 baths 3 beds |
show details | |

|
#42
Jordan Way
Arlington, WA 98223
|
1,030 sq. feet
|
1 baths 3 beds |
show details | |

|
#43
Peak Pl
Arlington, WA 98223
|
2,000 sq. feet
|
3 baths 3 beds |
show details | |

|
#44
Osprey Rd
Arlington, WA 98223
|
1,851 sq. feet
|
2 baths 4 beds |
show details | |

|
#45
181st Ave NE
Arlington, WA 98223
|
1,072 sq. feet
|
1 baths 3 beds |
show details | |

|
#46
Harrow Pl, C O Michael Berry
Arlington, WA 98223
|
2,944 sq. feet
|
3 baths 3 beds |
show details | |

|
#47
Vista Dr
Arlington, WA 98223
|
2,000 sq. feet
|
2 baths 3 beds |
show details | |

|
#48
182nd St NE
Arlington, WA 98223
|
4,427 sq. feet
|
3 baths 3 beds |
show details | |

|
#49
228th St NE
Arlington, WA 98223
|
2,316 sq. feet
|
3 baths 2 beds |
show details | |

|
Check over 1 million property listings on Foreclosure.com!
|
browse all offers | |||


- 14,09268.6%White alone
- 3,14515.3%Hispanic
- 1,3096.4%Asian alone
- 1,1335.5%Two or more races
- 3531.7%Black alone
- 1190.6%American Indian alone
- 1010.5%Native Hawaiian and Other
Pacific Islander alone - 1020.5%Other race alone

Races in Arlington detailed stats: ancestries, foreign born residents, place of birth
According to our research of Washington and other state lists, there were 33 registered sex offenders living in Arlington, Washington as of April 27, 2024.
The ratio of all residents to sex offenders in Arlington is 590 to 1.
Type |
2009 |
2010 |
2011 |
2012 |
2013 |
2014 |
2015 |
2016 |
2017 |
2018 |
2019 |
2020 |
2021 |
2022 |
|---|---|---|---|---|---|---|---|---|---|---|---|---|---|---|
| Murders (per 100,000) | 1 (5.7) | 0 (0.0) | 0 (0.0) | 2 (10.9) | 0 (0.0) | 1 (5.3) | 0 (0.0) | 0 (0.0) | 0 (0.0) | 0 (0.0) | 1 (5.0) | 4 (19.2) | 0 (0.0) | 0 (0.0) |
| Rapes (per 100,000) | 3 (17.2) | 4 (22.3) | 5 (27.5) | 3 (16.4) | 3 (16.3) | 6 (31.9) | 3 (15.8) | 5 (26.1) | 10 (51.8) | 17 (87.7) | 8 (39.9) | 10 (48.0) | 10 (46.7) | 7 (34.7) |
| Robberies (per 100,000) | 15 (86.1) | 6 (33.5) | 10 (54.9) | 9 (49.1) | 11 (59.7) | 7 (37.2) | 8 (42.1) | 10 (52.2) | 14 (72.5) | 8 (41.2) | 5 (24.9) | 10 (48.0) | 6 (28.0) | 16 (79.3) |
| Assaults (per 100,000) | 12 (68.9) | 16 (89.3) | 16 (87.9) | 18 (98.2) | 23 (124.8) | 20 (106.2) | 22 (115.7) | 36 (188.1) | 43 (222.8) | 37 (190.8) | 34 (169.6) | 37 (177.7) | 29 (135.5) | 44 (218.1) |
| Burglaries (per 100,000) | 94 (539.8) | 94 (524.4) | 161 (884.3) | 173 (943.7) | 198 (1,075) | 165 (876.0) | 97 (510.0) | 127 (663.5) | 117 (606.2) | 118 (608.4) | 93 (464.0) | 92 (441.8) | 135 (630.7) | 114 (565.0) |
| Thefts (per 100,000) | 429 (2,464) | 542 (3,024) | 554 (3,043) | 653 (3,562) | 791 (4,293) | 838 (4,449) | 696 (3,660) | 635 (3,317) | 540 (2,798) | 480 (2,475) | 578 (2,884) | 518 (2,487) | 490 (2,289) | 354 (1,755) |
| Auto thefts (per 100,000) | 85 (488.1) | 95 (530.0) | 67 (368.0) | 74 (403.7) | 135 (732.7) | 105 (557.4) | 86 (452.2) | 109 (569.4) | 107 (554.3) | 71 (366.1) | 40 (199.6) | 61 (292.9) | 72 (336.4) | 106 (525.4) |
| Arson (per 100,000) | 0 (0.0) | 0 (0.0) | 0 (0.0) | 4 (21.8) | 0 (0.0) | 0 (0.0) | 0 (0.0) | 3 (15.7) | 3 (15.5) | 1 (5.2) | 3 (15.0) | 4 (19.2) | 3 (14.0) | 1 (5.0) |
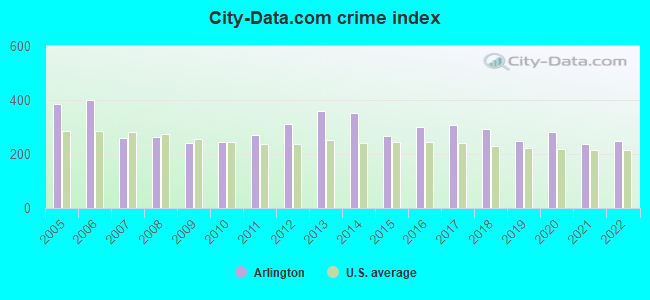
| City-Data.com crime index | 240.3 | 245.8 | 269.1 | 310.1 | 361.5 | 352.4 | 266.6 | 298.9 | 306.4 | 291.5 | 247.1 | 280.6 | 235.5 | 246.9 |
The City-Data.com crime index weighs serious crimes and violent crimes more heavily. Higher means more crime, U.S. average is 246.1. It adjusts for the number of visitors and daily workers commuting into cities.
Crime rate in Arlington detailed stats: murders, rapes, robberies, assaults, burglaries, thefts, arson
Full-time law enforcement employees in 2021, including police officers: 32 (27 officers - 23 male; 4 female).
| Officers per 1,000 residents here: | 1.26 |
| Washington average: | 1.35 |
 Recent articles from our blog. Our writers, many of them Ph.D. graduates or candidates, create easy-to-read articles on a wide variety of topics.

 | Washington Weather - Daily Weather pics and reports! (2547 replies) |
| Help me narrow down some areas? (91 replies) |
| Thinking of moving to Oak Harbor. Opinions ? (24 replies) |
| Can anyone in Arlington WA help me where the advertising board is? (3 replies) |
| Looking for somewhere between Vancouver bc and issaquah wa (13 replies) |
| Looking for retirement home/community west of Seattle (30 replies) |
Latest news from Arlington, WA collected exclusively by city-data.com from local newspapers, TV, and radio stations
Ancestries: English (11.6%), American (9.6%), German (9.5%), Norwegian (8.3%), Dutch (4.4%), European (4.0%).
Current Local Time: PST time zone
Incorporated in 1903
Elevation: 120 feet
Land area: 7.56 square miles.
Population density: 2,784 people per square mile (average).
2,556 residents are foreign born (6.4% Latin America, 4.3% Asia).
| This city: | 12.4% |
| Washington: | 14.9% |
Median real estate property taxes paid for housing units with mortgages in 2022: $3,597 (0.6%)
Median real estate property taxes paid for housing units with no mortgage in 2022: $2,824 (0.6%)
Nearest city with pop. 50,000+: Everett, WA  (15.3 miles , pop. 91,488).
Nearest city with pop. 200,000+: East Seattle, WA (39.1 miles , pop. 480,100).
Nearest city with pop. 1,000,000+: Los Angeles, CA (994.1 miles , pop. 3,694,820).
Nearest cities:
), ), ), ), ), )Latitude: 48.18 N, Longitude: 122.14 W
Daytime population change due to commuting: +1,624 (+7.9%)
Workers who live and work in this city: 3,748 (35.6%)
Area code: 360
Property values in Arlington, WA
Arlington, Washington accommodation & food services, waste management - Economy and Business Data
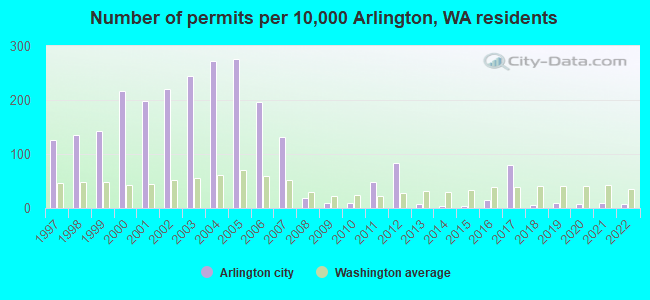
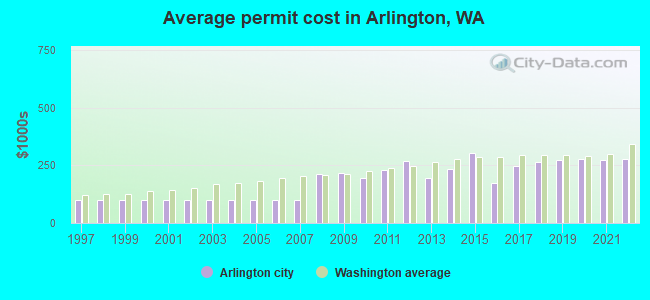
Single-family new house construction building permits:
- 2022: 9 buildings, average cost: $276,500
- 2021: 11 buildings, average cost: $276,200
- 2020: 9 buildings, average cost: $277,600
- 2019: 10 buildings, average cost: $272,600
- 2018: 7 buildings, average cost: $265,800
- 2017: 92 buildings, average cost: $247,800
- 2016: 16 buildings, average cost: $172,300
- 2015: 4 buildings, average cost: $305,300
- 2014: 3 buildings, average cost: $235,000
- 2013: 9 buildings, average cost: $196,300
- 2012: 98 buildings, average cost: $270,500
- 2011: 57 buildings, average cost: $232,100
- 2010: 11 buildings, average cost: $197,000
- 2009: 12 buildings, average cost: $215,500
- 2008: 21 buildings, average cost: $211,300
- 2007: 154 buildings, average cost: $100,400
- 2006: 231 buildings, average cost: $100,400
- 2005: 323 buildings, average cost: $100,400
- 2004: 320 buildings, average cost: $100,400
- 2003: 287 buildings, average cost: $100,400
- 2002: 258 buildings, average cost: $100,400
- 2001: 233 buildings, average cost: $100,500
- 2000: 253 buildings, average cost: $100,300
- 1999: 168 buildings, average cost: $101,000
- 1998: 159 buildings, average cost: $101,100
- 1997: 148 buildings, average cost: $100,800
| Here: | 3.6% |
| Washington: | 4.6% |
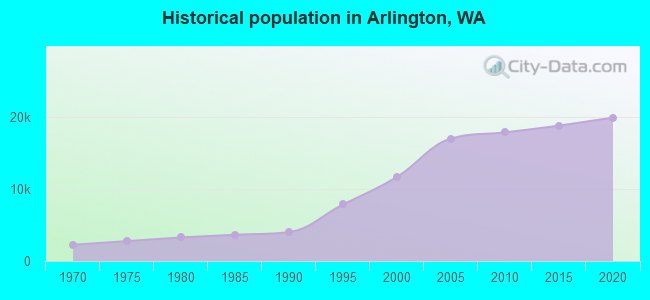
Population change in the 1990s: +7,368 (+169.6%).
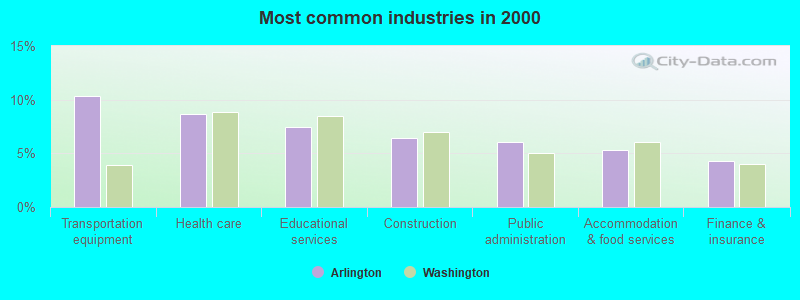
- Transportation equipment (10.3%)
- Health care (8.7%)
- Educational services (7.5%)
- Construction (6.4%)
- Public administration (6.0%)
- Accommodation & food services (5.3%)
- Finance & insurance (4.3%)

- Transportation equipment (13.8%)
- Construction (11.2%)
- Other transportation, support activities, couriers (6.0%)
- Public administration (5.4%)
- Motor vehicle & parts dealers (4.6%)
- Educational services (4.1%)
- Metal & metal products (4.1%)
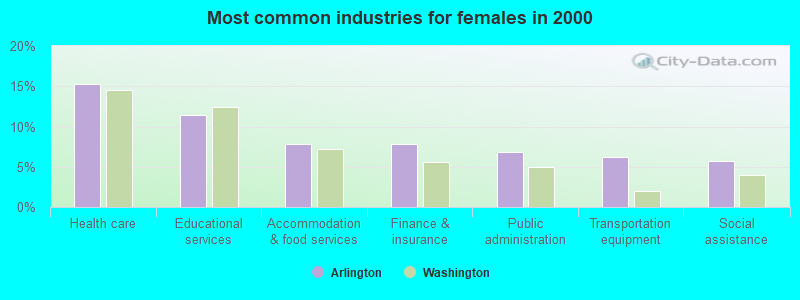
- Health care (15.3%)
- Educational services (11.4%)
- Accommodation & food services (7.9%)
- Finance & insurance (7.8%)
- Public administration (6.8%)
- Transportation equipment (6.2%)
- Social assistance (5.7%)
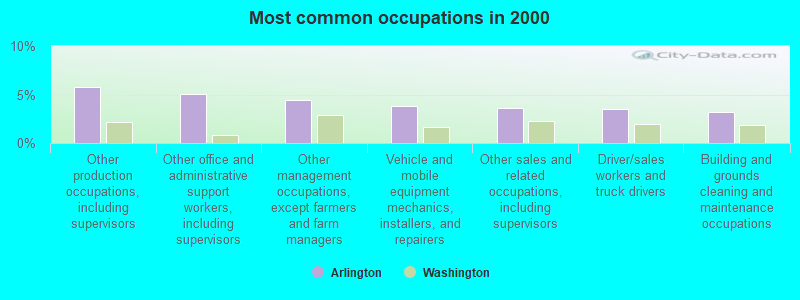
- Other production occupations, including supervisors (5.8%)
- Other office and administrative support workers, including supervisors (5.1%)
- Other management occupations, except farmers and farm managers (4.5%)
- Vehicle and mobile equipment mechanics, installers, and repairers (3.8%)
- Other sales and related occupations, including supervisors (3.6%)
- Driver/sales workers and truck drivers (3.5%)
- Building and grounds cleaning and maintenance occupations (3.2%)
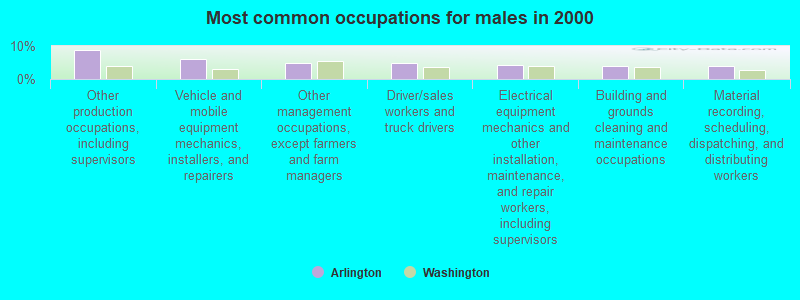
- Other production occupations, including supervisors (8.7%)
- Vehicle and mobile equipment mechanics, installers, and repairers (6.2%)
- Other management occupations, except farmers and farm managers (4.9%)
- Driver/sales workers and truck drivers (4.7%)
- Electrical equipment mechanics and other installation, maintenance, and repair workers, including supervisors (4.1%)
- Building and grounds cleaning and maintenance occupations (4.0%)
- Material recording, scheduling, dispatching, and distributing workers (3.8%)
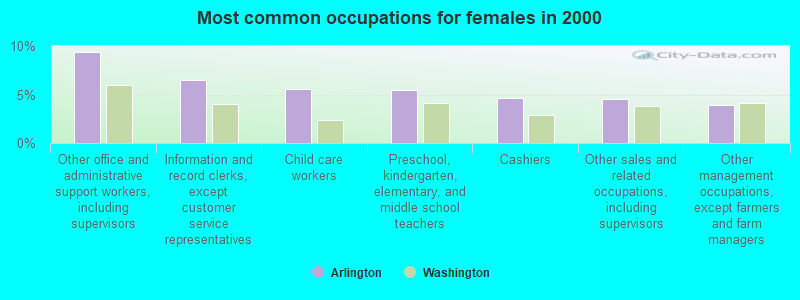
- Other office and administrative support workers, including supervisors (9.4%)
- Information and record clerks, except customer service representatives (6.5%)
- Child care workers (5.5%)
- Preschool, kindergarten, elementary, and middle school teachers (5.4%)
- Cashiers (4.6%)
- Other sales and related occupations, including supervisors (4.5%)
- Other management occupations, except farmers and farm managers (4.0%)
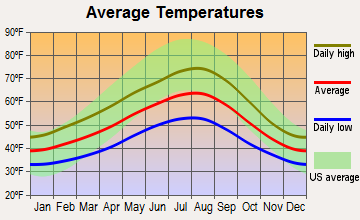
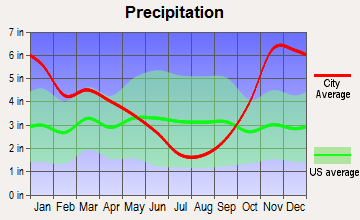
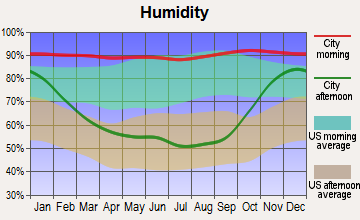
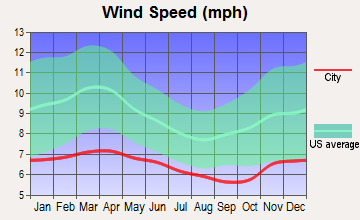
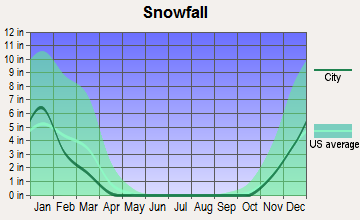
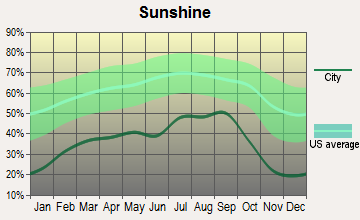
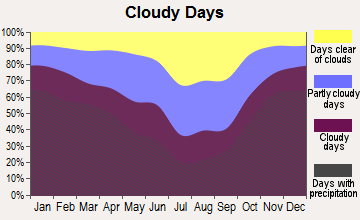
Average climate in Arlington, Washington
Based on data reported by over 4,000 weather stations
|
|

(lower is better)
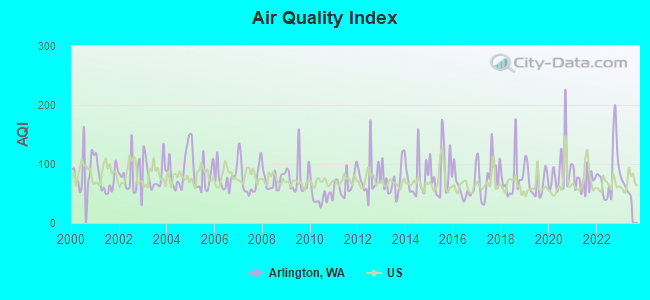
Air Quality Index (AQI) level in 2022 was 86.2. This is about average.
| City: | 86.2 |
| U.S.: | 72.6 |
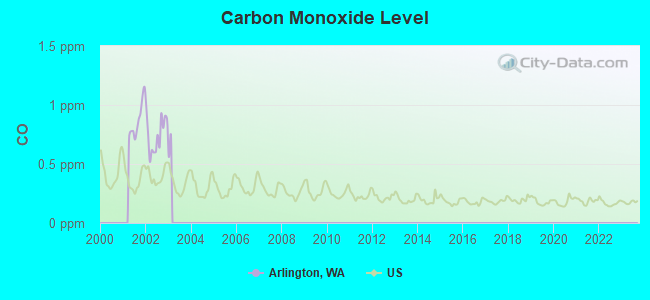
Carbon Monoxide (CO) [ppm] level in 2002 was 0.749. This is significantly worse than average. Closest monitor was 14.0 miles away from the city center.
| City: | 0.749 |
| U.S.: | 0.251 |
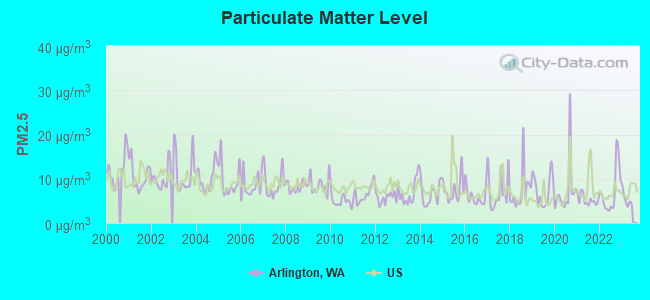
Particulate Matter (PM2.5) [µg/m3] level in 2022 was 7.18. This is about average. Closest monitor was 8.9 miles away from the city center.
| City: | 7.18 |
| U.S.: | 8.11 |
Earthquake activity:
Arlington-area historical earthquake activity is significantly above Washington state average. It is 1157% greater than the overall U.S. average.On 4/13/1949 at 19:55:42, a magnitude 7.0 (7.0 UK, Class: Major, Intensity: VIII - XII) earthquake occurred 66.6 miles away from the city center, causing $80,000,000 total damage
On 2/28/2001 at 18:54:32, a magnitude 6.8 (6.8 MD, Depth: 32.2 mi, Class: Strong, Intensity: VII - IX) earthquake occurred 76.5 miles away from Arlington center
On 2/28/2001 at 18:54:32, a magnitude 6.8 (6.5 MB, 6.6 MS, 6.8 MW) earthquake occurred 78.2 miles away from the city center, causing $2,000,000,000 total damage and $305,000,000 insured losses
On 4/29/1965 at 15:28:43, a magnitude 6.6 (6.6 UK) earthquake occurred 60.4 miles away from the city center, causing $28,000,000 total damage
On 7/3/1999 at 01:43:54, a magnitude 5.8 (5.4 MB, 5.5 MS, 5.8 MW, 5.3 ME, Depth: 25.2 mi, Class: Moderate, Intensity: VI - VII) earthquake occurred 92.8 miles away from Arlington center
On 5/3/1996 at 04:04:22, a magnitude 5.5 (5.2 MB, 5.3 MD, 5.5 ML, Depth: 2.5 mi) earthquake occurred 30.1 miles away from the city center
Magnitude types: body-wave magnitude (MB), duration magnitude (MD), energy magnitude (ME), local magnitude (ML), surface-wave magnitude (MS), moment magnitude (MW)
Natural disasters:
The number of natural disasters in Snohomish County (31) is a lot greater than the US average (15).Major Disasters (Presidential) Declared: 27
Emergencies Declared: 2
Causes of natural disasters: Floods: 21, Storms: 17, Mudslides: 14, Landslides: 10, Winter Storms: 6, Winds: 5, Earthquakes: 2, Heavy Rain: 1, Hurricane: 1, Snow: 1, Tornado: 1, Volcanic Eruption: 1, Other: 1 (Note: some incidents may be assigned to more than one category).

Hospitals and medical centers in Arlington:
Airports and heliports located in Arlington:
- Arlington Municipal Airport (AWO) (Runways: 2, Air Taxi Ops: 2,244, Itinerant Ops: 24,260, Local Ops: 32,598, Military Ops: 3,017)
- Williams Airpatch Airport (89WA) (Runways: 1)
- Cascade Valley Hospital Heliport (6WA9)
- Lakewood Heliport (62WA)
Amtrak stations near Arlington:
- 15 miles: EVERETT (2900 BOND ST.) . Services: ticket office, partially wheelchair accessible, enclosed waiting area, public payphones, free short-term parking, free long-term parking, call for car rental service, taxi stand, public transit connection.
- 20 miles: MOUNT VERNON (725 COLLEGE WAY) . Services: fully wheelchair accessible, free short-term parking, free long-term parking, call for taxi service, public transit connection.
Colleges/universities with over 2000 students nearest to Arlington:
- Everett Community College (about 13 miles; Everett, WA; Full-time enrollment: 5,818)
- Skagit Valley College (about 20 miles; Mount Vernon, WA; FT enrollment: 3,803)
- Edmonds Community College (about 27 miles; Lynnwood, WA; FT enrollment: 7,271)
- University of Washington-Bothell Campus (about 30 miles; Bothell, WA; FT enrollment: 3,902)
- Cascadia Community College (about 30 miles; Bothell, WA; FT enrollment: 2,238)
- Shoreline Community College (about 32 miles; Shoreline, WA; FT enrollment: 5,026)
- Lake Washington Institute of Technology (about 33 miles; Kirkland, WA; FT enrollment: 2,947)
Public high schools in Arlington:
- ARLINGTON HIGH SCHOOL (Location: 18821 CROWN RIDGE BLVD, Grades: 9-12)
- WESTON HIGH SCHOOL (Location: 4407 172ND STREET NE, Grades: 9-12)
- STILLAGUAMISH SCHOOL (Location: 1215 E 5TH, Grades: KG-12)
- ARLINGTON SPECIAL EDUC SCHOOL (Location: 315 N FRENCH AVE, Grades: PK-12)
- NW LEARNING CENTER (Location: 4407 172ND ST NE, Grades: 9-12)
- LAKEWOOD HIGH SCHOOL (Location: 17023 11TH AVE NE, Grades: 9-12)
Private high schools in Arlington:
Biggest public elementary/middle schools in Arlington:
- POST MIDDLE SCHOOL (Location: 1220 E. 5TH ST, Grades: 6-8)
- KENT PRAIRIE ELEMENTARY (Location: 8110 207TH ST NE, Grades: KG-6)
- PRESIDENTS ELEMENTARY (Location: 505 EAST THIRD, Grades: PK-6)
- EAGLE CREEK ELEMENTARY (Location: 1216 E 5TH, Grades: KG-6)
- PIONEER ELEMENTARY (Location: 8213 EAGLEFIELD DR, Grades: KG-6)
- HALLER MIDDLE SCHOOL (Location: 600 E. FIRST, Grades: 6-8)
- LAKEWOOD ELEMENTARY SCHOOL (Location: 17000 16TH DR N.E., Grades: PK-5)
- LAKEWOOD MIDDLE SCHOOL (Location: 16800 16TH DR N.E., Grades: 6-8)
- ENGLISH CROSSING ELEMENTARY (Location: 16728 16TH DR N.E., Grades: KG-5)
- COUGAR CREEK ELEMENTARY SCHOOL (Location: 16216 11TH AVE N.E., Grades: KG-5)
Points of interest:
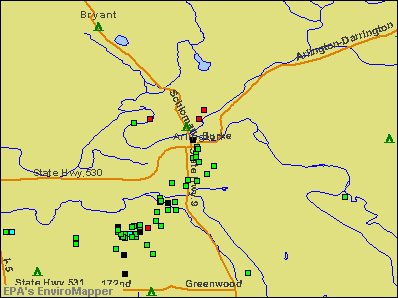
Notable locations in Arlington: East Arlington Substation (A), Gleneagle Golf Course (B), Arlington Sewage Treatment Plant (C), Cascade Valley Senior Living Facility (D), Regency Care Center at Arlington (E), Arlington Police Department (F), Arlington Fire Department Station 47 (G), Arlington Fire Department Station 46 (H), Arlington City Hall (I), Air Station Museum (J), Arlington Library (K). Display/hide their locations on the map
Churches in Arlington include: Assembly of God Church of Arlington (A), Immaculate Conception Church (B), First Baptist Church of Arlington (C), Smokey Point Church of Christ (D), Arlington Gospel Hall (E), Arlington United Church (F), Smokey Point Community Church (G), Saint Andrew Orthodox Church (H), Free Methodist Church of Arlington (I). Display/hide their locations on the map
Cemetery: Arlington Cemetery (1). Display/hide its location on the map
Parks in Arlington include: Haller Bridge Park (1), Arlington Airport Park (2). Display/hide their locations on the map
Tourist attractions: Libraries - Arlington (Cultural Attractions- Events- & Facilities; 135 North Washington Avenue), Stillaguamish Valley Pioneers Museum (Cultural Attractions- Events- & Facilities; 20722 67th Avenue Northeast), Checkered Flag Raceway Inc (Amusement & Theme Parks; 6405 172nd Street Northeast).
Hotels: Crossroads Inn (5200 172nd Street NE), Arlington Motor Inn (2214 State Route 530 Northeast).
Court: Courts - Cascade District Court (415 East Burke Avenue).
Birthplace of: Celia M. Hunter - Environmentalist, Rick Larsen - Politician, Kenny Gunter - College football player (Princeton Tigers).
Drinking water stations with addresses in Arlington and their reported violations in the past:
ARLINGTON EAST MUTUAL WATER ASSN. (Population served: 100, Groundwater):Past monitoring violations:ARLINGTON VIEW ESTATES WATER ASSOC (Population served: 74, Groundwater):
- 47 regular monitoring violations
Past health violations:ARLINGTON HEIGHTS WATER CO INC (Population served: 45, Groundwater):Past monitoring violations:
- MCL, Monthly (TCR) - In SEP-2006, Contaminant: Coliform
- MCL, Monthly (TCR) - In MAR-2006, Contaminant: Coliform
- Follow-up Or Routine LCR Tap M/R - In JAN-01-2005, Contaminant: Lead and Copper Rule. Follow-up actions: St Compliance achieved (DEC-31-2005)
- One routine major monitoring violation
- 28 regular monitoring violations
Past monitoring violations:
- 9 routine major monitoring violations
- One regular monitoring violation
Drinking water stations with addresses in Arlington that have no violations reported:
- ARLINGTON WATER DEPT (Population served: 14,598, Primary Water Source Type: Groundwater)
| This city: | 2.7 people |
| Washington: | 2.5 people |
| This city: | 68.9% |
| Whole state: | 64.4% |
| This city: | 8.9% |
| Whole state: | 7.7% |
Likely homosexual households (counted as self-reported same-sex unmarried-partner households)
- Lesbian couples: 0.5% of all households
- Gay men: 0.2% of all households
People in group quarters in Arlington in 2010:
- 123 people in nursing facilities/skilled-nursing facilities
- 76 people in other noninstitutional facilities
- 5 people in emergency and transitional shelters (with sleeping facilities) for people experiencing homelessness
- 2 people in workers' group living quarters and job corps centers
14 people in homes for the mentally retarded in 2000
Banks with most branches in Arlington (2011 data):
- Bank of America, National Association: Smokey Point Branch at 3230 172nd Northeast, branch established on 1995/02/01; Arlington Branch at 501 North Olympic Avenue, branch established on 1965/01/25. Info updated 2009/11/18: Bank assets: $1,451,969.3 mil, Deposits: $1,077,176.8 mil, headquarters in Charlotte, NC, positive income, 5782 total offices, Holding Company: Bank Of America Corporation
- JPMorgan Chase Bank, National Association: Arlington Branch at 5th & Olympic, branch established on 1934/07/01; Smokey Point Branch at 3704 172nd Street Northeast, branch established on 1992/01/21. Info updated 2011/11/10: Bank assets: $1,811,678.0 mil, Deposits: $1,190,738.0 mil, headquarters in Columbus, OH, positive income, International Specialization, 5577 total offices, Holding Company: Jpmorgan Chase & Co.
- KeyBank National Association: Smokey Point Branch at 17311 Smokey Point Drive, branch established on 1976/04/19; Arlington Branch at 535 North Olympic, branch established on 1982/01/01. Info updated 2008/03/03: Bank assets: $86,198.8 mil, Deposits: $64,214.8 mil, headquarters in Cleveland, OH, positive income, Commercial Lending Specialization, 1067 total offices, Holding Company: Keycorp
- Union Bank, National Association: Arlington - Downtown Branch at 525 North Olympic Street, branch established on 1967/05/01; Arlington - Smokey Point Branch at 3506 - 168th Street, Northeast, branch established on 1985/07/01. Info updated 2011/09/01: Bank assets: $88,967.5 mil, Deposits: $65,286.4 mil, headquarters in San Francisco, CA, positive income, Commercial Lending Specialization, 403 total offices, Holding Company: Mitsubishi Ufj Financial Group, Inc.
- Whidbey Island Bank: Smokey Point Branch at 4220-172nd Street Northeast, branch established on 2009/01/05; Arlington Loan Center Branch at 16710 Smokey Point Boulevard, Suite 401, branch established on 2011/04/04. Info updated 2010/09/27: Bank assets: $1,668.6 mil, Deposits: $1,471.8 mil, headquarters in Coupeville, WA, positive income, Commercial Lending Specialization, 32 total offices, Holding Company: Washington Banking Company
- Skagit State Bank: Arlington Branch at 20313 77th Avenue, Ne, branch established on 2001/02/23. Info updated 2006/10/18: Bank assets: $723.3 mil, Deposits: $620.5 mil, headquarters in Burlington, WA, positive income, Commercial Lending Specialization, 12 total offices, Holding Company: Skagit State Bancorp, Inc.
- Opus Bank: Smokey Point Branch at 3532 172nd Street Northeast, branch established on 1995/03/01. Info updated 2011/11/08: Bank assets: $2,404.2 mil, Deposits: $1,831.2 mil, headquarters in Irvine, CA, negative income in the last year, Commercial Lending Specialization, 38 total offices
- Columbia State Bank: Arlington Branch at 404 North West Avenue, branch established on 1993/08/30. Info updated 2011/08/09: Bank assets: $4,785.2 mil, Deposits: $3,892.8 mil, headquarters in Tacoma, WA, positive income, Commercial Lending Specialization, 104 total offices, Holding Company: Columbia Banking System, Inc.
- U.S. Bank National Association: Smokey Point Branch at 17110 Smokey Point Boulevard, branch established on 1991/10/15. Info updated 2012/01/30: Bank assets: $330,470.8 mil, Deposits: $236,091.5 mil, headquarters in Cincinnati, OH, positive income, 3121 total offices, Holding Company: U.S. Bancorp
For population 15 years and over in Arlington:
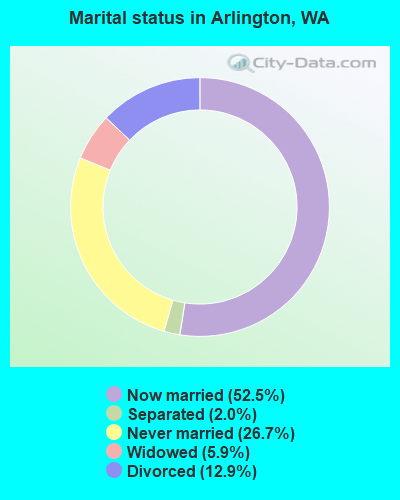
- Never married: 26.7%
- Now married: 52.5%
- Separated: 2.0%
- Widowed: 5.9%
- Divorced: 12.9%
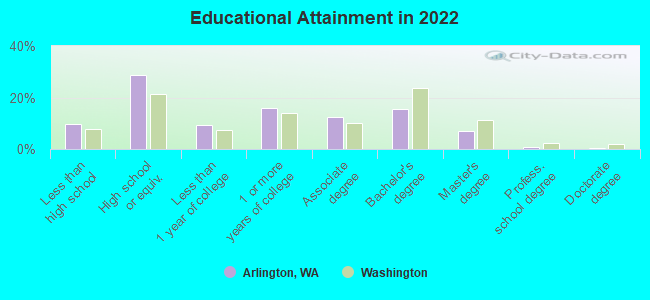
For population 25 years and over in Arlington:
- High school or higher: 90.4%
- Bachelor's degree or higher: 21.5%
- Graduate or professional degree: 7.4%
- Unemployed: 5.4%
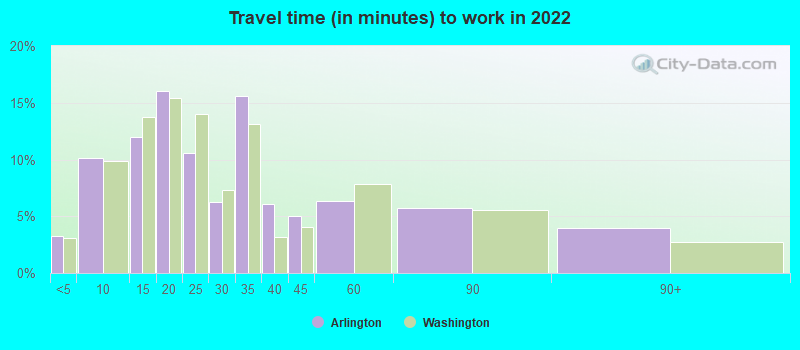
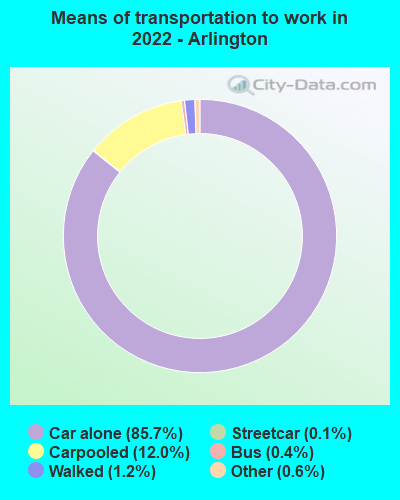
- Mean travel time to work (commute): 23.6 minutes
| Here: | 10.0 |
| Washington average: | 11.6 |
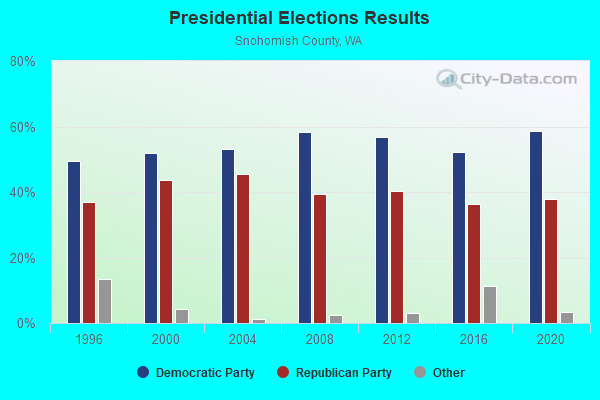
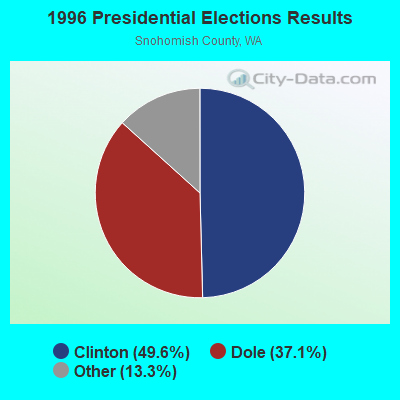
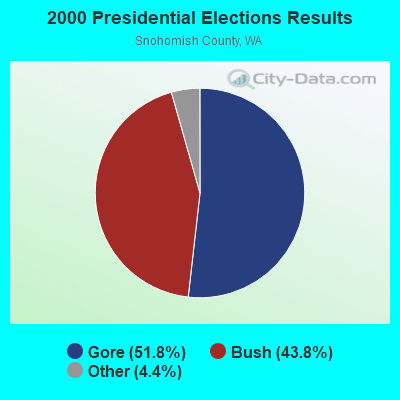
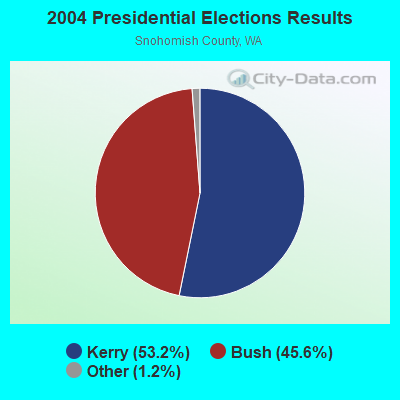
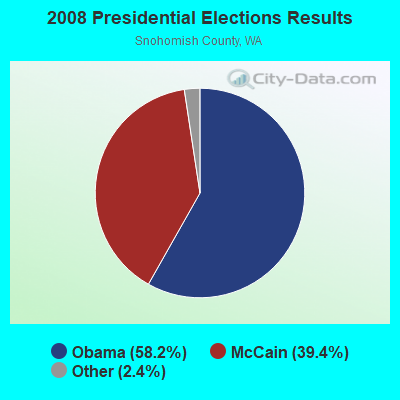

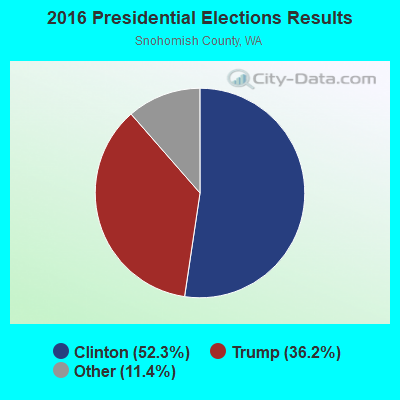
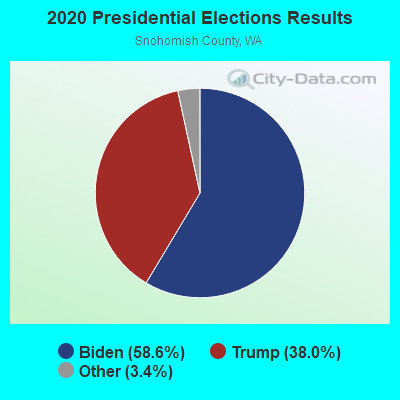
Graphs represent county-level data. Detailed 2008 Election Results
Neighborhoods in Arlington:
(Arlington, Washington Neighborhood Map)Religion statistics for Arlington, WA (based on Snohomish County data)
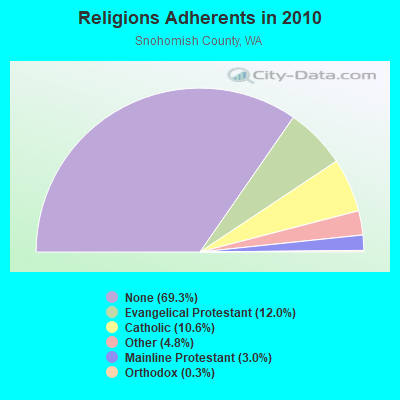
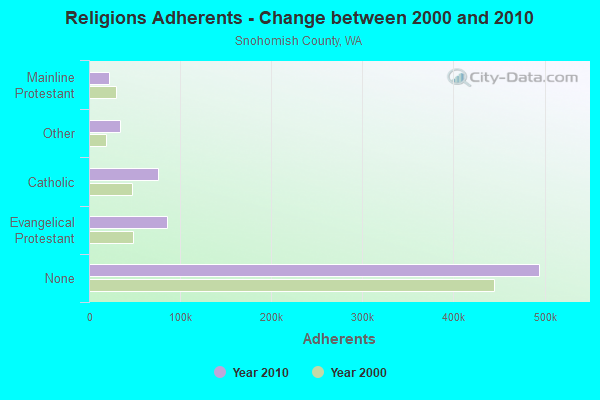
| Religion | Adherents | Congregations |
|---|---|---|
| Evangelical Protestant | 85,354 | 327 |
| Catholic | 75,393 | 16 |
| Other | 34,270 | 90 |
| Mainline Protestant | 21,642 | 71 |
| Orthodox | 1,943 | 6 |
| Black Protestant | 406 | 4 |
| None | 494,327 | - |
Food Environment Statistics:
| Snohomish County: | 1.79 / 10,000 pop. |
| Washington: | 2.06 / 10,000 pop. |
| This county: | 0.18 / 10,000 pop. |
| State: | 0.19 / 10,000 pop. |
| Snohomish County: | 1.42 / 10,000 pop. |
| Washington: | 1.18 / 10,000 pop. |
| Snohomish County: | 2.55 / 10,000 pop. |
| State: | 2.67 / 10,000 pop. |
| Here: | 6.95 / 10,000 pop. |
| State: | 8.26 / 10,000 pop. |
| This county: | 7.5% |
| Washington: | 7.7% |
| Snohomish County: | 27.4% |
| Washington: | 25.7% |
| This county: | 14.3% |
| State: | 13.9% |
Health and Nutrition:
| Here: | 48.3% |
| Washington: | 49.9% |
| Here: | 44.9% |
| Washington: | 47.2% |
| Arlington: | 28.6 |
| Washington: | 28.4 |
| This city: | 21.5% |
| Washington: | 20.9% |
| This city: | 10.7% |
| Washington: | 10.5% |
| Here: | 6.8 |
| Washington: | 6.8 |
| Arlington: | 33.4% |
| Washington: | 32.8% |
| This city: | 55.7% |
| Washington: | 56.8% |
| Arlington: | 79.2% |
| Washington: | 79.4% |
More about Health and Nutrition of Arlington, WA Residents
| Local government employment and payroll (March 2022) | |||||
| Function | Full-time employees | Monthly full-time payroll | Average yearly full-time wage | Part-time employees | Monthly part-time payroll |
|---|---|---|---|---|---|
| Police Protection - Officers | 21 | $236,831 | $135,332 | 0 | $0 |
| Other and Unallocable | 15 | $112,541 | $90,033 | 0 | $0 |
| Sewerage | 10 | $65,845 | $79,014 | 0 | $0 |
| Financial Administration | 10 | $83,193 | $99,832 | 0 | $0 |
| Airports | 10 | $72,955 | $87,546 | 0 | $0 |
| Water Supply | 9 | $70,957 | $94,609 | 0 | $0 |
| Housing and Community Development (Local) | 7 | $51,830 | $88,851 | 0 | $0 |
| Other Government Administration | 6 | $45,753 | $91,506 | 8 | $21,079 |
| Police - Other | 5 | $32,597 | $78,233 | 0 | $0 |
| Parks and Recreation | 5 | $31,451 | $75,482 | 0 | $0 |
| Streets and Highways | 3 | $19,376 | $77,504 | 0 | $0 |
| Solid Waste Management | 1 | $6,069 | $72,828 | 0 | $0 |
| Totals for Government | 102 | $829,398 | $97,576 | 8 | $21,079 |
Arlington government finances - Expenditure in 2021 (per resident):
- Construction - Regular Highways: $3,152,000 ($149.67)
Local Fire Protection: $1,382,000 ($65.63)
Parks and Recreation: $665,000 ($31.58)
Police Protection: $264,000 ($12.54)
Sewerage: $175,000 ($8.31)
Water Utilities: $132,000 ($6.27)
Central Staff Services: $27,000 ($1.28)
General - Other: $20,000 ($0.95)
Natural Resources - Other: $15,000 ($0.71)
Air Transportation: $13,000 ($0.62)
Financial Administration: $12,000 ($0.57)
Parking Facilities: $4,000 ($0.19)
Miscellaneous Commercial Activities - Other: $1,000 ($0.05)
- Current Operations - Police Protection: $7,407,000 ($351.73)
Health - Other: $4,450,000 ($211.31)
Sewerage: $3,751,000 ($178.12)
Water Utilities: $2,793,000 ($132.63)
Local Fire Protection: $2,615,000 ($124.17)
Air Transportation: $2,434,000 ($115.58)
Housing and Community Development: $1,984,000 ($94.21)
Financial Administration: $1,557,000 ($73.94)
Central Staff Services: $1,493,000 ($70.90)
General Public Buildings: $1,141,000 ($54.18)
Regular Highways: $839,000 ($39.84)
General - Other: $287,000 ($13.63)
Miscellaneous Commercial Activities - Other: $234,000 ($11.11)
Libraries: $136,000 ($6.46)
Judicial and Legal Services: $119,000 ($5.65)
Parks and Recreation: $29,000 ($1.38)
Public Welfare - Other: $21,000 ($1.00)
Solid Waste Management: $12,000 ($0.57)
- General - Interest on Debt: $921,000 ($43.73)
- Intergovernmental to Local - Other - General - Other: $938,000 ($44.54)
- Other Capital Outlay - Air Transportation: $3,467,000 ($164.63)
Water Utilities: $1,789,000 ($84.95)
Sewerage: $811,000 ($38.51)
Natural Resources - Other: $559,000 ($26.54)
General - Other: $50,000 ($2.37)
Police Protection: $39,000 ($1.85)
Parks and Recreation: $36,000 ($1.71)
- Total Salaries and Wages: $14,607,000 ($693.62)
Arlington government finances - Revenue in 2021 (per resident):
- Charges - Sewerage: $7,171,000 ($340.52)
Other: $4,996,000 ($237.24)
Air Transportation: $2,857,000 ($135.67)
Miscellaneous Commercial Activities: $240,000 ($11.40)
Regular Highways: $74,000 ($3.51)
Parks and Recreation: $12,000 ($0.57)
Natural Resources - Other: $1,000 ($0.05)
- Federal Intergovernmental - Highways: $2,447,000 ($116.20)
Other: $241,000 ($11.44)
- Local Intergovernmental - Other: $333,000 ($15.81)
- Miscellaneous - Rents: $1,108,000 ($52.61)
Interest Earnings: $784,000 ($37.23)
Donations From Private Sources: $388,000 ($18.42)
General Revenue - Other: $245,000 ($11.63)
Fines and Forfeits: $205,000 ($9.73)
Sale of Property: $171,000 ($8.12)
- Revenue - Water Utilities: $4,149,000 ($197.02)
- State Intergovernmental - Other: $1,917,000 ($91.03)
Highways: $1,004,000 ($47.68)
Health and Hospitals: $993,000 ($47.15)
General Local Government Support: $283,000 ($13.44)
- Tax - General Sales and Gross Receipts: $8,248,000 ($391.66)
Property: $5,767,000 ($273.85)
Public Utilities Sales: $3,317,000 ($157.51)
Other License: $1,256,000 ($59.64)
Documentary and Stock Transfer: $1,145,000 ($54.37)
Other Selective Sales: $241,000 ($11.44)
Amusements Sales: $99,000 ($4.70)
Occupation and Business License - Other: $61,000 ($2.90)
Arlington government finances - Debt in 2021 (per resident):
- Long Term Debt - Outstanding Unspecified Public Purpose: $40,316,000 ($1914.43)
Beginning Outstanding - Unspecified Public Purpose: $37,654,000 ($1788.02)
Issue, Unspecified Public Purpose: $12,095,000 ($574.34)
Retired Unspecified Public Purpose: $9,433,000 ($447.93)
7.60% of this county's 2021 resident taxpayers lived in other counties in 2020 ($97,930 average adjusted gross income)
| Here: | 7.60% |
| Washington average: | 7.53% |
0.04% of residents moved from foreign countries ($285 average AGI)
Snohomish County: 0.04% Washington average: 0.05%
Top counties from which taxpayers relocated into this county between 2020 and 2021:
| from King County, WA | |
| from Pierce County, WA | |
| from Skagit County, WA |
7.20% of this county's 2020 resident taxpayers moved to other counties in 2021 ($85,049 average adjusted gross income)
| Here: | 7.20% |
| Washington average: | 7.40% |
0.02% of residents moved to foreign countries ($153 average AGI)
Snohomish County: 0.02% Washington average: 0.04%
Top counties to which taxpayers relocated from this county between 2020 and 2021:
| to King County, WA | |
| to Pierce County, WA | |
| to Skagit County, WA |
| Businesses in Arlington, WA | ||||
| Name | Count | Name | Count | |
|---|---|---|---|---|
| 7-Eleven | 2 | KFC | 1 | |
| AT&T | 1 | Lowe's | 1 | |
| Ace Hardware | 1 | MasterBrand Cabinets | 2 | |
| AutoZone | 1 | McDonald's | 2 | |
| Baskin-Robbins | 1 | Quality | 1 | |
| Blockbuster | 1 | RadioShack | 1 | |
| Burger King | 1 | Rite Aid | 1 | |
| Chevrolet | 1 | Starbucks | 3 | |
| Dennys | 1 | Subway | 3 | |
| Domino's Pizza | 1 | U-Haul | 3 | |
| FedEx | 6 | UPS | 7 | |
| GNC | 1 | Vons | 2 | |
| H&R Block | 1 | Walmart | 1 | |
| Jack In The Box | 1 | Wendy's | 1 | |
| Jones New York | 2 | |||
Strongest AM radio stations in Arlington:
- KRKO (1380 AM; 50 kW; EVERETT, WA; Owner: S-R BROADCASTING, CO.)
- KAPS (660 AM; 10 kW; MOUNT VERNON, WA; Owner: VALLEY BROADCASTERS, INC.)
- KIXI (880 AM; 50 kW; MERCER ISLAND/SEATTL, WA; Owner: BELLEVUE RADIO, INC.)
- KKOL (1300 AM; 50 kW; SEATTLE, WA; Owner: INSPIRATION MEDIA, INC.)
- KIRO (710 AM; 50 kW; SEATTLE, WA; Owner: ENTERCOM SEATTLE LICENSE, LLC)
- KGNW (820 AM; 50 kW; BURIEN-SEATTLE, WA; Owner: INSPIRATION MEDIA, INC.)
- KTTH (770 AM; 50 kW; SEATTLE, WA; Owner: ENTERCOM SEATTLE LICENSE, LLC)
- KOMO (1000 AM; 50 kW; SEATTLE, WA; Owner: FISHER BROADCASTING - SEATTLE RADIO, L.L.C.)
- KYCW (1090 AM; 50 kW; SEATTLE, WA; Owner: INFINITY RADIO SUBSIDIARY OPERATIONS INC.)
- KRPI (1550 AM; 50 kW; FERNDALE, WA; Owner: BBC BROADCASTING, INC.)
- KJR (950 AM; 50 kW; SEATTLE, WA)
- KARI (550 AM; 25 kW; BLAINE, WA; Owner: WAY BROADCASTING, INC.)
- KBRC (1430 AM; 5 kW; MOUNT VERNON, WA; Owner: JIM AND ANN KEANE)
Strongest FM radio stations in Arlington:
- K206CU (89.1 FM; MOUNT VERNON, WA; Owner: CALVARY CHAPEL OF TWIN FALLS, INC.)
- K205DL (88.9 FM; GRANITE FALLS/EVERET, WA; Owner: CALVARY CHAPEL OF TWIN FALLS, INC.)
- KSVR (91.7 FM; MOUNT VERNON, WA; Owner: BOARD OF TRUSTEES OF SKAGIT VALLEY COLLEGE)
- KSER (90.7 FM; EVERETT, WA; Owner: KSER FOUNDATION)
- KISW (99.9 FM; SEATTLE, WA; Owner: ENTERCOM SEATTLE LICENSE, LLC)
- KQBZ (100.7 FM; SEATTLE, WA; Owner: ENTERCOM SEATTLE LICENSE, LLC)
- KMTT (103.7 FM; TACOMA, WA; Owner: ENTERCOM SEATTLE LICENSE, LLC)
- KNDD (107.7 FM; SEATTLE, WA; Owner: ENTERCOM SEATTLE LICENSE, LLC)
- KYPT (96.5 FM; SEATTLE, WA; Owner: INFINITY RADIO SUBSIDIARY OPERATIONS INC.)
- KISM (92.9 FM; BELLINGHAM, WA; Owner: SAGA BROADCASTING, LLC)
- KBSG-FM (97.3 FM; TACOMA, WA; Owner: ENTERCOM SEATTLE LICENSE, LLC)
- KCMS (105.3 FM; EDMONDS, WA; Owner: CRISTA MINISTRIES, INC.)
- KWPZ (106.5 FM; LYNDEN, WA; Owner: CRISTA MINISTRIES, INC.)
- KZOK-FM (102.5 FM; SEATTLE, WA; Owner: INFINITY RADIO SUBSIDIARY OPERATIONS INC.)
- KMPS-FM (94.1 FM; SEATTLE, WA; Owner: INFINITY RADIO SUBSIDIARY OPERATIONS INC.)
- KBKS (106.1 FM; TACOMA, WA; Owner: INFINITY RADIO SUBSIDIARY OPERATIONS INC.)
- KING-FM (98.1 FM; SEATTLE, WA; Owner: CLASSIC RADIO, INC.)
- KLSY-FM (92.5 FM; BELLEVUE, WA; Owner: BELLEVUE RADIO INC.)
- KPLU-FM (88.5 FM; TACOMA, WA; Owner: PACIFIC LUTHERAN UNIVERSITY, INC.)
- KWJZ (98.9 FM; SEATTLE, WA; Owner: ORCA RADIO, INC.)
TV broadcast stations around Arlington:
- KING-TV (Channel 5; SEATTLE, WA; Owner: KING BROADCASTING COMPANY)
- KSTW (Channel 11; TACOMA, WA; Owner: UPN TELEVISION STATIONS INC.)
- K58DP (Channel 58; SEATTLE, WA; Owner: WORD OF GOD FELLOWSHIP, INC.)
- KTWB-TV (Channel 22; SEATTLE, WA; Owner: TRIBUNE TELEVISION HOLDINGS, INC.)
- KOMO-TV (Channel 4; SEATTLE, WA; Owner: FISHER BROADCASTING - SEATTLE TV, L.L.C.)
- K29ED (Channel 29; EVERETT, WA; Owner: TRIBUNE TELEVISION HOLDINGS, INC.)
- National Bridge Inventory (NBI) Statistics
- 11Number of bridges
- 266ft / 81.0mTotal length
- $54,073,000Total costs
- 243,376Total average daily traffic
- 20,793Total average daily truck traffic
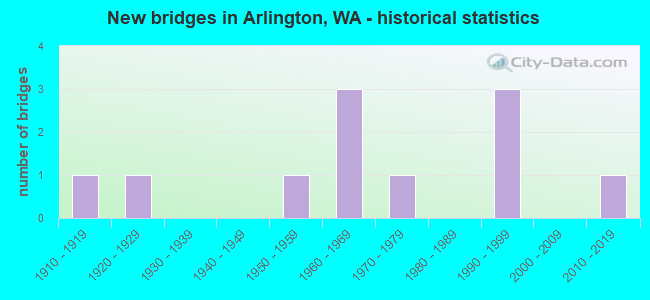
- New bridges - historical statistics
- 11910-1919
- 11920-1929
- 11950-1959
- 31960-1969
- 11970-1979
- 31990-1999
- 12010-2019
FCC Registered Antenna Towers: 260 (See the full list of FCC Registered Antenna Towers)
FCC Registered Private Land Mobile Towers: 1 (See the full list of FCC Registered Private Land Mobile Towers in Arlington, WA)
FCC Registered Broadcast Land Mobile Towers: 30 (See the full list of FCC Registered Broadcast Land Mobile Towers)
FCC Registered Microwave Towers: 35 (See the full list of FCC Registered Microwave Towers in this town)
FCC Registered Paging Towers: 1 (See the full list of FCC Registered Paging Towers)
FCC Registered Maritime Coast & Aviation Ground Towers: 6 (See the full list of FCC Registered Maritime Coast & Aviation Ground Towers)
FCC Registered Amateur Radio Licenses: 377 (See the full list of FCC Registered Amateur Radio Licenses in Arlington)
FAA Registered Aircraft Manufacturers and Dealers: 3 (See the full list of FAA Registered Manufacturers and Dealers in Arlington)
FAA Registered Aircraft: 179 (See the full list of FAA Registered Aircraft)
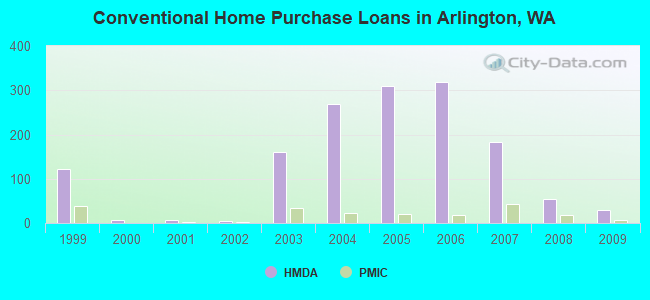
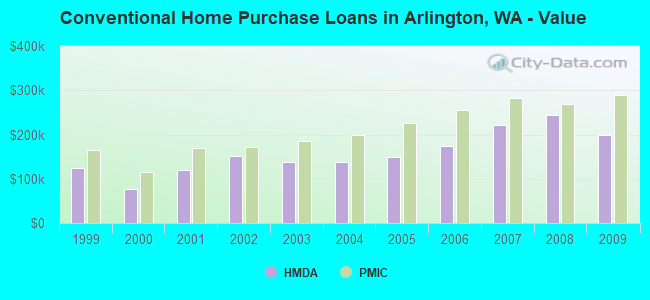
| Home Mortgage Disclosure Act Aggregated Statistics For Year 2009 (Based on 3 partial tracts) | ||||||||||||||
| A) FHA, FSA/RHS & VA Home Purchase Loans | B) Conventional Home Purchase Loans | C) Refinancings | D) Home Improvement Loans | E) Loans on Dwellings For 5+ Families | F) Non-occupant Loans on < 5 Family Dwellings (A B C & D) | G) Loans On Manufactured Home Dwelling (A B C & D) | ||||||||
|---|---|---|---|---|---|---|---|---|---|---|---|---|---|---|
| Number | Average Value | Number | Average Value | Number | Average Value | Number | Average Value | Number | Average Value | Number | Average Value | Number | Average Value | |
| LOANS ORIGINATED | 51 | $237,049 | 29 | $198,321 | 272 | $227,773 | 5 | $138,410 | 2 | $1,799,615 | 14 | $180,983 | 4 | $185,652 |
| APPLICATIONS APPROVED, NOT ACCEPTED | 3 | $187,757 | 1 | $366,530 | 33 | $232,432 | 1 | $8,340 | 0 | $0 | 3 | $182,373 | 0 | $0 |
| APPLICATIONS DENIED | 9 | $227,447 | 8 | $189,290 | 86 | $238,755 | 8 | $119,716 | 1 | $47,200 | 5 | $182,334 | 1 | $285,950 |
| APPLICATIONS WITHDRAWN | 10 | $233,220 | 9 | $202,476 | 81 | $243,815 | 2 | $144,645 | 0 | $0 | 7 | $178,086 | 1 | $123,100 |
| FILES CLOSED FOR INCOMPLETENESS | 3 | $202,560 | 1 | $126,710 | 10 | $248,966 | 1 | $38,480 | 0 | $0 | 1 | $51,300 | 0 | $0 |
Detailed HMDA statistics for the following Tracts: 0528.03 , 0535.03, 0535.04
| Private Mortgage Insurance Companies Aggregated Statistics For Year 2009 (Based on 3 partial tracts) | ||||||
| A) Conventional Home Purchase Loans | B) Refinancings | C) Non-occupant Loans on < 5 Family Dwellings (A & B) | ||||
|---|---|---|---|---|---|---|
| Number | Average Value | Number | Average Value | Number | Average Value | |
| LOANS ORIGINATED | 6 | $289,305 | 4 | $240,045 | 1 | $108,760 |
| APPLICATIONS APPROVED, NOT ACCEPTED | 2 | $358,765 | 2 | $332,380 | 0 | $0 |
| APPLICATIONS DENIED | 1 | $311,140 | 4 | $222,718 | 0 | $0 |
| APPLICATIONS WITHDRAWN | 0 | $0 | 1 | $303,700 | 0 | $0 |
| FILES CLOSED FOR INCOMPLETENESS | 0 | $0 | 0 | $0 | 0 | $0 |
Detailed PMIC statistics for the following Tracts: 0528.03 , 0535.03, 0535.04
2002 - 2018 National Fire Incident Reporting System (NFIRS) incidents
- Fire incident types reported to NFIRS in Arlington, WA
- 1,14638.7%Structure Fires
- 1,12437.9%Outside Fires
- 44415.0%Mobile Property/Vehicle Fires
- 2498.4%Other
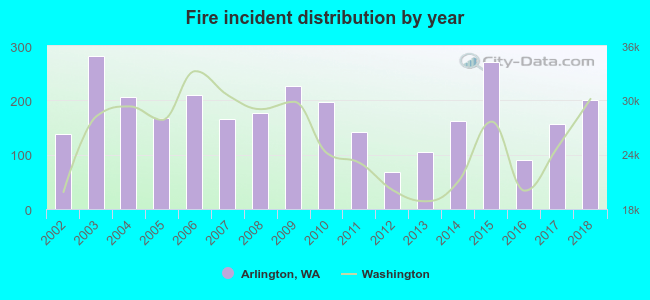 Based on the data from the years 2002 - 2018 the average number of fire incidents per year is 174. The highest number of reported fire incidents - 281 took place in 2003, and the least - 68 in 2012. The data has a rising trend.
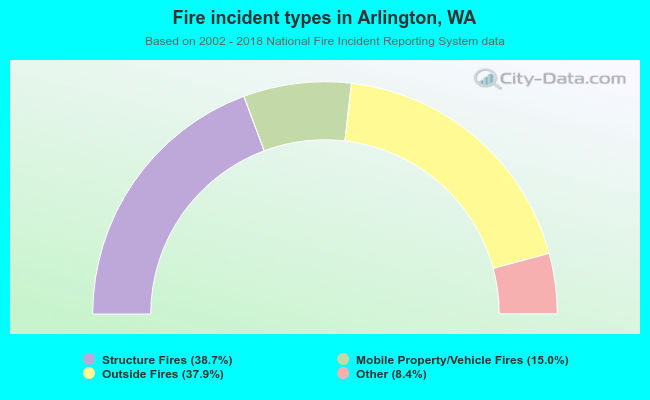 When looking into fire subcategories, the most incidents belonged to: Structure Fires (38.7%), and Outside Fires (37.9%).
Fire-safe hotels and motels in Arlington, Washington:
- Arlington Motor Inn, 2214 State Rt 530 NE, Arlington, Washington 98223 , Phone: (206) 652-9595, Fax: (206) 652-9595
- Best Western Plus Arlington/Marysville, 3721 172nd St NE, Arlington, Washington 98223 , Phone: (360) 363-4321, Fax: (360) 363-4322
- Wyndham Garden Hotel, 16710 Smokey Point Blvd, Arlington, Washington 98223 , Phone: (360) 657-0500, Fax: (360) 657-0555
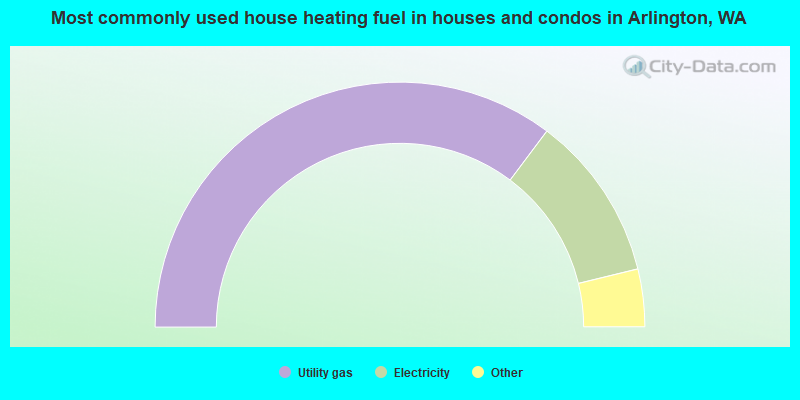
- 70.5%Utility gas
- 21.9%Electricity
- 2.8%Wood
- 2.7%Fuel oil, kerosene, etc.
- 1.3%Bottled, tank, or LP gas
- 0.6%Other fuel
- 0.2%No fuel used
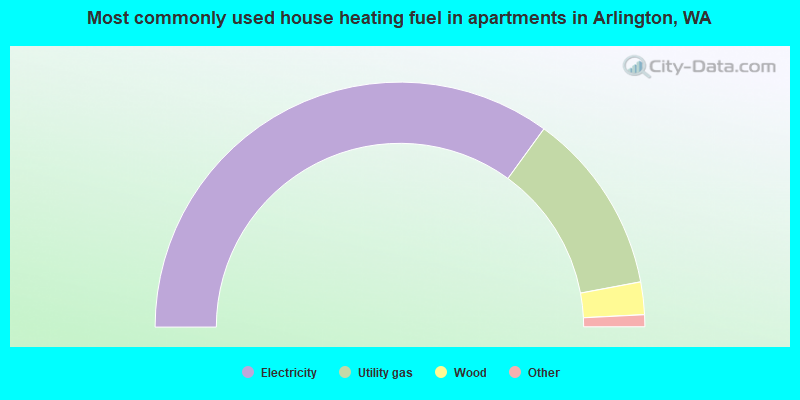
- 70.1%Electricity
- 24.1%Utility gas
- 4.3%Wood
- 1.0%Bottled, tank, or LP gas
- 0.5%Fuel oil, kerosene, etc.
Arlington compared to Washington state average:
- Unemployed percentage below state average.
- Hispanic race population percentage above state average.
- Length of stay since moving in significantly above state average.
- House age below state average.
Arlington on our top lists:
- #64 on the list of "Top 101 cities with the most local government spending on highway construction per resident (population 10,000+)"
- #97 on the list of "Top 101 cities with largest percentage of females in occupations: personal care and service occupations (population 5,000+)"
- #24 on the list of "Top 101 counties with the lowest Particulate Matter (PM2.5) Annual air pollution readings in 2012 (µg/m3)"
- #45 on the list of "Top 101 counties with the lowest number of infant deaths per 1000 residents 2007-2013 (pop. 50,000+)"
- #46 on the list of "Top 101 counties with the highest percentage of residents that exercised in the past month"
- #48 on the list of "Top 101 counties with the highest average weight of females"
- #60 on the list of "Top 101 counties with the most Other congregations (pop. 50,000+)"

|
|
Total of 255 patent applications in 2008-2024.