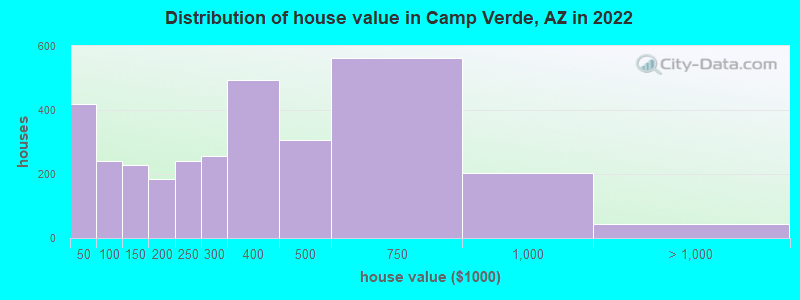
Estimated median house or condo value in 2022: $316,179 (it was $86,400 in 2000)
Camp Verde:
$316,179
AZ:
$402,800
Mean prices in 2022:all housing units: $497,398; detached houses: $554,279; townhouses or other attached units: $444,806; in 2-unit structures: $963,710; in 3-to-4-unit structures: $330,793; in 5-or-more-unit structures: $347,956; mobile homes: $254,882; occupied boats, rvs, vans, etc.: $22,781
Median gross rent in 2022: $933.
March 2022 cost of living index in Camp Verde: 93.0 (less than average, U.S. average is 100)
Percentage of residents living in poverty in 2022: 23.0%
(16.5% for White Non-Hispanic residents, 40.0% for Black residents, 31.2% for Hispanic or Latino residents, 54.5% for American Indian residents, 20.5% for other race residents, 26.6% for two or more races residents)
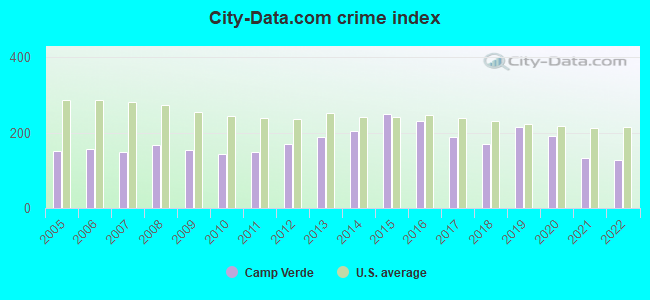
The City-Data.com crime index weighs serious crimes and violent crimes more heavily. Higher means more crime, U.S. average is 246.1. It adjusts for the number of visitors and daily workers commuting into cities.
Ancestries: German (16.2%), English (7.3%), Norwegian (5.4%), American (4.4%), European (3.1%), Irish (2.4%).
Current Local Time: MST (no DST) time zone
Incorporated in 1986
Elevation: 3151 feet
Land area: 42.6 square miles.
Population density: 292 people per square mile (very low).
760 residents are foreign born (5.0% Latin America, 0.7% Europe).
This town:
6.1%
Arizona:
13.0%
Median real estate property taxes paid for housing units with mortgages in 2022: $1,277 (0.3%) Median real estate property taxes paid for housing units with no mortgage in 2022: $1,316 (0.5%)
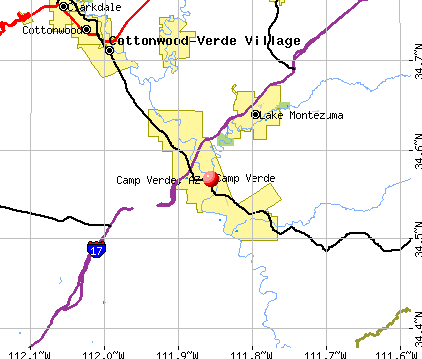
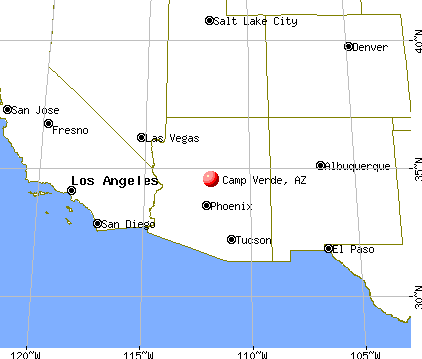
Nearest city with pop. 50,000+: Coconino, AZ (42.9 miles , pop. 74,488).
Nearest city with pop. 200,000+: Scottsdale, AZ (67.5 miles , pop. 202,705).
Nearest city with pop. 1,000,000+: Phoenix, AZ (72.9 miles , pop. 1,321,045).
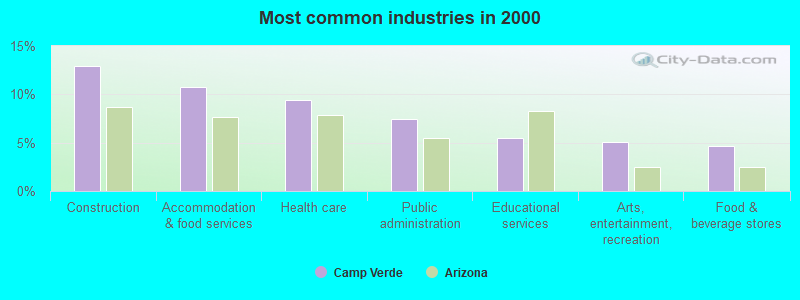
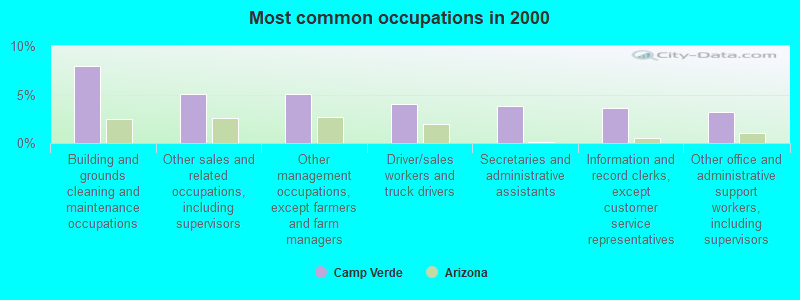
Building and grounds cleaning and maintenance occupations (7.9%)
Other sales and related occupations, including supervisors (5.0%)
Other management occupations, except farmers and farm managers (5.0%)
Driver/sales workers and truck drivers (4.0%)
Secretaries and administrative assistants (3.8%)
Information and record clerks, except customer service representatives (3.6%)
Other office and administrative support workers, including supervisors (3.2%)
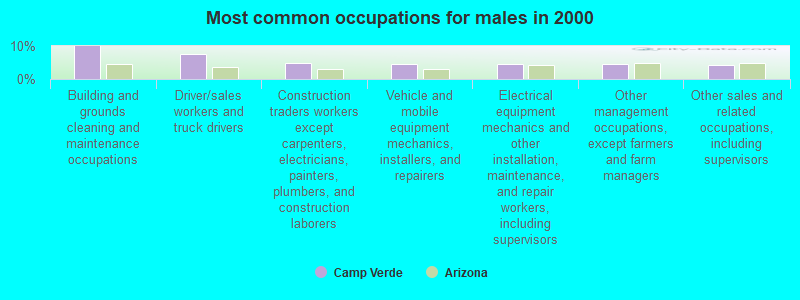
Building and grounds cleaning and maintenance occupations (9.8%)
Driver/sales workers and truck drivers (7.6%)
Construction traders workers except carpenters, electricians, painters, plumbers, and construction laborers (5.0%)
Vehicle and mobile equipment mechanics, installers, and repairers (4.6%)
Electrical equipment mechanics and other installation, maintenance, and repair workers, including supervisors (4.5%)
Other management occupations, except farmers and farm managers (4.5%)
Other sales and related occupations, including supervisors (4.4%)
Secretaries and administrative assistants (8.1%)
Information and record clerks, except customer service representatives (7.0%)
Other sales and related occupations, including supervisors (5.8%)
Building and grounds cleaning and maintenance occupations (5.7%)
Other office and administrative support workers, including supervisors (5.7%)
Other management occupations, except farmers and farm managers (5.6%)
Food and beverage serving workers, except waiters and waitresses (4.0%)
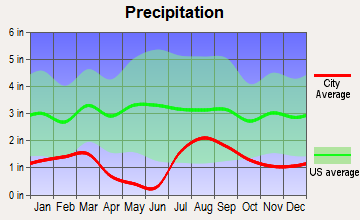
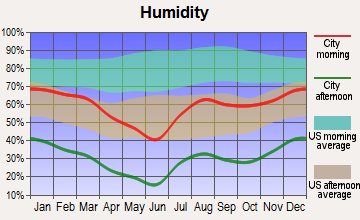
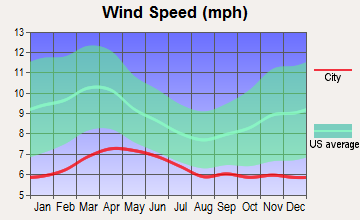
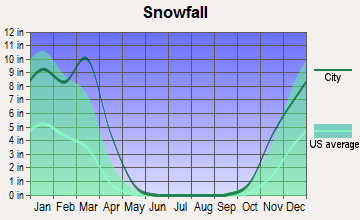
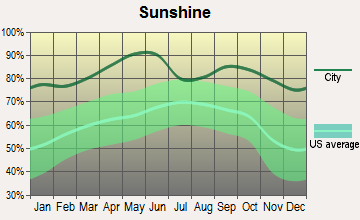
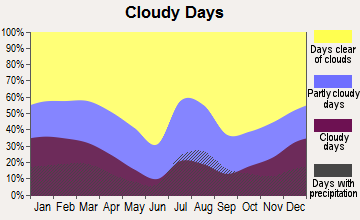
Average climate in Camp Verde, Arizona
Based on data reported by over 4,000 weather stations
Earthquake activity:
Camp Verde-area historical earthquake activity is significantly above Arizona state average. It is 2566% greater than the overall U.S. average.
On 6/28/1992 at 11:57:34, a magnitude 7.6 (6.2 MB, 7.6 MS, 7.3 MW, Depth: 0.7 mi, Class: Major, Intensity: VIII - XII) earthquake occurred 268.2 miles away from Camp Verde center, causing 3 deaths (1 shaking deaths, 2 other deaths) and 400 injuries, causing $100,000,000 total damage and $40,000,000 insured losses On 10/16/1999 at 09:46:44, a magnitude 7.4 (6.3 MB, 7.4 MS, 7.2 MW, 7.3 ML) earthquake occurred 260.9 miles away from the city center On 5/19/1940 at 04:36:40, a magnitude 7.2 (7.2 UK) earthquake occurred 239.3 miles away from Camp Verde center, causing $33,000,000 total damage On 12/31/1934 at 18:45:56, a magnitude 7.1 (7.1 UK) earthquake occurred 259.8 miles away from the city center On 10/15/1979 at 23:16:54, a magnitude 7.0 (5.7 MB, 6.9 MS, 7.0 ML, 6.4 MW) earthquake occurred 249.1 miles away from the city center On 7/21/1952 at 11:52:14, a magnitude 7.7 (7.7 UK) earthquake occurred 406.8 miles away from Camp Verde center, causing $50,000,000 total damage Magnitude types: body-wave magnitude (MB), local magnitude (ML), surface-wave magnitude (MS), moment magnitude (MW)
Natural disasters:
The number of natural disasters in Yavapai County (18) is near the US average (15). Major Disasters (Presidential) Declared: 9 Emergencies Declared: 2
Causes of natural disasters: Floods: 9, Storms: 8, Fires: 6, Drought: 1, Hurricane: 1, Tornado: 1, Winter Storm: 1, Other: 1 (Note: some incidents may be assigned to more than one category).
Hospitals and medical centers in Camp Verde:
VERDE VISTA CARE AND REHAB, INC (86 WEST SALT MINE ROAD)
Other hospitals and medical centers near Camp Verde:
ANGELS CARE HOME HEALTH OF ARIZONA (Home Health Center, about 16 miles away; COTTONWOOD, AZ)
RED ROCK CARE AND REHAB, INC (Nursing Home, about 16 miles away; COTTONWOOD, AZ)
VERDE VALLEY MEDICAL CENTER Acute Care Hospitals (about 16 miles away; COTTONWOOD, AZ)
KINDRED TRANSITIONAL CARE AND REHAB-KACHINA (Nursing Home, about 16 miles away; SEDONA, AZ)
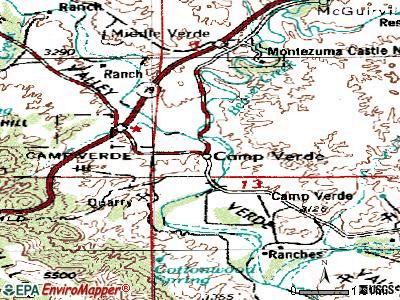
Notable locations in Camp Verde: Camp Verde Administrative Site (A), Cloverleaf Ranch (B), Copper Canyon Substation (C), Arizona Highway Maintenance Yard (D), White Bridge Picnic Area (E), Verde Ranger District Office (F), Yavapai Apache Health Clinic (G), Camp Verde Fire District Station 83 (H), Camp Verde Fire District Station 81 (I). Display/hide their locations on the map
Churches in Camp Verde include: Camp Verde United Methodist Church (A), Camp Verde Seventh Day Adventist Church (B), Camp Verde First Southern Baptist Church (C), Camp Verde Christian Church (D), Calvary Chapel of Camp Verde (E), The Church of Jesus Christ of Latter Day Saints (F), New Beginnings Church of the Nazarene (G), Verde Valley Church of Christ (H), Saint Frances Cabrini Catholic Church (I). Display/hide their locations on the map
Reservoirs: Cochran Tank (A), State Land Tank (B), Cochran Tank (C), Monroe Tank (D), Mesa Tank (E), Vee Seven Tank (F). Display/hide their locations on the map
Streams, rivers, and creeks: Grief Hill Wash (A), West Clear Creek (B), Gaddis Wash (C), Wickiup Creek (D), Beaver Creek (E), Cherry Creek (F). Display/hide their locations on the map
Hotels: Lodge at Cliff Castle Casino (333 Middle Verde Road) (1), Comfort Inn Camp Verde (340 N Industrial Dr) (2), Days Inn and Suites Camp Verde (1640 West Highway 260) (3), Montezuma Inn (396 South Main Street) (4). Display/hide their approximate locations on the map
Yavapai County has a predicted average indoor radon screening level between 2 and 4 pCi/L (pico curies per liter) - Moderate Potential
Drinking water stations with addresses in Camp Verde and their reported violations in the past:
CAMP VERDE WATER SYSTEM (Address: 499 S 6TH ST , Population served: 3,730, Groundwater):
Past health violations:
MCL, Monthly (TCR) - In MAR-2010, Contaminant: Coliform. Follow-up actions: St Violation/Reminder Notice (APR-27-2010), St Compliance achieved (JUN-11-2010)
Past monitoring violations:
Monitoring and Reporting (DBP) - Between JAN-2009 and MAR-2009, Contaminant: Chlorine. Follow-up actions: St Violation/Reminder Notice (APR-23-2009), St Compliance achieved (JUL-22-2009)
Monitoring and Reporting (DBP) - Between APR-2008 and JUN-2008, Contaminant: Chlorine. Follow-up actions: St Violation/Reminder Notice (AUG-14-2008), St Compliance achieved (AUG-19-2008)
Follow-up Or Routine LCR Tap M/R - In OCT-01-2007, Contaminant: Lead and Copper Rule. Follow-up actions: St Violation/Reminder Notice (MAY-19-2008), St Compliance achieved (NOV-18-2008)
Monitoring and Reporting (DBP) - Between OCT-2007 and DEC-2007, Contaminant: Chlorine. Follow-up actions: St Compliance achieved (FEB-11-2008)
Monitoring and Reporting (DBP) - Between JUL-2007 and SEP-2007, Contaminant: Chlorine. Follow-up actions: St Compliance achieved (FEB-11-2008)
8 minor monitoring violations
2 regular monitoring violations
10 other older monitoring violations
WESTERN HORIZONS CAMP (Address: 1472 W HORSESHOE BEND DR , Population served: 300, Groundwater):
Past monitoring violations:
6 routine major monitoring violations
BUFFALO RUN MHP (Address: 2223 ARENA DEL LOMA , Population served: 190, Groundwater):
Past health violations:
MCL, Average - Between APR-2014 and JUN-2014, Contaminant: Arsenic
MCL, Average - Between JAN-2014 and MAR-2014, Contaminant: Arsenic
MCL, Average - Between OCT-2013 and DEC-2013, Contaminant: Arsenic
MCL, Average - Between JUL-2012 and SEP-2012, Contaminant: Arsenic. Follow-up actions: St AO (w/o penalty) issued (FEB-25-2010), St Compliance achieved (DEC-28-2012)
MCL, Average - Between OCT-2011 and DEC-2011, Contaminant: Arsenic. Follow-up actions: St AO (w/o penalty) issued (FEB-25-2010), St Compliance achieved (2 times from DEC-28-2012 to JAN-08-2013)
MCL, Average - Between JUL-2011 and SEP-2011, Contaminant: Arsenic. Follow-up actions: St AO (w/o penalty) issued (FEB-25-2010), St Compliance achieved (2 times from DEC-28-2012 to JAN-08-2013)
17 other older health violations
Past monitoring violations:
Follow-up Or Routine LCR Tap M/R - In OCT-01-2013, Contaminant: Lead and Copper Rule. Follow-up actions: St Violation/Reminder Notice (DEC-23-2013)
Monitoring, Source Water (GWR) - In AUG-25-2010, Contaminant: E. COLI. Follow-up actions: St Compliance achieved (NOV-15-2010)
Monitoring, Repeat Major (TCR) - In AUG-2010, Contaminant: Coliform (TCR). Follow-up actions: St Compliance achieved (MAY-09-2011)
Follow-up Or Routine LCR Tap M/R - In OCT-01-2009, Contaminant: Lead and Copper Rule. Follow-up actions: St Violation/Reminder Notice (FEB-12-2010), St Compliance achieved (JUL-15-2010)
Follow-up Or Routine LCR Tap M/R - In OCT-01-2006, Contaminant: Lead and Copper Rule. Follow-up actions: St Compliance achieved (JUL-15-2010)
34 routine major monitoring violations
3 minor monitoring violations
17 regular monitoring violations
2 other older monitoring violations
LAKE VERDE WATER COMPANY (Address: 738 S PARKS DR , Population served: 125, Groundwater):
Past health violations:
MCL, Average - Between APR-2013 and JUN-2013, Contaminant: Arsenic. Follow-up actions: St AO (w/o penalty) issued (JUN-08-2010), St Violation/Reminder Notice (OCT-01-2013)
MCL, Average - Between APR-2013 and JUN-2013, Contaminant: Arsenic. Follow-up actions: St AO (w/o penalty) issued (JUN-08-2010), St Violation/Reminder Notice (OCT-01-2013)
MCL, Single Sample - Between OCT-2012 and DEC-2012, Contaminant: Arsenic. Follow-up actions: St AO (w/o penalty) issued (JUN-08-2010)
MCL, Average - Between OCT-2012 and DEC-2012, Contaminant: Arsenic. Follow-up actions: St AO (w/o penalty) issued (JUN-08-2010)
MCL, Average - Between JUL-2012 and SEP-2012, Contaminant: Arsenic. Follow-up actions: St AO (w/o penalty) issued (JUN-08-2010)
MCL, Single Sample - Between JUL-2012 and SEP-2012, Contaminant: Arsenic. Follow-up actions: St AO (w/o penalty) issued (JUN-08-2010)
32 other older health violations
Past monitoring violations:
Monitoring and Reporting (DBP) - Between JAN-2013 and MAR-2013, Contaminant: Chlorine. Follow-up actions: St Violation/Reminder Notice (AUG-19-2013)
Monitoring and Reporting (DBP) - Between OCT-2012 and DEC-2012, Contaminant: Chlorine. Follow-up actions: St Violation/Reminder Notice (APR-02-2013)
Monitoring and Reporting (DBP) - Between JUL-2012 and SEP-2012, Contaminant: Chlorine
Monitoring and Reporting (DBP) - Between APR-2012 and JUN-2012, Contaminant: Chlorine
Monitoring and Reporting (DBP) - Between JAN-2012 and DEC-2012, Contaminant: Total Haloacetic Acids (HAA5). Follow-up actions: St Formal NOV issued (APR-15-2013), St Violation/Reminder Notice (APR-23-2013)
12 routine major monitoring violations
2 minor monitoring violations
31 regular monitoring violations
15 other older monitoring violations
CAMP VERDE WATER SYSTEM - VERDE (Address: 499 S 6TH ST , Population served: 123, Groundwater):
Past health violations:
MCL, Monthly (TCR) - In OCT-2006, Contaminant: Coliform. Follow-up actions: St Compliance achieved (JAN-18-2007)
MCL, Monthly (TCR) - In AUG-2006, Contaminant: Coliform. Follow-up actions: St Compliance achieved (JAN-18-2007)
Past monitoring violations:
Monitoring and Reporting (DBP) - Between APR-2008 and JUN-2008, Contaminant: Chlorine. Follow-up actions: St Violation/Reminder Notice (AUG-14-2008), St Compliance achieved (AUG-19-2008)
Monitoring and Reporting (DBP) - Between OCT-2007 and DEC-2007, Contaminant: Chlorine. Follow-up actions: St Compliance achieved (FEB-11-2008)
Follow-up Or Routine LCR Tap M/R - In OCT-01-2007, Contaminant: Lead and Copper Rule. Follow-up actions: St Violation/Reminder Notice (MAY-19-2008), St Compliance achieved (NOV-18-2008)
Monitoring and Reporting (DBP) - Between JUL-2007 and SEP-2007, Contaminant: Chlorine. Follow-up actions: St Compliance achieved (FEB-11-2008)
Monitoring, Repeat Major (TCR) - In OCT-2006, Contaminant: Coliform (TCR). Follow-up actions: St Compliance achieved (JAN-18-2007)
6 routine major monitoring violations
2 minor monitoring violations
5 regular monitoring violations
11 other older monitoring violations
VERDE VALLEY CHURCH OF CHRIST (Population served: 100, Groundwater):
Past monitoring violations:
Monitoring, Source Water (GWR) - In AUG-26-2010, Contaminant: E. COLI. Follow-up actions: St Compliance achieved (OCT-12-2010)
Monitoring, Repeat Major (TCR) - In AUG-2010, Contaminant: Coliform (TCR). Follow-up actions: St Violation/Reminder Notice (SEP-30-2010), St Compliance achieved (JUL-20-2011)
Monitoring, Repeat Major (TCR) - In JUN-2009, Contaminant: Coliform (TCR). Follow-up actions: St Violation/Reminder Notice (JUL-28-2009), St Compliance achieved (NOV-15-2010)
Monitoring, Repeat Major (TCR) - In MAY-2007, Contaminant: Coliform (TCR). Follow-up actions: St Compliance achieved (FEB-06-2008)
25 routine major monitoring violations
2 minor monitoring violations
7 regular monitoring violations
MONTEZUMA HEIGHTS WATER (Population served: 60, Groundwater):
Past health violations:
MCL, Monthly (TCR) - In NOV-2012, Contaminant: Coliform. Follow-up actions: St Violation/Reminder Notice (DEC-28-2012), St Compliance achieved (FEB-11-2013)
Past monitoring violations:
Monitoring, Repeat Major (TCR) - In SEP-2006, Contaminant: Coliform (TCR). Follow-up actions: St Compliance achieved (MAY-25-2007)
2 routine major monitoring violations
CLEAR CREEK MOBILE HOME (Address: 4483 E HWY 260 , Population served: 25, Groundwater):
Past health violations:
MCL, Monthly (TCR) - In JUN-2013, Contaminant: Coliform. Follow-up actions: St Violation/Reminder Notice (JUL-29-2013), St Compliance achieved (SEP-23-2013)
MCL, Monthly (TCR) - In JUN-2008, Contaminant: Coliform. Follow-up actions: St Compliance achieved (MAR-17-2009)
Past monitoring violations:
Initial Tap Sampling for Pb and Cu - In JUL-01-2013, Contaminant: Lead and Copper Rule. Follow-up actions: St Violation/Reminder Notice (6 times from AUG-06-2013 to FEB-13-2014), St Compliance achieved (MAR-31-2014)
Follow-up Or Routine LCR Tap M/R - In OCT-01-2003, Contaminant: Lead and Copper Rule. Follow-up actions: St Compliance achieved (JAN-10-2008)
One routine major monitoring violation
Average household size:
This town:
2.5 people
Arizona:
2.6 people
Percentage of family households:
This town:
68.2%
Whole state:
66.2%
Percentage of households with unmarried partners:
This town:
7.4%
Whole state:
7.8%
Likely homosexual households (counted as self-reported same-sex unmarried-partner households)
Lesbian couples: 0.5% of all households
Gay men: 0.4% of all households
People in group quarters in Camp Verde in 2010:
535 people in local jails and other municipal confinement facilities
104 people in workers' group living quarters and job corps centers
42 people in other noninstitutional facilities
17 people in group homes intended for adults
People in group quarters in Camp Verde in 2000:
180 people in local jails and other confinement facilities (including police lockups)
74 people in schools, hospitals, or wards for the intellectually disabled
57 people in nursing homes
18 people in other noninstitutional group quarters
11 people in homes for the physically handicapped
Banks with branches in Camp Verde (2011 data):
Wells Fargo Bank, National Association: Bashas Camp Verde Branch at 650 West Finny Flats Road, branch established on 1997/03/18. Info updated 2011/04/05: Bank assets: $1,161,490.0 mil, Deposits: $905,653.0 mil, headquarters in Sioux Falls, SD, positive income, 6395 total offices, Holding Company: Wells Fargo & Company
National Bank of Arizona: Camp Verde Branch at 563 West Finney Flats Road, branch established on 1999/04/01. Info updated 2008/09/11: Bank assets: $4,485.6 mil, Deposits: $3,731.3 mil, headquarters in Tucson, AZ, positive income, Commercial Lending Specialization, 73 total offices, Holding Company: Zions Bancorporation
JPMorgan Chase Bank, National Association: Camp Verde Branch at W Finnie Flats Road, branch established on 1988/01/25. Info updated 2011/11/10: Bank assets: $1,811,678.0 mil, Deposits: $1,190,738.0 mil, headquarters in Columbus, OH, positive income, International Specialization, 5577 total offices, Holding Company: Jpmorgan Chase & Co.
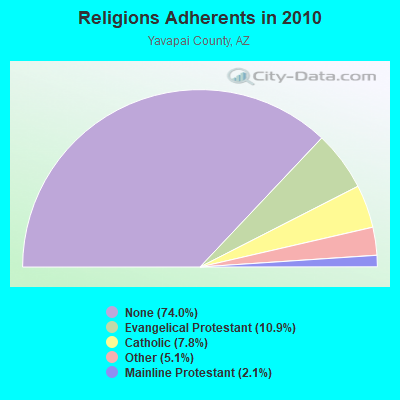
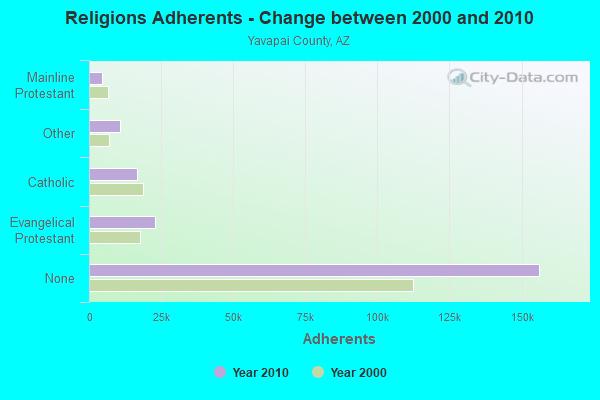
Religion statistics for Camp Verde, AZ (based on Yavapai County data)
Religion
Adherents
Congregations
Evangelical Protestant
22,957
156
Catholic
16,500
14
Other
10,740
47
Mainline Protestant
4,525
22
Orthodox
100
1
None
156,211
-
Source: Clifford Grammich, Kirk Hadaway, Richard Houseal, Dale E.Jones, Alexei Krindatch, Richie Stanley and Richard H.Taylor. 2012. 2010 U.S.Religion Census: Religious Congregations & Membership Study. Association of Statisticians of American Religious Bodies. Jones, Dale E., et al. 2002. Congregations and Membership in the United States 2000. Nashville, TN: Glenmary Research Center. Graphs represent county-level data
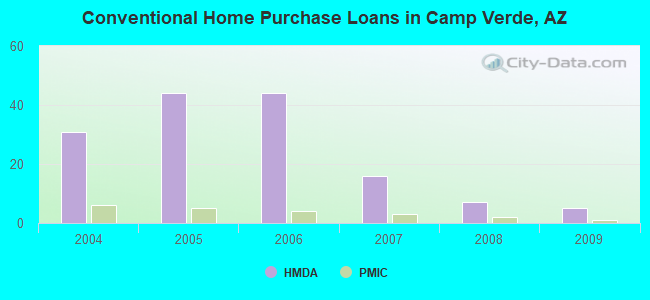
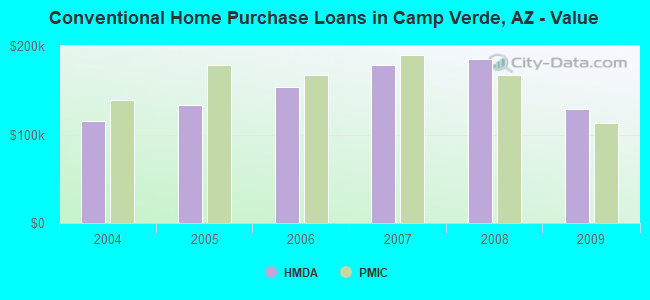
Detailed PMIC statistics for the following Tracts:0016.00
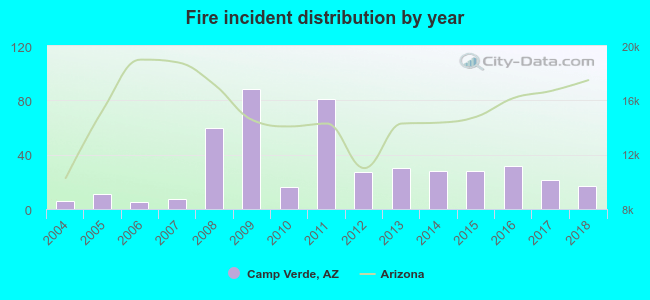
2004 - 2018 National Fire Incident Reporting System (NFIRS) incidents
Based on the data from the years 2004 - 2018 the average number of fire incidents per year is 30. The highest number of reported fires - 88 took place in 2009, and the least - 5 in 2006. The data has a rising trend.
When looking into fire subcategories, the most incidents belonged to: Structure Fires (41.8%), and Outside Fires (34.8%).
Fire incident types reported to NFIRS in Camp Verde, AZ
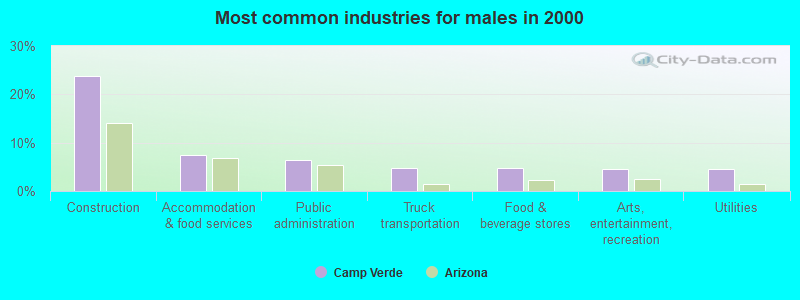
#20 on the list of "Top 101 cities with largest percentage of males in industries: other services, except public administration (population 5,000+)"
#68 on the list of "Top 101 cities with largest percentage of males in occupations: community and social service occupations (population 5,000+)"
#71 on the list of "Top 101 cities with the largest percentage of people in schools, hospitals, or wards for the mentally retarded (population 1,000+)"
#78 on the list of "Top 101 cities with the lowest number of robberies per 100,000 residents (population 5,000+)"
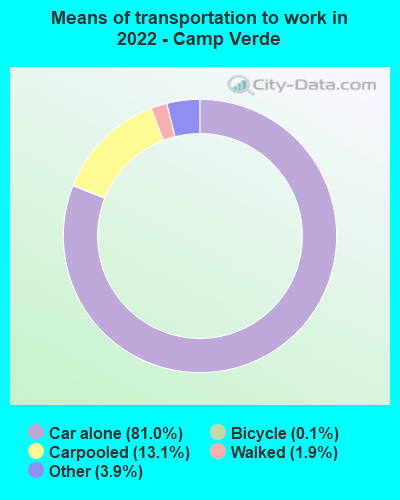
#95 on the list of "Top 101 cities with the most people carpooling to work (population 5,000+)"
#81 (86327) on the list of "Top 101 zip codes with the smallest percentage of returns reporting salary or wage in 2012 (pop 5,000+)"
#16 on the list of "Top 101 counties with the lowest Particulate Matter (PM2.5) Annual air pollution readings in 2012 (µg/m3)"
#20 on the list of "Top 101 counties with the lowest number of births per 1000 residents 2007-2013"
#45 on the list of "Top 101 counties with the lowest Particulate Matter (PM10) Annual air pollution readings in 2012 (µg/m3)"
#68 on the list of "Top 101 counties with the highest Ozone (1-hour) air pollution readings in 2012 (ppm)"
#76 on the list of "Top 101 counties with the highest number of deaths per 1000 residents 2007-2013 (pop. 50,000+)"


 Recent articles from our blog. Our writers, many of them Ph.D. graduates or candidates, create easy-to-read articles on a wide variety of topics.

 , pop. 74,488).


 Based on the data from the years 2004 - 2018 the average number of fire incidents per year is 30. The highest number of reported fires - 88 took place in 2009, and the least - 5 in 2006. The data has a rising trend.
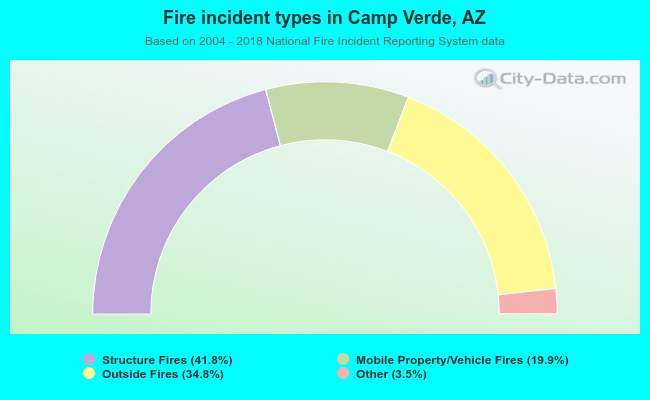 When looking into fire subcategories, the most incidents belonged to: Structure Fires (41.8%), and Outside Fires (34.8%).