Cherryvale, Kansas
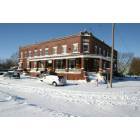
Cherryvale: Leatherock Hotel, Cherryvale, Dec. 1, 2006 record snowstorm
Cherryvale: Welcome to Cherryvale December 2006
- add
your
Submit your own pictures of this city and show them to the world
- OSM Map
- General Map
- Google Map
- MSN Map
Population change since 2000: -9.6%
 |
| Males: 1,189 | |
| Females: 968 |
| Median resident age: | 37.0 years |
| Kansas median age: | 37.6 years |
Zip codes: 67335.
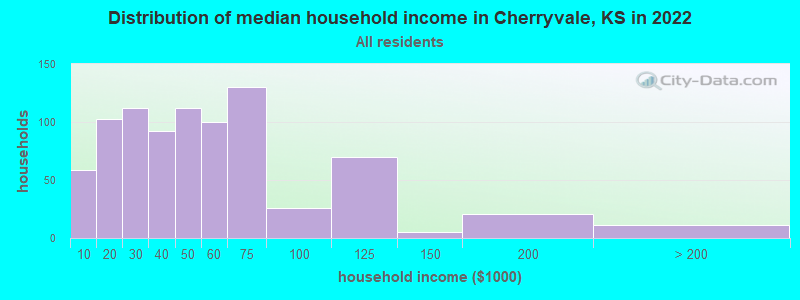
| Cherryvale: | $44,675 |
| KS: | $68,925 |
Estimated per capita income in 2022: $22,894 (it was $13,655 in 2000)
Cherryvale city income, earnings, and wages data
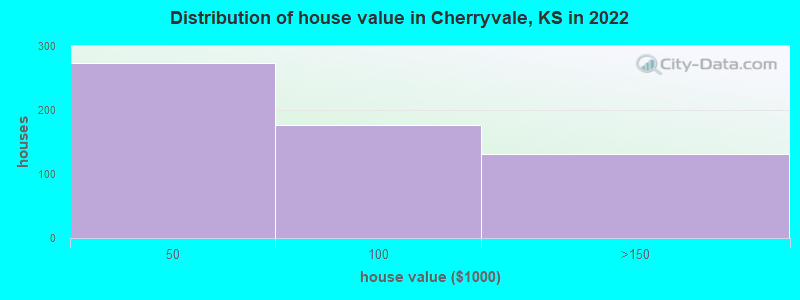
Estimated median house or condo value in 2022: $54,897 (it was $32,200 in 2000)
| Cherryvale: | $54,897 |
| KS: | $206,600 |
Mean prices in 2022: all housing units: $63,054; detached houses: $65,683; mobile homes: $23,688
Median gross rent in 2022: $743.
(20.6% for White Non-Hispanic residents, 100.0% for American Indian residents, 40.4% for two or more races residents)
Detailed information about poverty and poor residents in Cherryvale, KS

Compare current foreclosures near Cherryvale, KS:
| Photo | Address | Area | Beds / Baths | Price | Details |
|---|---|---|---|---|---|

|
#1
E 3rd St
Cherryvale, KS 67335
|
- sq. feet
|
- baths - beds |
$29,900
|
show details |

|
#2
Cr 5700
Cherryvale, KS 67335
|
- sq. feet
|
- baths - beds |
show details | |

|
#3
Cr 5000
Cherryvale, KS 67335
|
- sq. feet
|
- baths - beds |
show details | |

|
#4
Belmont Ave
Parsons, KS 67357
|
936 sq. feet
|
1 baths 2 beds |
$14,900
|
show details |

|
#5
E Sycamore St
Independence, KS 67301
|
1,211 sq. feet
|
1 baths 3 beds |
show details | |

|
#6
Spruce St
Coffeyville, KS 67337
|
2,072 sq. feet
|
1 baths 3 beds |
show details | |

|
#7
Cr 1250
Coffeyville, KS 67337
|
1,440 sq. feet
|
2 baths 3 beds |
show details | |

|
#8
W 1st St
Coffeyville, KS 67337
|
792 sq. feet
|
1 baths 2 beds |
show details | |

|
#9
W 3rd St
Coffeyville, KS 67337
|
1,221 sq. feet
|
1 baths 3 beds |
show details | |

|
#10
S Park Ave
Parsons, KS 67357
|
1,508 sq. feet
|
2 baths 3 beds |
show details |
| Photo | Address | Area | Beds / Baths | Price | Details |
|---|---|---|---|---|---|

|
#11
S 28th St
Parsons, KS 67357
|
960 sq. feet
|
1 baths 3 beds |
show details | |

|
#12
Dirr Ave
Parsons, KS 67357
|
1,180 sq. feet
|
1 baths 2 beds |
show details | |

|
#13
Orchard Ln
Neodesha, KS 66757
|
1,137 sq. feet
|
1 baths 3 beds |
show details | |

|
#14
250th Rd
Neodesha, KS 66757
|
1,188 sq. feet
|
1 baths 2 beds |
show details | |

|
#15
N 17th Pl
Independence, KS 67301
|
1,440 sq. feet
|
2 baths 3 beds |
show details | |

|
#16
N 11th St
Independence, KS 67301
|
1,186 sq. feet
|
1 baths 2 beds |
show details | |

|
#17
E 3rd St
Altamont, KS 67330
|
- sq. feet
|
- baths - beds |
show details | |

|
#18
Gabriel Ave
Parsons, KS 67357
|
- sq. feet
|
- baths - beds |
show details | |

|
#19
Rosewood Ave
Parsons, KS 67357
|
- sq. feet
|
- baths - beds |
show details | |

|
#20
S 24th St Lot 1
Independence, KS 67301
|
- sq. feet
|
- baths - beds |
show details |
| Photo | Address | Area | Beds / Baths | Price | Details |
|---|---|---|---|---|---|

|
#21
N Cline Rd
Coffeyville, KS 67337
|
- sq. feet
|
- baths - beds |
show details | |

|
#22
W 2nd St
Coffeyville, KS 67337
|
- sq. feet
|
- baths - beds |
show details | |

|
#23
W Laurel St Lot 14
Independence, KS 67301
|
- sq. feet
|
- baths - beds |
show details | |

|
#24
N 13th St
Independence, KS 67301
|
- sq. feet
|
- baths - beds |
show details | |

|
#25
Lewark St Apt 1-C5
Coffeyville, KS 67337
|
- sq. feet
|
- baths - beds |
show details | |

|
#26
Southern Ave
Parsons, KS 67357
|
- sq. feet
|
- baths - beds |
show details | |

|
#27
Gabiral Ave, Apt 224
Parsons, KS 67357
|
- sq. feet
|
- baths - beds |
show details | |

|
#28
Cr 1675
Coffeyville, KS 67337
|
- sq. feet
|
- baths - beds |
show details | |

|
Check over 1 million property listings on Foreclosure.com!
|
browse all offers | |||


- 1,91290.9%White alone
- 1195.7%Two or more races
- 482.3%Asian alone
- 80.4%American Indian alone
- 80.4%Hispanic
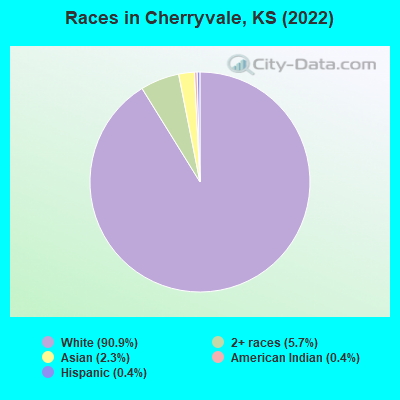
Races in Cherryvale detailed stats: ancestries, foreign born residents, place of birth
According to our research of Kansas and other state lists, there were 12 registered sex offenders living in Cherryvale, Kansas as of April 29, 2024.
The ratio of all residents to sex offenders in Cherryvale is 186 to 1.
Type |
2009 |
2010 |
2011 |
2012 |
2017 |
2018 |
2019 |
2020 |
2021 |
2022 |
|---|---|---|---|---|---|---|---|---|---|---|
| Murders (per 100,000) | 0 (0.0) | 0 (0.0) | 0 (0.0) | 0 (0.0) | 0 (0.0) | 4 (185.7) | 0 (0.0) | 0 (0.0) | 0 (0.0) | 0 (0.0) |
| Rapes (per 100,000) | 0 (0.0) | 0 (0.0) | 0 (0.0) | 0 (0.0) | 2 (92.5) | 1 (46.4) | 2 (94.0) | 0 (0.0) | 1 (47.7) | 1 (46.6) |
| Robberies (per 100,000) | 0 (0.0) | 0 (0.0) | 0 (0.0) | 0 (0.0) | 0 (0.0) | 0 (0.0) | 1 (47.0) | 0 (0.0) | 0 (0.0) | 1 (46.6) |
| Assaults (per 100,000) | 1 (44.7) | 2 (84.5) | 1 (42.0) | 3 (128.1) | 15 (694.1) | 4 (185.7) | 2 (94.0) | 3 (141.9) | 8 (381.3) | 7 (326.2) |
| Burglaries (per 100,000) | 6 (268.1) | 0 (0.0) | 1 (42.0) | 8 (341.6) | 24 (1,111) | 21 (974.9) | 13 (611.2) | 11 (520.3) | 9 (429.0) | 8 (372.8) |
| Thefts (per 100,000) | 45 (2,011) | 2 (84.5) | 8 (335.9) | 10 (427.0) | 45 (2,082) | 34 (1,578) | 18 (846.3) | 20 (946.1) | 18 (858.0) | 24 (1,118) |
| Auto thefts (per 100,000) | 5 (223.4) | 0 (0.0) | 1 (42.0) | 0 (0.0) | 4 (185.1) | 2 (92.9) | 8 (376.1) | 5 (236.5) | 3 (143.0) | 6 (279.6) |
| Arson (per 100,000) | 0 (0.0) | 0 (0.0) | 0 (0.0) | 1 (42.7) | 2 (92.5) | 0 (0.0) | 1 (47.0) | 1 (47.3) | 1 (47.7) | 0 (0.0) |
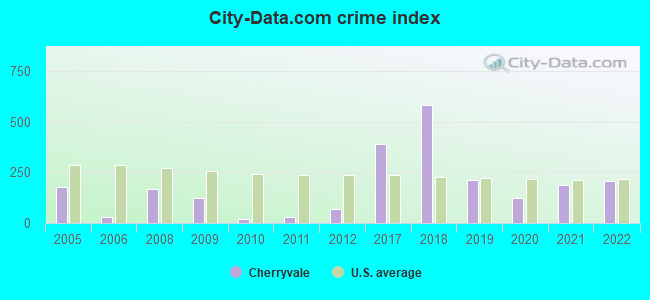
| City-Data.com crime index | 126.0 | 20.3 | 28.1 | 66.6 | 388.7 | 584.5 | 214.9 | 121.6 | 190.2 | 209.7 |
The City-Data.com crime index weighs serious crimes and violent crimes more heavily. Higher means more crime, U.S. average is 246.1. It adjusts for the number of visitors and daily workers commuting into cities.
Crime rate in Cherryvale detailed stats: murders, rapes, robberies, assaults, burglaries, thefts, arson
Full-time law enforcement employees in 2021, including police officers: 7 (6 officers - 4 male; 2 female).
| Officers per 1,000 residents here: | 2.86 |
| Kansas average: | 2.70 |
 Recent articles from our blog. Our writers, many of them Ph.D. graduates or candidates, create easy-to-read articles on a wide variety of topics.

 | Anyone here from cherryvale? (14 replies) |
| Anyone familiar with Independence KS? (35 replies) |
| Anyone From Cherryvale?? (25 replies) |
| Cherryvale Ks (14 replies) |
| Coffeyville vs. Independence? (8 replies) |
| Merry Christmas Kansans! (4 replies) |
Latest news from Cherryvale, KS collected exclusively by city-data.com from local newspapers, TV, and radio stations
Ancestries: German (18.2%), American (11.7%), Italian (11.6%), English (10.6%), Irish (10.6%), British (1.3%).
Current Local Time: CST time zone
Elevation: 850 feet
Land area: 1.55 square miles.
Population density: 1,390 people per square mile (low).
3 residents are foreign born
| This city: | 0.1% |
| Kansas: | 7.1% |
Median real estate property taxes paid for housing units with mortgages in 2022: $1,337 (2.0%)
Median real estate property taxes paid for housing units with no mortgage in 2022: $735 (1.7%)
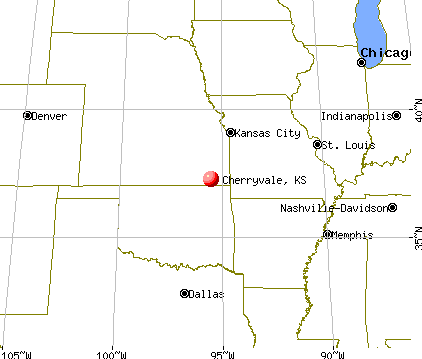
Nearest city with pop. 50,000+: Tulsa, OK  (81.5 miles , pop. 393,049).
Nearest city with pop. 1,000,000+: Dallas, TX (316.9 miles , pop. 1,188,580).
Nearest cities:
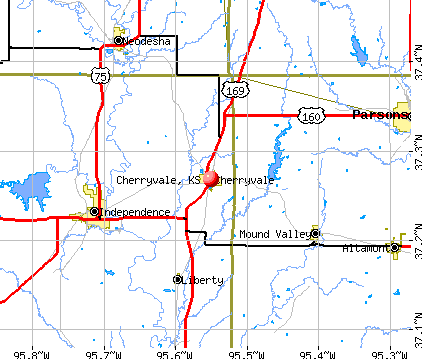
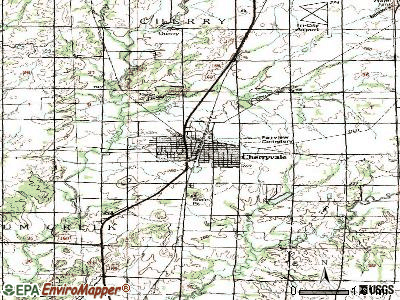
), ), Latitude: 37.27 N, Longitude: 95.55 W
Area code: 620

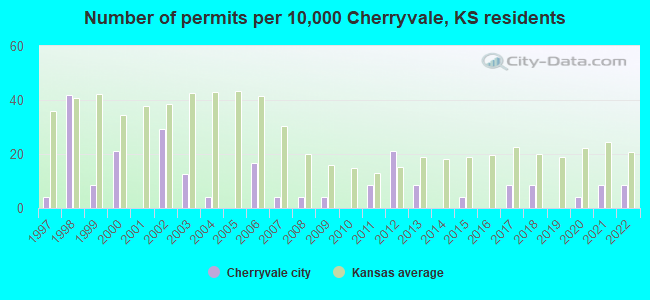
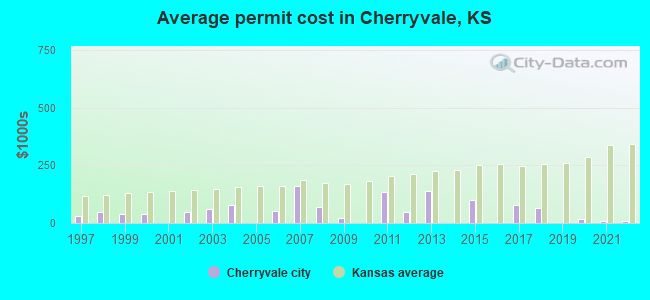
Single-family new house construction building permits:
- 2022: 2 buildings, average cost: $10,000
- 2021: 2 buildings, average cost: $10,000
- 2020: 1 building, cost: $18,500
- 2018: 2 buildings, average cost: $66,500
- 2017: 2 buildings, average cost: $77,500
- 2015: 1 building, cost: $100,000
- 2013: 2 buildings, average cost: $140,000
- 2012: 5 buildings, average cost: $47,200
- 2011: 2 buildings, average cost: $135,000
- 2009: 1 building, cost: $20,000
- 2008: 1 building, cost: $70,000
- 2007: 1 building, cost: $160,000
- 2006: 4 buildings, average cost: $51,500
- 2004: 1 building, cost: $79,300
- 2003: 3 buildings, average cost: $61,300
- 2002: 7 buildings, average cost: $48,600
- 2000: 5 buildings, average cost: $39,300
- 1999: 2 buildings, average cost: $39,500
- 1998: 10 buildings, average cost: $46,400
- 1997: 1 building, cost: $30,000
| Here: | 2.1% |
| Kansas: | 2.0% |
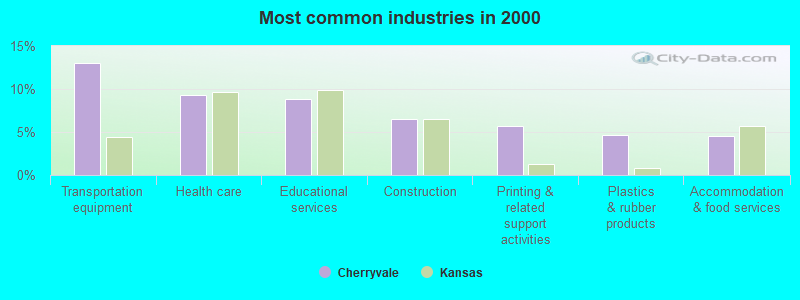
- Transportation equipment (13.0%)
- Health care (9.3%)
- Educational services (8.8%)
- Construction (6.5%)
- Printing & related support activities (5.7%)
- Plastics & rubber products (4.7%)
- Accommodation & food services (4.5%)
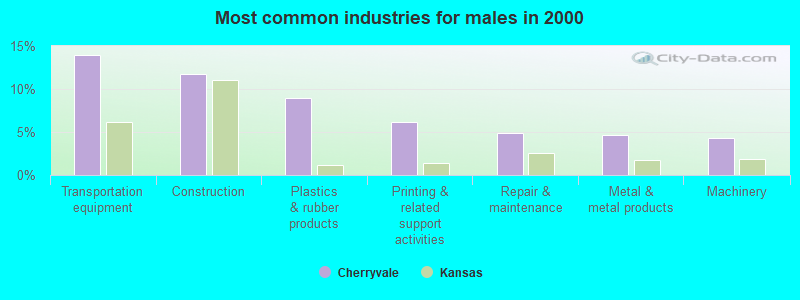
- Transportation equipment (14.0%)
- Construction (11.7%)
- Plastics & rubber products (8.9%)
- Printing & related support activities (6.1%)
- Repair & maintenance (4.8%)
- Metal & metal products (4.7%)
- Machinery (4.3%)
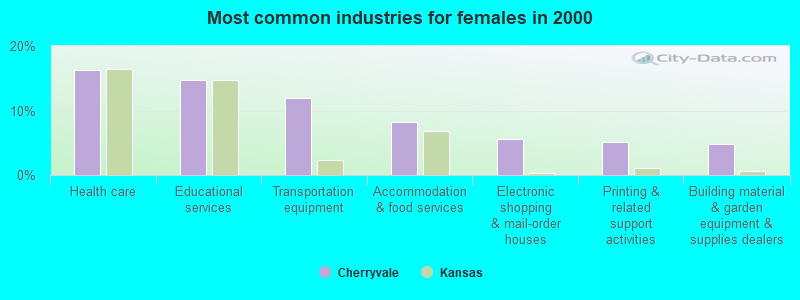
- Health care (16.3%)
- Educational services (14.7%)
- Transportation equipment (12.0%)
- Accommodation & food services (8.3%)
- Electronic shopping & mail-order houses (5.6%)
- Printing & related support activities (5.2%)
- Building material & garden equipment & supplies dealers (4.8%)
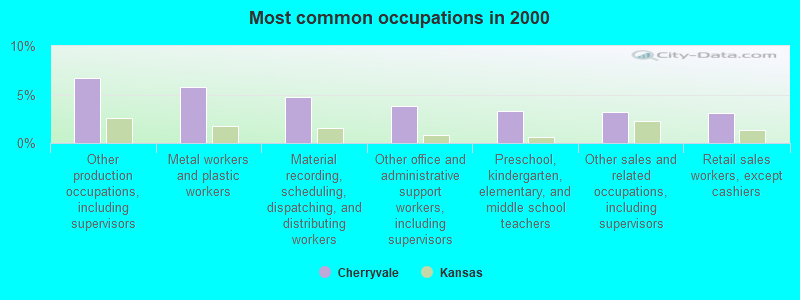
- Other production occupations, including supervisors (6.7%)
- Metal workers and plastic workers (5.8%)
- Material recording, scheduling, dispatching, and distributing workers (4.7%)
- Other office and administrative support workers, including supervisors (3.8%)
- Preschool, kindergarten, elementary, and middle school teachers (3.3%)
- Other sales and related occupations, including supervisors (3.2%)
- Retail sales workers, except cashiers (3.1%)
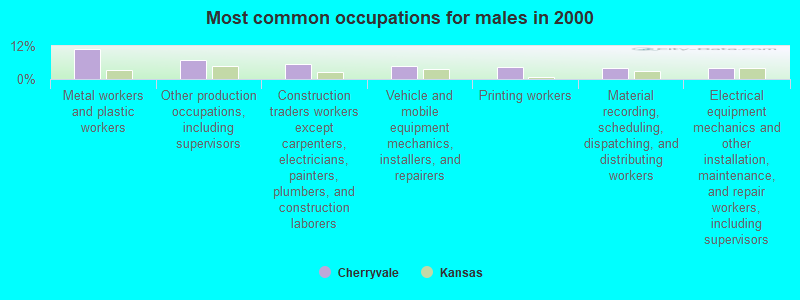
- Metal workers and plastic workers (11.0%)
- Other production occupations, including supervisors (7.1%)
- Construction traders workers except carpenters, electricians, painters, plumbers, and construction laborers (5.6%)
- Vehicle and mobile equipment mechanics, installers, and repairers (4.8%)
- Printing workers (4.3%)
- Material recording, scheduling, dispatching, and distributing workers (4.1%)
- Electrical equipment mechanics and other installation, maintenance, and repair workers, including supervisors (3.9%)
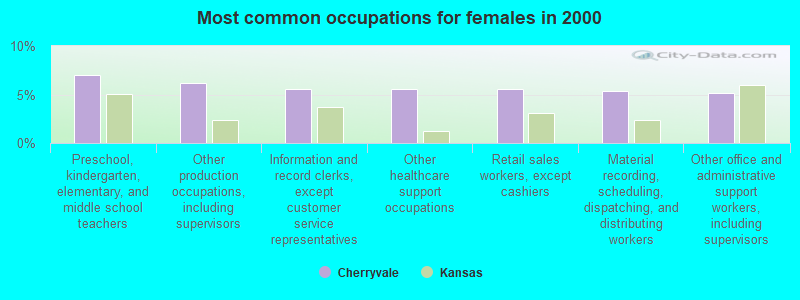
- Preschool, kindergarten, elementary, and middle school teachers (7.0%)
- Other production occupations, including supervisors (6.2%)
- Information and record clerks, except customer service representatives (5.6%)
- Other healthcare support occupations (5.6%)
- Retail sales workers, except cashiers (5.6%)
- Material recording, scheduling, dispatching, and distributing workers (5.4%)
- Other office and administrative support workers, including supervisors (5.2%)
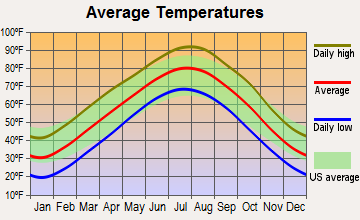
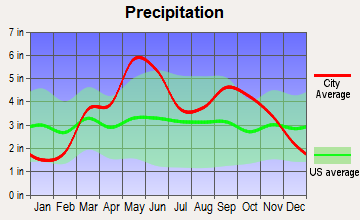
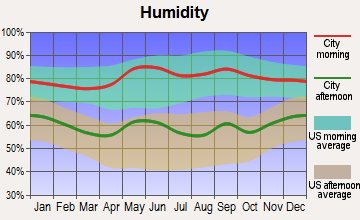
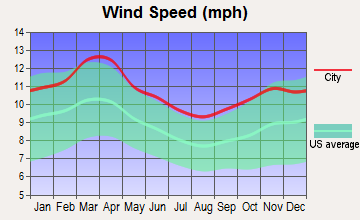
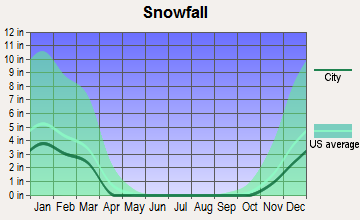
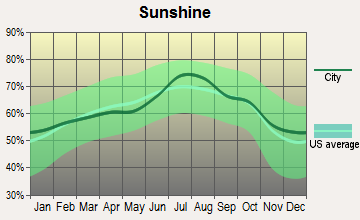
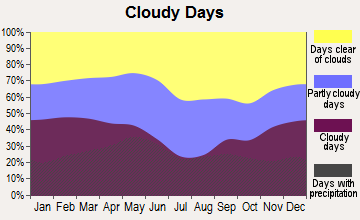
Average climate in Cherryvale, Kansas
Based on data reported by over 4,000 weather stations
|
|

(lower is better)
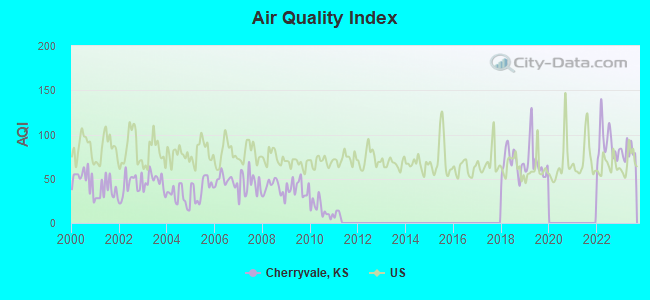
Air Quality Index (AQI) level in 2023 was 81.1. This is about average.
| City: | 81.1 |
| U.S.: | 72.6 |
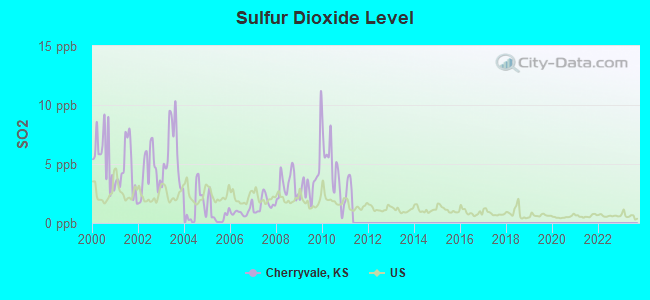
Sulfur Dioxide (SO2) [ppb] level in 2010 was 4.44. This is significantly worse than average. Closest monitor was 15.0 miles away from the city center.
| City: | 4.44 |
| U.S.: | 1.51 |
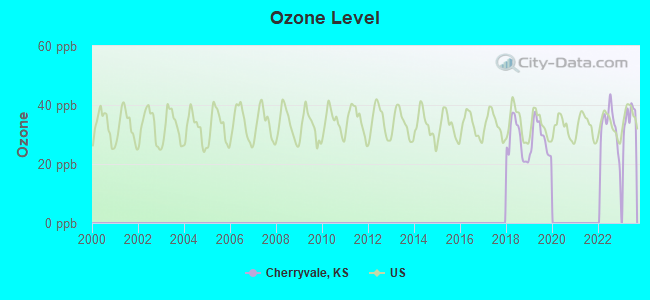
Ozone [ppb] level in 2023 was 36.3. This is about average. Closest monitor was 15.9 miles away from the city center.
| City: | 36.3 |
| U.S.: | 33.3 |
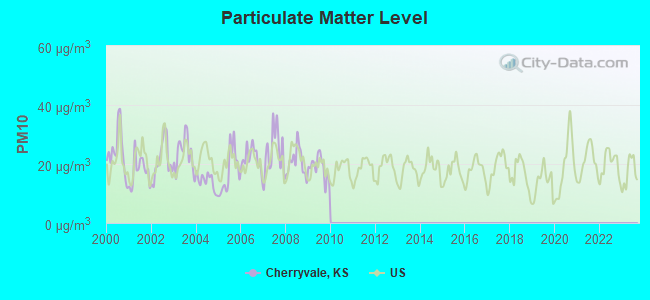
Particulate Matter (PM10) [µg/m3] level in 2009 was 18.8. This is about average. Closest monitor was 15.0 miles away from the city center.
| City: | 18.8 |
| U.S.: | 19.2 |
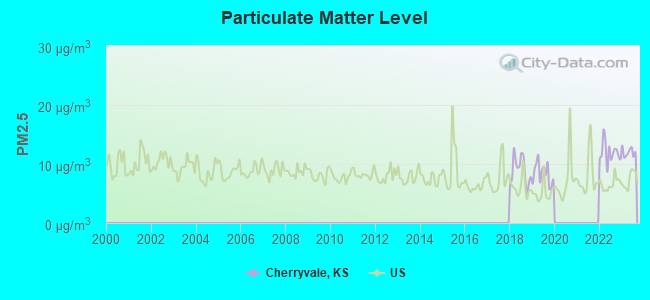
Particulate Matter (PM2.5) [µg/m3] level in 2023 was 12.0. This is significantly worse than average. Closest monitor was 24.6 miles away from the city center.
| City: | 12.0 |
| U.S.: | 8.1 |
Tornado activity:
Cherryvale-area historical tornado activity is near Kansas state average. It is 97% greater than the overall U.S. average.
On 9/27/1959, a category F4 (max. wind speeds 207-260 mph) tornado 26.9 miles away from the Cherryvale city center killed one person and injured one person and caused between $5000 and $50,000 in damages.
On 5/4/2003, a category F4 tornado 26.9 miles away from the city center killed 4 people and injured 30 people and caused $20 million in damages.
Earthquake activity:
Cherryvale-area historical earthquake activity is significantly above Kansas state average. It is 731% greater than the overall U.S. average.On 9/3/2016 at 12:02:44, a magnitude 5.8 (5.8 MW, Depth: 3.5 mi, Class: Moderate, Intensity: VI - VII) earthquake occurred 96.0 miles away from the city center
On 11/6/2011 at 03:53:10, a magnitude 5.7 (5.7 MW, Depth: 3.2 mi) earthquake occurred 137.8 miles away from Cherryvale center
On 11/7/2016 at 01:44:24, a magnitude 5.0 (5.0 MW, Depth: 2.8 mi) earthquake occurred 112.4 miles away from the city center
On 11/12/2014 at 21:40:00, a magnitude 4.9 (4.9 MW, Depth: 2.5 mi, Class: Light, Intensity: IV - V) earthquake occurred 113.9 miles away from Cherryvale center
On 2/13/2016 at 17:07:06, a magnitude 5.1 (5.1 MW, Depth: 5.2 mi) earthquake occurred 182.8 miles away from the city center
On 11/5/2011 at 07:12:45, a magnitude 4.8 (4.8 MW, Depth: 1.9 mi) earthquake occurred 136.7 miles away from the city center
Magnitude types: moment magnitude (MW)
Natural disasters:
The number of natural disasters in Montgomery County (13) is near the US average (15).Major Disasters (Presidential) Declared: 9
Emergencies Declared: 2
Causes of natural disasters: Floods: 8, Storms: 8, Tornadoes: 4, Winds: 4, Winter Storms: 2, Hurricane: 1, Ice Storm: 1, Landslide: 1, Mudslide: 1, Snowstorm: 1, Other: 1 (Note: some incidents may be assigned to more than one category).
Hospitals and medical centers in Cherryvale:
- CHERRYVALE NURSING AND REHABILITATION CENTER (1001 W MAIN ST PO BOX 366)
- SUNNY ACRES OF CHERRYVALE (1001 W MAIN ST)
Other hospitals and medical centers near Cherryvale:
- GLENWOOD ESTATE (Nursing Home, about 9 miles away; INDEPENDENCE, KS)
- COLONIAL LODGE (Nursing Home, about 10 miles away; INDEPENDENCE, KS)
- LODGE AT INDEPENDENCE, THE (Nursing Home, about 10 miles away; INDEPENDENCE, KS)
- THE REGAL ESTATE OF GLENWOOD (Nursing Home, about 10 miles away; INDEPENDENCE, KS)
- MEADOWBROOK TERRACE OF INDEPENDENCE (Nursing Home, about 10 miles away; INDEPENDENCE, KS)
- HEATHERWOOD ESTATES (Nursing Home, about 10 miles away; INDEPENDENCE, KS)
- MONTGOMERY PLACE NURSING CENTER (Nursing Home, about 10 miles away; INDEPENDENCE, KS)
Colleges/universities with over 2000 students nearest to Cherryvale:
- Northeastern Oklahoma A&M College (about 47 miles; Miami, OK; Full-time enrollment: 2,075)
- Allen County Community College (about 48 miles; Iola, KS; FT enrollment: 2,089)
- Pittsburg State University (about 48 miles; Pittsburg, KS; FT enrollment: 6,838)
- Missouri Southern State University (about 62 miles; Joplin, MO; FT enrollment: 4,456)
- Rogers State University (about 66 miles; Claremore, OK; FT enrollment: 3,482)
- Crowder College (about 73 miles; Neosho, MO; FT enrollment: 3,675)
- University of Tulsa (about 81 miles; Tulsa, OK; FT enrollment: 3,702)
Public high school in Cherryvale:
- CHERRYVALE SR / MIDDLE SCHOOL (Students: 474, Location: 700 S CARSON, Grades: 7-12)
Public elementary/middle school in Cherryvale:
- LINCOLN CENTRAL ELEM (Students: 336, Location: 401 E MAIN, Grades: PK-6)
User-submitted facts and corrections:
- I stayed at the Leatherock Hotel in Cherryvale, Ks two times in the fall of 2006. Both visits were fabulous! The owner is very knowledgable about Cherryvale history and current events. The Leatherock Hotel is also a museum of RailRoad history of the area and is located across from several tracks which are used regularly by several railroad holdings. Our room was warm, cheerful, fully outfitted with kitchen facility and private bath, large bed and couch for relaxing while viewing videos or DVD's on the tv supplied w/the room. The history and lore of the Leatherock Hotel is what prompted me to search out lodging for my visits to Kansas. I particularly wished to stay there in order to feel a part of the historical town of Cherryvale and the soon to be 100 year old hotel. The owner, Wayne, is making extra efforts to restore the hotel in keeping w/themes pertinent to the area. The entire building is re wired and boasts new plumbing throughout while maintaining the environment; atmosphere of the era in which it was built. Wayne is an excellent source of all kinds of local history complete w/photographs, news articles, artifacts and more. Our suite, the Santa Fe, was complete w/decor and items reminescent of times past while offering comforts of today. There is the Bertha Leatherock room (name of hotel!) and Route 66 suite. Wayne lives on site where his work restoring the huge building is ongoing. He has fantastic plans. Our stay could not have been more comfortable, more catered to or fun! Our breakfast consisted of fresh fruit (several kinds!), fresh coffee we made in the room, orange juice, cereal and dougnuts. Far too much for any one, not to mention, 4! people to finish feeling way too satisfied. The attention and extras far exceeded the charge for our room..we were and are totally amazed. If you love history, love to be a part of living history and like to visit areas as they truly are; not pretend to be, I recommend a visit to the Leatherock Hotel in Cherryvale, Ks
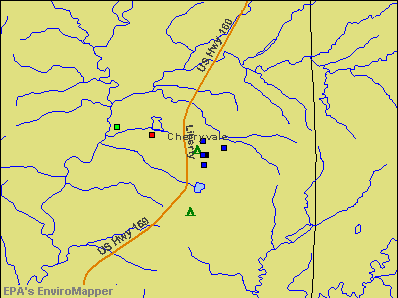
Points of interest:
Notable locations in Cherryvale: Cherryvale Police Department (A), Montgomery County Rural Fire District Station 4 (B), Cherryvale Public Library (C), Cherryvale Museum (D), Cherryvale City Hall (E), Cherryvale Fire Department (F). Display/hide their locations on the map
Churches in Cherryvale include: Bible Holiness Church (A), Cherryvale Assembly of God Church (B), Cherryvale Christian Church (C), Cherryvale United Methodist Church (D), Church of the Nazarene (E), First Baptist Church (F), First Presbyterian Church (G), First Southern Baptist Church (H), New Life Praise and Worship Church (I). Display/hide their locations on the map
Park in Cherryvale: Logan Park (1). Display/hide its location on the map
Hotels: Big Hill Lodge (415 South Liberty Street), Leatherock Hotel Bed & Breakfast (420 North Depot Street).
Birthplace of: Louise Brooks - (1906-1985), actor, Eugene Maxwell Frank - United Methodist bishop, Leason Adams - Geophysicist, Vivian Vance.
Drinking water stations with addresses in Cherryvale and their reported violations in the past:
CHERRYVALE, CITY OF (Population served: 2,293, Purch surface water):Past monitoring violations:
- One minor monitoring violation
Drinking water stations with addresses in Cherryvale that have no violations reported:
- LABETTE CO RWD 3 (Population served: 420, Primary Water Source Type: Purch surface water)
| This city: | 2.5 people |
| Kansas: | 2.5 people |
| This city: | 66.1% |
| Whole state: | 66.0% |
| This city: | 7.2% |
| Whole state: | 5.8% |
Likely homosexual households (counted as self-reported same-sex unmarried-partner households)
- Lesbian couples: 0.2% of all households
- Gay men: 0.2% of all households
43 people in nursing homes in 2000
Banks with branches in Cherryvale (2011 data):
- The Peoples State Bank: at 200 West Main Street, branch established on 1880/01/01. Info updated 2006/11/03: Bank assets: $16.7 mil, Deposits: $10.1 mil, local headquarters, positive income, Agricultural Specialization, 1 total offices, Holding Company: First Howard Bankshares, Inc.
- Community National Bank & Trust: Cherryvale Branch at 333 West Main, branch established on 1991/02/25. Info updated 2011/01/06: Bank assets: $766.3 mil, Deposits: $636.2 mil, headquarters in Chanute, KS, positive income, Commercial Lending Specialization, 25 total offices, Holding Company: Community Bancorp, Inc.
For population 15 years and over in Cherryvale:
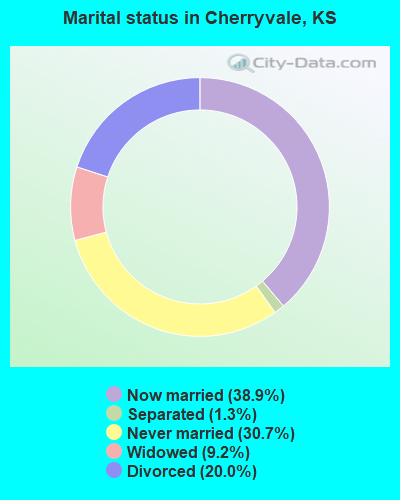
- Never married: 30.7%
- Now married: 38.9%
- Separated: 1.3%
- Widowed: 9.2%
- Divorced: 20.0%
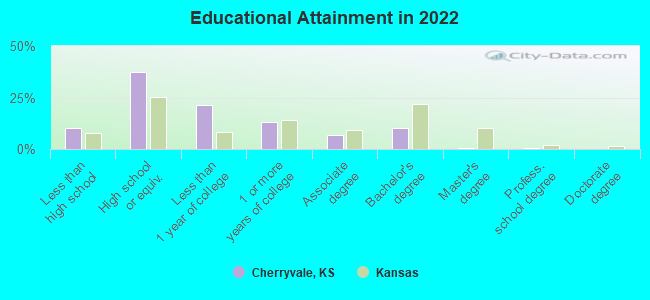
For population 25 years and over in Cherryvale:
- High school or higher: 88.6%
- Bachelor's degree or higher: 10.7%
- Graduate or professional degree: 0.6%
- Unemployed: 8.9%
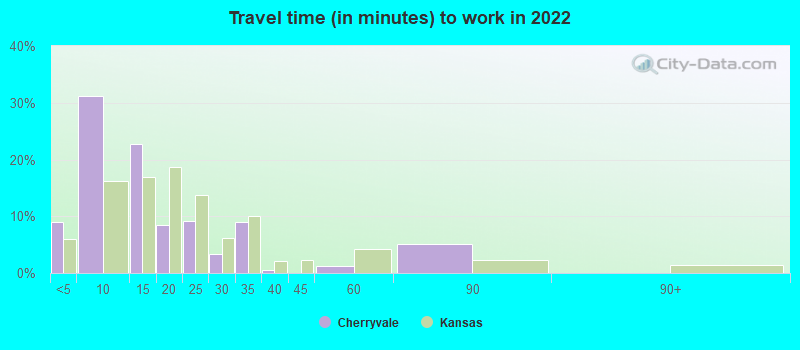
- Mean travel time to work (commute): 21.9 minutes
| Here: | 7.2 |
| Kansas average: | 11.5 |
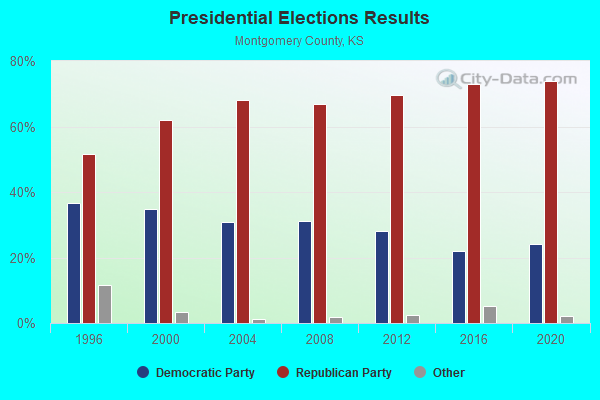
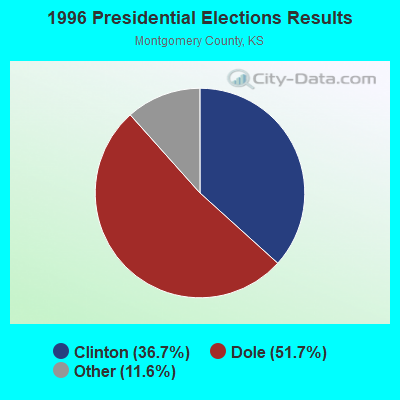
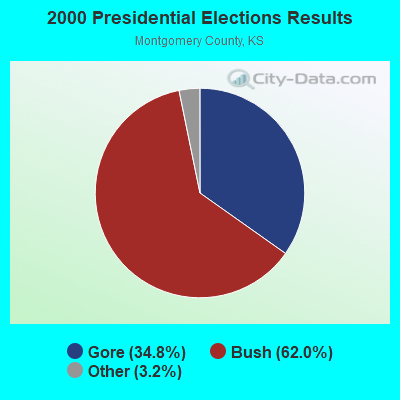

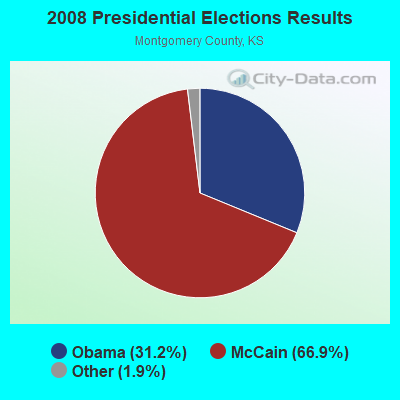

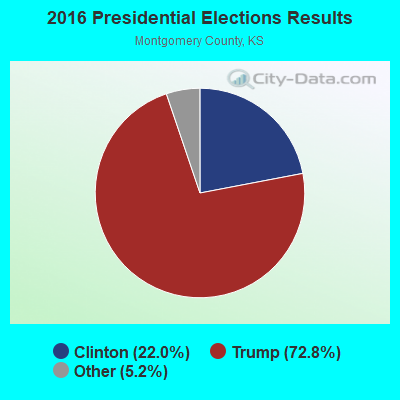
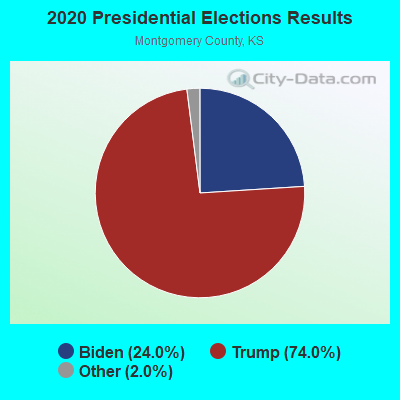
Graphs represent county-level data. Detailed 2008 Election Results
Religion statistics for Cherryvale, KS (based on Montgomery County data)
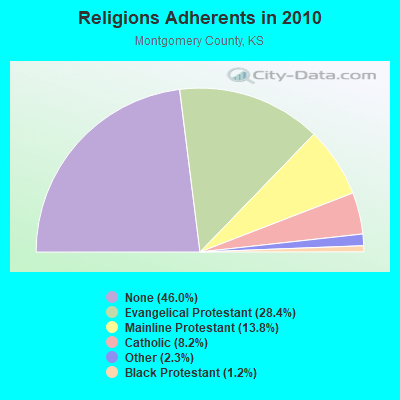
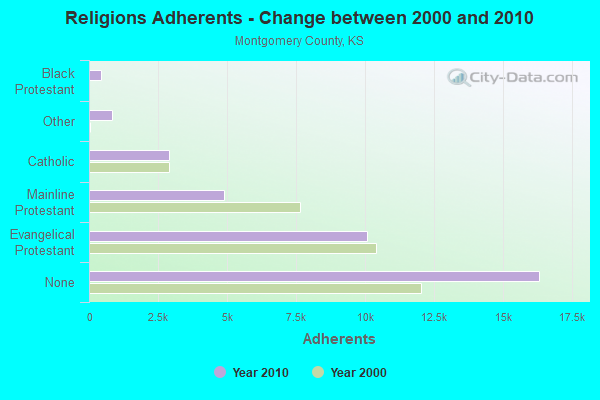
| Religion | Adherents | Congregations |
|---|---|---|
| Evangelical Protestant | 10,083 | 63 |
| Mainline Protestant | 4,904 | 23 |
| Catholic | 2,900 | 4 |
| Other | 826 | 3 |
| Black Protestant | 431 | 6 |
| None | 16,327 | - |
Food Environment Statistics:
| Montgomery County: | 1.74 / 10,000 pop. |
| Kansas: | 1.96 / 10,000 pop. |
| Montgomery County: | 0.29 / 10,000 pop. |
| State: | 0.20 / 10,000 pop. |
| Here: | 0.29 / 10,000 pop. |
| Kansas: | 0.51 / 10,000 pop. |
| Montgomery County: | 6.38 / 10,000 pop. |
| Kansas: | 3.84 / 10,000 pop. |
| This county: | 7.84 / 10,000 pop. |
| Kansas: | 7.33 / 10,000 pop. |
| This county: | 10.1% |
| Kansas: | 8.1% |
| Montgomery County: | 29.6% |
| Kansas: | 27.9% |
| Montgomery County: | 13.8% |
| Kansas: | 13.4% |
Health and Nutrition:
| Cherryvale: | 53.2% |
| State: | 49.2% |
| Cherryvale: | 51.6% |
| Kansas: | 46.3% |
| This city: | 28.3 |
| State: | 28.6 |
| Here: | 19.4% |
| State: | 21.2% |
| This city: | 9.2% |
| Kansas: | 10.5% |
| Cherryvale: | 7.0 |
| Kansas: | 6.8 |
| This city: | 32.4% |
| Kansas: | 33.5% |
| Here: | 60.3% |
| Kansas: | 56.0% |
| Here: | 78.7% |
| Kansas: | 78.6% |
More about Health and Nutrition of Cherryvale, KS Residents
| Local government employment and payroll (March 2022) | |||||
| Function | Full-time employees | Monthly full-time payroll | Average yearly full-time wage | Part-time employees | Monthly part-time payroll |
|---|---|---|---|---|---|
| Police Protection - Officers | 7 | $23,691 | $40,613 | 4 | $4,325 |
| Firefighters | 6 | $24,875 | $49,750 | 4 | $297 |
| Financial Administration | 3 | $12,232 | $48,928 | 1 | $837 |
| Streets and Highways | 1 | $3,707 | $44,484 | 0 | $0 |
| Water Supply | 1 | $3,147 | $37,764 | 0 | $0 |
| Parks and Recreation | 0 | $0 | 1 | $952 | |
| Other Government Administration | 0 | $0 | 5 | $1,050 | |
| Totals for Government | 18 | $67,651 | $45,101 | 15 | $7,461 |
Cherryvale government finances - Expenditure in 2017 (per resident):
- Current Operations - General - Other: $648,000 ($300.42)
Local Fire Protection: $510,000 ($236.44)
Water Utilities: $420,000 ($194.71)
Police Protection: $410,000 ($190.08)
Central Staff Services: $333,000 ($154.38)
Regular Highways: $147,000 ($68.15)
Solid Waste Management: $112,000 ($51.92)
Sewerage: $107,000 ($49.61)
Miscellaneous Commercial Activities - Other: $71,000 ($32.92)
Libraries: $52,000 ($24.11)
Parks and Recreation: $50,000 ($23.18)
Judicial and Legal Services: $14,000 ($6.49)
Housing and Community Development: $10,000 ($4.64)
- General - Interest on Debt: $137,000 ($63.51)
- Other Capital Outlay - General - Other: $180,000 ($83.45)
Health - Other: $36,000 ($16.69)
Police Protection: $17,000 ($7.88)
Parks and Recreation: $13,000 ($6.03)
Libraries: $12,000 ($5.56)
- Total Salaries and Wages: $1,331,000 ($617.06)
Cherryvale government finances - Revenue in 2017 (per resident):
- Charges - Sewerage: $255,000 ($118.22)
Other: $205,000 ($95.04)
Solid Waste Management: $126,000 ($58.41)
Miscellaneous Commercial Activities: $6,000 ($2.78)
Parks and Recreation: $4,000 ($1.85)
- Federal Intergovernmental - Other: $441,000 ($204.45)
- Local Intergovernmental - Highways: $10,000 ($4.64)
- Miscellaneous - General Revenue - Other: $161,000 ($74.64)
Fines and Forfeits: $27,000 ($12.52)
Rents: $10,000 ($4.64)
Interest Earnings: $7,000 ($3.25)
- Revenue - Water Utilities: $657,000 ($304.59)
- State Intergovernmental - Highways: $60,000 ($27.82)
Other: $17,000 ($7.88)
General Local Government Support: $1,000 ($0.46)
- Tax - General Sales and Gross Receipts: $672,000 ($311.54)
Property: $474,000 ($219.75)
Public Utilities Sales: $179,000 ($82.99)
Other License: $5,000 ($2.32)
Cherryvale government finances - Debt in 2017 (per resident):
- Long Term Debt - Retired Unspecified Public Purpose: $3,240,000 ($1502.09)
Beginning Outstanding - Unspecified Public Purpose: $3,190,000 ($1478.91)
Issue, Unspecified Public Purpose: $3,175,000 ($1471.95)
Outstanding Unspecified Public Purpose: $3,125,000 ($1448.77)
Cherryvale government finances - Cash and Securities in 2017 (per resident):
- Other Funds - Cash and Securities: $1,338,000 ($620.31)
| Businesses in Cherryvale, KS | ||||
| Name | Count | Name | Count | |
|---|---|---|---|---|
| H&R Block | 1 | SONIC Drive-In | 1 | |
| Pizza Hut | 1 | True Value | 1 | |
Strongest AM radio stations in Cherryvale:
- KGGF (690 AM; 10 kW; COFFEYVILLE, KS; Owner: KGGF-KUSN, INC.)
- KRMG (740 AM; 50 kW; TULSA, OK; Owner: CXR HOLDINGS, INC.)
- KFAQ (1170 AM; 50 kW; TULSA, OK; Owner: JOURNAL BROADCAST CORPORATION)
- KKOW (860 AM; 10 kW; PITTSBURG, KS; Owner: AMERICAN MEDIA INVESTMENTS)
- KTBZ (1430 AM; 25 kW; TULSA, OK; Owner: CLEAR CHANNEL BROADCASTING LICENSES, INC.)
- KMUS (1380 AM; 20 kW; MUSKOGEE, OK; Owner: ABC, INC.)
- WHB (810 AM; 50 kW; KANSAS CITY, MO; Owner: UNION BROADCASTING, INC.)
- KIND (1010 AM; 0 kW; INDEPENDENCE, KS; Owner: CENTRAL BROADCASTING, INC.)
- WMBH (1560 AM; 10 kW; JOPLIN, MO)
- KBTN (1420 AM; 10 kW; NEOSHO, MO; Owner: PETRACOM OF JOPLIN, L.L.C.)
- KOCR (1310 AM; 5 kW; JOPLIN, MO; Owner: OZARK CHRISTIAN COLLEGE)
- KOMA (1520 AM; 50 kW; OKLAHOMA CITY, OK; Owner: RENDA BROADCASTING CORP. OF NEVADA)
- KKHK (1250 AM; 25 kW; KANSAS CITY, KS)
Strongest FM radio stations in Cherryvale:
- KARF (91.9 FM; INDEPENDENCE, KS; Owner: AMERICAN FAMILY ASSOCIATION)
- KGGF-FM (104.1 FM; FREDONIA, KS; Owner: KGGF-KUSN, INC.)
- KUSN (98.1 FM; DEARING, KS; Owner: KGGF-KUSN, INC.)
- KKRK (98.9 FM; COFFEYVILLE, KS; Owner: KGGF-KUSN, INC.)
- KIND-FM (102.9 FM; INDEPENDENCE, KS; Owner: CENTRAL BROADCASTING, INC.)
- KRPS (89.9 FM; PITTSBURG, KS; Owner: PITTSBURG STATE UNIVERSITY)
- KKOW-FM (96.9 FM; PITTSBURG, KS; Owner: AMERICAN MEDIA INVESTMENTS, INC.)
- KLKC-FM (93.5 FM; PARSONS, KS; Owner: COMMUNITY BROADCASTING CO., INC.)
- KBQC (88.5 FM; INDEPENDENCE, KS; Owner: AMERICAN FAMILY ASSOCIATION)
TV broadcast stations around Cherryvale:
- K54GC (Channel 54; INDEPENDENCE, KS; Owner: TRINITY BROADCASTING NETWORK)
- KOAM-TV (Channel 7; PITTSBURG, KS; Owner: SAGA QUAD STATES COMMUNICATIONS, LLC)
Cherryvale fatal accident list:
May 13, 2016 11:34 AM, Us-160, Cr-5700, Lat: 37.193850, Lon: -95.539639, Vehicles: 2, Persons: 2, Fatalities: 1
Jun 25, 2016 05:08 PM, Us-169, Lat: 37.222825, Lon: -95.585928, Vehicles: 1, Persons: 2, Fatalities: 1
May 16, 2012 07:37 AM, Us-169, Cr 3500, Lat: 37.274228, Lon: -95.569331, Vehicles: 2, Persons: 3, Fatalities: 1
Dec 30, 1995 00:06 AM, 6th, Vehicles: 1, Persons: 1, Fatalities: 1, Drunk persons involved: 1
- National Bridge Inventory (NBI) Statistics
- 34Number of bridges
- 358ft / 109mTotal length
- $970,000Total costs
- 45,446Total average daily traffic
- 8,114Total average daily truck traffic
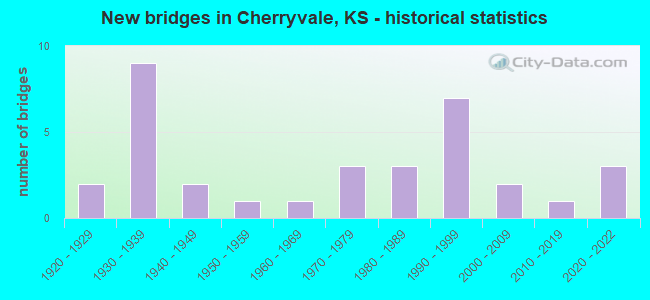
- New bridges - historical statistics
- 21920-1929
- 91930-1939
- 21940-1949
- 11950-1959
- 11960-1969
- 31970-1979
- 31980-1989
- 71990-1999
- 22000-2009
- 12010-2019
- 32020-2022
FCC Registered Cell Phone Towers:
1 (See the full list of FCC Registered Cell Phone Towers in Cherryvale)FCC Registered Antenna Towers:
40 (See the full list of FCC Registered Antenna Towers)FCC Registered Broadcast Land Mobile Towers:
4- CHERRYVALE, 1 Mi E 1 Mi S (Lat: 37.250833 Lon: -95.518611), Type: Gtower, Structure height: 89.9 m, Overall height: 90.8 m, Call Sign: KNNQ319,
Assigned Frequencies: 935.975 MHz, 936.000 MHz, 936.387 MHz, 936.400 MHz, 935.787 MHz, 935.950 MHz, 936.100 MHz, 936.250 MHz, 935.737 MHz, Grant Date: 06/07/2021, Expiration Date: 04/12/2031, Certifier: Richard Stegelman, Registrant: Evergy Kansas Central, Inc., 818 S. Kansas Avenue, Topeka, KS 66601, Phone: (785) 575-1050, Email:
- MONT 6 S VALVE, Mont 6 S Valve Station - N Of Cr4000 0.55mi On Cr5125 (Lat: 37.202056 Lon: -95.590111), Type: Upole, Structure height: 6.1 m, Call Sign: WPXH342,
Assigned Frequencies: 154.471 MHz, Grant Date: 01/15/2013, Expiration Date: 04/03/2023, Cancellation Date: 06/03/2023, Certifier: Sam Atherton, Registrant: Micro-Comm, Inc., 15895 S Pflumm Rd, Olathe, KS 66062, Phone: (913) 390-4500, Fax: (913) 390-4550, Email:
- Lat: 37.211361 Lon: -95.576528, Call Sign: WQQA646,
Assigned Frequencies: 451.362 MHz, 451.412 MHz, 456.412 MHz, Grant Date: 09/23/2022, Expiration Date: 10/06/2032, Certifier: Simon Buckner, Registrant: Prairie States Communications, 60 N Hwy 61, Imperial, NE 69033, Phone: (308) 882-4694, Email:
- Lat: 37.208944 Lon: -95.576278, Call Sign: WRVM472,
Assigned Frequencies: 451.187 MHz, 451.437 MHz, 456.337 MHz, 452.087 MHz, 452.887 MHz, Grant Date: 12/09/2022, Expiration Date: 12/09/2032, Certifier: Jason Logan, Registrant: Washington Radio Reports, Gettysburg, PA 17325, Phone: (717) 334-0668, Fax: (717) 334-6440, Email:
FCC Registered Microwave Towers:
8 (See the full list of FCC Registered Microwave Towers in this town)FCC Registered Amateur Radio Licenses:
19 (See the full list of FCC Registered Amateur Radio Licenses in Cherryvale)2002 - 2018 National Fire Incident Reporting System (NFIRS) incidents
- Fire incident types reported to NFIRS in Cherryvale, KS
- 55364.2%Outside Fires
- 19322.4%Structure Fires
- 9210.7%Mobile Property/Vehicle Fires
- 232.7%Other
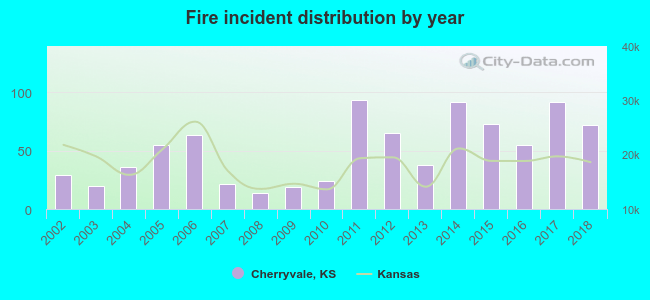 Based on the data from the years 2002 - 2018 the average number of fire incidents per year is 51. The highest number of reported fires - 93 took place in 2011, and the least - 14 in 2008. The data has a rising trend.
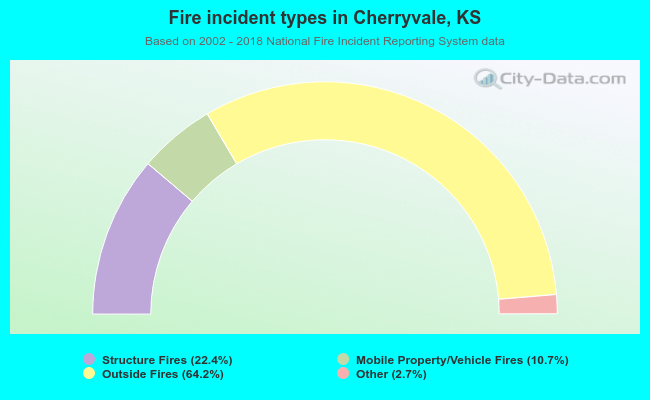 When looking into fire subcategories, the most incidents belonged to: Outside Fires (64.2%), and Structure Fires (22.4%).
| Most common first names in Cherryvale, KS among deceased individuals | ||
| Name | Count | Lived (average) |
|---|---|---|
| John | 47 | 76.9 years |
| Mary | 43 | 76.5 years |
| James | 38 | 74.8 years |
| Charles | 34 | 79.4 years |
| William | 33 | 80.9 years |
| Robert | 33 | 71.7 years |
| George | 18 | 76.6 years |
| Ruth | 16 | 81.3 years |
| Frank | 16 | 78.0 years |
| Earl | 15 | 81.5 years |
| Most common last names in Cherryvale, KS among deceased individuals | ||
| Last name | Count | Lived (average) |
|---|---|---|
| Smith | 18 | 78.7 years |
| Johnson | 17 | 78.8 years |
| Miller | 16 | 80.6 years |
| Jones | 16 | 78.1 years |
| Mitchell | 12 | 78.9 years |
| Peugh | 11 | 76.1 years |
| Myers | 11 | 69.9 years |
| Davis | 10 | 74.3 years |
| Williams | 9 | 74.1 years |
| Ellis | 9 | 82.9 years |
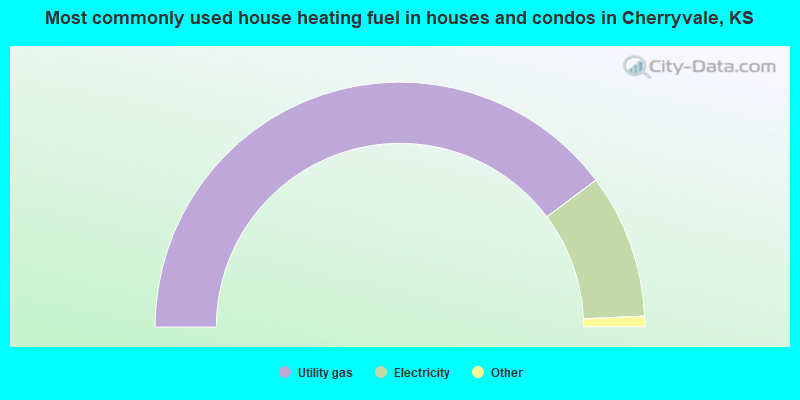
- 79.6%Utility gas
- 19.1%Electricity
- 0.7%Bottled, tank, or LP gas
- 0.5%Wood
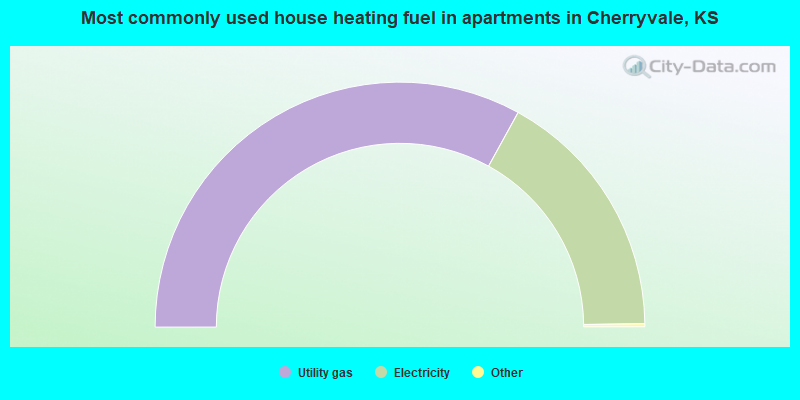
- 66.3%Utility gas
- 33.7%Electricity
Cherryvale compared to Kansas state average:
- Median household income below state average.
- Median house value significantly below state average.
- Black race population percentage significantly below state average.
- Hispanic race population percentage significantly below state average.
- Median age above state average.
- Foreign-born population percentage significantly below state average.
- Length of stay since moving in significantly above state average.
- House age above state average.
- Number of college students significantly below state average.
- Percentage of population with a bachelor's degree or higher below state average.

|
Total of 8 patent applications in 2008-2024.