Claremore, Oklahoma Submit your own pictures of this city and show them to the world
OSM Map
General Map
Google Map
MSN Map
OSM Map
General Map
Google Map
MSN Map
OSM Map
General Map
Google Map
MSN Map
OSM Map
General Map
Google Map
MSN Map
Please wait while loading the map...
Population in 2022: 20,174 (99% urban, 1% rural). Population change since 2000: +27.1%Males: 9,850 Females: 10,324
March 2022 cost of living index in Claremore: 86.5 (less than average, U.S. average is 100) Percentage of residents living in poverty in 2022: 12.7%for White Non-Hispanic residents , 17.2% for Black residents , 13.8% for Hispanic or Latino residents , 17.9% for American Indian residents , 21.5% for other race residents , 11.5% for two or more races residents )
Profiles of local businesses
Business Search - 14 Million verified businesses
Data:
Median household income ($)
Median household income (% change since 2000)
Household income diversity
Ratio of average income to average house value (%)
Ratio of average income to average rent
Median household income ($) - White
Median household income ($) - Black or African American
Median household income ($) - Asian
Median household income ($) - Hispanic or Latino
Median household income ($) - American Indian and Alaska Native
Median household income ($) - Multirace
Median household income ($) - Other Race
Median household income for houses/condos with a mortgage ($)
Median household income for apartments without a mortgage ($)
Races - White alone (%)
Races - White alone (% change since 2000)
Races - Black alone (%)
Races - Black alone (% change since 2000)
Races - American Indian alone (%)
Races - American Indian alone (% change since 2000)
Races - Asian alone (%)
Races - Asian alone (% change since 2000)
Races - Hispanic (%)
Races - Hispanic (% change since 2000)
Races - Native Hawaiian and Other Pacific Islander alone (%)
Races - Native Hawaiian and Other Pacific Islander alone (% change since 2000)
Races - Two or more races (%)
Races - Two or more races (% change since 2000)
Races - Other race alone (%)
Races - Other race alone (% change since 2000)
Racial diversity
Unemployment (%)
Unemployment (% change since 2000)
Unemployment (%) - White
Unemployment (%) - Black or African American
Unemployment (%) - Asian
Unemployment (%) - Hispanic or Latino
Unemployment (%) - American Indian and Alaska Native
Unemployment (%) - Multirace
Unemployment (%) - Other Race
Population density (people per square mile)
Population - Males (%)
Population - Females (%)
Population - Males (%) - White
Population - Males (%) - Black or African American
Population - Males (%) - Asian
Population - Males (%) - Hispanic or Latino
Population - Males (%) - American Indian and Alaska Native
Population - Males (%) - Multirace
Population - Males (%) - Other Race
Population - Females (%) - White
Population - Females (%) - Black or African American
Population - Females (%) - Asian
Population - Females (%) - Hispanic or Latino
Population - Females (%) - American Indian and Alaska Native
Population - Females (%) - Multirace
Population - Females (%) - Other Race
Coronavirus confirmed cases (Apr 26, 2024)
Deaths caused by coronavirus (Apr 26, 2024)
Coronavirus confirmed cases (per 100k population) (Apr 26, 2024)
Deaths caused by coronavirus (per 100k population) (Apr 26, 2024)
Daily increase in number of cases (Apr 26, 2024)
Weekly increase in number of cases (Apr 26, 2024)
Cases doubled (in days) (Apr 26, 2024)
Hospitalized patients (Apr 18, 2022)
Negative test results (Apr 18, 2022)
Total test results (Apr 18, 2022)
COVID Vaccine doses distributed (per 100k population) (Sep 19, 2023)
COVID Vaccine doses administered (per 100k population) (Sep 19, 2023)
COVID Vaccine doses distributed (Sep 19, 2023)
COVID Vaccine doses administered (Sep 19, 2023)
Likely homosexual households (%)
Likely homosexual households (% change since 2000)
Likely homosexual households - Lesbian couples (%)
Likely homosexual households - Lesbian couples (% change since 2000)
Likely homosexual households - Gay men (%)
Likely homosexual households - Gay men (% change since 2000)
Cost of living index
Median gross rent ($)
Median contract rent ($)
Median monthly housing costs ($)
Median house or condo value ($)
Median house or condo value ($ change since 2000)
Mean house or condo value by units in structure - 1, detached ($)
Mean house or condo value by units in structure - 1, attached ($)
Mean house or condo value by units in structure - 2 ($)
Mean house or condo value by units in structure by units in structure - 3 or 4 ($)
Mean house or condo value by units in structure - 5 or more ($)
Mean house or condo value by units in structure - Boat, RV, van, etc. ($)
Mean house or condo value by units in structure - Mobile home ($)
Median house or condo value ($) - White
Median house or condo value ($) - Black or African American
Median house or condo value ($) - Asian
Median house or condo value ($) - Hispanic or Latino
Median house or condo value ($) - American Indian and Alaska Native
Median house or condo value ($) - Multirace
Median house or condo value ($) - Other Race
Median resident age
Resident age diversity
Median resident age - Males
Median resident age - Females
Median resident age - White
Median resident age - Black or African American
Median resident age - Asian
Median resident age - Hispanic or Latino
Median resident age - American Indian and Alaska Native
Median resident age - Multirace
Median resident age - Other Race
Median resident age - Males - White
Median resident age - Males - Black or African American
Median resident age - Males - Asian
Median resident age - Males - Hispanic or Latino
Median resident age - Males - American Indian and Alaska Native
Median resident age - Males - Multirace
Median resident age - Males - Other Race
Median resident age - Females - White
Median resident age - Females - Black or African American
Median resident age - Females - Asian
Median resident age - Females - Hispanic or Latino
Median resident age - Females - American Indian and Alaska Native
Median resident age - Females - Multirace
Median resident age - Females - Other Race
Commute - mean travel time to work (minutes)
Travel time to work - Less than 5 minutes (%)
Travel time to work - Less than 5 minutes (% change since 2000)
Travel time to work - 5 to 9 minutes (%)
Travel time to work - 5 to 9 minutes (% change since 2000)
Travel time to work - 10 to 19 minutes (%)
Travel time to work - 10 to 19 minutes (% change since 2000)
Travel time to work - 20 to 29 minutes (%)
Travel time to work - 20 to 29 minutes (% change since 2000)
Travel time to work - 30 to 39 minutes (%)
Travel time to work - 30 to 39 minutes (% change since 2000)
Travel time to work - 40 to 59 minutes (%)
Travel time to work - 40 to 59 minutes (% change since 2000)
Travel time to work - 60 to 89 minutes (%)
Travel time to work - 60 to 89 minutes (% change since 2000)
Travel time to work - 90 or more minutes (%)
Travel time to work - 90 or more minutes (% change since 2000)
Marital status - Never married (%)
Marital status - Now married (%)
Marital status - Separated (%)
Marital status - Widowed (%)
Marital status - Divorced (%)
Median family income ($)
Median family income (% change since 2000)
Median non-family income ($)
Median non-family income (% change since 2000)
Median per capita income ($)
Median per capita income (% change since 2000)
Median family income ($) - White
Median family income ($) - Black or African American
Median family income ($) - Asian
Median family income ($) - Hispanic or Latino
Median family income ($) - American Indian and Alaska Native
Median family income ($) - Multirace
Median family income ($) - Other Race
Median year house/condo built
Median year apartment built
Year house built - Built 2005 or later (%)
Year house built - Built 2000 to 2004 (%)
Year house built - Built 1990 to 1999 (%)
Year house built - Built 1980 to 1989 (%)
Year house built - Built 1970 to 1979 (%)
Year house built - Built 1960 to 1969 (%)
Year house built - Built 1950 to 1959 (%)
Year house built - Built 1940 to 1949 (%)
Year house built - Built 1939 or earlier (%)
Average household size
Household density (households per square mile)
Average household size - White
Average household size - Black or African American
Average household size - Asian
Average household size - Hispanic or Latino
Average household size - American Indian and Alaska Native
Average household size - Multirace
Average household size - Other Race
Occupied housing units (%)
Vacant housing units (%)
Owner occupied housing units (%)
Renter occupied housing units (%)
Vacancy status - For rent (%)
Vacancy status - For sale only (%)
Vacancy status - Rented or sold, not occupied (%)
Vacancy status - For seasonal, recreational, or occasional use (%)
Vacancy status - For migrant workers (%)
Vacancy status - Other vacant (%)
Residents with income below the poverty level (%)
Residents with income below 50% of the poverty level (%)
Children below poverty level (%)
Poor families by family type - Married-couple family (%)
Poor families by family type - Male, no wife present (%)
Poor families by family type - Female, no husband present (%)
Poverty status for native-born residents (%)
Poverty status for foreign-born residents (%)
Poverty among high school graduates not in families (%)
Poverty among people who did not graduate high school not in families (%)
Residents with income below the poverty level (%) - White
Residents with income below the poverty level (%) - Black or African American
Residents with income below the poverty level (%) - Asian
Residents with income below the poverty level (%) - Hispanic or Latino
Residents with income below the poverty level (%) - American Indian and Alaska Native
Residents with income below the poverty level (%) - Multirace
Residents with income below the poverty level (%) - Other Race
Air pollution - Air Quality Index (AQI)
Air pollution - CO
Air pollution - NO2
Air pollution - SO2
Air pollution - Ozone
Air pollution - PM10
Air pollution - PM25
Air pollution - Pb
Crime - Murders per 100,000 population
Crime - Rapes per 100,000 population
Crime - Robberies per 100,000 population
Crime - Assaults per 100,000 population
Crime - Burglaries per 100,000 population
Crime - Thefts per 100,000 population
Crime - Auto thefts per 100,000 population
Crime - Arson per 100,000 population
Crime - City-data.com crime index
Crime - Violent crime index
Crime - Property crime index
Crime - Murders per 100,000 population (5 year average)
Crime - Rapes per 100,000 population (5 year average)
Crime - Robberies per 100,000 population (5 year average)
Crime - Assaults per 100,000 population (5 year average)
Crime - Burglaries per 100,000 population (5 year average)
Crime - Thefts per 100,000 population (5 year average)
Crime - Auto thefts per 100,000 population (5 year average)
Crime - Arson per 100,000 population (5 year average)
Crime - City-data.com crime index (5 year average)
Crime - Violent crime index (5 year average)
Crime - Property crime index (5 year average)
1996 Presidential Elections Results (%) - Democratic Party (Clinton)
1996 Presidential Elections Results (%) - Republican Party (Dole)
1996 Presidential Elections Results (%) - Other
2000 Presidential Elections Results (%) - Democratic Party (Gore)
2000 Presidential Elections Results (%) - Republican Party (Bush)
2000 Presidential Elections Results (%) - Other
2004 Presidential Elections Results (%) - Democratic Party (Kerry)
2004 Presidential Elections Results (%) - Republican Party (Bush)
2004 Presidential Elections Results (%) - Other
2008 Presidential Elections Results (%) - Democratic Party (Obama)
2008 Presidential Elections Results (%) - Republican Party (McCain)
2008 Presidential Elections Results (%) - Other
2012 Presidential Elections Results (%) - Democratic Party (Obama)
2012 Presidential Elections Results (%) - Republican Party (Romney)
2012 Presidential Elections Results (%) - Other
2016 Presidential Elections Results (%) - Democratic Party (Clinton)
2016 Presidential Elections Results (%) - Republican Party (Trump)
2016 Presidential Elections Results (%) - Other
2020 Presidential Elections Results (%) - Democratic Party (Biden)
2020 Presidential Elections Results (%) - Republican Party (Trump)
2020 Presidential Elections Results (%) - Other
Ancestries Reported - Arab (%)
Ancestries Reported - Czech (%)
Ancestries Reported - Danish (%)
Ancestries Reported - Dutch (%)
Ancestries Reported - English (%)
Ancestries Reported - French (%)
Ancestries Reported - French Canadian (%)
Ancestries Reported - German (%)
Ancestries Reported - Greek (%)
Ancestries Reported - Hungarian (%)
Ancestries Reported - Irish (%)
Ancestries Reported - Italian (%)
Ancestries Reported - Lithuanian (%)
Ancestries Reported - Norwegian (%)
Ancestries Reported - Polish (%)
Ancestries Reported - Portuguese (%)
Ancestries Reported - Russian (%)
Ancestries Reported - Scotch-Irish (%)
Ancestries Reported - Scottish (%)
Ancestries Reported - Slovak (%)
Ancestries Reported - Subsaharan African (%)
Ancestries Reported - Swedish (%)
Ancestries Reported - Swiss (%)
Ancestries Reported - Ukrainian (%)
Ancestries Reported - United States (%)
Ancestries Reported - Welsh (%)
Ancestries Reported - West Indian (%)
Ancestries Reported - Other (%)
Educational Attainment - No schooling completed (%)
Educational Attainment - Less than high school (%)
Educational Attainment - High school or equivalent (%)
Educational Attainment - Less than 1 year of college (%)
Educational Attainment - 1 or more years of college (%)
Educational Attainment - Associate degree (%)
Educational Attainment - Bachelor's degree (%)
Educational Attainment - Master's degree (%)
Educational Attainment - Professional school degree (%)
Educational Attainment - Doctorate degree (%)
School Enrollment - Nursery, preschool (%)
School Enrollment - Kindergarten (%)
School Enrollment - Grade 1 to 4 (%)
School Enrollment - Grade 5 to 8 (%)
School Enrollment - Grade 9 to 12 (%)
School Enrollment - College undergrad (%)
School Enrollment - Graduate or professional (%)
School Enrollment - Not enrolled in school (%)
School enrollment - Public schools (%)
School enrollment - Private schools (%)
School enrollment - Not enrolled (%)
Median number of rooms in houses and condos
Median number of rooms in apartments
Housing units lacking complete plumbing facilities (%)
Housing units lacking complete kitchen facilities (%)
Density of houses
Urban houses (%)
Rural houses (%)
Households with people 60 years and over (%)
Households with people 65 years and over (%)
Households with people 75 years and over (%)
Households with one or more nonrelatives (%)
Households with no nonrelatives (%)
Population in households (%)
Family households (%)
Nonfamily households (%)
Population in families (%)
Family households with own children (%)
Median number of bedrooms in owner occupied houses
Mean number of bedrooms in owner occupied houses
Median number of bedrooms in renter occupied houses
Mean number of bedrooms in renter occupied houses
Median number of vehichles in owner occupied houses
Mean number of vehichles in owner occupied houses
Median number of vehichles in renter occupied houses
Mean number of vehichles in renter occupied houses
Mortgage status - with mortgage (%)
Mortgage status - with second mortgage (%)
Mortgage status - with home equity loan (%)
Mortgage status - with both second mortgage and home equity loan (%)
Mortgage status - without a mortgage (%)
Average family size
Average family size - White
Average family size - Black or African American
Average family size - Asian
Average family size - Hispanic or Latino
Average family size - American Indian and Alaska Native
Average family size - Multirace
Average family size - Other Race
Geographical mobility - Same house 1 year ago (%)
Geographical mobility - Moved within same county (%)
Geographical mobility - Moved from different county within same state (%)
Geographical mobility - Moved from different state (%)
Geographical mobility - Moved from abroad (%)
Place of birth - Born in state of residence (%)
Place of birth - Born in other state (%)
Place of birth - Native, outside of US (%)
Place of birth - Foreign born (%)
Housing units in structures - 1, detached (%)
Housing units in structures - 1, attached (%)
Housing units in structures - 2 (%)
Housing units in structures - 3 or 4 (%)
Housing units in structures - 5 to 9 (%)
Housing units in structures - 10 to 19 (%)
Housing units in structures - 20 to 49 (%)
Housing units in structures - 50 or more (%)
Housing units in structures - Mobile home (%)
Housing units in structures - Boat, RV, van, etc. (%)
House/condo owner moved in on average (years ago)
Renter moved in on average (years ago)
Year householder moved into unit - Moved in 1999 to March 2000 (%)
Year householder moved into unit - Moved in 1995 to 1998 (%)
Year householder moved into unit - Moved in 1990 to 1994 (%)
Year householder moved into unit - Moved in 1980 to 1989 (%)
Year householder moved into unit - Moved in 1970 to 1979 (%)
Year householder moved into unit - Moved in 1969 or earlier (%)
Means of transportation to work - Drove car alone (%)
Means of transportation to work - Carpooled (%)
Means of transportation to work - Public transportation (%)
Means of transportation to work - Bus or trolley bus (%)
Means of transportation to work - Streetcar or trolley car (%)
Means of transportation to work - Subway or elevated (%)
Means of transportation to work - Railroad (%)
Means of transportation to work - Ferryboat (%)
Means of transportation to work - Taxicab (%)
Means of transportation to work - Motorcycle (%)
Means of transportation to work - Bicycle (%)
Means of transportation to work - Walked (%)
Means of transportation to work - Other means (%)
Working at home (%)
Industry diversity
Most Common Industries - Agriculture, forestry, fishing and hunting, and mining (%)
Most Common Industries - Agriculture, forestry, fishing and hunting (%)
Most Common Industries - Mining, quarrying, and oil and gas extraction (%)
Most Common Industries - Construction (%)
Most Common Industries - Manufacturing (%)
Most Common Industries - Wholesale trade (%)
Most Common Industries - Retail trade (%)
Most Common Industries - Transportation and warehousing, and utilities (%)
Most Common Industries - Transportation and warehousing (%)
Most Common Industries - Utilities (%)
Most Common Industries - Information (%)
Most Common Industries - Finance and insurance, and real estate and rental and leasing (%)
Most Common Industries - Finance and insurance (%)
Most Common Industries - Real estate and rental and leasing (%)
Most Common Industries - Professional, scientific, and management, and administrative and waste management services (%)
Most Common Industries - Professional, scientific, and technical services (%)
Most Common Industries - Management of companies and enterprises (%)
Most Common Industries - Administrative and support and waste management services (%)
Most Common Industries - Educational services, and health care and social assistance (%)
Most Common Industries - Educational services (%)
Most Common Industries - Health care and social assistance (%)
Most Common Industries - Arts, entertainment, and recreation, and accommodation and food services (%)
Most Common Industries - Arts, entertainment, and recreation (%)
Most Common Industries - Accommodation and food services (%)
Most Common Industries - Other services, except public administration (%)
Most Common Industries - Public administration (%)
Occupation diversity
Most Common Occupations - Management, business, science, and arts occupations (%)
Most Common Occupations - Management, business, and financial occupations (%)
Most Common Occupations - Management occupations (%)
Most Common Occupations - Business and financial operations occupations (%)
Most Common Occupations - Computer, engineering, and science occupations (%)
Most Common Occupations - Computer and mathematical occupations (%)
Most Common Occupations - Architecture and engineering occupations (%)
Most Common Occupations - Life, physical, and social science occupations (%)
Most Common Occupations - Education, legal, community service, arts, and media occupations (%)
Most Common Occupations - Community and social service occupations (%)
Most Common Occupations - Legal occupations (%)
Most Common Occupations - Education, training, and library occupations (%)
Most Common Occupations - Arts, design, entertainment, sports, and media occupations (%)
Most Common Occupations - Healthcare practitioners and technical occupations (%)
Most Common Occupations - Health diagnosing and treating practitioners and other technical occupations (%)
Most Common Occupations - Health technologists and technicians (%)
Most Common Occupations - Service occupations (%)
Most Common Occupations - Healthcare support occupations (%)
Most Common Occupations - Protective service occupations (%)
Most Common Occupations - Fire fighting and prevention, and other protective service workers including supervisors (%)
Most Common Occupations - Law enforcement workers including supervisors (%)
Most Common Occupations - Food preparation and serving related occupations (%)
Most Common Occupations - Building and grounds cleaning and maintenance occupations (%)
Most Common Occupations - Personal care and service occupations (%)
Most Common Occupations - Sales and office occupations (%)
Most Common Occupations - Sales and related occupations (%)
Most Common Occupations - Office and administrative support occupations (%)
Most Common Occupations - Natural resources, construction, and maintenance occupations (%)
Most Common Occupations - Farming, fishing, and forestry occupations (%)
Most Common Occupations - Construction and extraction occupations (%)
Most Common Occupations - Installation, maintenance, and repair occupations (%)
Most Common Occupations - Production, transportation, and material moving occupations (%)
Most Common Occupations - Production occupations (%)
Most Common Occupations - Transportation occupations (%)
Most Common Occupations - Material moving occupations (%)
People in Group quarters - Institutionalized population (%)
People in Group quarters - Correctional institutions (%)
People in Group quarters - Federal prisons and detention centers (%)
People in Group quarters - Halfway houses (%)
People in Group quarters - Local jails and other confinement facilities (including police lockups) (%)
People in Group quarters - Military disciplinary barracks (%)
People in Group quarters - State prisons (%)
People in Group quarters - Other types of correctional institutions (%)
People in Group quarters - Nursing homes (%)
People in Group quarters - Hospitals/wards, hospices, and schools for the handicapped (%)
People in Group quarters - Hospitals/wards and hospices for chronically ill (%)
People in Group quarters - Hospices or homes for chronically ill (%)
People in Group quarters - Military hospitals or wards for chronically ill (%)
People in Group quarters - Other hospitals or wards for chronically ill (%)
People in Group quarters - Hospitals or wards for drug/alcohol abuse (%)
People in Group quarters - Mental (Psychiatric) hospitals or wards (%)
People in Group quarters - Schools, hospitals, or wards for the mentally retarded (%)
People in Group quarters - Schools, hospitals, or wards for the physically handicapped (%)
People in Group quarters - Institutions for the deaf (%)
People in Group quarters - Institutions for the blind (%)
People in Group quarters - Orthopedic wards and institutions for the physically handicapped (%)
People in Group quarters - Wards in general hospitals for patients who have no usual home elsewhere (%)
People in Group quarters - Wards in military hospitals for patients who have no usual home elsewhere (%)
People in Group quarters - Juvenile institutions (%)
People in Group quarters - Long-term care (%)
People in Group quarters - Homes for abused, dependent, and neglected children (%)
People in Group quarters - Residential treatment centers for emotionally disturbed children (%)
People in Group quarters - Training schools for juvenile delinquents (%)
People in Group quarters - Short-term care, detention or diagnostic centers for delinquent children (%)
People in Group quarters - Type of juvenile institution unknown (%)
People in Group quarters - Noninstitutionalized population (%)
People in Group quarters - College dormitories (includes college quarters off campus) (%)
People in Group quarters - Military quarters (%)
People in Group quarters - On base (%)
People in Group quarters - Barracks, unaccompanied personnel housing (UPH), (Enlisted/Officer), ;and similar group living quarters for military personnel (%)
People in Group quarters - Transient quarters for temporary residents (%)
People in Group quarters - Military ships (%)
People in Group quarters - Group homes (%)
People in Group quarters - Homes or halfway houses for drug/alcohol abuse (%)
People in Group quarters - Homes for the mentally ill (%)
People in Group quarters - Homes for the mentally retarded (%)
People in Group quarters - Homes for the physically handicapped (%)
People in Group quarters - Other group homes (%)
People in Group quarters - Religious group quarters (%)
People in Group quarters - Dormitories (%)
People in Group quarters - Agriculture workers' dormitories on farms (%)
People in Group quarters - Job Corps and vocational training facilities (%)
People in Group quarters - Other workers' dormitories (%)
People in Group quarters - Crews of maritime vessels (%)
People in Group quarters - Other nonhousehold living situations (%)
People in Group quarters - Other noninstitutional group quarters (%)
Residents speaking English at home (%)
Residents speaking English at home - Born in the United States (%)
Residents speaking English at home - Native, born elsewhere (%)
Residents speaking English at home - Foreign born (%)
Residents speaking Spanish at home (%)
Residents speaking Spanish at home - Born in the United States (%)
Residents speaking Spanish at home - Native, born elsewhere (%)
Residents speaking Spanish at home - Foreign born (%)
Residents speaking other language at home (%)
Residents speaking other language at home - Born in the United States (%)
Residents speaking other language at home - Native, born elsewhere (%)
Residents speaking other language at home - Foreign born (%)
Class of Workers - Employee of private company (%)
Class of Workers - Self-employed in own incorporated business (%)
Class of Workers - Private not-for-profit wage and salary workers (%)
Class of Workers - Local government workers (%)
Class of Workers - State government workers (%)
Class of Workers - Federal government workers (%)
Class of Workers - Self-employed workers in own not incorporated business and Unpaid family workers (%)
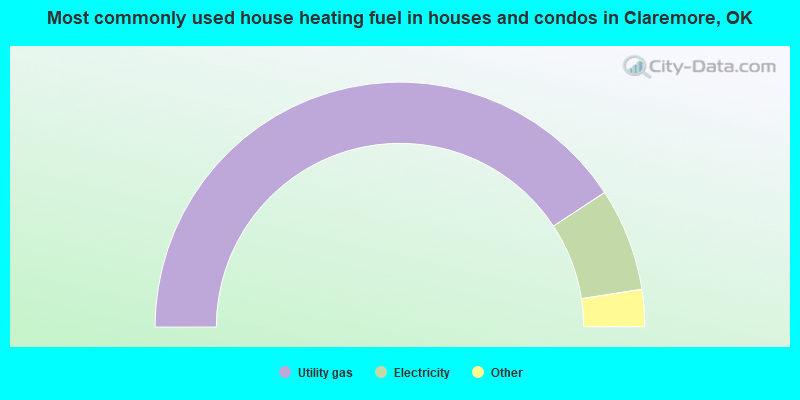
House heating fuel used in houses and condos - Utility gas (%)
House heating fuel used in houses and condos - Bottled, tank, or LP gas (%)
House heating fuel used in houses and condos - Electricity (%)
House heating fuel used in houses and condos - Fuel oil, kerosene, etc. (%)
House heating fuel used in houses and condos - Coal or coke (%)
House heating fuel used in houses and condos - Wood (%)
House heating fuel used in houses and condos - Solar energy (%)
House heating fuel used in houses and condos - Other fuel (%)
House heating fuel used in houses and condos - No fuel used (%)
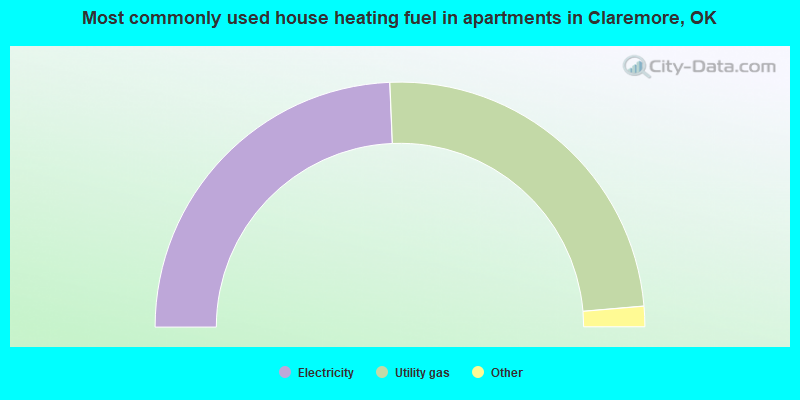
House heating fuel used in apartments - Utility gas (%)
House heating fuel used in apartments - Bottled, tank, or LP gas (%)
House heating fuel used in apartments - Electricity (%)
House heating fuel used in apartments - Fuel oil, kerosene, etc. (%)
House heating fuel used in apartments - Coal or coke (%)
House heating fuel used in apartments - Wood (%)
House heating fuel used in apartments - Solar energy (%)
House heating fuel used in apartments - Other fuel (%)
House heating fuel used in apartments - No fuel used (%)
Armed forces status - In Armed Forces (%)
Armed forces status - Civilian (%)
Armed forces status - Civilian - Veteran (%)
Armed forces status - Civilian - Nonveteran (%)
Fatal accidents locations in years 2005-2021
Fatal accidents locations in 2005
Fatal accidents locations in 2006
Fatal accidents locations in 2007
Fatal accidents locations in 2008
Fatal accidents locations in 2009
Fatal accidents locations in 2010
Fatal accidents locations in 2011
Fatal accidents locations in 2012
Fatal accidents locations in 2013
Fatal accidents locations in 2014
Fatal accidents locations in 2015
Fatal accidents locations in 2016
Fatal accidents locations in 2017
Fatal accidents locations in 2018
Fatal accidents locations in 2019
Fatal accidents locations in 2020
Fatal accidents locations in 2021
Alcohol use - People drinking some alcohol every month (%)
Alcohol use - People not drinking at all (%)
Alcohol use - Average days/month drinking alcohol
Alcohol use - Average drinks/week
Alcohol use - Average days/year people drink much
Audiometry - Average condition of hearing (%)
Audiometry - People that can hear a whisper from across a quiet room (%)
Audiometry - People that can hear normal voice from across a quiet room (%)
Audiometry - Ears ringing, roaring, buzzing (%)
Audiometry - Had a job exposure to loud noise (%)
Audiometry - Had off-work exposure to loud noise (%)
Blood Pressure & Cholesterol - Has high blood pressure (%)
Blood Pressure & Cholesterol - Checking blood pressure at home (%)
Blood Pressure & Cholesterol - Frequently checking blood cholesterol (%)
Blood Pressure & Cholesterol - Has high cholesterol level (%)
Consumer Behavior - Money monthly spent on food at supermarket/grocery store
Consumer Behavior - Money monthly spent on food at other stores
Consumer Behavior - Money monthly spent on eating out
Consumer Behavior - Money monthly spent on carryout/delivered foods
Consumer Behavior - Income spent on food at supermarket/grocery store (%)
Consumer Behavior - Income spent on food at other stores (%)
Consumer Behavior - Income spent on eating out (%)
Consumer Behavior - Income spent on carryout/delivered foods (%)
Current Health Status - General health condition (%)
Current Health Status - Blood donors (%)
Current Health Status - Has blood ever tested for HIV virus (%)
Current Health Status - Left-handed people (%)
Dermatology - People using sunscreen (%)
Diabetes - Diabetics (%)
Diabetes - Had a blood test for high blood sugar (%)
Diabetes - People taking insulin (%)
Diet Behavior & Nutrition - Diet health (%)
Diet Behavior & Nutrition - Milk product consumption (# of products/month)
Diet Behavior & Nutrition - Meals not home prepared (#/week)
Diet Behavior & Nutrition - Meals from fast food or pizza place (#/week)
Diet Behavior & Nutrition - Ready-to-eat foods (#/month)
Diet Behavior & Nutrition - Frozen meals/pizza (#/month)
Drug Use - People that ever used marijuana or hashish (%)
Drug Use - Ever used hard drugs (%)
Drug Use - Ever used any form of cocaine (%)
Drug Use - Ever used heroin (%)
Drug Use - Ever used methamphetamine (%)
Health Insurance - People covered by health insurance (%)
Kidney Conditions-Urology - Avg. # of times urinating at night
Medical Conditions - People with asthma (%)
Medical Conditions - People with anemia (%)
Medical Conditions - People with psoriasis (%)
Medical Conditions - People with overweight (%)
Medical Conditions - Elderly people having difficulties in thinking or remembering (%)
Medical Conditions - People who ever received blood transfusion (%)
Medical Conditions - People having trouble seeing even with glass/contacts (%)
Medical Conditions - People with arthritis (%)
Medical Conditions - People with gout (%)
Medical Conditions - People with congestive heart failure (%)
Medical Conditions - People with coronary heart disease (%)
Medical Conditions - People with angina pectoris (%)
Medical Conditions - People who ever had heart attack (%)
Medical Conditions - People who ever had stroke (%)
Medical Conditions - People with emphysema (%)
Medical Conditions - People with thyroid problem (%)
Medical Conditions - People with chronic bronchitis (%)
Medical Conditions - People with any liver condition (%)
Medical Conditions - People who ever had cancer or malignancy (%)
Mental Health - People who have little interest in doing things (%)
Mental Health - People feeling down, depressed, or hopeless (%)
Mental Health - People who have trouble sleeping or sleeping too much (%)
Mental Health - People feeling tired or having little energy (%)
Mental Health - People with poor appetite or overeating (%)
Mental Health - People feeling bad about themself (%)
Mental Health - People who have trouble concentrating on things (%)
Mental Health - People moving or speaking slowly or too fast (%)
Mental Health - People having thoughts they would be better off dead (%)
Oral Health - Average years since last visit a dentist
Oral Health - People embarrassed because of mouth (%)
Oral Health - People with gum disease (%)
Oral Health - General health of teeth and gums (%)
Oral Health - Average days a week using dental floss/device
Oral Health - Average days a week using mouthwash for dental problem
Oral Health - Average number of teeth
Pesticide Use - Households using pesticides to control insects (%)
Pesticide Use - Households using pesticides to kill weeds (%)
Physical Activity - People doing vigorous-intensity work activities (%)
Physical Activity - People doing moderate-intensity work activities (%)
Physical Activity - People walking or bicycling (%)
Physical Activity - People doing vigorous-intensity recreational activities (%)
Physical Activity - People doing moderate-intensity recreational activities (%)
Physical Activity - Average hours a day doing sedentary activities
Physical Activity - Average hours a day watching TV or videos
Physical Activity - Average hours a day using computer
Physical Functioning - People having limitations keeping them from working (%)
Physical Functioning - People limited in amount of work they can do (%)
Physical Functioning - People that need special equipment to walk (%)
Physical Functioning - People experiencing confusion/memory problems (%)
Physical Functioning - People requiring special healthcare equipment (%)
Prescription Medications - Average number of prescription medicines taking
Preventive Aspirin Use - Adults 40+ taking low-dose aspirin (%)
Reproductive Health - Vaginal deliveries (%)
Reproductive Health - Cesarean deliveries (%)
Reproductive Health - Deliveries resulted in a live birth (%)
Reproductive Health - Pregnancies resulted in a delivery (%)
Reproductive Health - Women breastfeeding newborns (%)
Reproductive Health - Women that had a hysterectomy (%)
Reproductive Health - Women that had both ovaries removed (%)
Reproductive Health - Women that have ever taken birth control pills (%)
Reproductive Health - Women taking birth control pills (%)
Reproductive Health - Women that have ever used Depo-Provera or injectables (%)
Reproductive Health - Women that have ever used female hormones (%)
Sexual Behavior - People 18+ that ever had sex (vaginal, anal, or oral) (%)
Sexual Behavior - Males 18+ that ever had vaginal sex with a woman (%)
Sexual Behavior - Males 18+ that ever performed oral sex on a woman (%)
Sexual Behavior - Males 18+ that ever had anal sex with a woman (%)
Sexual Behavior - Males 18+ that ever had any sex with a man (%)
Sexual Behavior - Females 18+ that ever had vaginal sex with a man (%)
Sexual Behavior - Females 18+ that ever performed oral sex on a man (%)
Sexual Behavior - Females 18+ that ever had anal sex with a man (%)
Sexual Behavior - Females 18+ that ever had any kind of sex with a woman (%)
Sexual Behavior - Average age people first had sex
Sexual Behavior - Average number of female sex partners in lifetime (males 18+)
Sexual Behavior - Average number of female vaginal sex partners in lifetime (males 18+)
Sexual Behavior - Average age people first performed oral sex on a woman (18+)
Sexual Behavior - Average number of woman performed oral sex on in lifetime (18+)
Sexual Behavior - Average number of male sex partners in lifetime (males 18+)
Sexual Behavior - Average number of male anal sex partners in lifetime (males 18+)
Sexual Behavior - Average age people first performed oral sex on a man (18+)
Sexual Behavior - Average number of male oral sex partners in lifetime (18+)
Sexual Behavior - People using protection when performing oral sex (%)
Sexual Behavior - Average number of times people have vaginal or anal sex a year
Sexual Behavior - People having sex without condom (%)
Sexual Behavior - Average number of male sex partners in lifetime (females 18+)
Sexual Behavior - Average number of male vaginal sex partners in lifetime (females 18+)
Sexual Behavior - Average number of female sex partners in lifetime (females 18+)
Sexual Behavior - Circumcised males 18+ (%)
Sleep Disorders - Average hours sleeping at night
Sleep Disorders - People that has trouble sleeping (%)
Smoking-Cigarette Use - People smoking cigarettes (%)
Taste & Smell - People 40+ having problems with smell (%)
Taste & Smell - People 40+ having problems with taste (%)
Taste & Smell - People 40+ that ever had wisdom teeth removed (%)
Taste & Smell - People 40+ that ever had tonsils teeth removed (%)
Taste & Smell - People 40+ that ever had a loss of consciousness because of a head injury (%)
Taste & Smell - People 40+ that ever had a broken nose or other serious injury to face or skull (%)
Taste & Smell - People 40+ that ever had two or more sinus infections (%)
Weight - Average height (inches)
Weight - Average weight (pounds)
Weight - Average BMI
Weight - People that are obese (%)
Weight - People that ever were obese (%)
Weight - People trying to lose weight (%)
Officers per 1,000 residents here:
2.06Oklahoma average:
2.27
Latest news from Claremore, OK collected exclusively by city-data.com from local newspapers, TV, and radio stations
Claremore, OK City Guides: Ancestries: German (12.2%), Irish (9.4%), English (7.2%), American (6.9%), Scottish (1.6%), Italian (1.4%).
Current Local Time:
Land area: 12.0 square miles.
Population density: 1,677 people per square mile (low).
676 residents are foreign born (1.4% Latin America , 0.9% Asia , 0.8% Europe ).
This city:
3.3%Oklahoma:
6.1%
Median real estate property taxes paid for housing units with mortgages in 2022: $1,367 (0.8%)Median real estate property taxes paid for housing units with no mortgage in 2022: $1,408 (0.7%)
Nearest city with pop. 50,000+: Broken Arrow, OK
Nearest city with pop. 200,000+: Tulsa, OK
Nearest city with pop. 1,000,000+: Dallas, TX
Nearest cities:
Taiwah, OK (2.3 miles),
Valley Park, OK (2.8 miles),
Latitude: 36.32 N, Longitude: 95.61 W
Daytime population change due to commuting: +1,996 (+9.8%)Workers who live and work in this city: 4,708 (49.1%)
Single-family new house construction building permits:
2022: 70 buildings , average cost: $174,4002021: 51 buildings , average cost: $170,5002020: 62 buildings , average cost: $87,8002019: 58 buildings , average cost: $237,0002018: 51 buildings , average cost: $234,4002017: 48 buildings , average cost: $229,8002016: 14 buildings , average cost: $227,1002015: 49 buildings , average cost: $223,4002014: 25 buildings , average cost: $162,4002013: 12 buildings , average cost: $148,800Unemployment in December 2023:
Population change in the 1990s: +2,037 (+14.7%).
Most common occupations in Claremore, OK (%)
Both Males Females
Other production occupations, including supervisors (4.8%)
Metal workers and plastic workers (4.6%)
Other management occupations, except farmers and farm managers (4.0%)
Other office and administrative support workers, including supervisors (3.6%)
Secretaries and administrative assistants (3.4%)
Material recording, scheduling, dispatching, and distributing workers (3.3%)
Vehicle and mobile equipment mechanics, installers, and repairers (3.3%)
Other production occupations, including supervisors (8.1%)
Metal workers and plastic workers (7.2%)
Vehicle and mobile equipment mechanics, installers, and repairers (6.3%)
Electrical equipment mechanics and other installation, maintenance, and repair workers, including supervisors (4.2%)
Other management occupations, except farmers and farm managers (3.8%)
Driver/sales workers and truck drivers (3.3%)
Other sales and related occupations, including supervisors (3.0%)
Secretaries and administrative assistants (6.9%)
Nursing, psychiatric, and home health aides (5.3%)
Other office and administrative support workers, including supervisors (5.2%)
Information and record clerks, except customer service representatives (4.3%)
Other management occupations, except farmers and farm managers (4.1%)
Material recording, scheduling, dispatching, and distributing workers (4.1%)
Preschool, kindergarten, elementary, and middle school teachers (3.7%)
Tornado activity:
Claremore-area historical tornado activity is near Oklahoma state average. It is 162% greater than the overall U.S. average.
On 4/24/1993, a category F4 (max. wind speeds 207-260 mph) tornado 11.0 miles away from the Claremore city center killed 7 people and injured 100 people and caused between $5,000,000 and $50,000,000 in damages.
On 4/26/1991, a category F4 tornado 11.1 miles away from the city center injured 22 people and caused between $5,000,000 and $50,000,000 in damages.
Earthquake activity:
Claremore-area historical earthquake activity is significantly above Oklahoma state average. It is 771% greater than the overall U.S. average. On 9/3/2016 at 12:02:44, a magnitude 5.8 (5.8 MW, Depth: 3.5 mi, Class: Moderate, Intensity: VI - VII) earthquake occurred 73.7 miles away from Claremore center On 11/6/2011 at 03:53:10, a magnitude 5.7 (5.7 MW, Depth: 3.2 mi) earthquake occurred 84.3 miles away from Claremore center On 11/7/2016 at 01:44:24, a magnitude 5.0 (5.0 MW, Depth: 2.8 mi) earthquake occurred 70.2 miles away from Claremore center On 11/5/2011 at 07:12:45, a magnitude 4.8 (4.8 MW, Depth: 1.9 mi, Class: Light, Intensity: IV - V) earthquake occurred 83.4 miles away from the city center On 11/8/2011 at 02:46:57, a magnitude 4.8 (4.8 MW, Depth: 3.1 mi) earthquake occurred 85.3 miles away from Claremore center On 11/12/2014 at 21:40:00, a magnitude 4.9 (4.9 MW, Depth: 2.5 mi) earthquake occurred 129.4 miles away from Claremore center Magnitude types: moment magnitude (MW) Natural disasters: The number of natural disasters in Rogers County (25) is a lot greater than the US average (15).Major Disasters (Presidential) Declared: 17Emergencies Declared: 5Floods: 11, Storms: 11, Winter Storms: 10, Tornadoes: 7, Winds: 2, Heavy Rain: 1, Hurricane: 1, Ice Storm: 1, Snowstorm: 1, Other: 1 (Note: some incidents may be assigned to more than one category). Hospitals and medical centers in Claremore: CLAREMORE INDIAN HOSPITAL (Government - Federal, 101 SOUTH MOORE AVE) HILLCREST HOSPITAL CLAREMORE (Proprietary, provides emergency services, 1202 N MUSKOGEE PLACE) HOPE HOSPICE, L L C (1402 NORTH FLORENCE AVENUE) NORTH PARK SURGERY CENTER (3000 MEDICAL PARK WAY) CLAREMORE NURSING HOME, INC (920 EAST 16TH STREET)
CLAREMORE REGIONAL MEDICAL CENTER SNF (1202 NORTH MUSKOGEE)
COLUMBIA CLAREMORE REGIONAL HOSPITAL (1202 N MUSKOGEE)
WOOD MANOR NURSING CENTER (2800 NORTH HICKORY STREET)
DAVITA - CLAREMORE (202 E BLUE STARR DR)
GREEN COUNTRY HOME HEALTH CARE (318 N MISSOURI)
Colleges/Universities in Claremore: Rogers State University Full-time enrollment: 3,482; Location: 1701 W Will Rogers Blvd; Public; Website: www.rsu.edu)
Northeast Technology Center-Claremore Full-time enrollment: 130; Location: 1901 N Hwy 88; Public; Website: www.netech.edu)
Claremore Beauty College Full-time enrollment: 25; Location: 200 N Cherokee; Private, for-profit; Website: claremorebeautycollege.com)
Other colleges/universities with over 2000 students near Claremore:
University of Tulsa (about 22 miles; Tulsa, OK ; Full-time enrollment: 3,702)
Tulsa Community College (about 22 miles; Tulsa, OK ; FT enrollment: 12,480)
Oral Roberts University (about 27 miles; Tulsa, OK ; FT enrollment: 3,216)
Northeastern State University (about 46 miles; Tahlequah, OK ; FT enrollment: 6,895)
Oklahoma State University Institute of Technology (about 51 miles; Okmulgee, OK ; FT enrollment: 3,243)
Northeastern Oklahoma A&M College (about 57 miles; Miami, OK ; FT enrollment: 2,075)
John Brown University (about 60 miles; Siloam Springs, AR ; FT enrollment: 2,097)
Public high schools in Claremore: CLAREMORE HS Students: 1,238, Location: 201 STUART ROOSA, Grades: 9-12)VERDIGRIS HS Students: 357, Location: 26505 S 4110 RD, Grades: 10-12)VERDIGRIS JHS Students: 343, Location: 26505 S 4110 RD, Grades: 7-9)SEQUOYAH HS Students: 305, Location: 16401 SOUTH 4180 ROAD, Grades: 9-12)Private high school in Claremore: CLAREMORE CHRISTIAN SCHOOL Students: 122, Location: 1055 W BLUE STARR DR, Grades: PK-12)
Biggest public elementary/middle schools in Claremore: CLAREMONT ES Students: 701, Location: 318 EAST SEVENTH STREET, Grades: PK-5)WESTSIDE ES Students: 699, Location: 2600 HOLLY ROAD, Grades: PK-5)WILL ROGERS JHS Students: 603, Location: 1915 NORTH FLORENCE, Grades: 6-8)JUSTUS-TIAWAH PUBLIC SCHOOL Students: 574, Location: 14902 EAST SCHOOL ROAD, Grades: PK-8)VERDIGRIS ES Students: 512, Location: 8207 E 540 RD, Grades: PK-3)SEQUOYAH ES Students: 437, Location: 16441 SOUTH 4180 ROAD, Grades: PK-5)ROOSA ES Students: 330, Location: 2001 NORTH SIOUX AVENUE, Grades: PK-5)SEQUOYAH MS Students: 329, Location: 16403 SOUTH 4180 ROAD, Grades: 6-8)CATALAYAH ES Location: 2700 KING RD, Grades: PK-5)
VERDIGRIS UPPER ES Location: 8204 E 540 RD, Grades: 4-6)
See full list of schools located in Claremore Library in Claremore: CLAREMORE - WILL ROGERS LIBRARY Operating income: $449,467; Location: 1515 NORTH FLORENCE AVE; 60,747 books ; 1,375 audio materials ; 2,887 video materials ; 6 local licensed databases ; 23 state licensed databases ; 66 print serial subscriptions )
User-submitted facts and corrections:
Claremore has added a new zip code. Along with the 74017 they also now have 74019
Notable locations in Claremore: (A) , Stanford Court (B) , Claremore Fire Department Station 3 (C) , Claremore Fire Department Station 2 (D) , Claremore Fire Department Station 1 Headquarters (E) , Pafford Emergency Medical Services (F) . Display/hide their locations on the map
Shopping Centers: (1) , Clermont Shopping Center (2) , Ne-Mar Shopping Center (3) , Plaza Shopping Center (4) , Powell Shopping Center (5) . Display/hide their locations on the map
Churches in Claremore include: (A) , Strait Gate Church (B) , Saint Pauls Episcopal Church (C) , Saint Cecilia Catholic Church (D) , New Life Church of God (E) , Memorial Heights Baptist Church (F) , Lutheran Church (G) , Grace Baptist Church (H) , First Presbyterian Church (I) . Display/hide their locations on the map
Cemetery: (1) . Display/hide its location on the map
Reservoirs: (A) , Happy Lake (B) . Display/hide their locations on the map
Tourist attractions: (1) , Will Rogers Memorial (Cultural Attractions- Events- & Facilities; 1720 West Will Rogers Boulevard) (2) , U S Government - National Park Service (Recreation Areas; Oologah Lake) (3) , Cowboyhat Cattle Co. (Arcades & Amusements; 17465 South Highway 88) (4) . Display/hide their approximate locations on the map
Hotels: (1) , Claremore Motor Inn (1709 North Lynn Riggs Boulevard) (2) , Microtel Inns & Suites (10600 Mallard Lake Road) (3) , The Elm's Motel (820 South Lynn Riggs Boulevard) (4) , Claremore-Days Inn (1720 S Highway 66) (5) , Adprosigns (600 North J M Davis Boulevard) (6) , Motel Claremore (812 East Will Rogers Boulevard) (7) , OKIE Inn (774 South Lynn Riggs Boulevard) (8) , Lazy D Motel (Old Highway 88 & 169 Int) (9) . Display/hide their approximate locations on the map
Court: (1) . Display/hide its approximate location on the map
Birthplace of: Dave Rader (baseball) - Baseball player, Richard Ray Whitman - Contemporary Yuchi-Muscogee Creek visual artist, Ruthe Blalock Jones - Contemporary Delaware-Shawnee-Peoria painter and printmaker, Levy Adcock - College football player, Eddie Chuculate - Contemporary Muscogee Creek writer and journalist, Helen Walton - Politician, Steve Gage - Football player.
Rogers County has a predicted average indoor radon screening level less than 2 pCi/L (pico curies per liter) - Low Potential Drinking water stations with addresses in Claremore and their reported violations in the past:
CLAREMORE (Address: 104 S. Muskogee Population served: 15,873, Surface water):
Past health violations:
MCL, Monthly (TCR) - In MAY-2014, Contaminant: Coliform. Follow-up actions: St Compliance achieved (MAY-31-2014), St Public Notif requested (JUL-10-2014), St Violation/Reminder Notice (JUL-10-2014)
MCL, Average - Between APR-2013 and JUN-2013, Contaminant: TTHM
MCL, Average - Between JAN-2013 and MAR-2013, Contaminant: TTHM
MCL, Average - Between OCT-2012 and DEC-2012, Contaminant: TTHM
MCL, Average - Between APR-2009 and JUN-2009, Contaminant: Total Haloacetic Acids (HAA5). Follow-up actions: St AO (w/penalty) issued (AUG-14-2009), St Public Notif requested (AUG-14-2009), St Public Notif received (JAN-11-2010), St Compliance achieved (JAN-27-2010)
MCL, Average - Between JAN-2008 and MAR-2008, Contaminant: TTHM. Follow-up actions: St Compliance achieved (APR-01-2008), St AO (w/penalty) issued (JUN-09-2008), St Public Notif requested (JUN-09-2008), St Public Notif received (2 times from AUG-01-2008 to AUG-01-2008), St Compliance achieved (JUN-02-2009)
5 other older health violations
Past monitoring violations:
Monitoring, Repeat Major (TCR) - In SEP-2012, Contaminant: Coliform (TCR). Follow-up actions: St Compliance achieved (SEP-30-2012), St Public Notif requested (OCT-25-2012), St Violation/Reminder Notice (OCT-25-2012)
Treatment Technique Precursor Removal - Between APR-2012 and JUN-2012, Contaminant: CARBON, TOTAL. Follow-up actions: St AO (w/penalty) issued (AUG-21-2012), St Public Notif requested (AUG-21-2012), St Public Notif received (OCT-10-2012), St Compliance achieved (OCT-12-2012)
Treatment Technique Precursor Removal - Between JAN-2012 and MAR-2012, Contaminant: CARBON, TOTAL. Follow-up actions: St AO (w/penalty) issued (MAY-22-2012), St Public Notif requested (MAY-22-2012), St Public Notif received (JUL-10-2012), St Compliance achieved (OCT-12-2012)
Monitoring, Routine (IDSE) - Between DEC-2008 and JAN-2009, Contaminant: Total Haloacetic Acids (HAA5). Follow-up actions: Fed Compliance achieved (APR-30-2009)
Monitoring, Routine (IDSE) - Between DEC-2008 and JAN-2009, Contaminant: TTHM. Follow-up actions: Fed Compliance achieved (APR-30-2009)
16 other older monitoring violations
Address: 23855 S. HWY 66 UNIT 1 Population served: 445, Purch surface water):
Past monitoring violations:
4 routine major monitoring violations
Address: 13505 S. HWY 88 Population served: 101, Purch surface water):
Past monitoring violations:
3 routine major monitoring violations
Average household size: This city:
2.4 peopleOklahoma:
2.5 people
Percentage of family households: This city:
63.1%Whole state:
66.8%
Percentage of households with unmarried partners: This city:
6.6%Whole state:
5.9%
Likely homosexual households (counted as self-reported same-sex unmarried-partner households)
Lesbian couples: 0.2% of all households Gay men: 0.2% of all households
People in group quarters in Claremore in 2010:
569 people in nursing facilities/skilled-nursing facilities
264 people in college/university student housing
191 people in local jails and other municipal confinement facilities
28 people in other noninstitutional facilities
12 people in hospitals with patients who have no usual home elsewhere
5 people in group homes for juveniles (non-correctional)
3 people in group homes intended for adults
People in group quarters in Claremore in 2000:
466 people in nursing homes
57 people in local jails and other confinement facilities (including police lockups)
48 people in college dormitories (includes college quarters off campus)
17 people in other group homes
7 people in unknown juvenile institutions
Banks with branches in Claremore (2011 data):
BancFirst: Nemar Branch, Blue Starr Branch, Verdigris Branch, Claremore Branch. Info updated 2012/02/24: Bank assets: $5,407.8 mil, Deposits: $4,893.4 mil, headquarters in Oklahoma City, OK, positive income , Commercial Lending Specialization, 101 total offices , Holding Company: Bancfirst Corporation
RCB Bank: Walmart - 1500 S. Lynn Riggs Blvd., Claremore Branch, South Branch, Rcb Bank. Info updated 2011/06/21: Bank assets: $1,997.6 mil, Deposits: $1,697.9 mil, local headquarters , positive income , Commercial Lending Specialization, 30 total offices , Holding Company: Rcb Holding Company, Inc.
Bank of Commerce: Sequoyah Office Branch at 16205 South Highway 66, branch established on 1997/10/01; Claremore Branch at 1124 West Will Rogers Boulevard, branch established on 2006/06/12. Info updated 2006/11/03: Bank assets: $145.1 mil, Deposits: $127.0 mil, headquarters in Chelsea, OK, positive income , Commercial Lending Specialization, 6 total offices , Holding Company: Commerce Bancshares, Inc.
International Bank of Commerce: Claremore Branch at 1050 N. Lynn Riggs Blvd, branch established on 1986/06/30. Info updated 2007/03/28: Bank assets: $9,621.9 mil, Deposits: $6,548.8 mil, headquarters in Laredo, TX, positive income , Commercial Lending Specialization, 197 total offices , Holding Company: International Bancshares Corporation
BOKF, National Association: Claremore Reasor's Branch at 1000 W. Will Rogers Blvd., branch established on 2008/06/20. Info updated 2012/02/28: Bank assets: $25,360.0 mil, Deposits: $19,171.3 mil, headquarters in Tulsa, OK, positive income , Commercial Lending Specialization, 189 total offices , Holding Company: Bok Financial Corporation
Grand Bank: 1700 South Lynn Riggs Branch at 1700 South Lynn Riggs, branch established on 1982/02/09. Info updated 2006/11/03: Bank assets: $201.7 mil, Deposits: $156.4 mil, headquarters in Tulsa, OK, positive income , Commercial Lending Specialization, 3 total offices , Holding Company: Grand Capital Corporation
For population 15 years and over in Claremore:
Never married: 27.3%Now married: 39.4%Separated: 4.0%Widowed: 11.1%Divorced: 18.2% For population 25 years and over in Claremore:
High school or higher: 91.2%Bachelor's degree or higher: 21.0%Graduate or professional degree: 6.9%Unemployed: 4.4%Mean travel time to work (commute): 20.5 minutes
Education Gini index (Inequality in education) Here:
9.5Oklahoma average:
11.3
Religion statistics for Claremore, OK (based on Rogers County data)
Religion Adherents Congregations Evangelical Protestant 28,301 95 Mainline Protestant 7,079 14 Catholic 2,000 1 Other 714 3 Black Protestant 374 3 None 48,437 -
Source: Clifford Grammich, Kirk Hadaway, Richard Houseal, Dale E.Jones, Alexei Krindatch, Richie Stanley and Richard H.Taylor. 2012. 2010 U.S.Religion Census: Religious Congregations & Membership Study. Association of Statisticians of American Religious Bodies. Jones, Dale E., et al. 2002. Congregations and Membership in the United States 2000. Nashville, TN: Glenmary Research Center. Graphs represent county-level data
Food Environment Statistics: Number of grocery stores : 7Rogers County :
0.84 / 10,000 pop.Oklahoma :
1.97 / 10,000 pop.
Number of supercenters and club stores : 1This county :
0.12 / 10,000 pop.Oklahoma :
0.20 / 10,000 pop.
Number of convenience stores (no gas) : 5This county :
0.60 / 10,000 pop.Oklahoma :
0.76 / 10,000 pop.
Number of convenience stores (with gas) : 24This county :
2.89 / 10,000 pop.Oklahoma :
4.35 / 10,000 pop.
Number of full-service restaurants : 39This county :
4.70 / 10,000 pop.Oklahoma :
6.89 / 10,000 pop.
Adult diabetes rate : Rogers County :
10.8%Oklahoma :
10.3%
Adult obesity rate : Rogers County :
32.3%Oklahoma :
29.2%
Health and Nutrition: Healthy diet rate : Claremore:
51.2%Oklahoma:
48.6%
Average overall health of teeth and gums : This city:
48.7%Oklahoma:
45.2%
Average BMI : Claremore:
28.6Oklahoma:
28.7
People feeling badly about themselves : This city:
20.2%Oklahoma:
21.4%
People not drinking alcohol at all : This city:
10.6%Oklahoma:
10.8%
Average hours sleeping at night : General health condition : Claremore:
57.4%State:
55.2%
Average condition of hearing : This city:
78.8%Oklahoma:
78.4%
More about Health and Nutrition of Claremore, OK Residents
Local government employment and payroll (March 2022)
Function
Full-time employees
Monthly full-time payroll
Average yearly full-time wage
Part-time employees
Monthly part-time payroll
Financial Administration
45 $190,761 $50,870 0 $0 Firefighters
39 $201,364 $61,958 0 $0 Police Protection - Officers
37 $187,563 $60,831 0 $0 Streets and Highways
24 $99,204 $49,602 0 $0 Police - Other
18 $41,504 $27,669 0 $0 Parks and Recreation
18 $64,929 $43,286 56 $37,636 Electric Power
17 $81,140 $57,275 0 $0 Solid Waste Management
14 $44,598 $38,227 0 $0 Local Libraries
6 $18,865 $37,730 2 $1,510 Fire - Other
5 $31,848 $76,435 0 $0 Other Government Administration
3 $12,263 $49,052 9 $996 Airports
1 $4,258 $51,096 2 $3,583 Sewerage
1 $4,495 $53,940 0 $0 Judicial and Legal
0 $0 1 $2,044
Totals for Government
228 $982,791 $51,726 70 $45,769
Claremore government finances - Expenditure in 2021 (per resident):
Construction - Air Transportation: $16,226,000 ($804.30)
Current Operations - Local Fire Protection: $7,444,000 ($368.99)
Police Protection: $5,100,000 ($252.80)Water Utilities: $3,603,000 ($178.60)Parks and Recreation: $2,431,000 ($120.50)Electric Utilities: $2,295,000 ($113.76)Regular Highways: $2,073,000 ($102.76)Solid Waste Management: $1,578,000 ($78.22)General - Other: $1,032,000 ($51.15)Financial Administration: $867,000 ($42.98)Housing and Community Development: $436,000 ($21.61)Libraries: $382,000 ($18.94)Public Welfare - Other: $349,000 ($17.30)Sewerage: $185,000 ($9.17)Miscellaneous Commercial Activities - Other: $134,000 ($6.64)Central Staff Services: $131,000 ($6.49)Judicial and Legal Services: $77,000 ($3.82)General - Interest on Debt: $281,000 ($13.93)
Other Capital Outlay - Air Transportation: $367,000 ($18.19)
Police Protection: $55,000 ($2.73)Libraries: $43,000 ($2.13)Local Fire Protection: $30,000 ($1.49)Parks and Recreation: $20,000 ($0.99)Public Welfare Institutions: $1,000 ($0.05)Total Salaries and Wages: $20,987,000 ($1040.30)
Water Utilities - Interest on Debt: $1,038,000 ($51.45)
Claremore government finances - Revenue in 2021 (per resident):
Charges - Solid Waste Management: $2,073,000 ($102.76)
Sewerage: $2,050,000 ($101.62)Air Transportation: $482,000 ($23.89)Other: $405,000 ($20.08)Parks and Recreation: $355,000 ($17.60)Parking Facilities: $90,000 ($4.46)Miscellaneous Commercial Activities: $51,000 ($2.53)Local Intergovernmental - Other: $300,000 ($14.87)
General Local Government Support: $210,000 ($10.41)Highways: $138,000 ($6.84)Miscellaneous - General Revenue - Other: $567,000 ($28.11)
Rents: $366,000 ($18.14)Interest Earnings: $289,000 ($14.33)Fines and Forfeits: $257,000 ($12.74)Donations From Private Sources: $24,000 ($1.19)Revenue - Electric Utilities: $30,079,000 ($1490.98)
Water Utilities: $4,514,000 ($223.75)State Intergovernmental - General Local Government Support: $126,000 ($6.25)
Highways: $33,000 ($1.64)Other: $21,000 ($1.04)Housing and Community Development: $10,000 ($0.50)Tax - General Sales and Gross Receipts: $15,355,000 ($761.13)
Public Utilities Sales: $379,000 ($18.79)Other Selective Sales: $225,000 ($11.15)Occupation and Business License - Other: $175,000 ($8.67)Other: $35,000 ($1.73)
Claremore government finances - Debt in 2021 (per resident):
Long Term Debt - Outstanding Unspecified Public Purpose: $57,260,000 ($2838.31)
Beginning Outstanding - Unspecified Public Purpose: $49,484,000 ($2452.86)Issue, Unspecified Public Purpose: $33,175,000 ($1644.44)Retired Unspecified Public Purpose: $25,400,000 ($1259.05)Short Term Debt Outstanding - End of Fiscal Year: $57,260,000 ($2838.31)
Beginning: $49,484,000 ($2452.86)
Claremore government finances - Cash and Securities in 2021 (per resident):
Sinking Funds - Cash and Securities: $19,185,000 ($950.98)
Businesses in Claremore, OK
Name Count Name Count
AT&T 2 MasterBrand Cabinets 1 Ace Hardware 1 Maurices 1 Advance Auto Parts 1 McDonald's 2 Arby's 1 Microtel 1 Ashley Furniture 1 New Balance 2 AutoZone 1 Nike 3 Bath & Body Works 1 Papa John's Pizza 1 Blockbuster 1 Payless 1 Burger King 1 Pizza Hut 1 Carl\s Jr. 1 RadioShack 1 Chevrolet 1 SAS Shoes 1 Comfort Inn 1 SONIC Drive-In 2 Cricket Wireless 2 Sears 1 Domino's Pizza 1 Subway 4 FedEx 3 Super 8 1 Ford 1 T-Mobile 3 GNC 1 Taco Bell 1 H&R Block 1 True Value 1 JCPenney 1 U-Haul 2 Jones New York 1 U.S. Cellular 2 KFC 1 UPS 5 Lane Furniture 2 Vans 2 Little Caesars Pizza 1 Walgreens 1 Long John Silver's 1 Walmart 1 Lowe's 1
Strongest AM radio stations in Claremore:
KRVT (1270 AM; 1 kW; CLAREMORE, OK; Owner: REUNION BROADCASTING, L.L.C.)
KFAQ (1170 AM; 50 kW; TULSA, OK; Owner: JOURNAL BROADCAST CORPORATION)
KTBZ (1430 AM; 25 kW; TULSA, OK; Owner: CLEAR CHANNEL BROADCASTING LICENSES, INC.)
KRMG (740 AM; 50 kW; TULSA, OK; Owner: CXR HOLDINGS, INC.)
KMUS (1380 AM; 20 kW; MUSKOGEE, OK; Owner: ABC, INC.)
KAKC (1300 AM; 5 kW; TULSA, OK; Owner: CLEAR CHANNEL BROADCASTING LICENSES, INC.)
KXTD (1530 AM; daytime; 5 kW; WAGONER, OK; Owner: GAYTAN-GALVAN LIMITED LIABILITY COMP)
KGGF (690 AM; 10 kW; COFFEYVILLE, KS; Owner: KGGF-KUSN, INC.)
KCFO (970 AM; 2 kW; TULSA, OK; Owner: FRIENDSHIP BROADCASTING, L. P.)
KMUR (1570 AM; 1 kW; PRYOR, OK)
KOMA (1520 AM; 50 kW; OKLAHOMA CITY, OK; Owner: RENDA BROADCASTING CORP. OF NEVADA)
KFAY (1030 AM; 10 kW; FARMINGTON, AR; Owner: CUMULUS LICENSING CORP)
KYAL (1550 AM; 2 kW; SAPULPA, OK; Owner: KXOJ, INC.)
Strongest FM radio stations in Claremore:
KRSC-FM (91.3 FM; CLAREMORE, OK; Owner: BOARD OF REGENTS OF OKLAHOMA COLLEGES)
KQLL-FM (106.1 FM; OWASSO, OK; Owner: CLEAR CHANNEL BROADCASTING LICENSES, INC.)
KTBT (101.5 FM; COLLINSVILLE, OK; Owner: CLEAR CHANNEL BROADCASTING LICENSES, INC.)
KNYD (90.5 FM; BROKEN ARROW, OK; Owner: CREATIVE EDUCATIONAL MEDIA CORP. INC)
KTFR (100.7 FM; CHELSEA, OK; Owner: MICHAEL P. STEPHENS)
KJSR (103.3 FM; TULSA, OK; Owner: CXR HOLDINGS, INC.)
KMYZ-FM (104.5 FM; PRYOR, OK; Owner: SHAMROCK COMMUNICATIONS, INC.)
KWGS (89.5 FM; TULSA, OK; Owner: THE UNIVERSITY OF TULSA)
KMOD-FM (97.5 FM; TULSA, OK; Owner: CLEAR CHANNEL BROADCASTING LICENSES, INC.)
KRAV-FM (96.5 FM; TULSA, OK; Owner: CXR HOLDINGS, INC.)
KWEN (95.5 FM; TULSA, OK; Owner: CXR HOLDINGS, INC.)
KBEZ (92.9 FM; TULSA, OK; Owner: RENDA BROADCASTING CORP. OF NEVADA)
KVOO-FM (98.5 FM; TULSA, OK; Owner: JOURNAL BROADCAST CORPORATION)
KJMM (105.3 FM; BIXBY, OK; Owner: KJMM, INC.)
KHTT (106.9 FM; MUSKOGEE, OK; Owner: RENDA BROADCASTING CORP. OF NEVADA)
KGND (107.5 FM; KETCHUM, OK; Owner: NORTHEAST OKLAHOMA BROADCAST NETWORK)
KIZS (92.1 FM; BROKEN ARROW, OK; Owner: CLEAR CHANNEL BROADCASTING LICENSES, INC.)
KXBL (99.5 FM; HENRYETTA, OK; Owner: JOURNAL BROADCAST CORPORATION)
KEMX (94.5 FM; LOCUST GROVE, OK; Owner: KXOJ, INC.)
KRTQ (102.3 FM; SAND SPRINGS, OK; Owner: CXR HOLDINGS, INC.)
TV broadcast stations around Claremore:
KRSC-TV (Channel 35; CLAREMORE, OK; Owner: BOARD OF REGENTS OF OKLAHOMA COLLEGES)
KJRH (Channel 2; TULSA, OK; Owner: SCRIPPS HOWARD BROADCASTING COMPANY)
KOED-TV (Channel 11; TULSA, OK; Owner: OKLAHOMA EDUCATIONAL TELEVISION AUTHORITY)
KOTV (Channel 6; TULSA, OK; Owner: GRIFFIN LICENSING, L.L.C.)
KTUL (Channel 8; TULSA, OK; Owner: KTUL, LLC)
KDOR (Channel 17; BARTLESVILLE, OK; Owner: TRINITY BROADCASTING NETWORK)
KTFO (Channel 41; TULSA, OK; Owner: CLEAR CHANNEL BROADCASTING LICENSES, INC.)
KOKI-TV (Channel 23; TULSA, OK; Owner: CLEAR CHANNEL BROADCASTING LICENSES, INC.)
KWHB (Channel 47; TULSA, OK; Owner: LESEA BROADCASTING CORPORATION)
K39CW (Channel 39; TULSA, OK; Owner: VENTANA TELEVISION, INC.)
KTZT-LP (Channel 29; TULSA, OK; Owner: ARACELIS ORTIZ, EXECUTRIX OF THE ESTATE OF CARLOS ORTIZ)
KOPE-LP (Channel 51; TULSA, OK; Owner: COPELAND BROADCASTING CORPORATION)
KGEB (Channel 53; TULSA, OK; Owner: UNIVERSITY BROADCASTING, INC.)
KLOT-LP (Channel 25; TULSA, OK; Owner: EQUITY BROADCASTING CORPORATION)
KTPX (Channel 44; OKMULGEE, OK; Owner: PAXSON TULSA LICENSE, INC.)
K69GO (Channel 69; TULSA, OK; Owner: THREE ANGELS BROADCASTING NETWORK)
National Bridge Inventory (NBI) Statistics 60 Number of bridges364ft / 111m Total length $41,683,000 Total costs365,989 Total average daily traffic85,953 Total average daily truck traffic
New bridges - historical statistics
1 1900-1909 5 1930-1939 2 1940-1949 20 1950-1959 2 1960-1969 4 1970-1979 3 1980-1989 4 1990-1999 8 2000-2009 10 2010-2019 1 2020-2022
See full National Bridge Inventory statistics for Claremore, OK
Home Mortgage Disclosure Act Aggregated Statistics For Year 2009(Based on 3 full and 6 partial tracts) A) FHA, FSA/RHS & VA B) Conventional C) Refinancings D) Home Improvement Loans E) Loans on Dwellings For 5+ Families F) Non-occupant Loans on G) Loans On Manufactured Number Average Value Number Average Value Number Average Value Number Average Value Number Average Value Number Average Value Number Average Value
LOANS ORIGINATED 113 $105,382 50 $98,128 197 $120,232 27 $31,304 1 $3,312,310 34 $82,691 2 $5,310 APPLICATIONS APPROVED, NOT ACCEPTED 2 $66,665 5 $119,710 19 $105,619 3 $43,543 0 $0 2 $58,085 1 $46,480 APPLICATIONS DENIED 7 $112,180 11 $112,169 68 $114,431 15 $16,369 0 $0 8 $68,792 1 $130,040 APPLICATIONS WITHDRAWN 11 $114,859 4 $112,628 53 $131,113 3 $86,473 0 $0 2 $120,225 0 $0 FILES CLOSED FOR INCOMPLETENESS 0 $0 0 $0 25 $108,642 0 $0 0 $0 0 $0 1 $111,000
Aggregated Statistics For Year 2008(Based on 3 full and 6 partial tracts) A) FHA, FSA/RHS & VA B) Conventional C) Refinancings D) Home Improvement Loans E) Loans on Dwellings For 5+ Families F) Non-occupant Loans on G) Loans On Manufactured Number Average Value Number Average Value Number Average Value Number Average Value Number Average Value Number Average Value Number Average Value
LOANS ORIGINATED 84 $110,949 86 $107,092 113 $119,799 31 $42,147 1 $716,660 43 $73,685 3 $51,820 APPLICATIONS APPROVED, NOT ACCEPTED 7 $97,797 6 $81,230 15 $114,021 7 $21,494 0 $0 1 $60,000 2 $85,860 APPLICATIONS DENIED 7 $117,953 28 $78,641 104 $103,465 30 $46,931 0 $0 7 $76,284 11 $55,037 APPLICATIONS WITHDRAWN 4 $98,248 5 $88,304 38 $106,455 4 $63,135 0 $0 2 $56,905 0 $0 FILES CLOSED FOR INCOMPLETENESS 3 $97,953 2 $53,705 4 $130,560 0 $0 0 $0 2 $43,500 1 $32,000
Aggregated Statistics For Year 2007(Based on 3 full and 6 partial tracts) A) FHA, FSA/RHS & VA B) Conventional C) Refinancings D) Home Improvement Loans E) Loans on Dwellings For 5+ Families F) Non-occupant Loans on G) Loans On Manufactured Number Average Value Number Average Value Number Average Value Number Average Value Number Average Value Number Average Value Number Average Value
LOANS ORIGINATED 50 $108,028 218 $91,678 130 $89,594 40 $35,634 3 $1,472,567 67 $72,327 5 $56,314 APPLICATIONS APPROVED, NOT ACCEPTED 2 $58,910 27 $88,207 31 $98,999 5 $39,860 0 $0 4 $50,085 5 $51,922 APPLICATIONS DENIED 9 $95,421 53 $79,088 148 $108,329 53 $55,475 0 $0 13 $76,018 14 $57,123 APPLICATIONS WITHDRAWN 4 $133,962 12 $95,877 67 $104,684 14 $79,903 0 $0 3 $97,170 0 $0 FILES CLOSED FOR INCOMPLETENESS 0 $0 4 $72,825 18 $108,702 1 $30,910 0 $0 2 $53,500 0 $0
Aggregated Statistics For Year 2006(Based on 3 full and 6 partial tracts) A) FHA, FSA/RHS & VA B) Conventional C) Refinancings D) Home Improvement Loans E) Loans on Dwellings For 5+ Families F) Non-occupant Loans on G) Loans On Manufactured Number Average Value Number Average Value Number Average Value Number Average Value Number Average Value Number Average Value Number Average Value
LOANS ORIGINATED 52 $101,560 278 $80,419 150 $89,931 44 $36,728 1 $1,842,840 61 $65,698 9 $36,537 APPLICATIONS APPROVED, NOT ACCEPTED 0 $0 37 $98,154 54 $105,669 10 $45,147 0 $0 4 $76,488 9 $75,877 APPLICATIONS DENIED 5 $58,722 78 $81,890 167 $97,539 39 $37,213 0 $0 8 $72,504 28 $60,643 APPLICATIONS WITHDRAWN 7 $104,346 37 $94,012 127 $97,520 8 $59,251 1 $628,760 8 $79,842 2 $44,055 FILES CLOSED FOR INCOMPLETENESS 1 $57,270 11 $95,607 19 $116,878 0 $0 0 $0 3 $101,733 0 $0
Aggregated Statistics For Year 2005(Based on 3 full and 6 partial tracts) A) FHA, FSA/RHS & VA B) Conventional C) Refinancings D) Home Improvement Loans F) Non-occupant Loans on G) Loans On Manufactured Number Average Value Number Average Value Number Average Value Number Average Value Number Average Value Number Average Value
LOANS ORIGINATED 51 $93,224 249 $78,918 207 $89,942 49 $34,302 78 $79,314 8 $47,745 APPLICATIONS APPROVED, NOT ACCEPTED 0 $0 39 $71,386 31 $101,103 7 $79,063 6 $76,100 11 $64,474 APPLICATIONS DENIED 9 $89,508 90 $67,653 230 $93,212 43 $45,715 25 $85,336 37 $42,350 APPLICATIONS WITHDRAWN 3 $73,373 40 $90,697 193 $95,144 17 $169,194 14 $81,013 0 $0 FILES CLOSED FOR INCOMPLETENESS 1 $65,100 8 $80,226 22 $108,050 2 $52,640 4 $88,105 0 $0
Aggregated Statistics For Year 2004(Based on 3 full and 6 partial tracts) A) FHA, FSA/RHS & VA B) Conventional C) Refinancings D) Home Improvement Loans F) Non-occupant Loans on G) Loans On Manufactured Number Average Value Number Average Value Number Average Value Number Average Value Number Average Value Number Average Value
LOANS ORIGINATED 39 $85,569 185 $86,614 231 $88,389 49 $36,057 56 $71,844 12 $40,078 APPLICATIONS APPROVED, NOT ACCEPTED 2 $119,815 37 $70,995 51 $93,939 4 $38,200 4 $87,075 21 $54,479 APPLICATIONS DENIED 6 $66,772 79 $68,372 224 $83,660 42 $25,779 12 $79,925 42 $46,285 APPLICATIONS WITHDRAWN 2 $111,440 24 $92,100 123 $87,783 7 $64,519 1 $84,010 3 $33,667 FILES CLOSED FOR INCOMPLETENESS 1 $81,610 9 $79,610 30 $93,654 1 $15,000 1 $66,120 0 $0
Aggregated Statistics For Year 2003(Based on 3 full and 6 partial tracts) A) FHA, FSA/RHS & VA B) Conventional C) Refinancings D) Home Improvement Loans E) Loans on Dwellings For 5+ Families F) Non-occupant Loans on Number Average Value Number Average Value Number Average Value Number Average Value Number Average Value Number Average Value
LOANS ORIGINATED 61 $91,010 220 $83,499 498 $92,115 55 $24,031 1 $758,000 70 $57,003 APPLICATIONS APPROVED, NOT ACCEPTED 5 $34,582 32 $61,040 66 $82,319 5 $12,648 0 $0 6 $63,722 APPLICATIONS DENIED 9 $77,721 64 $67,500 249 $85,770 24 $22,407 0 $0 7 $63,113 APPLICATIONS WITHDRAWN 4 $116,250 28 $100,536 125 $99,562 1 $36,130 0 $0 5 $67,138 FILES CLOSED FOR INCOMPLETENESS 1 $164,110 4 $114,142 17 $89,685 1 $17,150 0 $0 1 $63,000
Aggregated Statistics For Year 2002(Based on 1 partial tract) A) FHA, FSA/RHS & VA B) Conventional C) Refinancings D) Home Improvement Loans F) Non-occupant Loans on Number Average Value Number Average Value Number Average Value Number Average Value Number Average Value
LOANS ORIGINATED 21 $85,693 54 $83,938 88 $79,126 11 $13,400 12 $80,428 APPLICATIONS APPROVED, NOT ACCEPTED 0 $0 16 $47,379 14 $63,549 3 $14,330 1 $20,180 APPLICATIONS DENIED 4 $87,520 35 $70,493 54 $76,123 9 $14,136 6 $51,620 APPLICATIONS WITHDRAWN 2 $89,055 8 $77,321 34 $87,301 2 $27,200 1 $126,350 FILES CLOSED FOR INCOMPLETENESS 0 $0 2 $64,490 7 $77,963 0 $0 2 $110,115
Aggregated Statistics For Year 2001(Based on 1 partial tract) A) FHA, FSA/RHS & VA B) Conventional C) Refinancings D) Home Improvement Loans F) Non-occupant Loans on Number Average Value Number Average Value Number Average Value Number Average Value Number Average Value
LOANS ORIGINATED 25 $85,248 39 $79,078 86 $83,057 13 $20,518 7 $72,950 APPLICATIONS APPROVED, NOT ACCEPTED 0 $0 8 $75,346 11 $54,319 0 $0 0 $0 APPLICATIONS DENIED 2 $57,470 29 $40,330 80 $66,397 21 $20,389 4 $26,322 APPLICATIONS WITHDRAWN 0 $0 4 $69,095 55 $72,521 4 $14,698 4 $45,185 FILES CLOSED FOR INCOMPLETENESS 2 $61,855 2 $59,665 4 $79,185 0 $0 0 $0
Aggregated Statistics For Year 2000(Based on 1 partial tract) A) FHA, FSA/RHS & VA B) Conventional C) Refinancings D) Home Improvement Loans E) Loans on Dwellings For 5+ Families F) Non-occupant Loans on Number Average Value Number Average Value Number Average Value Number Average Value Number Average Value Number Average Value
LOANS ORIGINATED 33 $85,958 54 $78,072 46 $66,892 25 $19,127 1 $4,167,650 7 $71,320 APPLICATIONS APPROVED, NOT ACCEPTED 4 $59,225 18 $50,889 16 $54,892 5 $18,426 0 $0 0 $0 APPLICATIONS DENIED 4 $55,935 40 $40,558 18 $59,468 18 $20,911 0 $0 3 $57,323 APPLICATIONS WITHDRAWN 4 $68,438 11 $47,699 22 $63,292 1 $8,770 1 $166,710 2 $28,955 FILES CLOSED FOR INCOMPLETENESS 0 $0 4 $47,380 8 $69,972 0 $0 0 $0 0 $0
Aggregated Statistics For Year 1999(Based on 5 partial tracts) A) FHA, FSA/RHS & VA B) Conventional C) Refinancings D) Home Improvement Loans F) Non-occupant Loans on Number Average Value Number Average Value Number Average Value Number Average Value Number Average Value
LOANS ORIGINATED 86 $80,211 211 $69,540 189 $81,777 64 $17,124 29 $47,375 APPLICATIONS APPROVED, NOT ACCEPTED 1 $71,700 50 $51,365 53 $67,483 18 $18,302 3 $36,563 APPLICATIONS DENIED 12 $64,440 207 $40,363 83 $63,194 33 $18,061 9 $39,301 APPLICATIONS WITHDRAWN 8 $72,365 17 $75,487 50 $67,886 11 $38,295 0 $0 FILES CLOSED FOR INCOMPLETENESS 1 $99,080 12 $86,018 20 $79,848 0 $0 3 $48,093
Detailed HMDA statistics for the following Tracts:
0501.01
, 0501.03 , 0501.04 , 0501.05 , 0502.01 , 0502.02 , 0502.03 , 0504.03
Private Mortgage Insurance Companies Aggregated Statistics For Year 2009(Based on 3 full and 6 partial tracts) A) Conventional B) Refinancings Number Average Value Number Average Value
LOANS ORIGINATED 9 $124,553 8 $135,768 APPLICATIONS APPROVED, NOT ACCEPTED 3 $90,123 4 $132,492 APPLICATIONS DENIED 0 $0 1 $207,500 APPLICATIONS WITHDRAWN 2 $97,445 4 $165,532 FILES CLOSED FOR INCOMPLETENESS 0 $0 2 $82,230
Aggregated Statistics For Year 2008(Based on 3 full and 6 partial tracts) A) Conventional B) Refinancings C) Non-occupant Loans on Number Average Value Number Average Value Number Average Value
LOANS ORIGINATED 37 $125,752 15 $166,349 3 $70,680 APPLICATIONS APPROVED, NOT ACCEPTED 7 $94,990 6 $111,812 0 $0 APPLICATIONS DENIED 2 $150,550 1 $179,230 0 $0 APPLICATIONS WITHDRAWN 1 $159,140 1 $131,310 0 $0 FILES CLOSED FOR INCOMPLETENESS 1 $88,000 0 $0 0 $0
Aggregated Statistics For Year 2007(Based on 3 full and 6 partial tracts) A) Conventional B) Refinancings C) Non-occupant Loans on D) Loans On Manufactured Number Average Value Number Average Value Number Average Value Number Average Value
LOANS ORIGINATED 71 $116,488 16 $126,224 5 $82,306 1 $126,350 APPLICATIONS APPROVED, NOT ACCEPTED 6 $130,725 2 $89,200 0 $0 1 $126,350 APPLICATIONS DENIED 1 $83,730 0 $0 0 $0 0 $0 APPLICATIONS WITHDRAWN 2 $114,845 1 $108,410 1 $63,000 0 $0 FILES CLOSED FOR INCOMPLETENESS 0 $0 0 $0 0 $0 0 $0
Aggregated Statistics For Year 2006(Based on 3 full and 6 partial tracts) A) Conventional B) Refinancings C) Non-occupant Loans on Number Average Value Number Average Value Number Average Value
LOANS ORIGINATED 62 $98,915 12 $112,223 8 $69,774 APPLICATIONS APPROVED, NOT ACCEPTED 11 $115,245 2 $168,345 1 $68,000 APPLICATIONS DENIED 0 $0 1 $439,630 0 $0 APPLICATIONS WITHDRAWN 1 $59,380 4 $84,770 1 $59,000 FILES CLOSED FOR INCOMPLETENESS 0 $0 0 $0 0 $0
Aggregated Statistics For Year 2005(Based on 3 full and 6 partial tracts) A) Conventional B) Refinancings C) Non-occupant Loans on D) Loans On Manufactured Number Average Value Number Average Value Number Average Value Number Average Value
LOANS ORIGINATED 56 $97,139 19 $126,352 11 $84,276 0 $0 APPLICATIONS APPROVED, NOT ACCEPTED 9 $87,526 5 $164,158 2 $63,610 0 $0 APPLICATIONS DENIED 0 $0 1 $80,720 0 $0 1 $80,720 APPLICATIONS WITHDRAWN 4 $97,155 2 $75,595 1 $70,190 0 $0 FILES CLOSED FOR INCOMPLETENESS 0 $0 2 $81,105 0 $0 1 $77,210
Aggregated Statistics For Year 2004(Based on 3 full and 6 partial tracts) A) Conventional B) Refinancings C) Non-occupant Loans on Number Average Value Number Average Value Number Average Value
LOANS ORIGINATED 40 $87,934 25 $115,865 5 $76,720 APPLICATIONS APPROVED, NOT ACCEPTED 5 $111,844 11 $101,265 2 $67,440 APPLICATIONS DENIED 0 $0 0 $0 0 $0 APPLICATIONS WITHDRAWN 4 $89,488 3 $120,833 0 $0 FILES CLOSED FOR INCOMPLETENESS 1 $3,050 0 $0 0 $0
Aggregated Statistics For Year 2003(Based on 3 full and 6 partial tracts) A) Conventional B) Refinancings C) Non-occupant Loans on Number Average Value Number Average Value Number Average Value
LOANS ORIGINATED 59 $94,294 62 $108,090 10 $44,747 APPLICATIONS APPROVED, NOT ACCEPTED 10 $102,556 16 $132,491 1 $122,840 APPLICATIONS DENIED 1 $97,390 0 $0 1 $97,390 APPLICATIONS WITHDRAWN 1 $304,520 4 $104,658 0 $0 FILES CLOSED FOR INCOMPLETENESS 0 $0 1 $122,840 0 $0
Aggregated Statistics For Year 2002(Based on 1 partial tract) A) Conventional B) Refinancings C) Non-occupant Loans on Number Average Value Number Average Value Number Average Value
LOANS ORIGINATED 12 $102,363 18 $102,412 2 $57,470 APPLICATIONS APPROVED, NOT ACCEPTED 3 $107,043 7 $112,433 0 $0 APPLICATIONS DENIED 1 $99,150 1 $61,420 1 $61,420 APPLICATIONS WITHDRAWN 0 $0 1 $41,240 0 $0 FILES CLOSED FOR INCOMPLETENESS 0 $0 1 $63,170 0 $0
Aggregated Statistics For Year 2001(Based on 1 partial tract) A) Conventional B) Refinancings Number Average Value Number Average Value
LOANS ORIGINATED 19 $111,568 11 $98,189 APPLICATIONS APPROVED, NOT ACCEPTED 4 $102,438 5 $97,392 APPLICATIONS DENIED 0 $0 0 $0 APPLICATIONS WITHDRAWN 0 $0 0 $0 FILES CLOSED FOR INCOMPLETENESS 0 $0 0 $0
Aggregated Statistics For Year 2000(Based on 1 partial tract) A) Conventional B) Refinancings C) Non-occupant Loans on Number Average Value Number Average Value Number Average Value
LOANS ORIGINATED 18 $103,436 4 $82,038 1 $37,730 APPLICATIONS APPROVED, NOT ACCEPTED 1 $50,010 2 $111,870 0 $0 APPLICATIONS DENIED 0 $0 0 $0 0 $0 APPLICATIONS WITHDRAWN 0 $0 0 $0 0 $0 FILES CLOSED FOR INCOMPLETENESS 0 $0 0 $0 0 $0
Aggregated Statistics For Year 1999(Based on 5 partial tracts) A) Conventional B) Refinancings C) Non-occupant Loans on Number Average Value Number Average Value Number Average Value
LOANS ORIGINATED 68 $99,368 18 $102,067 1 $41,100 APPLICATIONS APPROVED, NOT ACCEPTED 5 $118,858 4 $78,975 0 $0 APPLICATIONS DENIED 3 $100,290 0 $0 1 $69,270 APPLICATIONS WITHDRAWN 1 $138,360 1 $94,640 0 $0 FILES CLOSED FOR INCOMPLETENESS 1 $190,840 0 $0 0 $0
Detailed PMIC statistics for the following Tracts:
0501.01
, 0501.03 , 0501.04 , 0501.05 , 0502.01 , 0502.02 , 0502.03 , 0504.03 Fire-safe hotels and motels in Claremore, Oklahoma:
Comfort Inn Claremore, 1720 S Lynn Riggs Blvd, Claremore, Oklahoma 74019 Phone: (918) 343-3297, Fax: (918) 341-1971
Microtel Inn & Suites Claremore, 10600 E Mallard Lake Rd, Claremore, Oklahoma 74017 Phone: (918) 343-2868, Fax: (918) 343-2869
La Quinta Inn & Suites Claremore, 774 S Lynn Riggs Blvd, Claremore, Oklahoma 74017 Phone: (800) 753-3757, Fax: (918) 965-1858
Hampton Inn and Suites Claremore, 1811 S Scissortail Ave, Claremore, Oklahoma 74017 Phone: (918) 965-1360
Holiday Inn Express & Suites Tulsa NE Claremore ok, 1400 W Country Club Rd, Claremore, Oklahoma 74017 Phone: (918) 283-4877, Fax: (918) 283-4878
All 5 fire-safe hotels and motels in Claremore, Oklahoma
Most common first names in Claremore, OK among deceased individuals Name Count Lived (average)
William 183 76.4 years John 177 75.3 years James 167 76.0 years Mary 150 79.7 years Charles 107 73.0 years Robert 103 74.2 years George 84 76.1 years Thomas 65 75.3 years Dorothy 61 76.6 years Ruth 57 79.8 years
Most common last names in Claremore, OK among deceased individuals Last name Count Lived (average)
Smith 105 76.2 years Wilson 66 74.2 years Jones 66 71.1 years Brown 60 76.2 years Johnson 55 73.1 years Miller 52 74.5 years Williams 50 73.3 years Davis 46 75.9 years Ward 38 76.2 years Lewis 38 74.7 years
Claremore compared to Oklahoma state average:
Unemployed percentage significantly below state average. Black race population percentage below state average. Length of stay since moving in significantly above state average. Institutionalized population percentage above state average.
Top Patent Applicants
John M. Knapp (18)
Dick L. Knox (11)
Earl B. Brookbank (10)
Risa Rutter (8)
Dan A. Merrill (8)
Jim F. Evenson (8)
John M. Leuthen (7)
Michael R. Rumbaugh (7)
Brett D. Leamy (6)
John L. Bearden (6)
Total of 206 patent applications in 2008-2024.
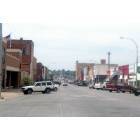
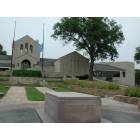
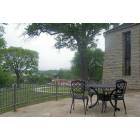
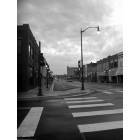
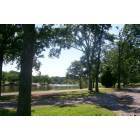
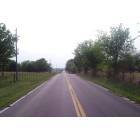

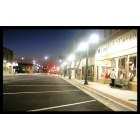

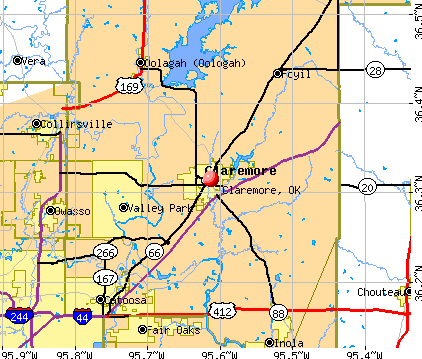


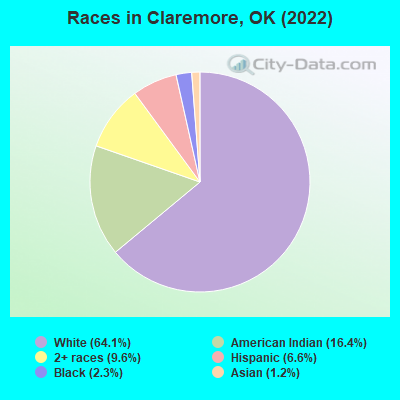
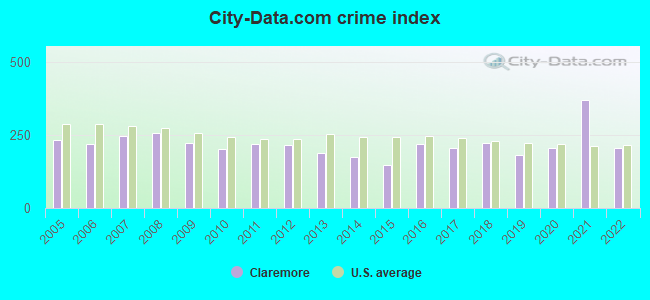
 Recent articles from our blog. Our writers, many of them Ph.D. graduates or candidates, create easy-to-read articles on a wide variety of topics.

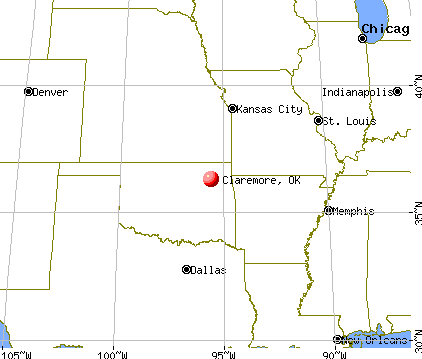
 (21.5 miles
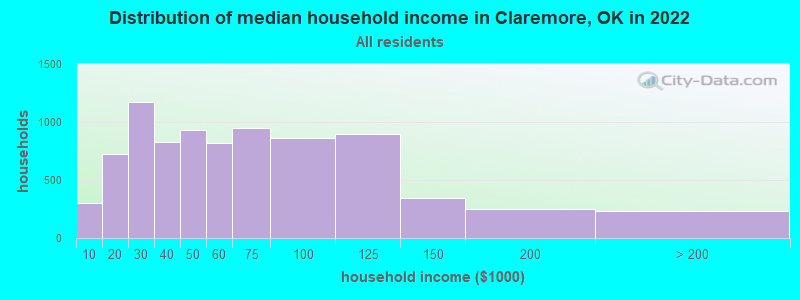

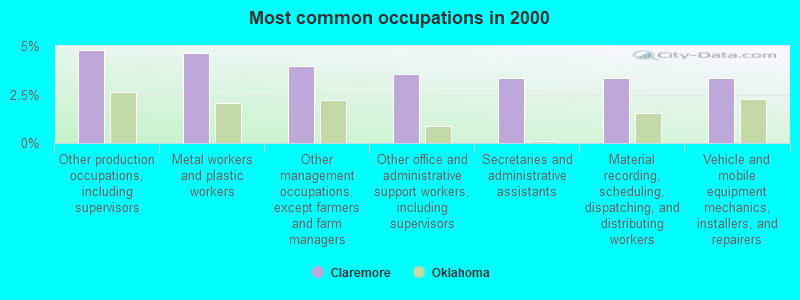
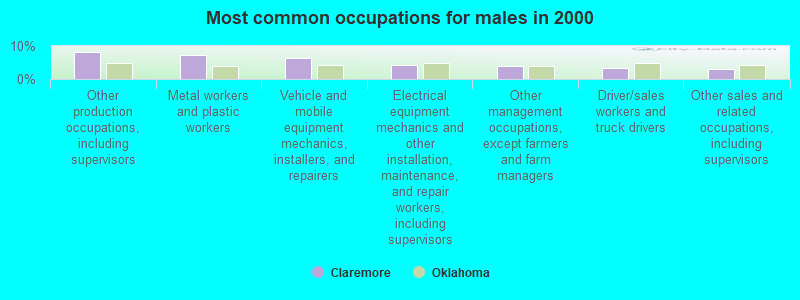
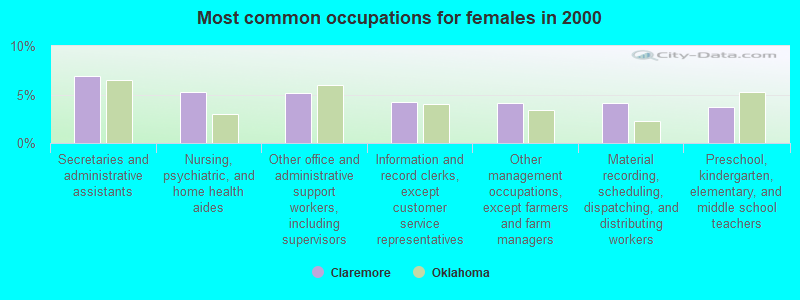
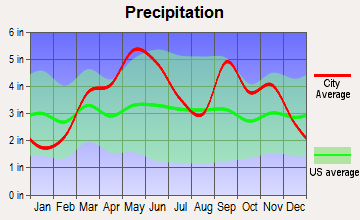
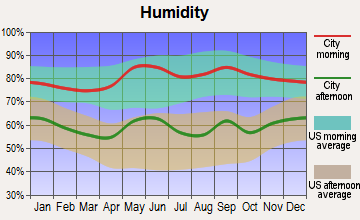
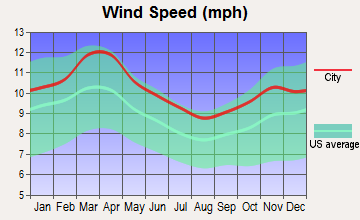
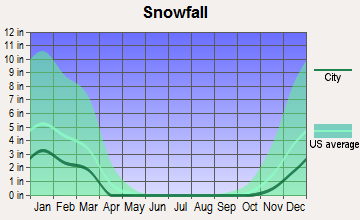
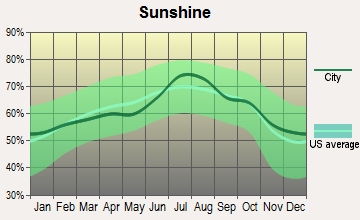
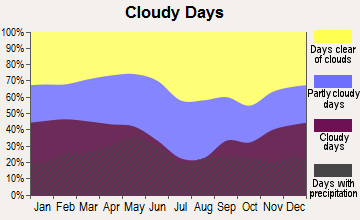
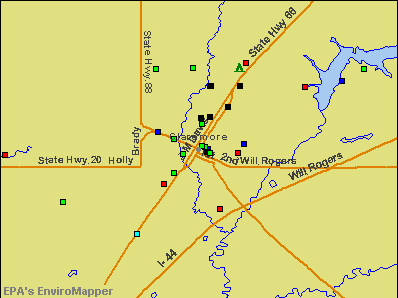

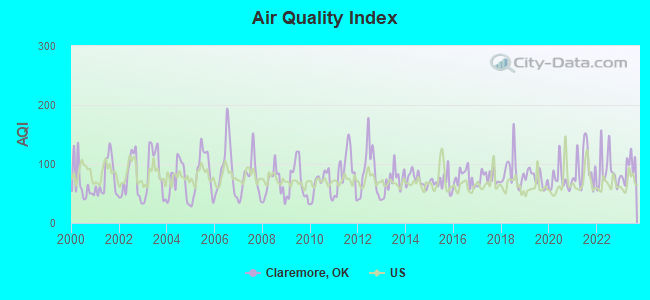
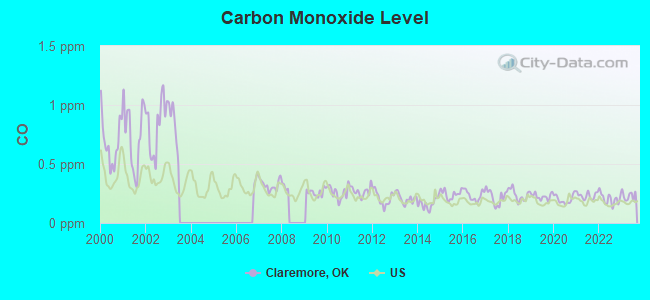
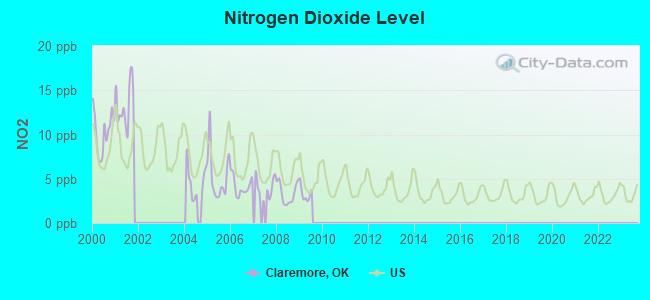
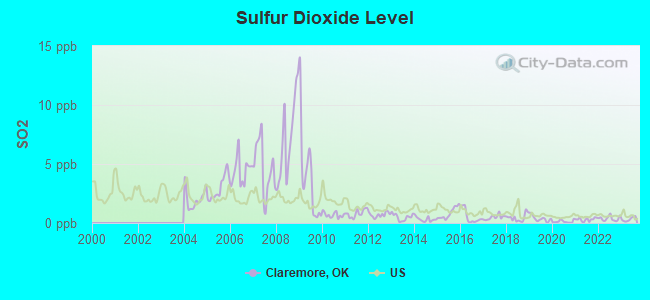
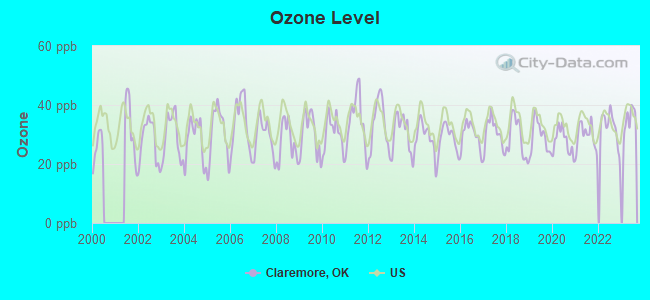
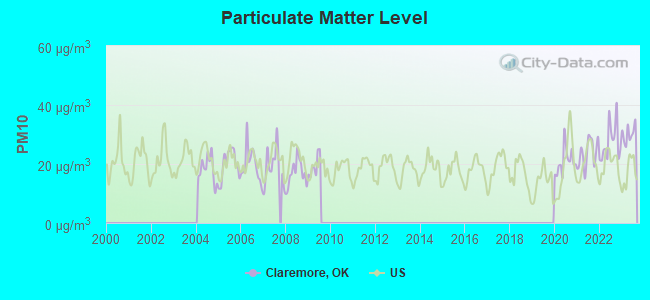
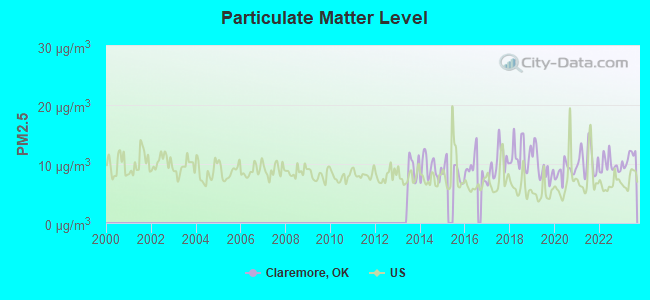
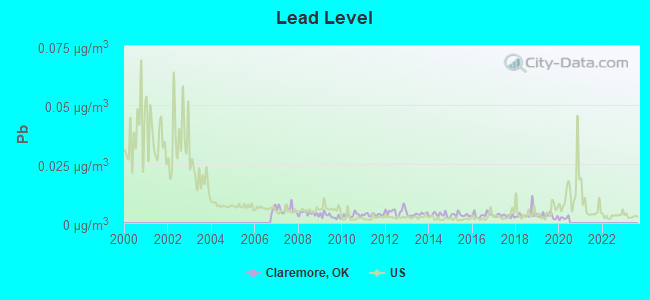

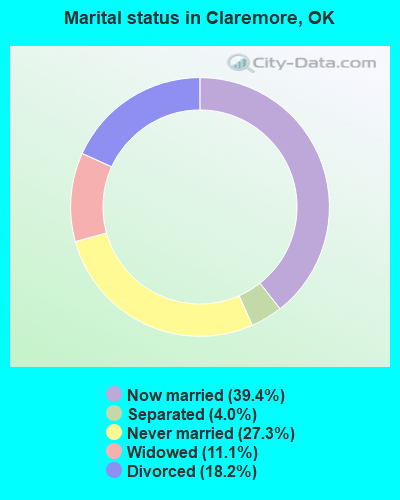
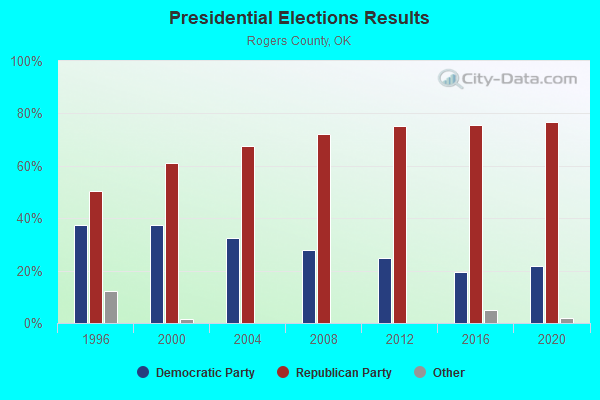
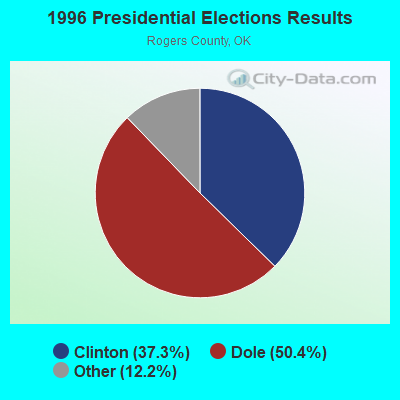

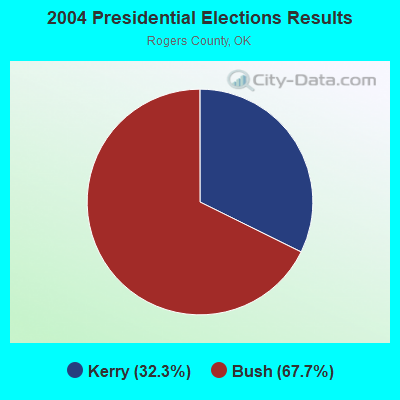
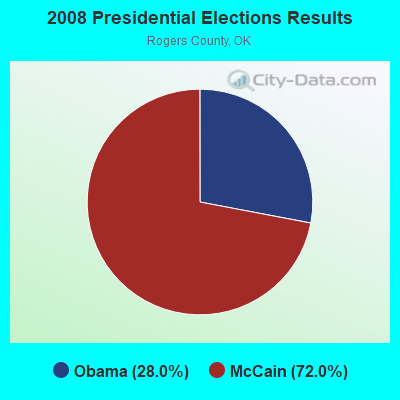
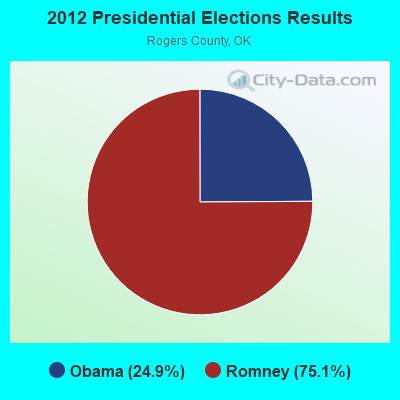
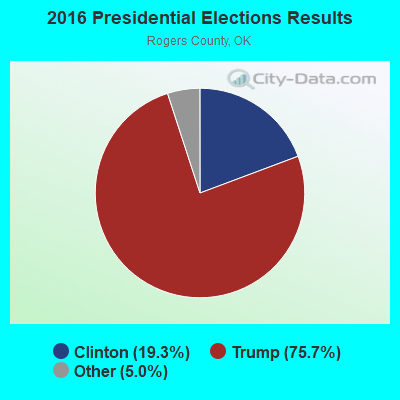
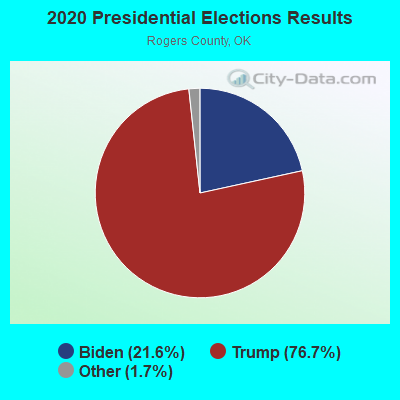
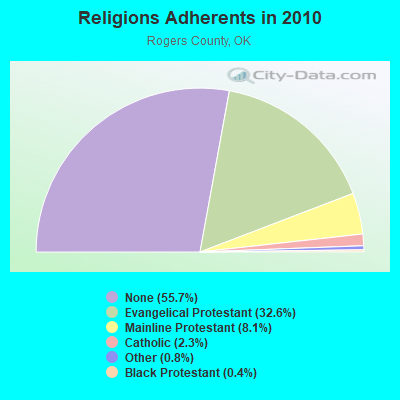
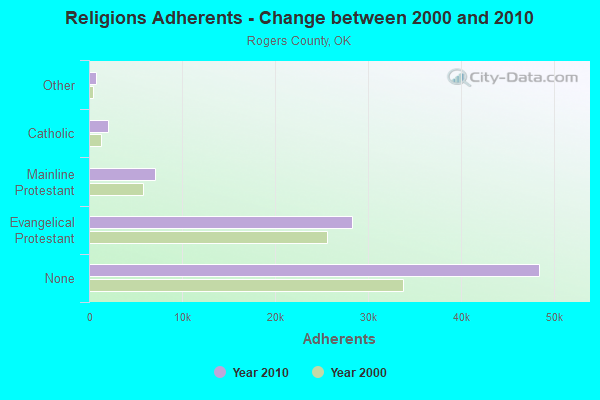
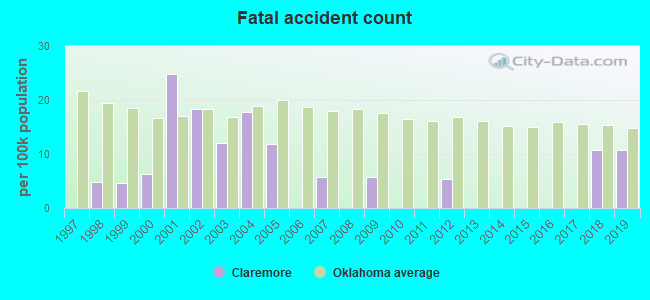
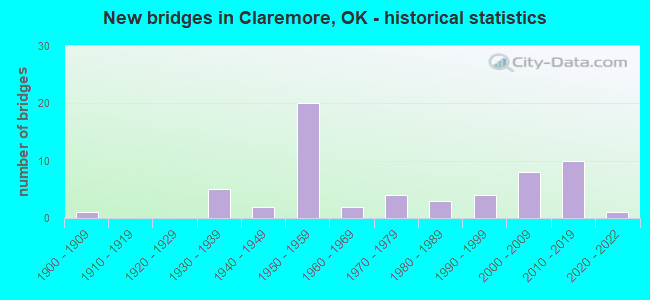
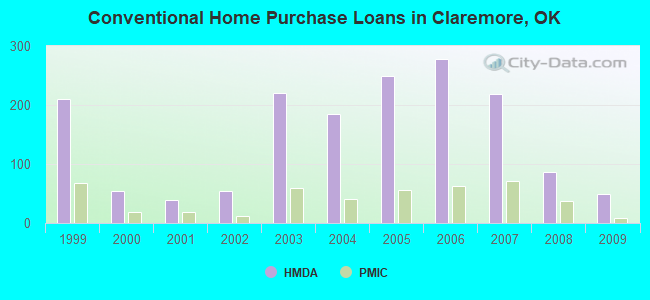
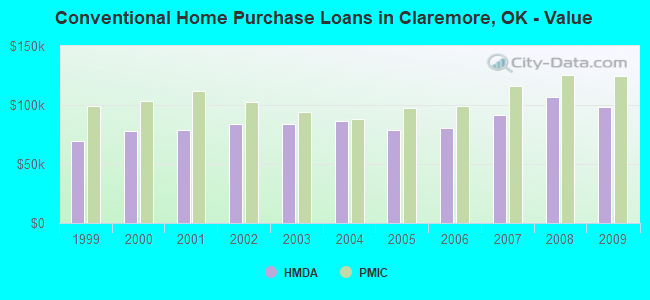
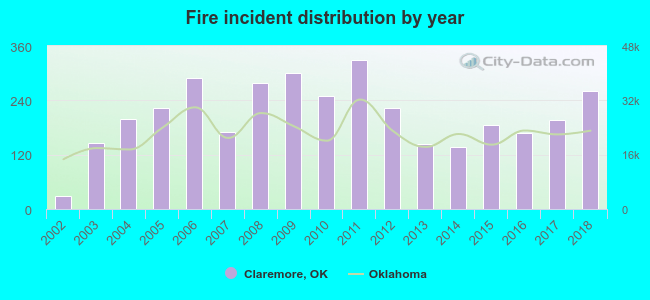 According to the data from the years 2002 - 2018 the average number of fire incidents per year is 207. The highest number of fire incidents - 330 took place in 2011, and the least - 29 in 2002. The data has an increasing trend.
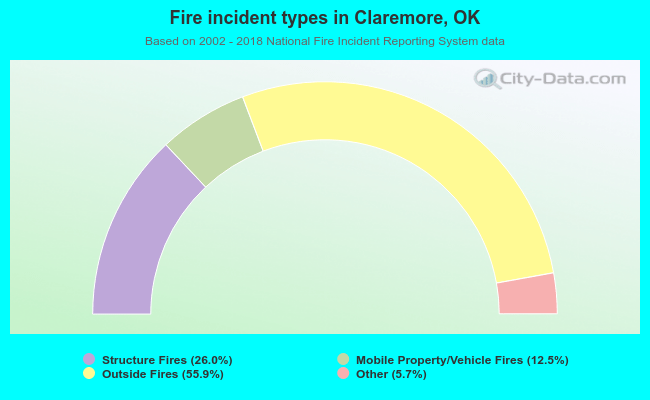 When looking into fire subcategories, the most reports belonged to: Outside Fires (55.9%), and Structure Fires (26.0%).