DeKalb, Illinois Submit your own pictures of this city and show them to the world
OSM Map
General Map
Google Map
MSN Map
OSM Map
General Map
Google Map
MSN Map
OSM Map
General Map
Google Map
MSN Map
OSM Map
General Map
Google Map
MSN Map
Please wait while loading the map...
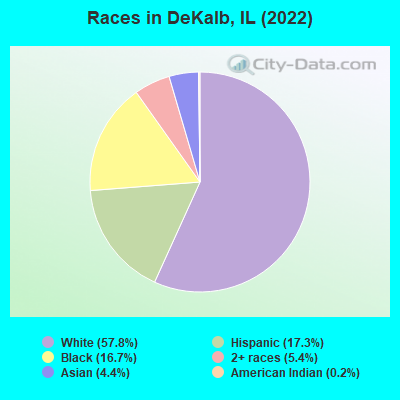
Population in 2022: 40,220 (100% urban, 0% rural). Population change since 2000: +3.1%Males: 19,899 Females: 20,321
March 2022 cost of living index in DeKalb: 99.6 (near average, U.S. average is 100) Percentage of residents living in poverty in 2022: 26.6%for White Non-Hispanic residents , 42.8% for Black residents , 27.8% for Hispanic or Latino residents , 19.2% for American Indian residents , 33.4% for other race residents , 26.7% for two or more races residents )
Profiles of local businesses
Business Search - 14 Million verified businesses
Data:
Median household income ($)
Median household income (% change since 2000)
Household income diversity
Ratio of average income to average house value (%)
Ratio of average income to average rent
Median household income ($) - White
Median household income ($) - Black or African American
Median household income ($) - Asian
Median household income ($) - Hispanic or Latino
Median household income ($) - American Indian and Alaska Native
Median household income ($) - Multirace
Median household income ($) - Other Race
Median household income for houses/condos with a mortgage ($)
Median household income for apartments without a mortgage ($)
Races - White alone (%)
Races - White alone (% change since 2000)
Races - Black alone (%)
Races - Black alone (% change since 2000)
Races - American Indian alone (%)
Races - American Indian alone (% change since 2000)
Races - Asian alone (%)
Races - Asian alone (% change since 2000)
Races - Hispanic (%)
Races - Hispanic (% change since 2000)
Races - Native Hawaiian and Other Pacific Islander alone (%)
Races - Native Hawaiian and Other Pacific Islander alone (% change since 2000)
Races - Two or more races (%)
Races - Two or more races (% change since 2000)
Races - Other race alone (%)
Races - Other race alone (% change since 2000)
Racial diversity
Unemployment (%)
Unemployment (% change since 2000)
Unemployment (%) - White
Unemployment (%) - Black or African American
Unemployment (%) - Asian
Unemployment (%) - Hispanic or Latino
Unemployment (%) - American Indian and Alaska Native
Unemployment (%) - Multirace
Unemployment (%) - Other Race
Population density (people per square mile)
Population - Males (%)
Population - Females (%)
Population - Males (%) - White
Population - Males (%) - Black or African American
Population - Males (%) - Asian
Population - Males (%) - Hispanic or Latino
Population - Males (%) - American Indian and Alaska Native
Population - Males (%) - Multirace
Population - Males (%) - Other Race
Population - Females (%) - White
Population - Females (%) - Black or African American
Population - Females (%) - Asian
Population - Females (%) - Hispanic or Latino
Population - Females (%) - American Indian and Alaska Native
Population - Females (%) - Multirace
Population - Females (%) - Other Race
Coronavirus confirmed cases (Apr 27, 2024)
Deaths caused by coronavirus (Apr 27, 2024)
Coronavirus confirmed cases (per 100k population) (Apr 27, 2024)
Deaths caused by coronavirus (per 100k population) (Apr 27, 2024)
Daily increase in number of cases (Apr 27, 2024)
Weekly increase in number of cases (Apr 27, 2024)
Cases doubled (in days) (Apr 27, 2024)
Hospitalized patients (Apr 18, 2022)
Negative test results (Apr 18, 2022)
Total test results (Apr 18, 2022)
COVID Vaccine doses distributed (per 100k population) (Sep 19, 2023)
COVID Vaccine doses administered (per 100k population) (Sep 19, 2023)
COVID Vaccine doses distributed (Sep 19, 2023)
COVID Vaccine doses administered (Sep 19, 2023)
Likely homosexual households (%)
Likely homosexual households (% change since 2000)
Likely homosexual households - Lesbian couples (%)
Likely homosexual households - Lesbian couples (% change since 2000)
Likely homosexual households - Gay men (%)
Likely homosexual households - Gay men (% change since 2000)
Cost of living index
Median gross rent ($)
Median contract rent ($)
Median monthly housing costs ($)
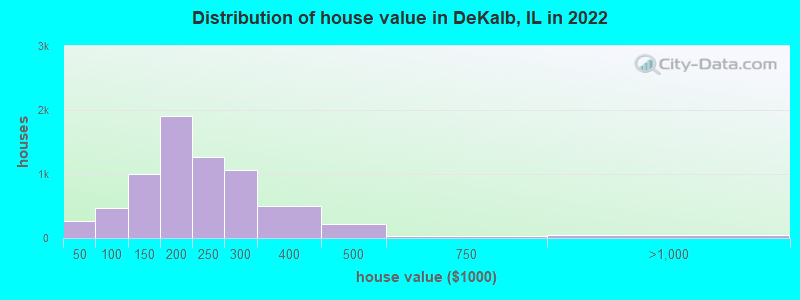
Median house or condo value ($)
Median house or condo value ($ change since 2000)
Mean house or condo value by units in structure - 1, detached ($)
Mean house or condo value by units in structure - 1, attached ($)
Mean house or condo value by units in structure - 2 ($)
Mean house or condo value by units in structure by units in structure - 3 or 4 ($)
Mean house or condo value by units in structure - 5 or more ($)
Mean house or condo value by units in structure - Boat, RV, van, etc. ($)
Mean house or condo value by units in structure - Mobile home ($)
Median house or condo value ($) - White
Median house or condo value ($) - Black or African American
Median house or condo value ($) - Asian
Median house or condo value ($) - Hispanic or Latino
Median house or condo value ($) - American Indian and Alaska Native
Median house or condo value ($) - Multirace
Median house or condo value ($) - Other Race
Median resident age
Resident age diversity
Median resident age - Males
Median resident age - Females
Median resident age - White
Median resident age - Black or African American
Median resident age - Asian
Median resident age - Hispanic or Latino
Median resident age - American Indian and Alaska Native
Median resident age - Multirace
Median resident age - Other Race
Median resident age - Males - White
Median resident age - Males - Black or African American
Median resident age - Males - Asian
Median resident age - Males - Hispanic or Latino
Median resident age - Males - American Indian and Alaska Native
Median resident age - Males - Multirace
Median resident age - Males - Other Race
Median resident age - Females - White
Median resident age - Females - Black or African American
Median resident age - Females - Asian
Median resident age - Females - Hispanic or Latino
Median resident age - Females - American Indian and Alaska Native
Median resident age - Females - Multirace
Median resident age - Females - Other Race
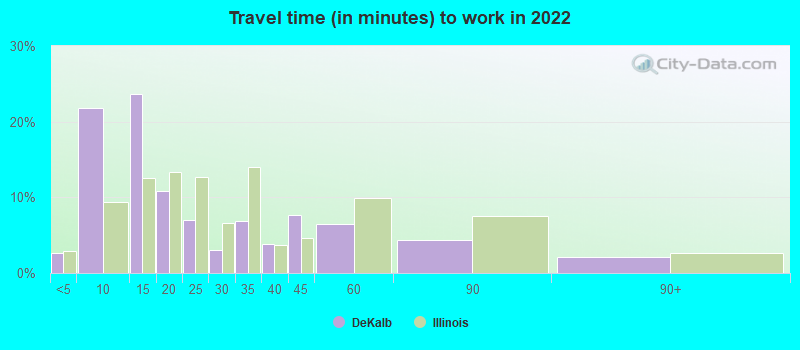
Commute - mean travel time to work (minutes)
Travel time to work - Less than 5 minutes (%)
Travel time to work - Less than 5 minutes (% change since 2000)
Travel time to work - 5 to 9 minutes (%)
Travel time to work - 5 to 9 minutes (% change since 2000)
Travel time to work - 10 to 19 minutes (%)
Travel time to work - 10 to 19 minutes (% change since 2000)
Travel time to work - 20 to 29 minutes (%)
Travel time to work - 20 to 29 minutes (% change since 2000)
Travel time to work - 30 to 39 minutes (%)
Travel time to work - 30 to 39 minutes (% change since 2000)
Travel time to work - 40 to 59 minutes (%)
Travel time to work - 40 to 59 minutes (% change since 2000)
Travel time to work - 60 to 89 minutes (%)
Travel time to work - 60 to 89 minutes (% change since 2000)
Travel time to work - 90 or more minutes (%)
Travel time to work - 90 or more minutes (% change since 2000)
Marital status - Never married (%)
Marital status - Now married (%)
Marital status - Separated (%)
Marital status - Widowed (%)
Marital status - Divorced (%)
Median family income ($)
Median family income (% change since 2000)
Median non-family income ($)
Median non-family income (% change since 2000)
Median per capita income ($)
Median per capita income (% change since 2000)
Median family income ($) - White
Median family income ($) - Black or African American
Median family income ($) - Asian
Median family income ($) - Hispanic or Latino
Median family income ($) - American Indian and Alaska Native
Median family income ($) - Multirace
Median family income ($) - Other Race
Median year house/condo built
Median year apartment built
Year house built - Built 2005 or later (%)
Year house built - Built 2000 to 2004 (%)
Year house built - Built 1990 to 1999 (%)
Year house built - Built 1980 to 1989 (%)
Year house built - Built 1970 to 1979 (%)
Year house built - Built 1960 to 1969 (%)
Year house built - Built 1950 to 1959 (%)
Year house built - Built 1940 to 1949 (%)
Year house built - Built 1939 or earlier (%)
Average household size
Household density (households per square mile)
Average household size - White
Average household size - Black or African American
Average household size - Asian
Average household size - Hispanic or Latino
Average household size - American Indian and Alaska Native
Average household size - Multirace
Average household size - Other Race
Occupied housing units (%)
Vacant housing units (%)
Owner occupied housing units (%)
Renter occupied housing units (%)
Vacancy status - For rent (%)
Vacancy status - For sale only (%)
Vacancy status - Rented or sold, not occupied (%)
Vacancy status - For seasonal, recreational, or occasional use (%)
Vacancy status - For migrant workers (%)
Vacancy status - Other vacant (%)
Residents with income below the poverty level (%)
Residents with income below 50% of the poverty level (%)
Children below poverty level (%)
Poor families by family type - Married-couple family (%)
Poor families by family type - Male, no wife present (%)
Poor families by family type - Female, no husband present (%)
Poverty status for native-born residents (%)
Poverty status for foreign-born residents (%)
Poverty among high school graduates not in families (%)
Poverty among people who did not graduate high school not in families (%)
Residents with income below the poverty level (%) - White
Residents with income below the poverty level (%) - Black or African American
Residents with income below the poverty level (%) - Asian
Residents with income below the poverty level (%) - Hispanic or Latino
Residents with income below the poverty level (%) - American Indian and Alaska Native
Residents with income below the poverty level (%) - Multirace
Residents with income below the poverty level (%) - Other Race
Air pollution - Air Quality Index (AQI)
Air pollution - CO
Air pollution - NO2
Air pollution - SO2
Air pollution - Ozone
Air pollution - PM10
Air pollution - PM25
Air pollution - Pb
Crime - Murders per 100,000 population
Crime - Rapes per 100,000 population
Crime - Robberies per 100,000 population
Crime - Assaults per 100,000 population
Crime - Burglaries per 100,000 population
Crime - Thefts per 100,000 population
Crime - Auto thefts per 100,000 population
Crime - Arson per 100,000 population
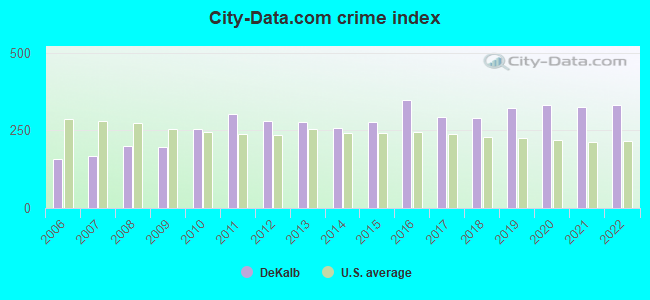
Crime - City-data.com crime index
Crime - Violent crime index
Crime - Property crime index
Crime - Murders per 100,000 population (5 year average)
Crime - Rapes per 100,000 population (5 year average)
Crime - Robberies per 100,000 population (5 year average)
Crime - Assaults per 100,000 population (5 year average)
Crime - Burglaries per 100,000 population (5 year average)
Crime - Thefts per 100,000 population (5 year average)
Crime - Auto thefts per 100,000 population (5 year average)
Crime - Arson per 100,000 population (5 year average)
Crime - City-data.com crime index (5 year average)
Crime - Violent crime index (5 year average)
Crime - Property crime index (5 year average)
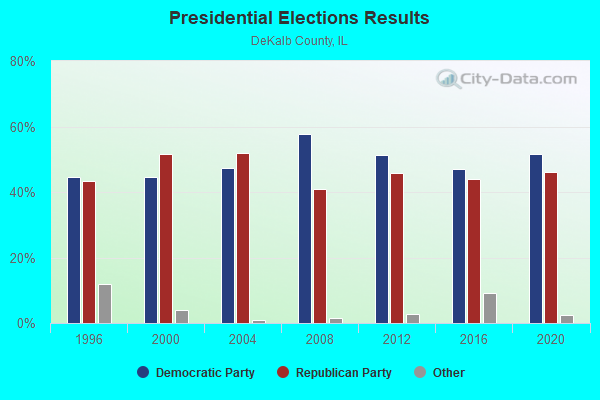
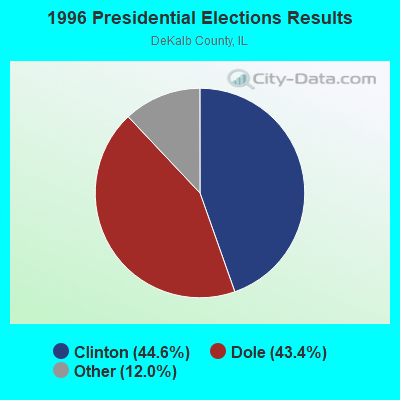
1996 Presidential Elections Results (%) - Democratic Party (Clinton)
1996 Presidential Elections Results (%) - Republican Party (Dole)
1996 Presidential Elections Results (%) - Other
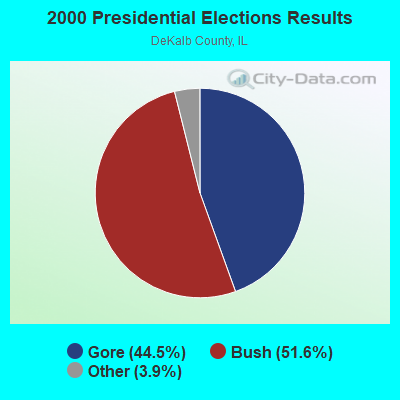
2000 Presidential Elections Results (%) - Democratic Party (Gore)
2000 Presidential Elections Results (%) - Republican Party (Bush)
2000 Presidential Elections Results (%) - Other
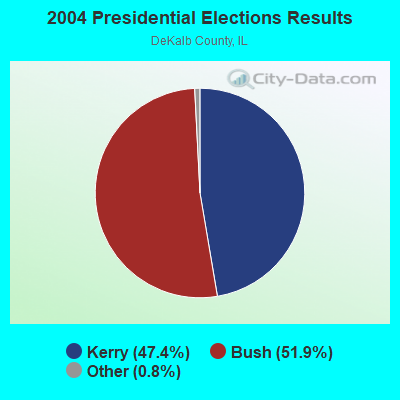
2004 Presidential Elections Results (%) - Democratic Party (Kerry)
2004 Presidential Elections Results (%) - Republican Party (Bush)
2004 Presidential Elections Results (%) - Other
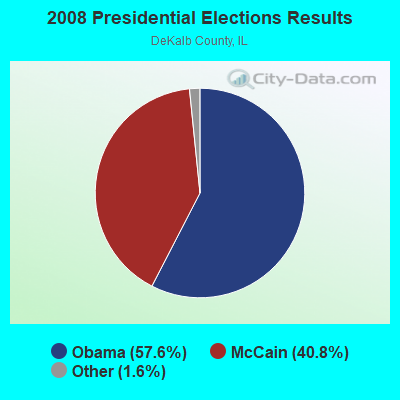
2008 Presidential Elections Results (%) - Democratic Party (Obama)
2008 Presidential Elections Results (%) - Republican Party (McCain)
2008 Presidential Elections Results (%) - Other
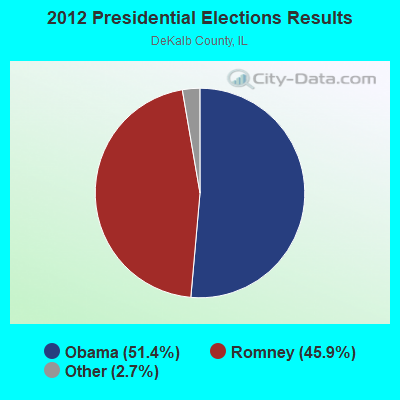
2012 Presidential Elections Results (%) - Democratic Party (Obama)
2012 Presidential Elections Results (%) - Republican Party (Romney)
2012 Presidential Elections Results (%) - Other
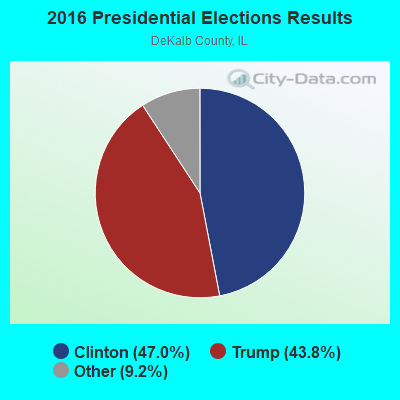
2016 Presidential Elections Results (%) - Democratic Party (Clinton)
2016 Presidential Elections Results (%) - Republican Party (Trump)
2016 Presidential Elections Results (%) - Other
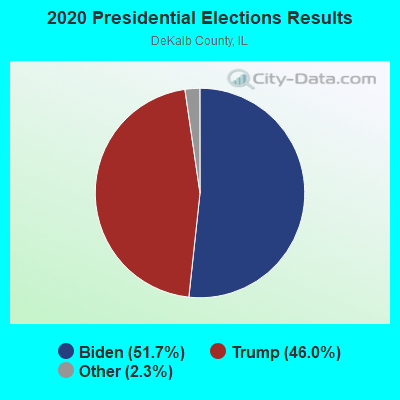
2020 Presidential Elections Results (%) - Democratic Party (Biden)
2020 Presidential Elections Results (%) - Republican Party (Trump)
2020 Presidential Elections Results (%) - Other
Ancestries Reported - Arab (%)
Ancestries Reported - Czech (%)
Ancestries Reported - Danish (%)
Ancestries Reported - Dutch (%)
Ancestries Reported - English (%)
Ancestries Reported - French (%)
Ancestries Reported - French Canadian (%)
Ancestries Reported - German (%)
Ancestries Reported - Greek (%)
Ancestries Reported - Hungarian (%)
Ancestries Reported - Irish (%)
Ancestries Reported - Italian (%)
Ancestries Reported - Lithuanian (%)
Ancestries Reported - Norwegian (%)
Ancestries Reported - Polish (%)
Ancestries Reported - Portuguese (%)
Ancestries Reported - Russian (%)
Ancestries Reported - Scotch-Irish (%)
Ancestries Reported - Scottish (%)
Ancestries Reported - Slovak (%)
Ancestries Reported - Subsaharan African (%)
Ancestries Reported - Swedish (%)
Ancestries Reported - Swiss (%)
Ancestries Reported - Ukrainian (%)
Ancestries Reported - United States (%)
Ancestries Reported - Welsh (%)
Ancestries Reported - West Indian (%)
Ancestries Reported - Other (%)
Educational Attainment - No schooling completed (%)
Educational Attainment - Less than high school (%)
Educational Attainment - High school or equivalent (%)
Educational Attainment - Less than 1 year of college (%)
Educational Attainment - 1 or more years of college (%)
Educational Attainment - Associate degree (%)
Educational Attainment - Bachelor's degree (%)
Educational Attainment - Master's degree (%)
Educational Attainment - Professional school degree (%)
Educational Attainment - Doctorate degree (%)
School Enrollment - Nursery, preschool (%)
School Enrollment - Kindergarten (%)
School Enrollment - Grade 1 to 4 (%)
School Enrollment - Grade 5 to 8 (%)
School Enrollment - Grade 9 to 12 (%)
School Enrollment - College undergrad (%)
School Enrollment - Graduate or professional (%)
School Enrollment - Not enrolled in school (%)
School enrollment - Public schools (%)
School enrollment - Private schools (%)
School enrollment - Not enrolled (%)
Median number of rooms in houses and condos
Median number of rooms in apartments
Housing units lacking complete plumbing facilities (%)
Housing units lacking complete kitchen facilities (%)
Density of houses
Urban houses (%)
Rural houses (%)
Households with people 60 years and over (%)
Households with people 65 years and over (%)
Households with people 75 years and over (%)
Households with one or more nonrelatives (%)
Households with no nonrelatives (%)
Population in households (%)
Family households (%)
Nonfamily households (%)
Population in families (%)
Family households with own children (%)
Median number of bedrooms in owner occupied houses
Mean number of bedrooms in owner occupied houses
Median number of bedrooms in renter occupied houses
Mean number of bedrooms in renter occupied houses
Median number of vehichles in owner occupied houses
Mean number of vehichles in owner occupied houses
Median number of vehichles in renter occupied houses
Mean number of vehichles in renter occupied houses
Mortgage status - with mortgage (%)
Mortgage status - with second mortgage (%)
Mortgage status - with home equity loan (%)
Mortgage status - with both second mortgage and home equity loan (%)
Mortgage status - without a mortgage (%)
Average family size
Average family size - White
Average family size - Black or African American
Average family size - Asian
Average family size - Hispanic or Latino
Average family size - American Indian and Alaska Native
Average family size - Multirace
Average family size - Other Race
Geographical mobility - Same house 1 year ago (%)
Geographical mobility - Moved within same county (%)
Geographical mobility - Moved from different county within same state (%)
Geographical mobility - Moved from different state (%)
Geographical mobility - Moved from abroad (%)
Place of birth - Born in state of residence (%)
Place of birth - Born in other state (%)
Place of birth - Native, outside of US (%)
Place of birth - Foreign born (%)
Housing units in structures - 1, detached (%)
Housing units in structures - 1, attached (%)
Housing units in structures - 2 (%)
Housing units in structures - 3 or 4 (%)
Housing units in structures - 5 to 9 (%)
Housing units in structures - 10 to 19 (%)
Housing units in structures - 20 to 49 (%)
Housing units in structures - 50 or more (%)
Housing units in structures - Mobile home (%)
Housing units in structures - Boat, RV, van, etc. (%)
House/condo owner moved in on average (years ago)
Renter moved in on average (years ago)
Year householder moved into unit - Moved in 1999 to March 2000 (%)
Year householder moved into unit - Moved in 1995 to 1998 (%)
Year householder moved into unit - Moved in 1990 to 1994 (%)
Year householder moved into unit - Moved in 1980 to 1989 (%)
Year householder moved into unit - Moved in 1970 to 1979 (%)
Year householder moved into unit - Moved in 1969 or earlier (%)
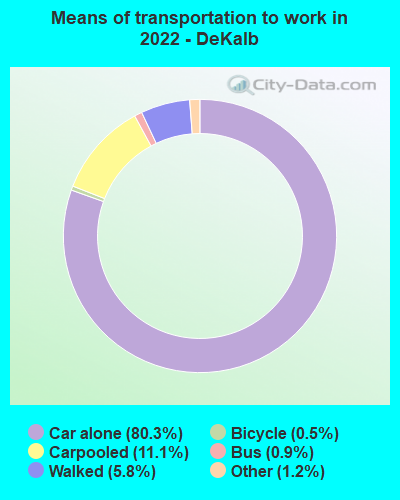
Means of transportation to work - Drove car alone (%)
Means of transportation to work - Carpooled (%)
Means of transportation to work - Public transportation (%)
Means of transportation to work - Bus or trolley bus (%)
Means of transportation to work - Streetcar or trolley car (%)
Means of transportation to work - Subway or elevated (%)
Means of transportation to work - Railroad (%)
Means of transportation to work - Ferryboat (%)
Means of transportation to work - Taxicab (%)
Means of transportation to work - Motorcycle (%)
Means of transportation to work - Bicycle (%)
Means of transportation to work - Walked (%)
Means of transportation to work - Other means (%)
Working at home (%)
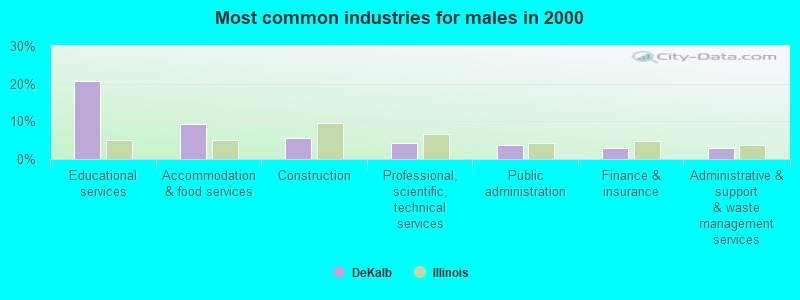
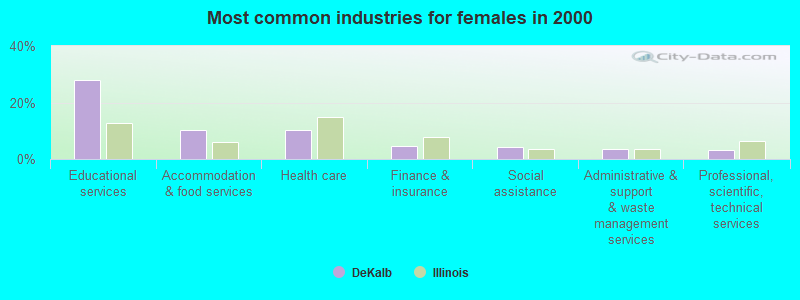
Industry diversity
Most Common Industries - Agriculture, forestry, fishing and hunting, and mining (%)
Most Common Industries - Agriculture, forestry, fishing and hunting (%)
Most Common Industries - Mining, quarrying, and oil and gas extraction (%)
Most Common Industries - Construction (%)
Most Common Industries - Manufacturing (%)
Most Common Industries - Wholesale trade (%)
Most Common Industries - Retail trade (%)
Most Common Industries - Transportation and warehousing, and utilities (%)
Most Common Industries - Transportation and warehousing (%)
Most Common Industries - Utilities (%)
Most Common Industries - Information (%)
Most Common Industries - Finance and insurance, and real estate and rental and leasing (%)
Most Common Industries - Finance and insurance (%)
Most Common Industries - Real estate and rental and leasing (%)
Most Common Industries - Professional, scientific, and management, and administrative and waste management services (%)
Most Common Industries - Professional, scientific, and technical services (%)
Most Common Industries - Management of companies and enterprises (%)
Most Common Industries - Administrative and support and waste management services (%)
Most Common Industries - Educational services, and health care and social assistance (%)
Most Common Industries - Educational services (%)
Most Common Industries - Health care and social assistance (%)
Most Common Industries - Arts, entertainment, and recreation, and accommodation and food services (%)
Most Common Industries - Arts, entertainment, and recreation (%)
Most Common Industries - Accommodation and food services (%)
Most Common Industries - Other services, except public administration (%)
Most Common Industries - Public administration (%)
Occupation diversity
Most Common Occupations - Management, business, science, and arts occupations (%)
Most Common Occupations - Management, business, and financial occupations (%)
Most Common Occupations - Management occupations (%)
Most Common Occupations - Business and financial operations occupations (%)
Most Common Occupations - Computer, engineering, and science occupations (%)
Most Common Occupations - Computer and mathematical occupations (%)
Most Common Occupations - Architecture and engineering occupations (%)
Most Common Occupations - Life, physical, and social science occupations (%)
Most Common Occupations - Education, legal, community service, arts, and media occupations (%)
Most Common Occupations - Community and social service occupations (%)
Most Common Occupations - Legal occupations (%)
Most Common Occupations - Education, training, and library occupations (%)
Most Common Occupations - Arts, design, entertainment, sports, and media occupations (%)
Most Common Occupations - Healthcare practitioners and technical occupations (%)
Most Common Occupations - Health diagnosing and treating practitioners and other technical occupations (%)
Most Common Occupations - Health technologists and technicians (%)
Most Common Occupations - Service occupations (%)
Most Common Occupations - Healthcare support occupations (%)
Most Common Occupations - Protective service occupations (%)
Most Common Occupations - Fire fighting and prevention, and other protective service workers including supervisors (%)
Most Common Occupations - Law enforcement workers including supervisors (%)
Most Common Occupations - Food preparation and serving related occupations (%)
Most Common Occupations - Building and grounds cleaning and maintenance occupations (%)
Most Common Occupations - Personal care and service occupations (%)
Most Common Occupations - Sales and office occupations (%)
Most Common Occupations - Sales and related occupations (%)
Most Common Occupations - Office and administrative support occupations (%)
Most Common Occupations - Natural resources, construction, and maintenance occupations (%)
Most Common Occupations - Farming, fishing, and forestry occupations (%)
Most Common Occupations - Construction and extraction occupations (%)
Most Common Occupations - Installation, maintenance, and repair occupations (%)
Most Common Occupations - Production, transportation, and material moving occupations (%)
Most Common Occupations - Production occupations (%)
Most Common Occupations - Transportation occupations (%)
Most Common Occupations - Material moving occupations (%)
People in Group quarters - Institutionalized population (%)
People in Group quarters - Correctional institutions (%)
People in Group quarters - Federal prisons and detention centers (%)
People in Group quarters - Halfway houses (%)
People in Group quarters - Local jails and other confinement facilities (including police lockups) (%)
People in Group quarters - Military disciplinary barracks (%)
People in Group quarters - State prisons (%)
People in Group quarters - Other types of correctional institutions (%)
People in Group quarters - Nursing homes (%)
People in Group quarters - Hospitals/wards, hospices, and schools for the handicapped (%)
People in Group quarters - Hospitals/wards and hospices for chronically ill (%)
People in Group quarters - Hospices or homes for chronically ill (%)
People in Group quarters - Military hospitals or wards for chronically ill (%)
People in Group quarters - Other hospitals or wards for chronically ill (%)
People in Group quarters - Hospitals or wards for drug/alcohol abuse (%)
People in Group quarters - Mental (Psychiatric) hospitals or wards (%)
People in Group quarters - Schools, hospitals, or wards for the mentally retarded (%)
People in Group quarters - Schools, hospitals, or wards for the physically handicapped (%)
People in Group quarters - Institutions for the deaf (%)
People in Group quarters - Institutions for the blind (%)
People in Group quarters - Orthopedic wards and institutions for the physically handicapped (%)
People in Group quarters - Wards in general hospitals for patients who have no usual home elsewhere (%)
People in Group quarters - Wards in military hospitals for patients who have no usual home elsewhere (%)
People in Group quarters - Juvenile institutions (%)
People in Group quarters - Long-term care (%)
People in Group quarters - Homes for abused, dependent, and neglected children (%)
People in Group quarters - Residential treatment centers for emotionally disturbed children (%)
People in Group quarters - Training schools for juvenile delinquents (%)
People in Group quarters - Short-term care, detention or diagnostic centers for delinquent children (%)
People in Group quarters - Type of juvenile institution unknown (%)
People in Group quarters - Noninstitutionalized population (%)
People in Group quarters - College dormitories (includes college quarters off campus) (%)
People in Group quarters - Military quarters (%)
People in Group quarters - On base (%)
People in Group quarters - Barracks, unaccompanied personnel housing (UPH), (Enlisted/Officer), ;and similar group living quarters for military personnel (%)
People in Group quarters - Transient quarters for temporary residents (%)
People in Group quarters - Military ships (%)
People in Group quarters - Group homes (%)
People in Group quarters - Homes or halfway houses for drug/alcohol abuse (%)
People in Group quarters - Homes for the mentally ill (%)
People in Group quarters - Homes for the mentally retarded (%)
People in Group quarters - Homes for the physically handicapped (%)
People in Group quarters - Other group homes (%)
People in Group quarters - Religious group quarters (%)
People in Group quarters - Dormitories (%)
People in Group quarters - Agriculture workers' dormitories on farms (%)
People in Group quarters - Job Corps and vocational training facilities (%)
People in Group quarters - Other workers' dormitories (%)
People in Group quarters - Crews of maritime vessels (%)
People in Group quarters - Other nonhousehold living situations (%)
People in Group quarters - Other noninstitutional group quarters (%)
Residents speaking English at home (%)
Residents speaking English at home - Born in the United States (%)
Residents speaking English at home - Native, born elsewhere (%)
Residents speaking English at home - Foreign born (%)
Residents speaking Spanish at home (%)
Residents speaking Spanish at home - Born in the United States (%)
Residents speaking Spanish at home - Native, born elsewhere (%)
Residents speaking Spanish at home - Foreign born (%)
Residents speaking other language at home (%)
Residents speaking other language at home - Born in the United States (%)
Residents speaking other language at home - Native, born elsewhere (%)
Residents speaking other language at home - Foreign born (%)
Class of Workers - Employee of private company (%)
Class of Workers - Self-employed in own incorporated business (%)
Class of Workers - Private not-for-profit wage and salary workers (%)
Class of Workers - Local government workers (%)
Class of Workers - State government workers (%)
Class of Workers - Federal government workers (%)
Class of Workers - Self-employed workers in own not incorporated business and Unpaid family workers (%)
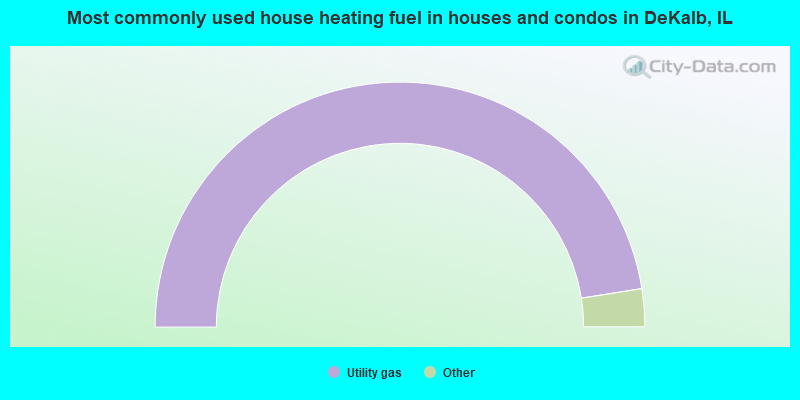
House heating fuel used in houses and condos - Utility gas (%)
House heating fuel used in houses and condos - Bottled, tank, or LP gas (%)
House heating fuel used in houses and condos - Electricity (%)
House heating fuel used in houses and condos - Fuel oil, kerosene, etc. (%)
House heating fuel used in houses and condos - Coal or coke (%)
House heating fuel used in houses and condos - Wood (%)
House heating fuel used in houses and condos - Solar energy (%)
House heating fuel used in houses and condos - Other fuel (%)
House heating fuel used in houses and condos - No fuel used (%)
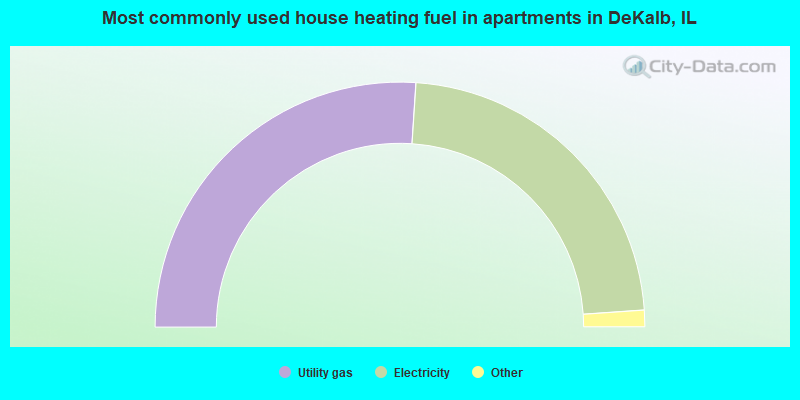
House heating fuel used in apartments - Utility gas (%)
House heating fuel used in apartments - Bottled, tank, or LP gas (%)
House heating fuel used in apartments - Electricity (%)
House heating fuel used in apartments - Fuel oil, kerosene, etc. (%)
House heating fuel used in apartments - Coal or coke (%)
House heating fuel used in apartments - Wood (%)
House heating fuel used in apartments - Solar energy (%)
House heating fuel used in apartments - Other fuel (%)
House heating fuel used in apartments - No fuel used (%)
Armed forces status - In Armed Forces (%)
Armed forces status - Civilian (%)
Armed forces status - Civilian - Veteran (%)
Armed forces status - Civilian - Nonveteran (%)
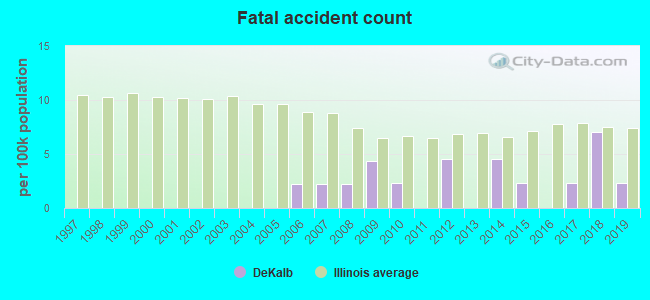
Fatal accidents locations in years 2005-2021
Fatal accidents locations in 2005
Fatal accidents locations in 2006
Fatal accidents locations in 2007
Fatal accidents locations in 2008
Fatal accidents locations in 2009
Fatal accidents locations in 2010
Fatal accidents locations in 2011
Fatal accidents locations in 2012
Fatal accidents locations in 2013
Fatal accidents locations in 2014
Fatal accidents locations in 2015
Fatal accidents locations in 2016
Fatal accidents locations in 2017
Fatal accidents locations in 2018
Fatal accidents locations in 2019
Fatal accidents locations in 2020
Fatal accidents locations in 2021
Alcohol use - People drinking some alcohol every month (%)
Alcohol use - People not drinking at all (%)
Alcohol use - Average days/month drinking alcohol
Alcohol use - Average drinks/week
Alcohol use - Average days/year people drink much
Audiometry - Average condition of hearing (%)
Audiometry - People that can hear a whisper from across a quiet room (%)
Audiometry - People that can hear normal voice from across a quiet room (%)
Audiometry - Ears ringing, roaring, buzzing (%)
Audiometry - Had a job exposure to loud noise (%)
Audiometry - Had off-work exposure to loud noise (%)
Blood Pressure & Cholesterol - Has high blood pressure (%)
Blood Pressure & Cholesterol - Checking blood pressure at home (%)
Blood Pressure & Cholesterol - Frequently checking blood cholesterol (%)
Blood Pressure & Cholesterol - Has high cholesterol level (%)
Consumer Behavior - Money monthly spent on food at supermarket/grocery store
Consumer Behavior - Money monthly spent on food at other stores
Consumer Behavior - Money monthly spent on eating out
Consumer Behavior - Money monthly spent on carryout/delivered foods
Consumer Behavior - Income spent on food at supermarket/grocery store (%)
Consumer Behavior - Income spent on food at other stores (%)
Consumer Behavior - Income spent on eating out (%)
Consumer Behavior - Income spent on carryout/delivered foods (%)
Current Health Status - General health condition (%)
Current Health Status - Blood donors (%)
Current Health Status - Has blood ever tested for HIV virus (%)
Current Health Status - Left-handed people (%)
Dermatology - People using sunscreen (%)
Diabetes - Diabetics (%)
Diabetes - Had a blood test for high blood sugar (%)
Diabetes - People taking insulin (%)
Diet Behavior & Nutrition - Diet health (%)
Diet Behavior & Nutrition - Milk product consumption (# of products/month)
Diet Behavior & Nutrition - Meals not home prepared (#/week)
Diet Behavior & Nutrition - Meals from fast food or pizza place (#/week)
Diet Behavior & Nutrition - Ready-to-eat foods (#/month)
Diet Behavior & Nutrition - Frozen meals/pizza (#/month)
Drug Use - People that ever used marijuana or hashish (%)
Drug Use - Ever used hard drugs (%)
Drug Use - Ever used any form of cocaine (%)
Drug Use - Ever used heroin (%)
Drug Use - Ever used methamphetamine (%)
Health Insurance - People covered by health insurance (%)
Kidney Conditions-Urology - Avg. # of times urinating at night
Medical Conditions - People with asthma (%)
Medical Conditions - People with anemia (%)
Medical Conditions - People with psoriasis (%)
Medical Conditions - People with overweight (%)
Medical Conditions - Elderly people having difficulties in thinking or remembering (%)
Medical Conditions - People who ever received blood transfusion (%)
Medical Conditions - People having trouble seeing even with glass/contacts (%)
Medical Conditions - People with arthritis (%)
Medical Conditions - People with gout (%)
Medical Conditions - People with congestive heart failure (%)
Medical Conditions - People with coronary heart disease (%)
Medical Conditions - People with angina pectoris (%)
Medical Conditions - People who ever had heart attack (%)
Medical Conditions - People who ever had stroke (%)
Medical Conditions - People with emphysema (%)
Medical Conditions - People with thyroid problem (%)
Medical Conditions - People with chronic bronchitis (%)
Medical Conditions - People with any liver condition (%)
Medical Conditions - People who ever had cancer or malignancy (%)
Mental Health - People who have little interest in doing things (%)
Mental Health - People feeling down, depressed, or hopeless (%)
Mental Health - People who have trouble sleeping or sleeping too much (%)
Mental Health - People feeling tired or having little energy (%)
Mental Health - People with poor appetite or overeating (%)
Mental Health - People feeling bad about themself (%)
Mental Health - People who have trouble concentrating on things (%)
Mental Health - People moving or speaking slowly or too fast (%)
Mental Health - People having thoughts they would be better off dead (%)
Oral Health - Average years since last visit a dentist
Oral Health - People embarrassed because of mouth (%)
Oral Health - People with gum disease (%)
Oral Health - General health of teeth and gums (%)
Oral Health - Average days a week using dental floss/device
Oral Health - Average days a week using mouthwash for dental problem
Oral Health - Average number of teeth
Pesticide Use - Households using pesticides to control insects (%)
Pesticide Use - Households using pesticides to kill weeds (%)
Physical Activity - People doing vigorous-intensity work activities (%)
Physical Activity - People doing moderate-intensity work activities (%)
Physical Activity - People walking or bicycling (%)
Physical Activity - People doing vigorous-intensity recreational activities (%)
Physical Activity - People doing moderate-intensity recreational activities (%)
Physical Activity - Average hours a day doing sedentary activities
Physical Activity - Average hours a day watching TV or videos
Physical Activity - Average hours a day using computer
Physical Functioning - People having limitations keeping them from working (%)
Physical Functioning - People limited in amount of work they can do (%)
Physical Functioning - People that need special equipment to walk (%)
Physical Functioning - People experiencing confusion/memory problems (%)
Physical Functioning - People requiring special healthcare equipment (%)
Prescription Medications - Average number of prescription medicines taking
Preventive Aspirin Use - Adults 40+ taking low-dose aspirin (%)
Reproductive Health - Vaginal deliveries (%)
Reproductive Health - Cesarean deliveries (%)
Reproductive Health - Deliveries resulted in a live birth (%)
Reproductive Health - Pregnancies resulted in a delivery (%)
Reproductive Health - Women breastfeeding newborns (%)
Reproductive Health - Women that had a hysterectomy (%)
Reproductive Health - Women that had both ovaries removed (%)
Reproductive Health - Women that have ever taken birth control pills (%)
Reproductive Health - Women taking birth control pills (%)
Reproductive Health - Women that have ever used Depo-Provera or injectables (%)
Reproductive Health - Women that have ever used female hormones (%)
Sexual Behavior - People 18+ that ever had sex (vaginal, anal, or oral) (%)
Sexual Behavior - Males 18+ that ever had vaginal sex with a woman (%)
Sexual Behavior - Males 18+ that ever performed oral sex on a woman (%)
Sexual Behavior - Males 18+ that ever had anal sex with a woman (%)
Sexual Behavior - Males 18+ that ever had any sex with a man (%)
Sexual Behavior - Females 18+ that ever had vaginal sex with a man (%)
Sexual Behavior - Females 18+ that ever performed oral sex on a man (%)
Sexual Behavior - Females 18+ that ever had anal sex with a man (%)
Sexual Behavior - Females 18+ that ever had any kind of sex with a woman (%)
Sexual Behavior - Average age people first had sex
Sexual Behavior - Average number of female sex partners in lifetime (males 18+)
Sexual Behavior - Average number of female vaginal sex partners in lifetime (males 18+)
Sexual Behavior - Average age people first performed oral sex on a woman (18+)
Sexual Behavior - Average number of woman performed oral sex on in lifetime (18+)
Sexual Behavior - Average number of male sex partners in lifetime (males 18+)
Sexual Behavior - Average number of male anal sex partners in lifetime (males 18+)
Sexual Behavior - Average age people first performed oral sex on a man (18+)
Sexual Behavior - Average number of male oral sex partners in lifetime (18+)
Sexual Behavior - People using protection when performing oral sex (%)
Sexual Behavior - Average number of times people have vaginal or anal sex a year
Sexual Behavior - People having sex without condom (%)
Sexual Behavior - Average number of male sex partners in lifetime (females 18+)
Sexual Behavior - Average number of male vaginal sex partners in lifetime (females 18+)
Sexual Behavior - Average number of female sex partners in lifetime (females 18+)
Sexual Behavior - Circumcised males 18+ (%)
Sleep Disorders - Average hours sleeping at night
Sleep Disorders - People that has trouble sleeping (%)
Smoking-Cigarette Use - People smoking cigarettes (%)
Taste & Smell - People 40+ having problems with smell (%)
Taste & Smell - People 40+ having problems with taste (%)
Taste & Smell - People 40+ that ever had wisdom teeth removed (%)
Taste & Smell - People 40+ that ever had tonsils teeth removed (%)
Taste & Smell - People 40+ that ever had a loss of consciousness because of a head injury (%)
Taste & Smell - People 40+ that ever had a broken nose or other serious injury to face or skull (%)
Taste & Smell - People 40+ that ever had two or more sinus infections (%)
Weight - Average height (inches)
Weight - Average weight (pounds)
Weight - Average BMI
Weight - People that are obese (%)
Weight - People that ever were obese (%)
Weight - People trying to lose weight (%)
According to our research of Illinois and other state lists, there were 61 registered sex offenders living in DeKalb, Illinois as of April 27, 2024 . The ratio of all residents to sex offenders in DeKalb is 707 to 1.The ratio of registered sex offenders to all residents in this city is near the state average.
Officers per 1,000 residents here:
1.44Illinois average:
2.84
Latest news from DeKalb, IL collected exclusively by city-data.com from local newspapers, TV, and radio stations
Ancestries: Irish (8.5%), German (7.7%), English (5.8%), Italian (2.7%), American (2.5%), European (2.3%).
Current Local Time:
Incorporated on 06/20/1873
Land area: 12.6 square miles.
Population density: 3,189 people per square mile (average).
4,090 residents are foreign born (4.2% Latin America , 4.1% Asia , 1.1% Africa ).
This city:
10.1%Illinois:
14.1%
Median real estate property taxes paid for housing units with mortgages in 2022: $5,556 (2.7%)Median real estate property taxes paid for housing units with no mortgage in 2022: $5,385 (2.9%)
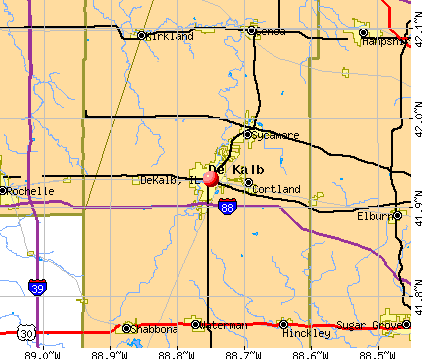
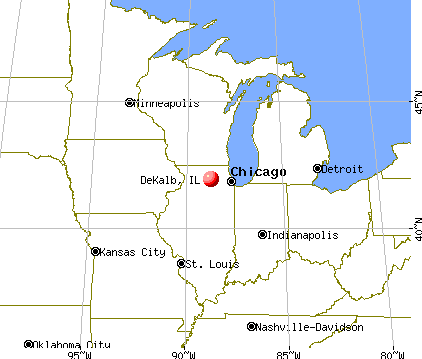
Nearest city with pop. 50,000+: Elgin, IL
Nearest city with pop. 200,000+: Chicago, IL
Nearest cities:
Latitude: 41.93 N, Longitude: 88.75 W
Nickname or alias (official or unofficial): Barbed Wire Capital of the World
Daytime population change due to commuting: -356 (-0.9%)Workers who live and work in this city: 9,501 (48.8%)
Area code commonly used in this area: 815
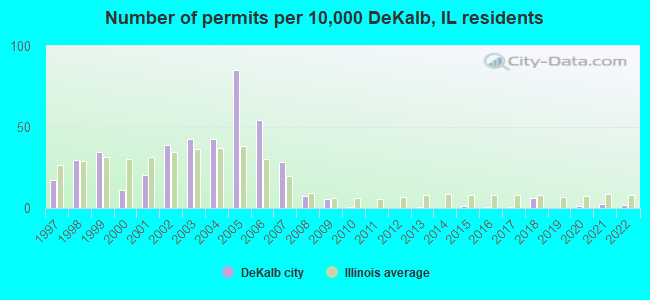
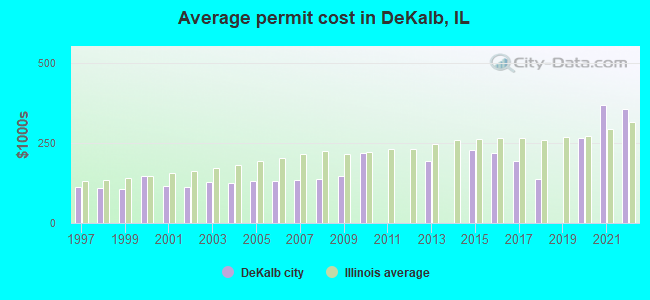
Single-family new house construction building permits:
2022: 7 buildings , average cost: $354,9002021: 9 buildings , average cost: $369,8002020: 6 buildings , average cost: $265,4002018: 23 buildings , average cost: $136,6002017: 2 buildings , average cost: $195,0002016: 2 buildings , average cost: $219,5002015: 5 buildings , average cost: $229,0002013: 3 buildings , average cost: $195,0002010: 3 buildings , average cost: $220,0002009: 21 buildings , average cost: $148,3002008: 30 buildings , average cost: $137,1002007: 111 buildings , average cost: $132,9002006: 213 buildings , average cost: $131,1002005: 332 buildings , average cost: $131,9002004: 165 buildings , average cost: $125,8002003: 166 buildings , average cost: $128,9002002: 152 buildings , average cost: $112,9002001: 80 buildings , average cost: $117,4002000: 43 buildings , average cost: $148,1001999: 135 buildings , average cost: $107,2001998: 116 buildings , average cost: $108,2001997: 68 buildings , average cost: $112,400Unemployment in December 2023: Population change in the 1990s: +2,833 (+7.8%).
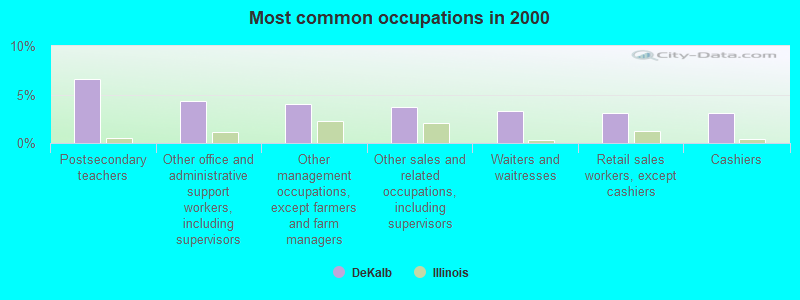
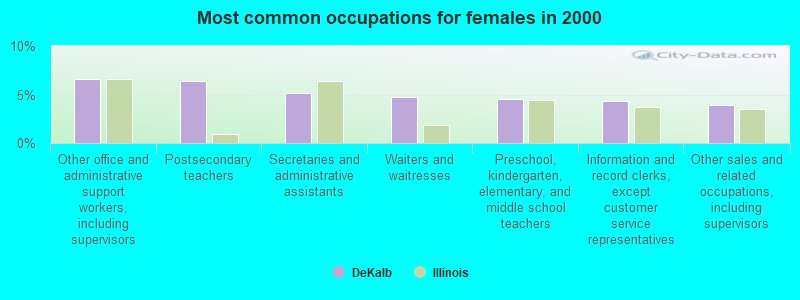
Most common occupations in DeKalb, IL (%)
Both Males Females
Postsecondary teachers (6.6%)
Other office and administrative support workers, including supervisors (4.4%)
Other management occupations, except farmers and farm managers (4.0%)
Other sales and related occupations, including supervisors (3.8%)
Waiters and waitresses (3.3%)
Retail sales workers, except cashiers (3.1%)
Cashiers (3.1%)
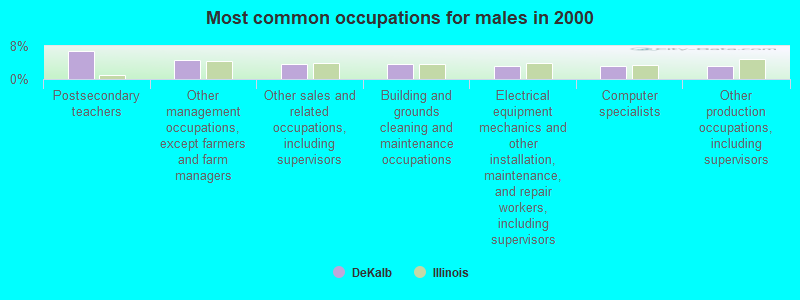
Postsecondary teachers (6.8%)
Other management occupations, except farmers and farm managers (4.5%)
Other sales and related occupations, including supervisors (3.6%)
Building and grounds cleaning and maintenance occupations (3.5%)
Electrical equipment mechanics and other installation, maintenance, and repair workers, including supervisors (3.3%)
Computer specialists (3.2%)
Other production occupations, including supervisors (3.2%)
Other office and administrative support workers, including supervisors (6.6%)
Postsecondary teachers (6.4%)
Secretaries and administrative assistants (5.1%)
Waiters and waitresses (4.8%)
Preschool, kindergarten, elementary, and middle school teachers (4.5%)
Information and record clerks, except customer service representatives (4.3%)
Other sales and related occupations, including supervisors (3.9%)
Tornado activity:
DeKalb-area historical tornado activity is slightly below Illinois state average. It is 48% greater than the overall U.S. average.
On 8/28/1990, a category F5 (max. wind speeds 261-318 mph) tornado 27.0 miles away from the DeKalb city center killed 29 people and injured 350 people and caused between $50,000 and $500,000 in damages.
On 4/21/1967, a category F4 (max. wind speeds 207-260 mph) tornado 21.8 miles away from the city center killed 24 people and injured 450 people and caused between $50,000 and $500,000 in damages.
Earthquake activity:
DeKalb-area historical earthquake activity is significantly above Illinois state average. It is 60% greater than the overall U.S. average. On 4/18/2008 at 09:36:59, a magnitude 5.4 (5.1 MB, 4.8 MS, 5.4 MW, 5.2 MW, Class: Moderate, Intensity: VI - VII) earthquake occurred 244.9 miles away from the city center On 6/28/2004 at 06:10:52, a magnitude 4.2 (4.2 MW, Depth: 6.2 mi, Class: Light, Intensity: IV - V) earthquake occurred 33.5 miles away from DeKalb center On 6/10/1987 at 23:48:54, a magnitude 5.1 (4.9 MB, 4.4 MS, 4.6 MS, 5.1 LG) earthquake occurred 219.9 miles away from DeKalb center On 4/18/2008 at 09:36:59, a magnitude 5.2 (5.2 MW, Depth: 8.9 mi) earthquake occurred 245.0 miles away from the city center On 2/10/2010 at 09:59:35, a magnitude 3.8 (3.8 MW, Depth: 6.2 mi, Class: Light, Intensity: II - III) earthquake occurred 13.2 miles away from the city center On 6/18/2002 at 17:37:15, a magnitude 5.0 (4.3 MB, 4.6 MW, 5.0 LG) earthquake occurred 277.6 miles away from the city center Magnitude types: regional Lg-wave magnitude (LG), body-wave magnitude (MB), surface-wave magnitude (MS), moment magnitude (MW) Natural disasters: The number of natural disasters in DeKalb County (11) is smaller than the US average (15).Major Disasters (Presidential) Declared: 7Emergencies Declared: 3Floods: 6, Storms: 5, Snowstorms: 2, Blizzard: 1, Hurricane: 1, Snow: 1, Wind: 1, Winter Storm: 1, Other: 1 (Note: some incidents may be assigned to more than one category). Hospitals and medical centers in DeKalb: DEKALB COUNTY HOSPICE (2727 SYCAMORE ROAD SUITE 1B) KISHWAUKEE COMMUNITY HOSPITAL (Voluntary non-profit - Private, provides emergency services, ONE KISH HOSPITAL DRIVE) DEKALB COUNTY HEALTH DEPARTMEN (2500 NORTH ANNIE GLIDDEN ROAD)
BETHANY HEALTH CARE AND REHAB CT (3298 RESOURCE PARKWAY)
DEKALB COUNTY REHAB AND NURSING (2600 NORTH ANNIE GLIDDEN ROAD)
OAK CREST (2944 GREENWOOD ACRES DRIVE)
PINE ACRES REHAB AND LIVING CTR (1212 SOUTH SECOND STREET)
College/University in DeKalb: Northern Illinois University Full-time enrollment: 18,126; Location: 1425 W. Lincoln Hwy.; Public; Website: www.niu.edu; Offers Doctor's degree )
Other colleges/universities with over 2000 students near DeKalb:
Kishwaukee College (about 7 miles; Malta, IL ; Full-time enrollment: 3,356)
Waubonsee Community College (about 18 miles; Sugar Grove, IL ; FT enrollment: 7,698)
Elgin Community College (about 23 miles; Elgin, IL ; FT enrollment: 8,173)
Aurora University (about 24 miles; Aurora, IL ; FT enrollment: 4,596)
Rock Valley College (about 30 miles; Rockford, IL ; FT enrollment: 6,269)
McHenry County College (about 31 miles; Crystal Lake, IL ; FT enrollment: 4,886)
North Central College (about 34 miles; Naperville, IL ; FT enrollment: 2,860)
Public high school in DeKalb:
Private high school in DeKalb: CAMOLOT SCHOOLS-DEKALB CAMPUS Students: 123, Location: 315 N 6TH ST, Grades: KG-12)
Public elementary/middle schools in DeKalb: CLINTON ROSETTE MIDDLE SCHOOL Students: 709, Location: 650 N 1ST ST, Grades: 6-8)HUNTLEY MIDDLE SCHOOL Students: 599, Location: 1515 S 4TH ST, Grades: 6-8)LITTLEJOHN ELEM SCHOOL Students: 510, Location: 1121 SCHOOL ST, Grades: KG-5)GWENDOLYN BROOKS ELEM SCH Students: 398, Location: 3225 SANGAMON DR, Grades: KG-5)JEFFERSON ELEM SCHOOL Students: 287, Location: 211 MCCORMICK DR, Grades: KG-5)FOUNDERS ELEMENTARY SCHOOL Students: 66, Location: 821 S 7TH ST, Grades: KG-5)LINCOLN ELEMENTARY SCHOOL Location: 220 E SUNSET PL, Grades: KG-5)
Private elementary/middle schools in DeKalb: ST MARY SCHOOL Students: 239, Location: 210 GURLER RD, Grades: PK-8)
INTERNATIONAL MONTESSORI ACADEMY Students: 82, Location: 403 FISK AVE, Grades: PK-4)
See full list of schools located in DeKalb Library in DeKalb: DEKALB PUBLIC LIBRARY Operating income: $1,463,578; Location: 309 OAK STREET; 141,905 books ; 4,965 audio materials ; 4,084 video materials ; 9 local licensed databases ; 18 state licensed databases ; 2 other licensed databases ; 261 print serial subscriptions ; 1 electronic serial subscriptions )
User-submitted facts and corrections:
May we add our current church information to the data list of facts about DeKalb, IL! It is as follows: SSSOSO (SOZO) Bible Church Fellowship 316 E. Lincoln Highway /P O Box 942 DeKalb, IL 60115 - www.sssoso.com Thank You!
Notable locations in DeKalb: (A) , Haish Memorial Library (B) , Pine Acres Rest Home (C) , DeKalb Fire Department Station 3 (D) , DeKalb Fire Department Station 2 (E) , DeKalb Fire Department Station 1 (F) , Ridge Ambulance Service (G) , Adams Hall (H) , Altgeld Hall (I) , Anderson Hall (J) , Boutell Memorial Concert Hall (K) , Center for Black Studies (L) , Chick Evans Field House (M) , Cole Hall (N) , Davis Hall (O) , Dorland Building (P) , Douglas Hall (Q) , DuSable Hall (R) , East Heating Plant (S) , Faraday Hall (T) . Display/hide their locations on the map
Churches in DeKalb include: (A) , Open Bible Church (B) , First Baptist Church of DeKalb (C) , First Congregational United Church of Christ (D) , First Lutheran Church (E) , Saint Mary Catholic Church (F) , Trinity Lutheran Church (G) , United Methodist Church of DeKalb (H) . Display/hide their locations on the map
Cemeteries: (1) , Evergreen Cemetery (2) , Fairview Park Cemetery (3) , Saint Marys Catholic DeKalb Cemetery (4) , Pleasant Street Cemetery (5) . Display/hide their locations on the map
Reservoirs: (A) , Lorusso Lagoon (B) . Display/hide their locations on the map
Parks in DeKalb include: (1) , Huskie Stadium (2) , Hopkins Park (3) , Huntley Park (4) , Liberty Park (5) , Lions Park (6) , McCormack Park (7) , Shipman Park (8) . Display/hide their locations on the map
Birthplace of: Richard Jenkins - Film actor, Barbara Hale - Actor, Brad Bradley - Professional wrestler, Cindy Crawford - (born 1966), model, W. Willard Wirtz - Secretary of Labor, Rich Eychaner - Entertainment industry businessman, A. J. Bramlett - Basketball player, Charles W. Nash - (1864-1948), auto entrepreneur, Evar Swanson - Baseball player, Jason Wright - College basketball player (Eastern Illinois Panthers).
DeKalb County has a predicted average indoor radon screening level greater than 4 pCi/L (pico curies per liter) - Highest Potential Drinking water stations with addresses in DeKalb and their reported violations in the past:
DE KALB (Address: 1216 MARKET ST. Population served: 41,000, Groundwater):
Past monitoring violations:
2 regular monitoring violations
Population served: 75, Groundwater):
Past monitoring violations:
One regular monitoring violation
Population served: 35, Groundwater):
Past monitoring violations:
Follow-up Or Routine LCR Tap M/R - In OCT-01-2004, Contaminant: Lead and Copper Rule. Follow-up actions: St Public Notif requested (FEB-07-2005), St Violation/Reminder Notice (FEB-07-2005), St Public Notif received (APR-08-2005), St Compliance achieved (SEP-30-2005)
Drinking water stations with addresses in DeKalb that have no violations reported:
DE KALB UNIV DVL CORP (Population served: 1,050, Primary Water Source Type: Groundwater)
EVERGREEN MHP (Address: 507 E. TAYLOR ST. Population served: 300, Primary Water Source Type: Groundwater)
Average household size: This city:
2.4 peopleIllinois:
2.6 people
Percentage of family households: This city:
48.8%Whole state:
65.8%
Percentage of households with unmarried partners: This city:
7.3%Whole state:
6.3%
Likely homosexual households (counted as self-reported same-sex unmarried-partner households)
Lesbian couples: 0.4% of all households Gay men: 0.2% of all households
People in group quarters in DeKalb in 2010:
5,844 people in college/university student housing
363 people in nursing facilities/skilled-nursing facilities
67 people in emergency and transitional shelters (with sleeping facilities) for people experiencing homelessness
8 people in group homes intended for adults
7 people in other noninstitutional facilities
3 people in workers' group living quarters and job corps centers
People in group quarters in DeKalb in 2000:
6,889 people in college dormitories (includes college quarters off campus)
380 people in nursing homes
91 people in other noninstitutional group quarters
6 people in homes for the mentally retarded
6 people in religious group quarters
2 people in other nonhousehold living situations
Arena or stadium:
Convocation Center (Northern Illinois University). Northern Illinois University.
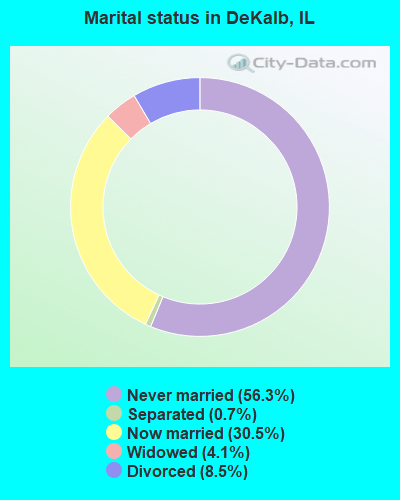
For population 15 years and over in DeKalb:
Never married: 56.3%Now married: 30.5%Separated: 0.7%Widowed: 4.1%Divorced: 8.5% For population 25 years and over in DeKalb:
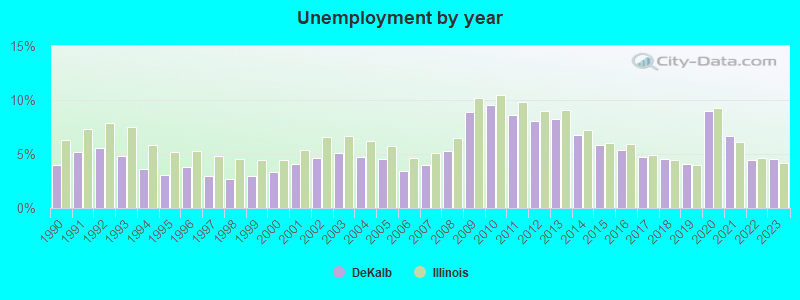
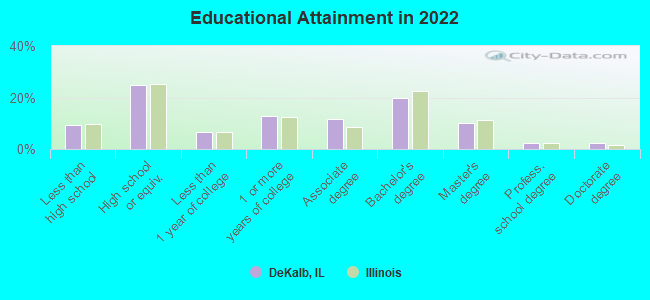
High school or higher: 91.3%Bachelor's degree or higher: 38.7%Graduate or professional degree: 15.7%Unemployed: 10.0%Mean travel time to work (commute): 20.7 minutes
Education Gini index (Inequality in education) Here:
12.5Illinois average:
12.5
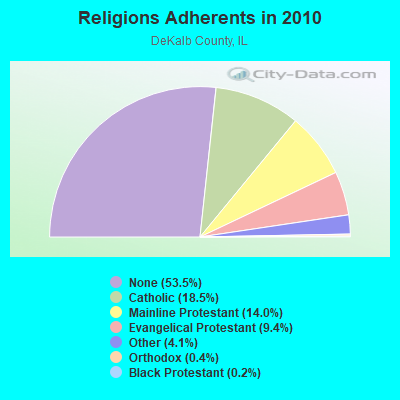
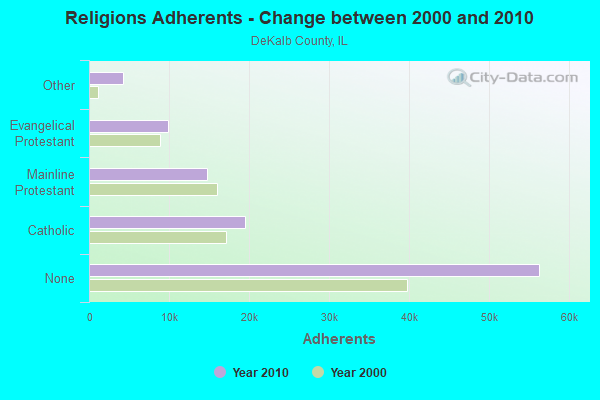
Religion statistics for DeKalb, IL (based on DeKalb County data)
Religion Adherents Congregations Catholic 19,447 6 Mainline Protestant 14,719 37 Evangelical Protestant 9,843 49 Other 4,267 12 Orthodox 400 1 Black Protestant 182 1 None 56,302 -
Source: Clifford Grammich, Kirk Hadaway, Richard Houseal, Dale E.Jones, Alexei Krindatch, Richie Stanley and Richard H.Taylor. 2012. 2010 U.S.Religion Census: Religious Congregations & Membership Study. Association of Statisticians of American Religious Bodies. Jones, Dale E., et al. 2002. Congregations and Membership in the United States 2000. Nashville, TN: Glenmary Research Center. Graphs represent county-level data
Food Environment Statistics: Number of grocery stores : 13DeKalb County :
1.24 / 10,000 pop.Illinois :
2.24 / 10,000 pop.
Number of supercenters and club stores : 1This county :
0.10 / 10,000 pop.Illinois :
0.08 / 10,000 pop.
Number of convenience stores (no gas) : 6This county :
0.57 / 10,000 pop.Illinois :
0.75 / 10,000 pop.
Number of convenience stores (with gas) : 32Here :
3.04 / 10,000 pop.Illinois :
2.61 / 10,000 pop.
Number of full-service restaurants : 67Here :
6.37 / 10,000 pop.Illinois :
6.86 / 10,000 pop.
Adult diabetes rate : This county :
7.0%State :
8.3%
Low-income preschool obesity rate : Health and Nutrition: Healthy diet rate : This city:
49.4%Illinois:
49.5%
Average overall health of teeth and gums : DeKalb:
49.9%Illinois:
47.2%
People feeling badly about themselves : People not drinking alcohol at all : DeKalb:
10.5%Illinois:
10.8%
Average hours sleeping at night : Overweight people : DeKalb:
27.5%Illinois:
33.4%
General health condition : This city:
59.7%Illinois:
56.4%
Average condition of hearing : This city:
82.5%State:
79.9%
More about Health and Nutrition of DeKalb, IL Residents
DeKalb government finances - Expenditure in 2021 (per resident):
Construction - Central Staff Services: $114,000 ($2.83)
Regular Highways: $40,000 ($0.99)Current Operations - Police Protection: $13,942,000 ($346.64)
General - Other: $12,503,000 ($310.87)Local Fire Protection: $12,280,000 ($305.32)Central Staff Services: $4,598,000 ($114.32)Regular Highways: $3,772,000 ($93.78)Water Utilities: $3,309,000 ($82.27)Libraries: $2,611,000 ($64.92)Solid Waste Management: $1,881,000 ($46.77)Air Transportation: $1,024,000 ($25.46)General - Interest on Debt: $5,934,000 ($147.54)
Other Capital Outlay - Water Utilities: $907,000 ($22.55)
Regular Highways: $659,000 ($16.38)Central Staff Services: $375,000 ($9.32)Police Protection: $39,000 ($0.97)Total Salaries and Wages: $20,419,000 ($507.68)
DeKalb government finances - Revenue in 2021 (per resident):
Charges - Other: $4,394,000 ($109.25)
Solid Waste Management: $1,913,000 ($47.56)Federal Intergovernmental - General Local Government Support: $11,705,000 ($291.02)
Other: $23,000 ($0.57)Local Intergovernmental - Other: $73,000 ($1.82)
Miscellaneous - General Revenue - Other: $848,000 ($21.08)
Fines and Forfeits: $462,000 ($11.49)Interest Earnings: $163,000 ($4.05)Revenue - Water Utilities: $6,081,000 ($151.19)
State Intergovernmental - General Local Government Support: $10,013,000 ($248.96)
Other: $2,524,000 ($62.75)Highways: $1,699,000 ($42.24)Tax - Property: $15,845,000 ($393.96)
General Sales and Gross Receipts: $5,851,000 ($145.47)Other Selective Sales: $3,960,000 ($98.46)Public Utilities Sales: $2,958,000 ($73.55)Other License: $795,000 ($19.77)
DeKalb government finances - Debt in 2021 (per resident):
Long Term Debt - Beginning Outstanding - Unspecified Public Purpose: $148,332,000 ($3688.02)
Outstanding Unspecified Public Purpose: $148,009,000 ($3679.99)Retired Unspecified Public Purpose: $10,966,000 ($272.65)Issue, Unspecified Public Purpose: $10,642,000 ($264.59)
DeKalb government finances - Cash and Securities in 2021 (per resident):
Other Funds - Cash and Securities: $32,664,000 ($812.13)
Businesses in DeKalb, IL
Name Count Name Count
7-Eleven 1 Long John Silver's 1 ALDI 1 Lowe's 1 AT&T 1 MasterBrand Cabinets 4 Advance Auto Parts 1 Maurices 1 Applebee's 1 McDonald's 2 AutoZone 1 Nike 4 Barnes & Noble 1 OfficeMax 1 Bath & Body Works 1 Old Navy 1 Baymont Inn 1 Panda Express 3 Bed Bath & Beyond 1 Panera Bread 1 Best Western 1 Papa John's Pizza 1 Blockbuster 1 Payless 1 Buffalo Wild Wings 1 Penske 1 Caribou Coffee 1 PetSmart 1 Carson Pirie Scott 1 Pier 1 Imports 1 Chipotle 1 Pizza Hut 1 Cricket Wireless 2 Qdoba Mexican Grill 1 Dairy Queen 1 RadioShack 1 Domino's Pizza 1 Ruby Tuesday 1 Famous Footwear 1 Rue21 1 FedEx 6 Sears 1 GNC 1 Sprint Nextel 1 GameStop 2 Starbucks 4 Goodwill 2 Steak 'n Shake 1 H&R Block 1 Subway 5 Hobby Lobby 1 Super 8 1 IHOP 1 T-Mobile 1 Jewel-Osco 1 T.J.Maxx 1 Jimmy John's 1 Taco Bell 1 Jones New York 1 Target 1 KFC 1 UPS 17 Kohl's 1 Verizon Wireless 1 La-Z-Boy 1 Walmart 1 Little Caesars Pizza 1 White Castle 1
Strongest AM radio stations in DeKalb:
WLBK (1360 AM; 1 kW; DEKALB, IL; Owner: WPW BROADCASTING, INC.)
WSCR (670 AM; 50 kW; CHICAGO, IL; Owner: INFINITY BROADCASTING OPERATIONS, INC.)
WGN (720 AM; 50 kW; CHICAGO, IL; Owner: WGN CONTINENTAL BROADCASTING CO.)
WBBM (780 AM; 50 kW; CHICAGO, IL; Owner: INFINITY BROADCASTING OPERATIONS, INC.)
WMVP (1000 AM; 50 kW; CHICAGO, IL; Owner: ABC, INC.)
WYLL (1160 AM; 50 kW; CHICAGO, IL; Owner: SCA LICENSE CORPORATION)
WLS (890 AM; 50 kW; CHICAGO, IL; Owner: WLS, INC.)
WTMJ (620 AM; 50 kW; MILWAUKEE, WI; Owner: JOURNAL BROADCAST CORPORATION)
WISN (1130 AM; 50 kW; MILWAUKEE, WI; Owner: CAPSTAR TX LIMITED PARTNERSHIP)
WAUR (930 AM; 4 kW; SANDWICH, IL; Owner: CHRISTIAN BROADCASTING SYSTEM, LTD.)
WNVR (1030 AM; 5 kW; VERNON HILLS, IL; Owner: POLNET COMMUNICATIONS, LTD.)
WVIV (1200 AM; 20 kW; CHICAGO, IL; Owner: WLXX-AM LICENSE CORP.)
WROK (1440 AM; 5 kW; ROCKFORD, IL; Owner: CUMULUS LICENSING CORP.)
Strongest FM radio stations in DeKalb:
WDEK (92.5 FM; DEKALB, IL; Owner: SPANISH BROADCASTING SYSTEM OF ILLINOIS, INC.)
WDKB (94.9 FM; DEKALB, IL; Owner: DEKALB COUNTY RADIO, LIMITED)
WYCH (106.3 FM; GENOA, IL; Owner: DONTRON, INC.)
WNIU (89.5 FM; DEKALB, IL; Owner: NORTHERN ILLINOIS UNIVERSITY)
WNIJ (90.5 FM; ROCKFORD, IL; Owner: NORTHERN ILLINOIS UNIVERSITY)
WSPY-FM (107.1 FM; PLANO, IL; Owner: NELSON ENTERPRISES, INC.)
WMKB (102.9 FM; EARLVILLE, IL; Owner: KM RADIO OF EARLVILLE, L.L.C.)
WERV-FM (95.9 FM; AURORA, IL; Owner: NM LICENSING, LLC)
WZSR (105.5 FM; WOODSTOCK, IL; Owner: NM LICENSING, LLC)
WGSL (91.1 FM; LOVES PARK, IL; Owner: CHRISTIAN LIFE CENTER SCHOOL)
WQFL (100.9 FM; ROCKFORD, IL; Owner: QUEST FOR LIFE, INC.)
WZCH (103.9 FM; DUNDEE, IL; Owner: ENTRAVISION HOLDINGS, LLC)
WZOK (97.5 FM; ROCKFORD, IL; Owner: CUMULUS LICENSING CORP.)
WRHL-FM (102.3 FM; ROCHELLE, IL; Owner: ROCHELLE BROADCASTING CO., INC.)
TV broadcast stations around DeKalb:
W34CK (Channel 34; ARLINGTON HEIGHTS, IL; Owner: FIRST UNITED, INC.)
WLS-TV (Channel 7; CHICAGO, IL; Owner: WLS TELEVISION, INC.)
WMAQ-TV (Channel 5; CHICAGO, IL; Owner: NBC SUBSIDIARY (WMAQ-TV), INC.)
WGBO-TV (Channel 66; JOLIET, IL; Owner: WGBO LICENSE PARTNERSHIP, G.P.)
WSPY-LP (Channel 30; PLANO, IL; Owner: WSPY-TV, INC.)
WWTO-TV (Channel 35; LASALLE, IL; Owner: TRINITY BROADCASTING NETWORK)
WPWR-TV (Channel 50; GARY, IN; Owner: FOX TELEVISION STATIONS, INC.)
WXFT (Channel 60; AURORA, IL; Owner: TELEFUTURA CHICAGO LLC)
WCIU-TV (Channel 26; CHICAGO, IL; Owner: WCIU-TV LIMITED PARTNERSHIP)
WCPX (Channel 38; CHICAGO, IL; Owner: PAXSON CHICAGO LICENSE, INC.)
WIFR (Channel 23; FREEPORT, IL; Owner: GRAY MIDAMERICA TV LICENSEE CORP.)
WTVO (Channel 17; ROCKFORD, IL; Owner: WINNEBAGO TELEVISION CORPORATION)
WFBN-LP (Channel 33; ROCKFORD, IL; Owner: WEIGEL BROADCASTING COMPANY)
W57DN (Channel 57; ELGIN, IL; Owner: TRINITY BROADCASTING NETWORK)
W24AJ (Channel 24; AURORA, IL; Owner: NELSON TV, INC.)
WQRF-TV (Channel 39; ROCKFORD, IL; Owner: QUORUM OF ROCKFORD LICENSE, LLC)
WQFL-CA (Channel 8; ROCKFORD, IL; Owner: FAMILY VALUES ORGANIZATION, INC.)
W54BE (Channel 54; SUGAR GROVE, IL; Owner: WAUBONSEE COMMUNITY COLLEGE)
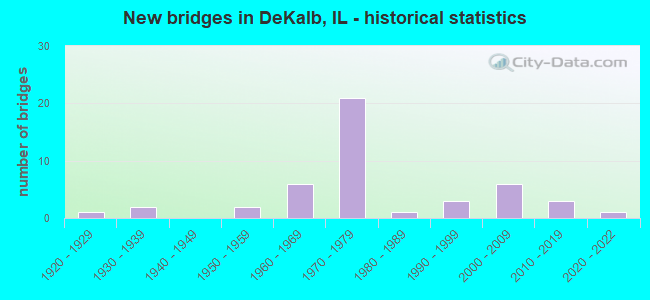
National Bridge Inventory (NBI) Statistics 46 Number of bridges364ft / 111m Total length $1,251,000 Total costs289,325 Total average daily traffic51,797 Total average daily truck traffic
New bridges - historical statistics
1 1920-1929 2 1930-1939 2 1950-1959 6 1960-1969 21 1970-1979 1 1980-1989 3 1990-1999 6 2000-2009 3 2010-2019 1 2020-2022
See full National Bridge Inventory statistics for DeKalb, IL
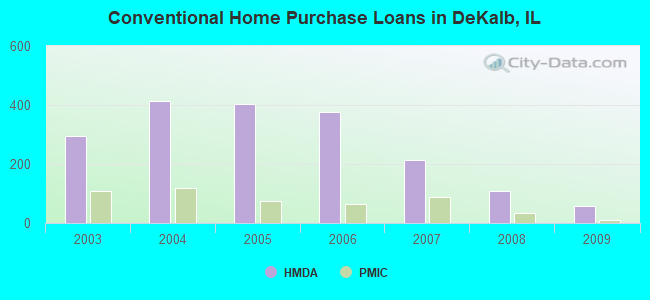
Home Mortgage Disclosure Act Aggregated Statistics For Year 2009(Based on 2 full and 6 partial tracts) A) FHA, FSA/RHS & VA B) Conventional C) Refinancings D) Home Improvement Loans E) Loans on Dwellings For 5+ Families F) Non-occupant Loans on G) Loans On Manufactured Number Average Value Number Average Value Number Average Value Number Average Value Number Average Value Number Average Value Number Average Value
LOANS ORIGINATED 52 $147,504 57 $132,332 439 $147,567 17 $70,472 5 $572,826 53 $132,790 8 $51,712 APPLICATIONS APPROVED, NOT ACCEPTED 4 $133,102 3 $170,017 42 $142,194 1 $26,480 0 $0 3 $149,817 0 $0 APPLICATIONS DENIED 13 $129,334 4 $87,618 117 $168,718 7 $43,209 1 $192,950 10 $99,063 0 $0 APPLICATIONS WITHDRAWN 5 $118,202 6 $121,103 76 $165,390 1 $51,230 0 $0 6 $121,208 0 $0 FILES CLOSED FOR INCOMPLETENESS 1 $299,600 2 $260,540 19 $161,366 0 $0 0 $0 2 $237,720 0 $0
Aggregated Statistics For Year 2008(Based on 2 full and 6 partial tracts) A) FHA, FSA/RHS & VA B) Conventional C) Refinancings D) Home Improvement Loans E) Loans on Dwellings For 5+ Families F) Non-occupant Loans on G) Loans On Manufactured Number Average Value Number Average Value Number Average Value Number Average Value Number Average Value Number Average Value Number Average Value
LOANS ORIGINATED 47 $166,942 109 $136,755 235 $141,078 31 $42,460 10 $1,388,226 42 $133,282 6 $60,415 APPLICATIONS APPROVED, NOT ACCEPTED 2 $199,855 14 $133,741 36 $151,604 1 $35,480 0 $0 5 $124,158 0 $0 APPLICATIONS DENIED 9 $203,206 12 $117,547 117 $158,487 12 $50,338 0 $0 6 $110,857 1 $92,650 APPLICATIONS WITHDRAWN 3 $162,980 7 $147,276 37 $166,631 2 $179,300 0 $0 5 $140,886 0 $0 FILES CLOSED FOR INCOMPLETENESS 1 $141,710 3 $127,713 4 $191,530 0 $0 0 $0 0 $0 0 $0
Aggregated Statistics For Year 2007(Based on 3 full and 6 partial tracts) A) FHA, FSA/RHS & VA B) Conventional C) Refinancings D) Home Improvement Loans E) Loans on Dwellings For 5+ Families F) Non-occupant Loans on G) Loans On Manufactured Number Average Value Number Average Value Number Average Value Number Average Value Number Average Value Number Average Value Number Average Value
LOANS ORIGINATED 17 $166,031 215 $138,529 203 $146,882 40 $59,443 11 $1,172,805 54 $125,671 6 $54,288 APPLICATIONS APPROVED, NOT ACCEPTED 0 $0 20 $143,816 35 $135,834 7 $101,130 0 $0 3 $71,270 0 $0 APPLICATIONS DENIED 3 $144,473 34 $124,066 127 $155,013 33 $58,891 0 $0 19 $137,733 1 $97,130 APPLICATIONS WITHDRAWN 5 $165,242 13 $155,680 56 $148,982 9 $116,548 0 $0 3 $104,500 0 $0 FILES CLOSED FOR INCOMPLETENESS 0 $0 4 $157,725 22 $155,878 2 $51,885 0 $0 3 $162,307 0 $0
Aggregated Statistics For Year 2006(Based on 3 full and 6 partial tracts) A) FHA, FSA/RHS & VA B) Conventional C) Refinancings D) Home Improvement Loans E) Loans on Dwellings For 5+ Families F) Non-occupant Loans on G) Loans On Manufactured Number Average Value Number Average Value Number Average Value Number Average Value Number Average Value Number Average Value Number Average Value
LOANS ORIGINATED 24 $175,266 377 $128,875 249 $128,910 31 $49,632 14 $706,253 78 $124,561 5 $37,194 APPLICATIONS APPROVED, NOT ACCEPTED 1 $218,740 46 $127,904 53 $126,392 5 $43,730 1 $1,771,050 10 $134,026 0 $0 APPLICATIONS DENIED 1 $176,160 70 $124,337 132 $146,109 14 $82,991 0 $0 23 $130,853 1 $26,730 APPLICATIONS WITHDRAWN 3 $130,073 35 $105,270 81 $148,119 3 $71,923 0 $0 12 $108,824 0 $0 FILES CLOSED FOR INCOMPLETENESS 0 $0 11 $128,529 22 $152,169 1 $156,910 0 $0 1 $125,500 0 $0
Aggregated Statistics For Year 2005(Based on 2 full and 6 partial tracts) A) FHA, FSA/RHS & VA B) Conventional C) Refinancings D) Home Improvement Loans E) Loans on Dwellings For 5+ Families F) Non-occupant Loans on G) Loans On Manufactured Number Average Value Number Average Value Number Average Value Number Average Value Number Average Value Number Average Value Number Average Value
LOANS ORIGINATED 26 $160,073 405 $127,013 303 $125,365 35 $41,760 17 $595,794 86 $118,725 7 $34,161 APPLICATIONS APPROVED, NOT ACCEPTED 3 $149,140 43 $131,390 50 $124,760 3 $23,383 1 $1,956,850 11 $129,810 0 $0 APPLICATIONS DENIED 7 $173,721 52 $108,648 143 $139,035 24 $41,992 0 $0 10 $121,673 1 $68,580 APPLICATIONS WITHDRAWN 2 $165,005 43 $123,658 106 $141,491 16 $121,949 0 $0 15 $105,715 0 $0 FILES CLOSED FOR INCOMPLETENESS 2 $162,490 10 $153,022 26 $151,890 2 $38,145 0 $0 1 $105,000 0 $0
Aggregated Statistics For Year 2004(Based on 3 full and 6 partial tracts) A) FHA, FSA/RHS & VA B) Conventional C) Refinancings D) Home Improvement Loans E) Loans on Dwellings For 5+ Families F) Non-occupant Loans on G) Loans On Manufactured Number Average Value Number Average Value Number Average Value Number Average Value Number Average Value Number Average Value Number Average Value
LOANS ORIGINATED 60 $156,574 412 $122,577 296 $117,030 27 $36,993 25 $382,966 79 $118,617 4 $68,225 APPLICATIONS APPROVED, NOT ACCEPTED 7 $168,667 43 $125,647 52 $127,472 5 $42,644 1 $275,000 6 $98,285 0 $0 APPLICATIONS DENIED 5 $161,252 28 $139,998 136 $126,892 25 $38,928 0 $0 10 $118,942 2 $30,330 APPLICATIONS WITHDRAWN 5 $124,984 41 $124,586 124 $134,104 4 $74,428 1 $335,600 12 $139,789 0 $0 FILES CLOSED FOR INCOMPLETENESS 1 $182,500 10 $130,015 17 $126,748 1 $170,170 0 $0 0 $0 0 $0
Aggregated Statistics For Year 2003(Based on 3 full and 6 partial tracts) A) FHA, FSA/RHS & VA B) Conventional C) Refinancings D) Home Improvement Loans E) Loans on Dwellings For 5+ Families F) Non-occupant Loans on Number Average Value Number Average Value Number Average Value Number Average Value Number Average Value Number Average Value
LOANS ORIGINATED 47 $139,898 296 $123,016 935 $110,822 21 $17,945 11 $1,208,368 111 $95,995 APPLICATIONS APPROVED, NOT ACCEPTED 4 $112,245 27 $126,413 82 $105,421 2 $16,830 1 $782,700 6 $85,325 APPLICATIONS DENIED 7 $160,667 30 $109,258 122 $116,148 7 $35,926 0 $0 10 $111,122 APPLICATIONS WITHDRAWN 3 $120,043 39 $128,394 137 $114,544 1 $60,660 0 $0 14 $117,350 FILES CLOSED FOR INCOMPLETENESS 2 $195,110 6 $136,248 15 $120,179 1 $25,960 0 $0 0 $0
Detailed HMDA statistics for the following Tracts:
0008.00
, 0009.00 , 0010.00 , 0011.00 , 0012.00 , 0013.00 , 0014.00 , 0015.00
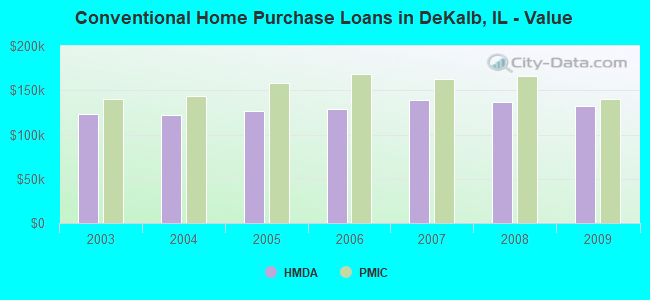
Private Mortgage Insurance Companies Aggregated Statistics For Year 2009(Based on 2 full and 6 partial tracts) A) Conventional B) Refinancings Number Average Value Number Average Value
LOANS ORIGINATED 10 $139,749 12 $165,223 APPLICATIONS APPROVED, NOT ACCEPTED 1 $250,810 5 $166,310 APPLICATIONS DENIED 1 $159,620 2 $195,735 APPLICATIONS WITHDRAWN 2 $151,085 2 $127,000 FILES CLOSED FOR INCOMPLETENESS 0 $0 0 $0
Aggregated Statistics For Year 2008(Based on 1 full and 6 partial tracts) A) Conventional B) Refinancings C) Non-occupant Loans on Number Average Value Number Average Value Number Average Value
LOANS ORIGINATED 33 $166,453 21 $169,395 4 $159,155 APPLICATIONS APPROVED, NOT ACCEPTED 10 $187,208 3 $193,777 1 $154,720 APPLICATIONS DENIED 8 $137,490 5 $146,788 3 $104,320 APPLICATIONS WITHDRAWN 2 $135,560 1 $122,760 0 $0 FILES CLOSED FOR INCOMPLETENESS 2 $141,010 1 $99,600 1 $119,770
Aggregated Statistics For Year 2007(Based on 1 full and 6 partial tracts) A) Conventional B) Refinancings C) Non-occupant Loans on Number Average Value Number Average Value Number Average Value
LOANS ORIGINATED 87 $163,204 29 $174,972 7 $134,459 APPLICATIONS APPROVED, NOT ACCEPTED 8 $171,425 7 $185,949 1 $123,580 APPLICATIONS DENIED 0 $0 0 $0 0 $0 APPLICATIONS WITHDRAWN 3 $160,063 1 $179,810 1 $84,200 FILES CLOSED FOR INCOMPLETENESS 0 $0 0 $0 0 $0
Aggregated Statistics For Year 2006(Based on 1 full and 6 partial tracts) A) Conventional B) Refinancings C) Non-occupant Loans on Number Average Value Number Average Value Number Average Value
LOANS ORIGINATED 65 $167,800 20 $162,006 5 $132,432 APPLICATIONS APPROVED, NOT ACCEPTED 10 $164,244 5 $189,570 1 $112,000 APPLICATIONS DENIED 1 $144,950 0 $0 0 $0 APPLICATIONS WITHDRAWN 6 $169,450 3 $181,043 2 $156,630 FILES CLOSED FOR INCOMPLETENESS 0 $0 0 $0 0 $0
Aggregated Statistics For Year 2005(Based on 1 full and 6 partial tracts) A) Conventional B) Refinancings C) Non-occupant Loans on Number Average Value Number Average Value Number Average Value
LOANS ORIGINATED 74 $157,822 21 $166,432 6 $134,935 APPLICATIONS APPROVED, NOT ACCEPTED 8 $149,822 6 $136,290 2 $88,495 APPLICATIONS DENIED 1 $115,350 1 $116,990 0 $0 APPLICATIONS WITHDRAWN 7 $148,000 1 $230,870 1 $122,230 FILES CLOSED FOR INCOMPLETENESS 0 $0 0 $0 0 $0
Aggregated Statistics For Year 2004(Based on 2 full and 6 partial tracts) A) Conventional B) Refinancings C) Non-occupant Loans on Number Average Value Number Average Value Number Average Value
LOANS ORIGINATED 118 $143,497 40 $145,873 6 $106,185 APPLICATIONS APPROVED, NOT ACCEPTED 14 $129,506 11 $145,089 6 $118,772 APPLICATIONS DENIED 1 $196,570 0 $0 0 $0 APPLICATIONS WITHDRAWN 10 $160,266 4 $121,360 1 $143,790 FILES CLOSED FOR INCOMPLETENESS 1 $176,820 0 $0 0 $0
Aggregated Statistics For Year 2003(Based on 2 full and 6 partial tracts) A) Conventional B) Refinancings C) Non-occupant Loans on Number Average Value Number Average Value Number Average Value
LOANS ORIGINATED 110 $139,677 88 $132,609 11 $119,355 APPLICATIONS APPROVED, NOT ACCEPTED 10 $142,984 9 $119,089 3 $56,687 APPLICATIONS DENIED 2 $96,500 0 $0 0 $0 APPLICATIONS WITHDRAWN 8 $140,585 9 $122,304 5 $120,042 FILES CLOSED FOR INCOMPLETENESS 0 $0 0 $0 0 $0
Detailed PMIC statistics for the following Tracts:
0008.00
, 0009.00 , 0010.00 , 0011.00 , 0012.00 , 0013.00 , 0014.00 , 0015.00 Fire-safe hotels and motels in DeKalb, Illinois:
Harbor Inn, 2675 Sycamore Rd, Dekalb, Illinois 60115 Phone: (815) 756-3552, Fax: (815) 756-8257
Baymont Inn & Suites Dekalb, 1314 W Lincoln Hwy, Dekalb, Illinois 60115 Phone: (815) 748-4800, Fax: (815) 756-5047
Hampton Inn - Dekalb Il, 663 Annie Glidden Rd, Dekalb, Illinois 60115 Phone: (815) 748-4323, Fax: (815) 748-4326
All 3 fire-safe hotels and motels in DeKalb, Illinois
Most common first names in DeKalb, IL among deceased individuals Name Count Lived (average)
John 155 75.8 years Mary 149 80.5 years William 121 76.8 years Robert 106 73.1 years Helen 103 82.1 years Ruth 102 84.0 years James 95 74.3 years Dorothy 78 81.7 years Margaret 77 81.3 years Charles 75 76.2 years
Most common last names in DeKalb, IL among deceased individuals Last name Count Lived (average)
Johnson 124 80.8 years Smith 67 80.8 years Nelson 53 79.7 years Anderson 52 77.2 years Miller 48 80.7 years Carlson 38 80.8 years Swanson 31 82.7 years Peterson 31 79.7 years Olson 27 76.1 years Davis 26 74.2 years
DeKalb compared to Illinois state average:
Median household income below state average. Median age significantly below state average. Renting percentage above state average. Length of stay since moving in significantly above state average. Number of college students above state average.
#24 on the list of "Top 101 cities where the highest percentage of females (15+ years) which never married (with at least 10,000 females in this group)"
#29 on the list of "Top 101 cities where the highest percentage of males (15+ years) which never married (with at least 10,000 males in this group)"
#99 on the list of "Top 101 cities with largest percentage of males in industries: management of companies and enterprises (population 5,000+)"
#7 on the list of "Top 101 counties with the largest number of people moving out compared to moving in (pop. 50,000+)"
#87 on the list of "Top 101 counties with the largest number of children under 18 without health insurance coverage in 2000 (pop. 50,000+)"
#94 on the list of "Top 101 counties with the largest number of people without health insurance coverage in 2000 (pop. 50,000+)"


 Recent articles from our blog. Our writers, many of them Ph.D. graduates or candidates, create easy-to-read articles on a wide variety of topics.

 (24.9 miles
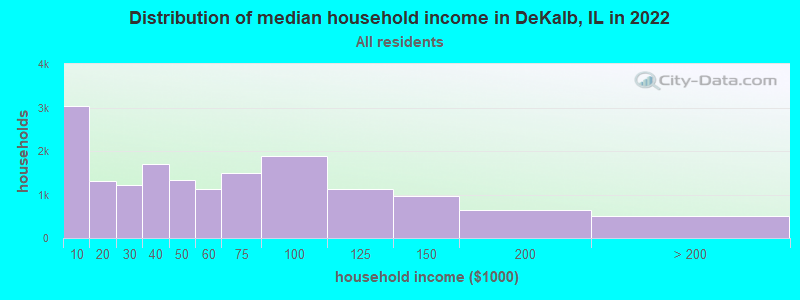

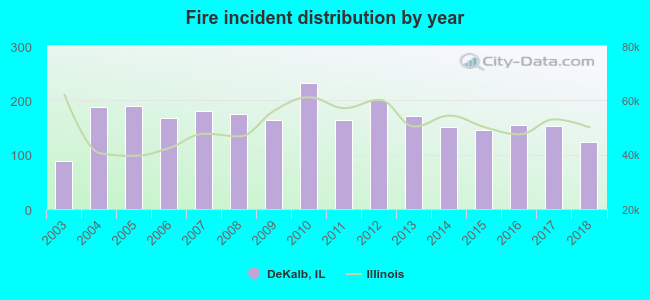 Based on the data from the years 2003 - 2018 the average number of fire incidents per year is 165. The highest number of fire incidents - 232 took place in 2010, and the least - 89 in 2003. The data has an increasing trend.
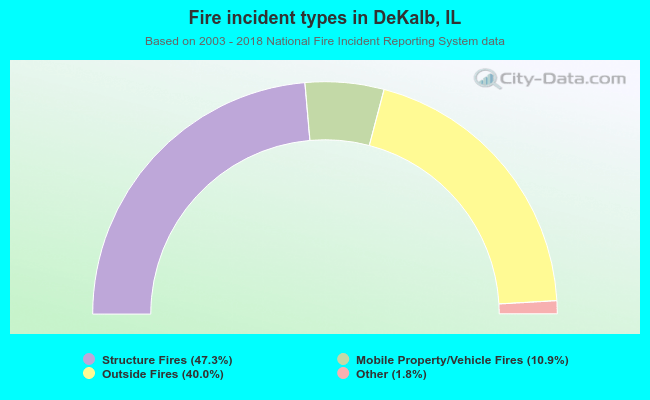 When looking into fire subcategories, the most incidents belonged to: Structure Fires (47.3%), and Outside Fires (40.0%).