Sycamore, Illinois Submit your own pictures of this city and show them to the world
OSM Map
General Map
Google Map
MSN Map
OSM Map
General Map
Google Map
MSN Map
OSM Map
General Map
Google Map
MSN Map
OSM Map
General Map
Google Map
MSN Map
Please wait while loading the map...
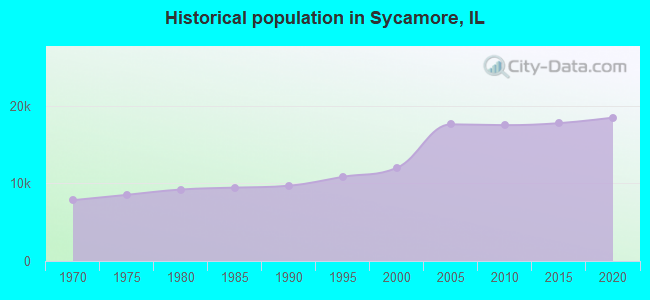
Population in 2022: 18,652 (99% urban, 1% rural). Population change since 2000: +55.2%Males: 8,636 Females: 10,016
March 2022 cost of living index in Sycamore: 99.0 (near average, U.S. average is 100) Percentage of residents living in poverty in 2022: 7.8%for White Non-Hispanic residents , 32.7% for Black residents , 2.8% for Hispanic or Latino residents , 1.4% for two or more races residents )
Profiles of local businesses
Business Search - 14 Million verified businesses
Data:
Median household income ($)
Median household income (% change since 2000)
Household income diversity
Ratio of average income to average house value (%)
Ratio of average income to average rent
Median household income ($) - White
Median household income ($) - Black or African American
Median household income ($) - Asian
Median household income ($) - Hispanic or Latino
Median household income ($) - American Indian and Alaska Native
Median household income ($) - Multirace
Median household income ($) - Other Race
Median household income for houses/condos with a mortgage ($)
Median household income for apartments without a mortgage ($)
Races - White alone (%)
Races - White alone (% change since 2000)
Races - Black alone (%)
Races - Black alone (% change since 2000)
Races - American Indian alone (%)
Races - American Indian alone (% change since 2000)
Races - Asian alone (%)
Races - Asian alone (% change since 2000)
Races - Hispanic (%)
Races - Hispanic (% change since 2000)
Races - Native Hawaiian and Other Pacific Islander alone (%)
Races - Native Hawaiian and Other Pacific Islander alone (% change since 2000)
Races - Two or more races (%)
Races - Two or more races (% change since 2000)
Races - Other race alone (%)
Races - Other race alone (% change since 2000)
Racial diversity
Unemployment (%)
Unemployment (% change since 2000)
Unemployment (%) - White
Unemployment (%) - Black or African American
Unemployment (%) - Asian
Unemployment (%) - Hispanic or Latino
Unemployment (%) - American Indian and Alaska Native
Unemployment (%) - Multirace
Unemployment (%) - Other Race
Population density (people per square mile)
Population - Males (%)
Population - Females (%)
Population - Males (%) - White
Population - Males (%) - Black or African American
Population - Males (%) - Asian
Population - Males (%) - Hispanic or Latino
Population - Males (%) - American Indian and Alaska Native
Population - Males (%) - Multirace
Population - Males (%) - Other Race
Population - Females (%) - White
Population - Females (%) - Black or African American
Population - Females (%) - Asian
Population - Females (%) - Hispanic or Latino
Population - Females (%) - American Indian and Alaska Native
Population - Females (%) - Multirace
Population - Females (%) - Other Race
Coronavirus confirmed cases (Apr 27, 2024)
Deaths caused by coronavirus (Apr 27, 2024)
Coronavirus confirmed cases (per 100k population) (Apr 27, 2024)
Deaths caused by coronavirus (per 100k population) (Apr 27, 2024)
Daily increase in number of cases (Apr 27, 2024)
Weekly increase in number of cases (Apr 27, 2024)
Cases doubled (in days) (Apr 27, 2024)
Hospitalized patients (Apr 18, 2022)
Negative test results (Apr 18, 2022)
Total test results (Apr 18, 2022)
COVID Vaccine doses distributed (per 100k population) (Sep 19, 2023)
COVID Vaccine doses administered (per 100k population) (Sep 19, 2023)
COVID Vaccine doses distributed (Sep 19, 2023)
COVID Vaccine doses administered (Sep 19, 2023)
Likely homosexual households (%)
Likely homosexual households (% change since 2000)
Likely homosexual households - Lesbian couples (%)
Likely homosexual households - Lesbian couples (% change since 2000)
Likely homosexual households - Gay men (%)
Likely homosexual households - Gay men (% change since 2000)
Cost of living index
Median gross rent ($)
Median contract rent ($)
Median monthly housing costs ($)
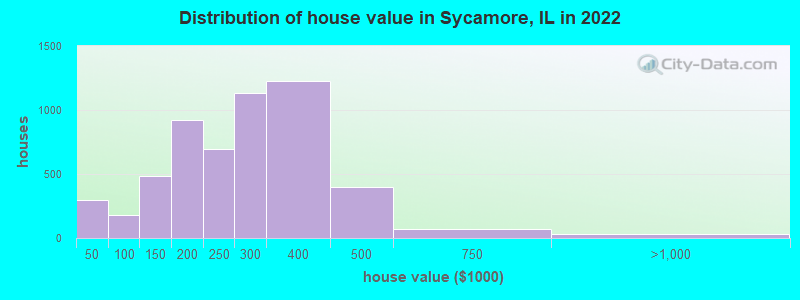
Median house or condo value ($)
Median house or condo value ($ change since 2000)
Mean house or condo value by units in structure - 1, detached ($)
Mean house or condo value by units in structure - 1, attached ($)
Mean house or condo value by units in structure - 2 ($)
Mean house or condo value by units in structure by units in structure - 3 or 4 ($)
Mean house or condo value by units in structure - 5 or more ($)
Mean house or condo value by units in structure - Boat, RV, van, etc. ($)
Mean house or condo value by units in structure - Mobile home ($)
Median house or condo value ($) - White
Median house or condo value ($) - Black or African American
Median house or condo value ($) - Asian
Median house or condo value ($) - Hispanic or Latino
Median house or condo value ($) - American Indian and Alaska Native
Median house or condo value ($) - Multirace
Median house or condo value ($) - Other Race
Median resident age
Resident age diversity
Median resident age - Males
Median resident age - Females
Median resident age - White
Median resident age - Black or African American
Median resident age - Asian
Median resident age - Hispanic or Latino
Median resident age - American Indian and Alaska Native
Median resident age - Multirace
Median resident age - Other Race
Median resident age - Males - White
Median resident age - Males - Black or African American
Median resident age - Males - Asian
Median resident age - Males - Hispanic or Latino
Median resident age - Males - American Indian and Alaska Native
Median resident age - Males - Multirace
Median resident age - Males - Other Race
Median resident age - Females - White
Median resident age - Females - Black or African American
Median resident age - Females - Asian
Median resident age - Females - Hispanic or Latino
Median resident age - Females - American Indian and Alaska Native
Median resident age - Females - Multirace
Median resident age - Females - Other Race
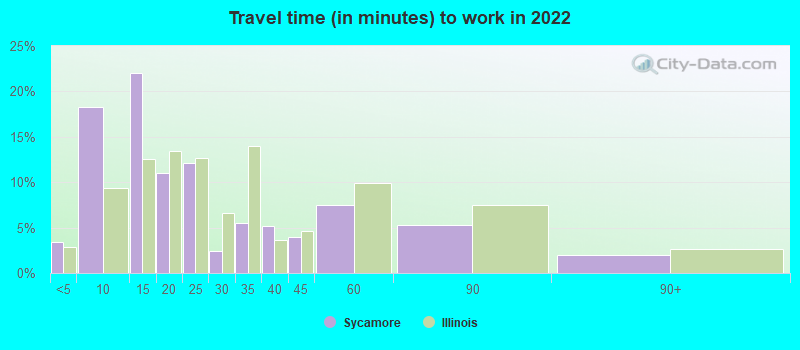
Commute - mean travel time to work (minutes)
Travel time to work - Less than 5 minutes (%)
Travel time to work - Less than 5 minutes (% change since 2000)
Travel time to work - 5 to 9 minutes (%)
Travel time to work - 5 to 9 minutes (% change since 2000)
Travel time to work - 10 to 19 minutes (%)
Travel time to work - 10 to 19 minutes (% change since 2000)
Travel time to work - 20 to 29 minutes (%)
Travel time to work - 20 to 29 minutes (% change since 2000)
Travel time to work - 30 to 39 minutes (%)
Travel time to work - 30 to 39 minutes (% change since 2000)
Travel time to work - 40 to 59 minutes (%)
Travel time to work - 40 to 59 minutes (% change since 2000)
Travel time to work - 60 to 89 minutes (%)
Travel time to work - 60 to 89 minutes (% change since 2000)
Travel time to work - 90 or more minutes (%)
Travel time to work - 90 or more minutes (% change since 2000)
Marital status - Never married (%)
Marital status - Now married (%)
Marital status - Separated (%)
Marital status - Widowed (%)
Marital status - Divorced (%)
Median family income ($)
Median family income (% change since 2000)
Median non-family income ($)
Median non-family income (% change since 2000)
Median per capita income ($)
Median per capita income (% change since 2000)
Median family income ($) - White
Median family income ($) - Black or African American
Median family income ($) - Asian
Median family income ($) - Hispanic or Latino
Median family income ($) - American Indian and Alaska Native
Median family income ($) - Multirace
Median family income ($) - Other Race
Median year house/condo built
Median year apartment built
Year house built - Built 2005 or later (%)
Year house built - Built 2000 to 2004 (%)
Year house built - Built 1990 to 1999 (%)
Year house built - Built 1980 to 1989 (%)
Year house built - Built 1970 to 1979 (%)
Year house built - Built 1960 to 1969 (%)
Year house built - Built 1950 to 1959 (%)
Year house built - Built 1940 to 1949 (%)
Year house built - Built 1939 or earlier (%)
Average household size
Household density (households per square mile)
Average household size - White
Average household size - Black or African American
Average household size - Asian
Average household size - Hispanic or Latino
Average household size - American Indian and Alaska Native
Average household size - Multirace
Average household size - Other Race
Occupied housing units (%)
Vacant housing units (%)
Owner occupied housing units (%)
Renter occupied housing units (%)
Vacancy status - For rent (%)
Vacancy status - For sale only (%)
Vacancy status - Rented or sold, not occupied (%)
Vacancy status - For seasonal, recreational, or occasional use (%)
Vacancy status - For migrant workers (%)
Vacancy status - Other vacant (%)
Residents with income below the poverty level (%)
Residents with income below 50% of the poverty level (%)
Children below poverty level (%)
Poor families by family type - Married-couple family (%)
Poor families by family type - Male, no wife present (%)
Poor families by family type - Female, no husband present (%)
Poverty status for native-born residents (%)
Poverty status for foreign-born residents (%)
Poverty among high school graduates not in families (%)
Poverty among people who did not graduate high school not in families (%)
Residents with income below the poverty level (%) - White
Residents with income below the poverty level (%) - Black or African American
Residents with income below the poverty level (%) - Asian
Residents with income below the poverty level (%) - Hispanic or Latino
Residents with income below the poverty level (%) - American Indian and Alaska Native
Residents with income below the poverty level (%) - Multirace
Residents with income below the poverty level (%) - Other Race
Air pollution - Air Quality Index (AQI)
Air pollution - CO
Air pollution - NO2
Air pollution - SO2
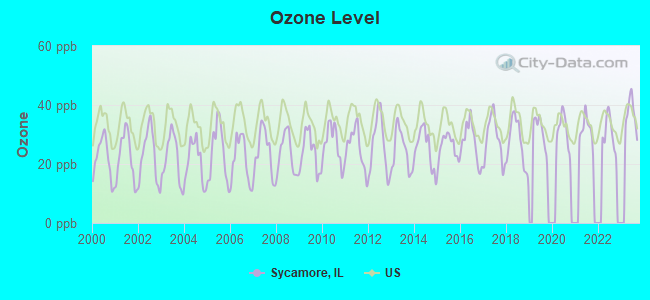
Air pollution - Ozone
Air pollution - PM10
Air pollution - PM25
Air pollution - Pb
Crime - Murders per 100,000 population
Crime - Rapes per 100,000 population
Crime - Robberies per 100,000 population
Crime - Assaults per 100,000 population
Crime - Burglaries per 100,000 population
Crime - Thefts per 100,000 population
Crime - Auto thefts per 100,000 population
Crime - Arson per 100,000 population
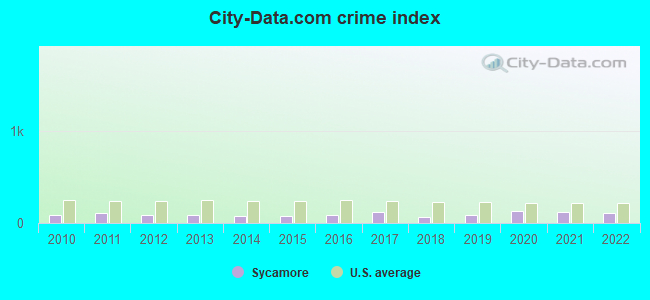
Crime - City-data.com crime index
Crime - Violent crime index
Crime - Property crime index
Crime - Murders per 100,000 population (5 year average)
Crime - Rapes per 100,000 population (5 year average)
Crime - Robberies per 100,000 population (5 year average)
Crime - Assaults per 100,000 population (5 year average)
Crime - Burglaries per 100,000 population (5 year average)
Crime - Thefts per 100,000 population (5 year average)
Crime - Auto thefts per 100,000 population (5 year average)
Crime - Arson per 100,000 population (5 year average)
Crime - City-data.com crime index (5 year average)
Crime - Violent crime index (5 year average)
Crime - Property crime index (5 year average)
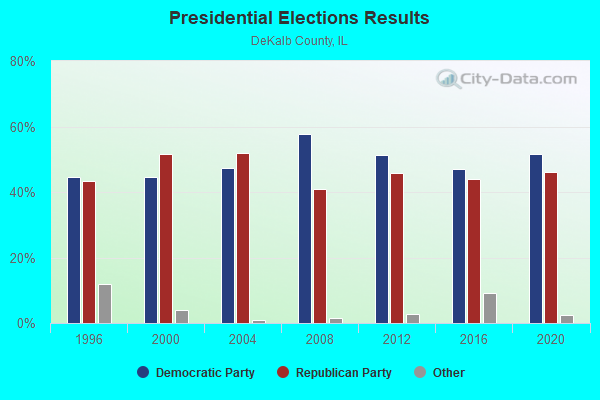
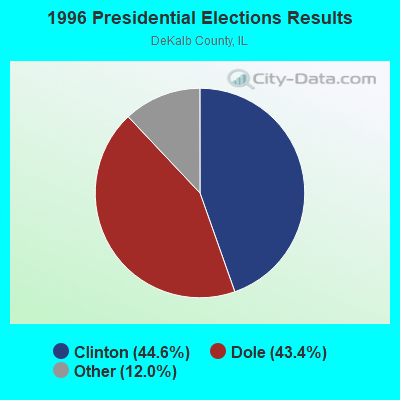
1996 Presidential Elections Results (%) - Democratic Party (Clinton)
1996 Presidential Elections Results (%) - Republican Party (Dole)
1996 Presidential Elections Results (%) - Other
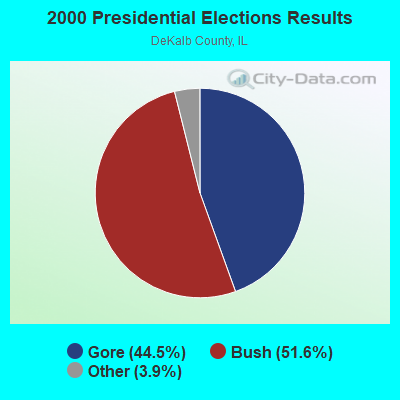
2000 Presidential Elections Results (%) - Democratic Party (Gore)
2000 Presidential Elections Results (%) - Republican Party (Bush)
2000 Presidential Elections Results (%) - Other
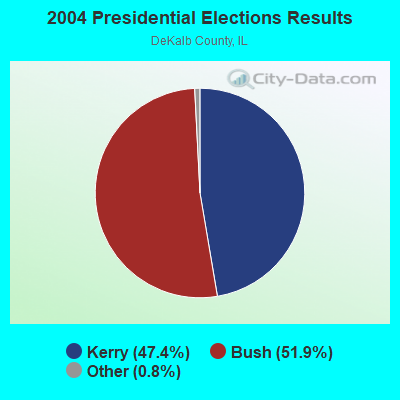
2004 Presidential Elections Results (%) - Democratic Party (Kerry)
2004 Presidential Elections Results (%) - Republican Party (Bush)
2004 Presidential Elections Results (%) - Other
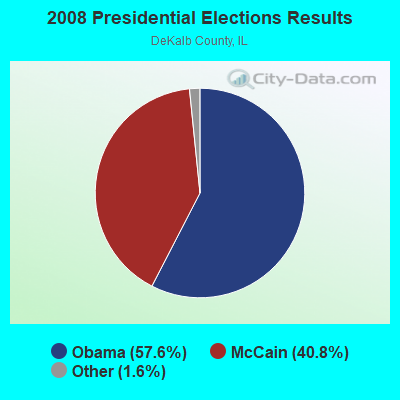
2008 Presidential Elections Results (%) - Democratic Party (Obama)
2008 Presidential Elections Results (%) - Republican Party (McCain)
2008 Presidential Elections Results (%) - Other
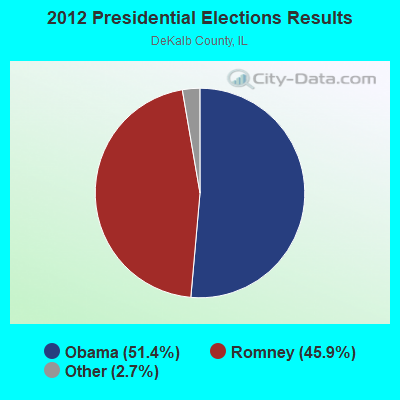
2012 Presidential Elections Results (%) - Democratic Party (Obama)
2012 Presidential Elections Results (%) - Republican Party (Romney)
2012 Presidential Elections Results (%) - Other
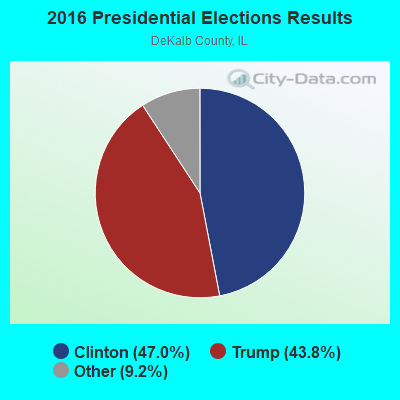
2016 Presidential Elections Results (%) - Democratic Party (Clinton)
2016 Presidential Elections Results (%) - Republican Party (Trump)
2016 Presidential Elections Results (%) - Other
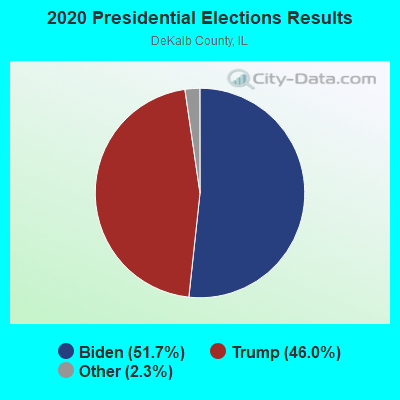
2020 Presidential Elections Results (%) - Democratic Party (Biden)
2020 Presidential Elections Results (%) - Republican Party (Trump)
2020 Presidential Elections Results (%) - Other
Ancestries Reported - Arab (%)
Ancestries Reported - Czech (%)
Ancestries Reported - Danish (%)
Ancestries Reported - Dutch (%)
Ancestries Reported - English (%)
Ancestries Reported - French (%)
Ancestries Reported - French Canadian (%)
Ancestries Reported - German (%)
Ancestries Reported - Greek (%)
Ancestries Reported - Hungarian (%)
Ancestries Reported - Irish (%)
Ancestries Reported - Italian (%)
Ancestries Reported - Lithuanian (%)
Ancestries Reported - Norwegian (%)
Ancestries Reported - Polish (%)
Ancestries Reported - Portuguese (%)
Ancestries Reported - Russian (%)
Ancestries Reported - Scotch-Irish (%)
Ancestries Reported - Scottish (%)
Ancestries Reported - Slovak (%)
Ancestries Reported - Subsaharan African (%)
Ancestries Reported - Swedish (%)
Ancestries Reported - Swiss (%)
Ancestries Reported - Ukrainian (%)
Ancestries Reported - United States (%)
Ancestries Reported - Welsh (%)
Ancestries Reported - West Indian (%)
Ancestries Reported - Other (%)
Educational Attainment - No schooling completed (%)
Educational Attainment - Less than high school (%)
Educational Attainment - High school or equivalent (%)
Educational Attainment - Less than 1 year of college (%)
Educational Attainment - 1 or more years of college (%)
Educational Attainment - Associate degree (%)
Educational Attainment - Bachelor's degree (%)
Educational Attainment - Master's degree (%)
Educational Attainment - Professional school degree (%)
Educational Attainment - Doctorate degree (%)
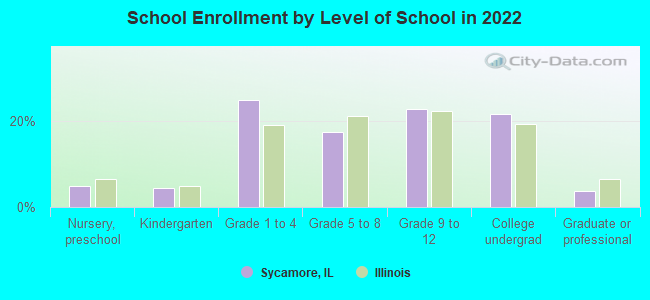
School Enrollment - Nursery, preschool (%)
School Enrollment - Kindergarten (%)
School Enrollment - Grade 1 to 4 (%)
School Enrollment - Grade 5 to 8 (%)
School Enrollment - Grade 9 to 12 (%)
School Enrollment - College undergrad (%)
School Enrollment - Graduate or professional (%)
School Enrollment - Not enrolled in school (%)
School enrollment - Public schools (%)
School enrollment - Private schools (%)
School enrollment - Not enrolled (%)
Median number of rooms in houses and condos
Median number of rooms in apartments
Housing units lacking complete plumbing facilities (%)
Housing units lacking complete kitchen facilities (%)
Density of houses
Urban houses (%)
Rural houses (%)
Households with people 60 years and over (%)
Households with people 65 years and over (%)
Households with people 75 years and over (%)
Households with one or more nonrelatives (%)
Households with no nonrelatives (%)
Population in households (%)
Family households (%)
Nonfamily households (%)
Population in families (%)
Family households with own children (%)
Median number of bedrooms in owner occupied houses
Mean number of bedrooms in owner occupied houses
Median number of bedrooms in renter occupied houses
Mean number of bedrooms in renter occupied houses
Median number of vehichles in owner occupied houses
Mean number of vehichles in owner occupied houses
Median number of vehichles in renter occupied houses
Mean number of vehichles in renter occupied houses
Mortgage status - with mortgage (%)
Mortgage status - with second mortgage (%)
Mortgage status - with home equity loan (%)
Mortgage status - with both second mortgage and home equity loan (%)
Mortgage status - without a mortgage (%)
Average family size
Average family size - White
Average family size - Black or African American
Average family size - Asian
Average family size - Hispanic or Latino
Average family size - American Indian and Alaska Native
Average family size - Multirace
Average family size - Other Race
Geographical mobility - Same house 1 year ago (%)
Geographical mobility - Moved within same county (%)
Geographical mobility - Moved from different county within same state (%)
Geographical mobility - Moved from different state (%)
Geographical mobility - Moved from abroad (%)
Place of birth - Born in state of residence (%)
Place of birth - Born in other state (%)
Place of birth - Native, outside of US (%)
Place of birth - Foreign born (%)
Housing units in structures - 1, detached (%)
Housing units in structures - 1, attached (%)
Housing units in structures - 2 (%)
Housing units in structures - 3 or 4 (%)
Housing units in structures - 5 to 9 (%)
Housing units in structures - 10 to 19 (%)
Housing units in structures - 20 to 49 (%)
Housing units in structures - 50 or more (%)
Housing units in structures - Mobile home (%)
Housing units in structures - Boat, RV, van, etc. (%)
House/condo owner moved in on average (years ago)
Renter moved in on average (years ago)
Year householder moved into unit - Moved in 1999 to March 2000 (%)
Year householder moved into unit - Moved in 1995 to 1998 (%)
Year householder moved into unit - Moved in 1990 to 1994 (%)
Year householder moved into unit - Moved in 1980 to 1989 (%)
Year householder moved into unit - Moved in 1970 to 1979 (%)
Year householder moved into unit - Moved in 1969 or earlier (%)
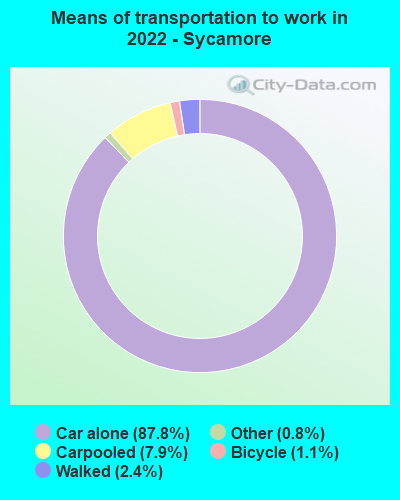
Means of transportation to work - Drove car alone (%)
Means of transportation to work - Carpooled (%)
Means of transportation to work - Public transportation (%)
Means of transportation to work - Bus or trolley bus (%)
Means of transportation to work - Streetcar or trolley car (%)
Means of transportation to work - Subway or elevated (%)
Means of transportation to work - Railroad (%)
Means of transportation to work - Ferryboat (%)
Means of transportation to work - Taxicab (%)
Means of transportation to work - Motorcycle (%)
Means of transportation to work - Bicycle (%)
Means of transportation to work - Walked (%)
Means of transportation to work - Other means (%)
Working at home (%)
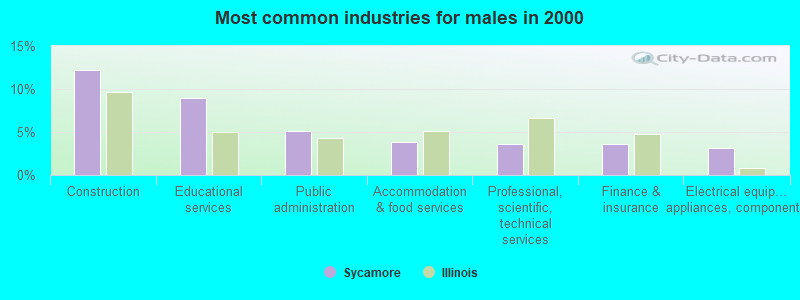
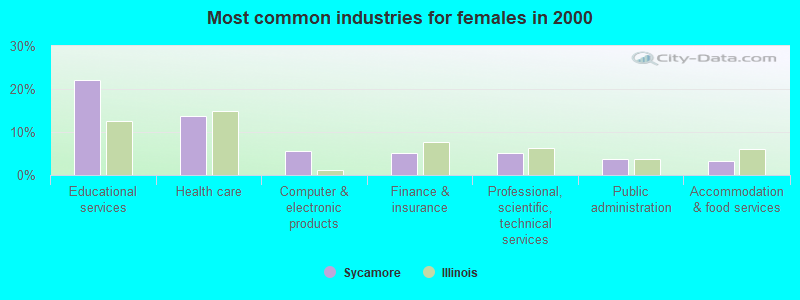
Industry diversity
Most Common Industries - Agriculture, forestry, fishing and hunting, and mining (%)
Most Common Industries - Agriculture, forestry, fishing and hunting (%)
Most Common Industries - Mining, quarrying, and oil and gas extraction (%)
Most Common Industries - Construction (%)
Most Common Industries - Manufacturing (%)
Most Common Industries - Wholesale trade (%)
Most Common Industries - Retail trade (%)
Most Common Industries - Transportation and warehousing, and utilities (%)
Most Common Industries - Transportation and warehousing (%)
Most Common Industries - Utilities (%)
Most Common Industries - Information (%)
Most Common Industries - Finance and insurance, and real estate and rental and leasing (%)
Most Common Industries - Finance and insurance (%)
Most Common Industries - Real estate and rental and leasing (%)
Most Common Industries - Professional, scientific, and management, and administrative and waste management services (%)
Most Common Industries - Professional, scientific, and technical services (%)
Most Common Industries - Management of companies and enterprises (%)
Most Common Industries - Administrative and support and waste management services (%)
Most Common Industries - Educational services, and health care and social assistance (%)
Most Common Industries - Educational services (%)
Most Common Industries - Health care and social assistance (%)
Most Common Industries - Arts, entertainment, and recreation, and accommodation and food services (%)
Most Common Industries - Arts, entertainment, and recreation (%)
Most Common Industries - Accommodation and food services (%)
Most Common Industries - Other services, except public administration (%)
Most Common Industries - Public administration (%)
Occupation diversity
Most Common Occupations - Management, business, science, and arts occupations (%)
Most Common Occupations - Management, business, and financial occupations (%)
Most Common Occupations - Management occupations (%)
Most Common Occupations - Business and financial operations occupations (%)
Most Common Occupations - Computer, engineering, and science occupations (%)
Most Common Occupations - Computer and mathematical occupations (%)
Most Common Occupations - Architecture and engineering occupations (%)
Most Common Occupations - Life, physical, and social science occupations (%)
Most Common Occupations - Education, legal, community service, arts, and media occupations (%)
Most Common Occupations - Community and social service occupations (%)
Most Common Occupations - Legal occupations (%)
Most Common Occupations - Education, training, and library occupations (%)
Most Common Occupations - Arts, design, entertainment, sports, and media occupations (%)
Most Common Occupations - Healthcare practitioners and technical occupations (%)
Most Common Occupations - Health diagnosing and treating practitioners and other technical occupations (%)
Most Common Occupations - Health technologists and technicians (%)
Most Common Occupations - Service occupations (%)
Most Common Occupations - Healthcare support occupations (%)
Most Common Occupations - Protective service occupations (%)
Most Common Occupations - Fire fighting and prevention, and other protective service workers including supervisors (%)
Most Common Occupations - Law enforcement workers including supervisors (%)
Most Common Occupations - Food preparation and serving related occupations (%)
Most Common Occupations - Building and grounds cleaning and maintenance occupations (%)
Most Common Occupations - Personal care and service occupations (%)
Most Common Occupations - Sales and office occupations (%)
Most Common Occupations - Sales and related occupations (%)
Most Common Occupations - Office and administrative support occupations (%)
Most Common Occupations - Natural resources, construction, and maintenance occupations (%)
Most Common Occupations - Farming, fishing, and forestry occupations (%)
Most Common Occupations - Construction and extraction occupations (%)
Most Common Occupations - Installation, maintenance, and repair occupations (%)
Most Common Occupations - Production, transportation, and material moving occupations (%)
Most Common Occupations - Production occupations (%)
Most Common Occupations - Transportation occupations (%)
Most Common Occupations - Material moving occupations (%)
People in Group quarters - Institutionalized population (%)
People in Group quarters - Correctional institutions (%)
People in Group quarters - Federal prisons and detention centers (%)
People in Group quarters - Halfway houses (%)
People in Group quarters - Local jails and other confinement facilities (including police lockups) (%)
People in Group quarters - Military disciplinary barracks (%)
People in Group quarters - State prisons (%)
People in Group quarters - Other types of correctional institutions (%)
People in Group quarters - Nursing homes (%)
People in Group quarters - Hospitals/wards, hospices, and schools for the handicapped (%)
People in Group quarters - Hospitals/wards and hospices for chronically ill (%)
People in Group quarters - Hospices or homes for chronically ill (%)
People in Group quarters - Military hospitals or wards for chronically ill (%)
People in Group quarters - Other hospitals or wards for chronically ill (%)
People in Group quarters - Hospitals or wards for drug/alcohol abuse (%)
People in Group quarters - Mental (Psychiatric) hospitals or wards (%)
People in Group quarters - Schools, hospitals, or wards for the mentally retarded (%)
People in Group quarters - Schools, hospitals, or wards for the physically handicapped (%)
People in Group quarters - Institutions for the deaf (%)
People in Group quarters - Institutions for the blind (%)
People in Group quarters - Orthopedic wards and institutions for the physically handicapped (%)
People in Group quarters - Wards in general hospitals for patients who have no usual home elsewhere (%)
People in Group quarters - Wards in military hospitals for patients who have no usual home elsewhere (%)
People in Group quarters - Juvenile institutions (%)
People in Group quarters - Long-term care (%)
People in Group quarters - Homes for abused, dependent, and neglected children (%)
People in Group quarters - Residential treatment centers for emotionally disturbed children (%)
People in Group quarters - Training schools for juvenile delinquents (%)
People in Group quarters - Short-term care, detention or diagnostic centers for delinquent children (%)
People in Group quarters - Type of juvenile institution unknown (%)
People in Group quarters - Noninstitutionalized population (%)
People in Group quarters - College dormitories (includes college quarters off campus) (%)
People in Group quarters - Military quarters (%)
People in Group quarters - On base (%)
People in Group quarters - Barracks, unaccompanied personnel housing (UPH), (Enlisted/Officer), ;and similar group living quarters for military personnel (%)
People in Group quarters - Transient quarters for temporary residents (%)
People in Group quarters - Military ships (%)
People in Group quarters - Group homes (%)
People in Group quarters - Homes or halfway houses for drug/alcohol abuse (%)
People in Group quarters - Homes for the mentally ill (%)
People in Group quarters - Homes for the mentally retarded (%)
People in Group quarters - Homes for the physically handicapped (%)
People in Group quarters - Other group homes (%)
People in Group quarters - Religious group quarters (%)
People in Group quarters - Dormitories (%)
People in Group quarters - Agriculture workers' dormitories on farms (%)
People in Group quarters - Job Corps and vocational training facilities (%)
People in Group quarters - Other workers' dormitories (%)
People in Group quarters - Crews of maritime vessels (%)
People in Group quarters - Other nonhousehold living situations (%)
People in Group quarters - Other noninstitutional group quarters (%)
Residents speaking English at home (%)
Residents speaking English at home - Born in the United States (%)
Residents speaking English at home - Native, born elsewhere (%)
Residents speaking English at home - Foreign born (%)
Residents speaking Spanish at home (%)
Residents speaking Spanish at home - Born in the United States (%)
Residents speaking Spanish at home - Native, born elsewhere (%)
Residents speaking Spanish at home - Foreign born (%)
Residents speaking other language at home (%)
Residents speaking other language at home - Born in the United States (%)
Residents speaking other language at home - Native, born elsewhere (%)
Residents speaking other language at home - Foreign born (%)
Class of Workers - Employee of private company (%)
Class of Workers - Self-employed in own incorporated business (%)
Class of Workers - Private not-for-profit wage and salary workers (%)
Class of Workers - Local government workers (%)
Class of Workers - State government workers (%)
Class of Workers - Federal government workers (%)
Class of Workers - Self-employed workers in own not incorporated business and Unpaid family workers (%)
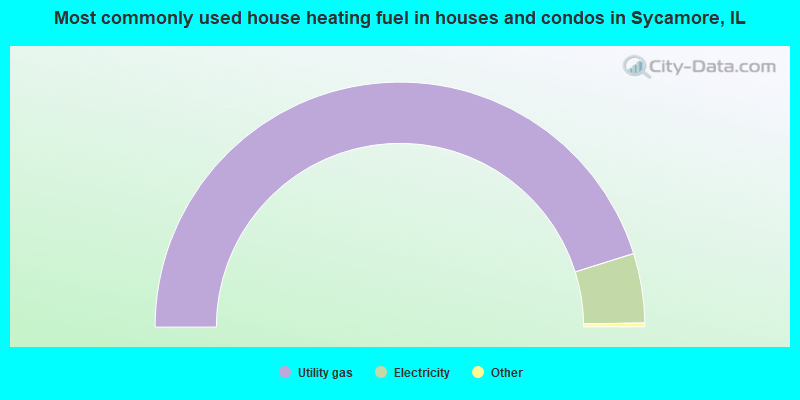
House heating fuel used in houses and condos - Utility gas (%)
House heating fuel used in houses and condos - Bottled, tank, or LP gas (%)
House heating fuel used in houses and condos - Electricity (%)
House heating fuel used in houses and condos - Fuel oil, kerosene, etc. (%)
House heating fuel used in houses and condos - Coal or coke (%)
House heating fuel used in houses and condos - Wood (%)
House heating fuel used in houses and condos - Solar energy (%)
House heating fuel used in houses and condos - Other fuel (%)
House heating fuel used in houses and condos - No fuel used (%)
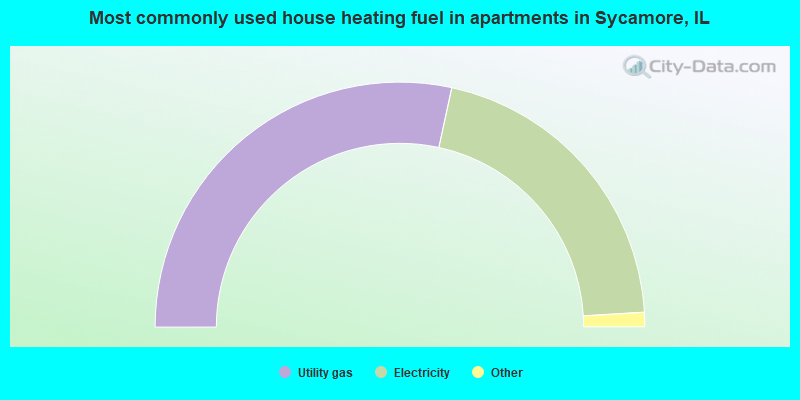
House heating fuel used in apartments - Utility gas (%)
House heating fuel used in apartments - Bottled, tank, or LP gas (%)
House heating fuel used in apartments - Electricity (%)
House heating fuel used in apartments - Fuel oil, kerosene, etc. (%)
House heating fuel used in apartments - Coal or coke (%)
House heating fuel used in apartments - Wood (%)
House heating fuel used in apartments - Solar energy (%)
House heating fuel used in apartments - Other fuel (%)
House heating fuel used in apartments - No fuel used (%)
Armed forces status - In Armed Forces (%)
Armed forces status - Civilian (%)
Armed forces status - Civilian - Veteran (%)
Armed forces status - Civilian - Nonveteran (%)
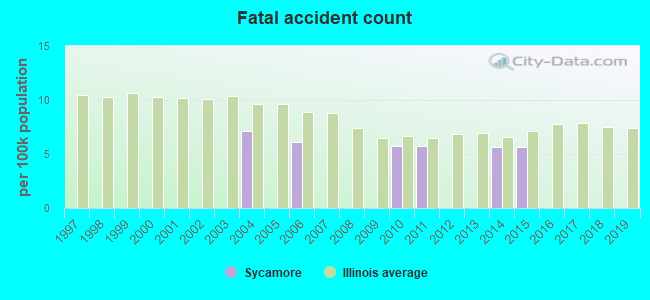
Fatal accidents locations in years 2005-2021
Fatal accidents locations in 2005
Fatal accidents locations in 2006
Fatal accidents locations in 2007
Fatal accidents locations in 2008
Fatal accidents locations in 2009
Fatal accidents locations in 2010
Fatal accidents locations in 2011
Fatal accidents locations in 2012
Fatal accidents locations in 2013
Fatal accidents locations in 2014
Fatal accidents locations in 2015
Fatal accidents locations in 2016
Fatal accidents locations in 2017
Fatal accidents locations in 2018
Fatal accidents locations in 2019
Fatal accidents locations in 2020
Fatal accidents locations in 2021
Alcohol use - People drinking some alcohol every month (%)
Alcohol use - People not drinking at all (%)
Alcohol use - Average days/month drinking alcohol
Alcohol use - Average drinks/week
Alcohol use - Average days/year people drink much
Audiometry - Average condition of hearing (%)
Audiometry - People that can hear a whisper from across a quiet room (%)
Audiometry - People that can hear normal voice from across a quiet room (%)
Audiometry - Ears ringing, roaring, buzzing (%)
Audiometry - Had a job exposure to loud noise (%)
Audiometry - Had off-work exposure to loud noise (%)
Blood Pressure & Cholesterol - Has high blood pressure (%)
Blood Pressure & Cholesterol - Checking blood pressure at home (%)
Blood Pressure & Cholesterol - Frequently checking blood cholesterol (%)
Blood Pressure & Cholesterol - Has high cholesterol level (%)
Consumer Behavior - Money monthly spent on food at supermarket/grocery store
Consumer Behavior - Money monthly spent on food at other stores
Consumer Behavior - Money monthly spent on eating out
Consumer Behavior - Money monthly spent on carryout/delivered foods
Consumer Behavior - Income spent on food at supermarket/grocery store (%)
Consumer Behavior - Income spent on food at other stores (%)
Consumer Behavior - Income spent on eating out (%)
Consumer Behavior - Income spent on carryout/delivered foods (%)
Current Health Status - General health condition (%)
Current Health Status - Blood donors (%)
Current Health Status - Has blood ever tested for HIV virus (%)
Current Health Status - Left-handed people (%)
Dermatology - People using sunscreen (%)
Diabetes - Diabetics (%)
Diabetes - Had a blood test for high blood sugar (%)
Diabetes - People taking insulin (%)
Diet Behavior & Nutrition - Diet health (%)
Diet Behavior & Nutrition - Milk product consumption (# of products/month)
Diet Behavior & Nutrition - Meals not home prepared (#/week)
Diet Behavior & Nutrition - Meals from fast food or pizza place (#/week)
Diet Behavior & Nutrition - Ready-to-eat foods (#/month)
Diet Behavior & Nutrition - Frozen meals/pizza (#/month)
Drug Use - People that ever used marijuana or hashish (%)
Drug Use - Ever used hard drugs (%)
Drug Use - Ever used any form of cocaine (%)
Drug Use - Ever used heroin (%)
Drug Use - Ever used methamphetamine (%)
Health Insurance - People covered by health insurance (%)
Kidney Conditions-Urology - Avg. # of times urinating at night
Medical Conditions - People with asthma (%)
Medical Conditions - People with anemia (%)
Medical Conditions - People with psoriasis (%)
Medical Conditions - People with overweight (%)
Medical Conditions - Elderly people having difficulties in thinking or remembering (%)
Medical Conditions - People who ever received blood transfusion (%)
Medical Conditions - People having trouble seeing even with glass/contacts (%)
Medical Conditions - People with arthritis (%)
Medical Conditions - People with gout (%)
Medical Conditions - People with congestive heart failure (%)
Medical Conditions - People with coronary heart disease (%)
Medical Conditions - People with angina pectoris (%)
Medical Conditions - People who ever had heart attack (%)
Medical Conditions - People who ever had stroke (%)
Medical Conditions - People with emphysema (%)
Medical Conditions - People with thyroid problem (%)
Medical Conditions - People with chronic bronchitis (%)
Medical Conditions - People with any liver condition (%)
Medical Conditions - People who ever had cancer or malignancy (%)
Mental Health - People who have little interest in doing things (%)
Mental Health - People feeling down, depressed, or hopeless (%)
Mental Health - People who have trouble sleeping or sleeping too much (%)
Mental Health - People feeling tired or having little energy (%)
Mental Health - People with poor appetite or overeating (%)
Mental Health - People feeling bad about themself (%)
Mental Health - People who have trouble concentrating on things (%)
Mental Health - People moving or speaking slowly or too fast (%)
Mental Health - People having thoughts they would be better off dead (%)
Oral Health - Average years since last visit a dentist
Oral Health - People embarrassed because of mouth (%)
Oral Health - People with gum disease (%)
Oral Health - General health of teeth and gums (%)
Oral Health - Average days a week using dental floss/device
Oral Health - Average days a week using mouthwash for dental problem
Oral Health - Average number of teeth
Pesticide Use - Households using pesticides to control insects (%)
Pesticide Use - Households using pesticides to kill weeds (%)
Physical Activity - People doing vigorous-intensity work activities (%)
Physical Activity - People doing moderate-intensity work activities (%)
Physical Activity - People walking or bicycling (%)
Physical Activity - People doing vigorous-intensity recreational activities (%)
Physical Activity - People doing moderate-intensity recreational activities (%)
Physical Activity - Average hours a day doing sedentary activities
Physical Activity - Average hours a day watching TV or videos
Physical Activity - Average hours a day using computer
Physical Functioning - People having limitations keeping them from working (%)
Physical Functioning - People limited in amount of work they can do (%)
Physical Functioning - People that need special equipment to walk (%)
Physical Functioning - People experiencing confusion/memory problems (%)
Physical Functioning - People requiring special healthcare equipment (%)
Prescription Medications - Average number of prescription medicines taking
Preventive Aspirin Use - Adults 40+ taking low-dose aspirin (%)
Reproductive Health - Vaginal deliveries (%)
Reproductive Health - Cesarean deliveries (%)
Reproductive Health - Deliveries resulted in a live birth (%)
Reproductive Health - Pregnancies resulted in a delivery (%)
Reproductive Health - Women breastfeeding newborns (%)
Reproductive Health - Women that had a hysterectomy (%)
Reproductive Health - Women that had both ovaries removed (%)
Reproductive Health - Women that have ever taken birth control pills (%)
Reproductive Health - Women taking birth control pills (%)
Reproductive Health - Women that have ever used Depo-Provera or injectables (%)
Reproductive Health - Women that have ever used female hormones (%)
Sexual Behavior - People 18+ that ever had sex (vaginal, anal, or oral) (%)
Sexual Behavior - Males 18+ that ever had vaginal sex with a woman (%)
Sexual Behavior - Males 18+ that ever performed oral sex on a woman (%)
Sexual Behavior - Males 18+ that ever had anal sex with a woman (%)
Sexual Behavior - Males 18+ that ever had any sex with a man (%)
Sexual Behavior - Females 18+ that ever had vaginal sex with a man (%)
Sexual Behavior - Females 18+ that ever performed oral sex on a man (%)
Sexual Behavior - Females 18+ that ever had anal sex with a man (%)
Sexual Behavior - Females 18+ that ever had any kind of sex with a woman (%)
Sexual Behavior - Average age people first had sex
Sexual Behavior - Average number of female sex partners in lifetime (males 18+)
Sexual Behavior - Average number of female vaginal sex partners in lifetime (males 18+)
Sexual Behavior - Average age people first performed oral sex on a woman (18+)
Sexual Behavior - Average number of woman performed oral sex on in lifetime (18+)
Sexual Behavior - Average number of male sex partners in lifetime (males 18+)
Sexual Behavior - Average number of male anal sex partners in lifetime (males 18+)
Sexual Behavior - Average age people first performed oral sex on a man (18+)
Sexual Behavior - Average number of male oral sex partners in lifetime (18+)
Sexual Behavior - People using protection when performing oral sex (%)
Sexual Behavior - Average number of times people have vaginal or anal sex a year
Sexual Behavior - People having sex without condom (%)
Sexual Behavior - Average number of male sex partners in lifetime (females 18+)
Sexual Behavior - Average number of male vaginal sex partners in lifetime (females 18+)
Sexual Behavior - Average number of female sex partners in lifetime (females 18+)
Sexual Behavior - Circumcised males 18+ (%)
Sleep Disorders - Average hours sleeping at night
Sleep Disorders - People that has trouble sleeping (%)
Smoking-Cigarette Use - People smoking cigarettes (%)
Taste & Smell - People 40+ having problems with smell (%)
Taste & Smell - People 40+ having problems with taste (%)
Taste & Smell - People 40+ that ever had wisdom teeth removed (%)
Taste & Smell - People 40+ that ever had tonsils teeth removed (%)
Taste & Smell - People 40+ that ever had a loss of consciousness because of a head injury (%)
Taste & Smell - People 40+ that ever had a broken nose or other serious injury to face or skull (%)
Taste & Smell - People 40+ that ever had two or more sinus infections (%)
Weight - Average height (inches)
Weight - Average weight (pounds)
Weight - Average BMI
Weight - People that are obese (%)
Weight - People that ever were obese (%)
Weight - People trying to lose weight (%)
According to our research of Illinois and other state lists, there were 25 registered sex offenders living in Sycamore, Illinois as of April 27, 2024 . The ratio of all residents to sex offenders in Sycamore is 702 to 1.The ratio of registered sex offenders to all residents in this city is near the state average.
Officers per 1,000 residents here:
1.63Illinois average:
2.84
Latest news from Sycamore, IL collected exclusively by city-data.com from local newspapers, TV, and radio stations
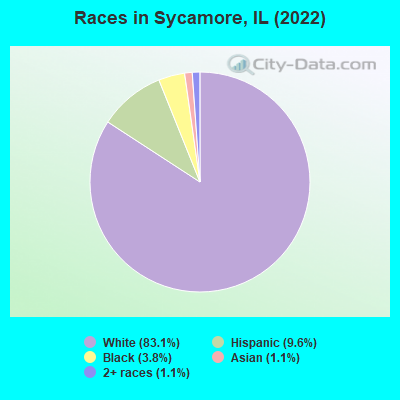
Ancestries: German (17.5%), Irish (9.4%), Yugoslavian (8.4%), American (7.2%), Italian (6.5%), Polish (5.4%).
Current Local Time:
Incorporated on 11/18/1872
Land area: 5.48 square miles.
Population density: 3,401 people per square mile (average).
896 residents are foreign born (1.9% Latin America , 1.6% Europe , 1.3% Asia ).
This city:
5.0%Illinois:
14.1%
Median real estate property taxes paid for housing units with mortgages in 2022: $6,047 (2.2%)Median real estate property taxes paid for housing units with no mortgage in 2022: $4,915 (2.3%)
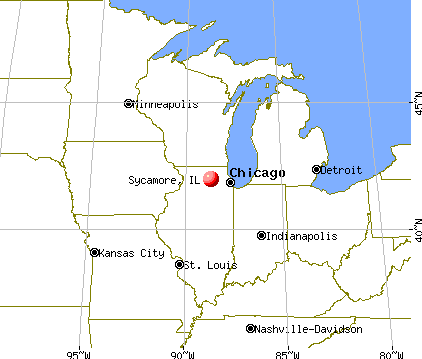
Nearest city with pop. 50,000+: Elgin, IL
Nearest city with pop. 200,000+: Chicago, IL
Nearest cities:
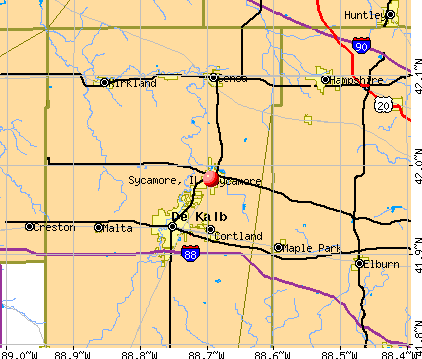
Latitude: 41.98 N, Longitude: 88.69 W
Daytime population change due to commuting: +52 (+0.3%)Workers who live and work in this city: 3,185 (34.1%)
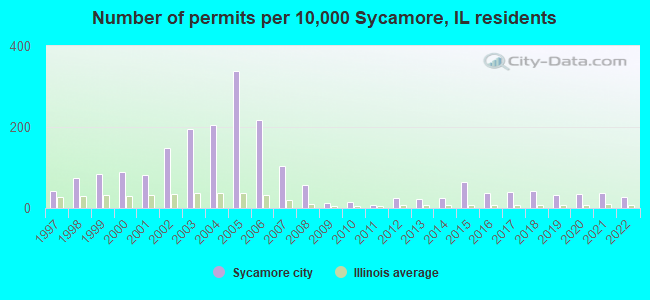
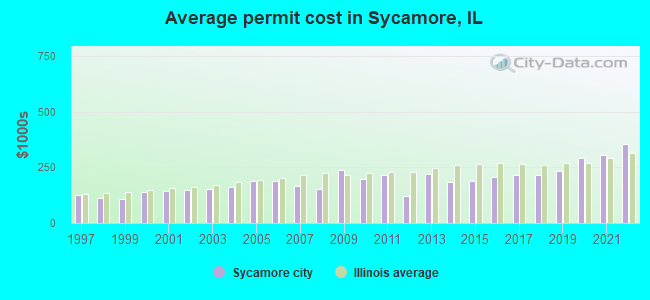
Single-family new house construction building permits:
2022: 33 buildings , average cost: $353,0002021: 46 buildings , average cost: $306,2002020: 42 buildings , average cost: $291,1002019: 39 buildings , average cost: $235,3002018: 51 buildings , average cost: $216,7002017: 48 buildings , average cost: $216,9002016: 44 buildings , average cost: $204,5002015: 76 buildings , average cost: $188,9002014: 30 buildings , average cost: $185,6002013: 28 buildings , average cost: $220,8002012: 29 buildings , average cost: $120,9002011: 9 buildings , average cost: $216,4002010: 19 buildings , average cost: $195,8002009: 16 buildings , average cost: $238,2002008: 68 buildings , average cost: $152,1002007: 124 buildings , average cost: $164,5002006: 261 buildings , average cost: $188,6002005: 406 buildings , average cost: $187,5002004: 247 buildings , average cost: $161,5002003: 235 buildings , average cost: $153,1002002: 178 buildings , average cost: $150,1002001: 99 buildings , average cost: $144,3002000: 106 buildings , average cost: $138,6001999: 100 buildings , average cost: $109,1001998: 90 buildings , average cost: $112,0001997: 50 buildings , average cost: $124,900Unemployment in December 2023:
Population change in the 1990s: +1,962 (+19.5%).
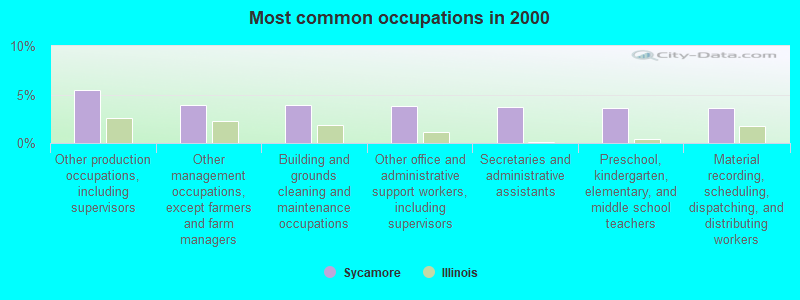
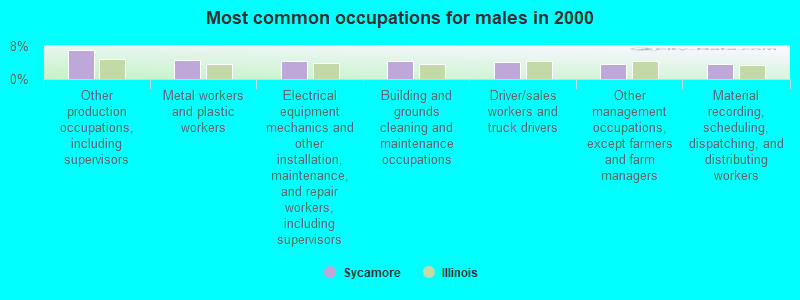
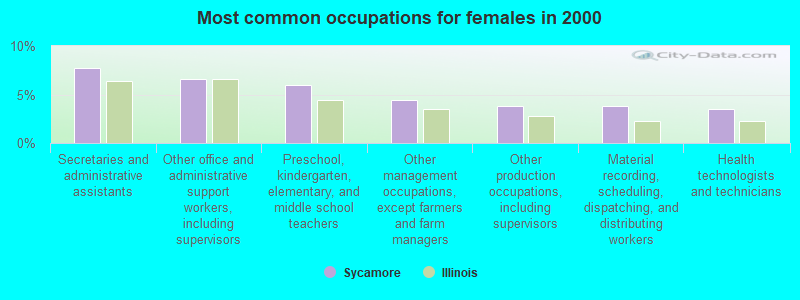
Most common occupations in Sycamore, IL (%)
Both Males Females
Other production occupations, including supervisors (5.5%)
Other management occupations, except farmers and farm managers (3.9%)
Building and grounds cleaning and maintenance occupations (3.9%)
Other office and administrative support workers, including supervisors (3.8%)
Secretaries and administrative assistants (3.7%)
Preschool, kindergarten, elementary, and middle school teachers (3.6%)
Material recording, scheduling, dispatching, and distributing workers (3.6%)
Other production occupations, including supervisors (7.1%)
Metal workers and plastic workers (4.6%)
Electrical equipment mechanics and other installation, maintenance, and repair workers, including supervisors (4.4%)
Building and grounds cleaning and maintenance occupations (4.3%)
Driver/sales workers and truck drivers (4.1%)
Other management occupations, except farmers and farm managers (3.5%)
Material recording, scheduling, dispatching, and distributing workers (3.5%)
Secretaries and administrative assistants (7.7%)
Other office and administrative support workers, including supervisors (6.6%)
Preschool, kindergarten, elementary, and middle school teachers (6.0%)
Other management occupations, except farmers and farm managers (4.4%)
Other production occupations, including supervisors (3.8%)
Material recording, scheduling, dispatching, and distributing workers (3.8%)
Health technologists and technicians (3.5%)
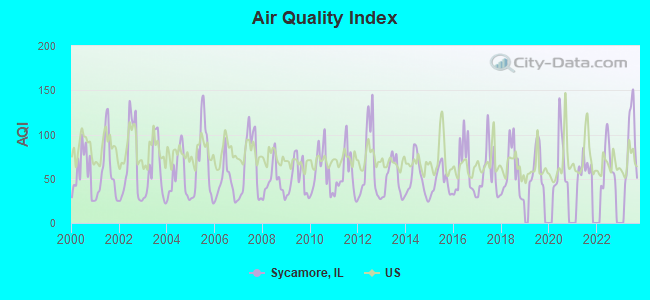
Air pollution and air quality trends(lower is better)
AQI Ozone
Tornado activity:
Sycamore-area historical tornado activity is slightly below Illinois state average. It is 46% greater than the overall U.S. average.
On 8/28/1990, a category F5 (max. wind speeds 261-318 mph) tornado 27.5 miles away from the Sycamore city center killed 29 people and injured 350 people and caused between $50,000 and $500,000 in damages.
On 4/21/1967, a category F4 (max. wind speeds 207-260 mph) tornado 20.0 miles away from the city center killed 24 people and injured 450 people and caused between $50,000 and $500,000 in damages.
Earthquake activity:
Sycamore-area historical earthquake activity is significantly above Illinois state average. It is 57% greater than the overall U.S. average. On 4/18/2008 at 09:36:59, a magnitude 5.4 (5.1 MB, 4.8 MS, 5.4 MW, 5.2 MW, Class: Moderate, Intensity: VI - VII) earthquake occurred 248.0 miles away from Sycamore center On 6/28/2004 at 06:10:52, a magnitude 4.2 (4.2 MW, Depth: 6.2 mi, Class: Light, Intensity: IV - V) earthquake occurred 37.8 miles away from Sycamore center On 6/10/1987 at 23:48:54, a magnitude 5.1 (4.9 MB, 4.4 MS, 4.6 MS, 5.1 LG) earthquake occurred 222.9 miles away from the city center On 4/18/2008 at 09:36:59, a magnitude 5.2 (5.2 MW, Depth: 8.9 mi) earthquake occurred 248.0 miles away from the city center On 2/10/2010 at 09:59:35, a magnitude 3.8 (3.8 MW, Depth: 6.2 mi, Class: Light, Intensity: II - III) earthquake occurred 10.1 miles away from Sycamore center On 6/18/2002 at 17:37:15, a magnitude 5.0 (4.3 MB, 4.6 MW, 5.0 LG) earthquake occurred 280.7 miles away from the city center Magnitude types: regional Lg-wave magnitude (LG), body-wave magnitude (MB), surface-wave magnitude (MS), moment magnitude (MW) Natural disasters: The number of natural disasters in DeKalb County (11) is smaller than the US average (15).Major Disasters (Presidential) Declared: 7Emergencies Declared: 3Floods: 6, Storms: 5, Snowstorms: 2, Blizzard: 1, Hurricane: 1, Snow: 1, Wind: 1, Winter Storm: 1, Other: 1 (Note: some incidents may be assigned to more than one category). Hospitals and medical centers in Sycamore: BETHESDA LUTHERAN-SYCAMORE (1761 WOODGATE DRIVE) THC CHICAGO INC DBA KINDRED HOSP (225 EDWARD STREET) DAVITA - SYCAMORE (2200 GATEWAY DR)
HOME BOUND HEALTHCARE, INC (1740 MEDITERRANEAN DRIVE)
College/University in Sycamore: Hair Professionals Career College Full-time enrollment: 75; Location: 2245 Gateway Drive; Private, for-profit; Website: www.hairpros.edu)
Colleges/universities with over 2000 students nearest to Sycamore:
Northern Illinois University (about 6 miles; Dekalb, IL ; Full-time enrollment: 18,126)
Kishwaukee College (about 11 miles; Malta, IL ; FT enrollment: 3,356)
Waubonsee Community College (about 18 miles; Sugar Grove, IL ; FT enrollment: 7,698)
Elgin Community College (about 20 miles; Elgin, IL ; FT enrollment: 8,173)
Aurora University (about 24 miles; Aurora, IL ; FT enrollment: 4,596)
McHenry County College (about 26 miles; Crystal Lake, IL ; FT enrollment: 4,886)
Rock Valley College (about 28 miles; Rockford, IL ; FT enrollment: 6,269)
Public high school in Sycamore:
Private high school in Sycamore: CORNERSTONE CHRISTIAN ACADEMY Students: 339, Location: 355 N CROSS ST, Grades: PK-12)
Public elementary/middle schools in Sycamore: SYCAMORE MIDDLE SCHOOL Students: 845, Location: 150 MAPLEWOOD DR, Grades: 6-8)SOUTH PRAIRIE ELEMENTARY SCHOOL Students: 449, Location: 820 BORDEN AVE, Grades: KG-5)SOUTHEAST ELEM SCHOOL Students: 449, Location: 718 S LOCUST ST, Grades: KG-5)NORTH GROVE ELEMENTARY SCHOOL Students: 444, Location: 850 REPUBLIC AVE, Grades: KG-5)NORTH ELEMENTARY SCHOOL Location: 1680 BRICKVILLE RD, Grades: KG-5)
WEST ELEM SCHOOL Location: 240 FAIR ST, Grades: PK-5)
Private elementary/middle schools in Sycamore: ST MARY'S CATHOLIC SCHOOL Students: 229, Location: 222 WATERMAN ST, Grades: PK-8)
MONTESSORI CHILDRENS HOUSE OF SYCAMORE AND DEKALB Students: 24, Location: 26555 BRICKVILLE RD, Grades: PK-1)
See full list of schools located in Sycamore Library in Sycamore: SYCAMORE PUBLIC LIBRARY Operating income: $888,352; Location: 103 EAST STATE STREET; 59,051 books ; 839 e-books ; 3,063 audio materials ; 2,902 video materials ; 7 local licensed databases ; 17 state licensed databases ; 1 other licensed databases ; 121 print serial subscriptions )
User-submitted facts and corrections:
St. Mary's School in Sycamore IL offers Pre-K thru 8th Grade
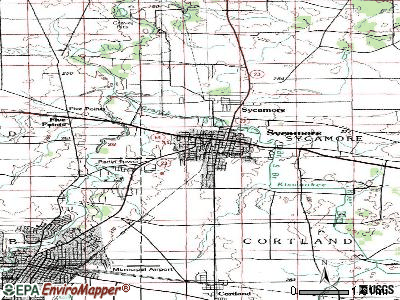
Notable locations in Sycamore: (A) , Sycamore Public Library (B) , Sycamore Municipal Building (C) , Sycamore Community Center (D) , DeKalb County Public Safety Building (E) , DeKalb County Courthouse (F) , DeKalb County Administration Building (G) , Sycamore Fire Department (H) . Display/hide their locations on the map
Churches in Sycamore include: (A) , Salem Lutheran Church (B) , Bethel Assembly of God Church (C) , Evangelical Lutheran Church of Saint John (D) , Federated Church (E) , Grace Community Fellowship Church (F) , North Avenue Baptist Church (G) , Saint Marys Catholic Church (H) , Saint Peters Episcopal Church (I) . Display/hide their locations on the map
Cemeteries: (1) , Mount Carmel Sycamore Cemetery (2) . Display/hide their locations on the map
Parks in Sycamore include: (1) , Sycamore Swimming Pool (2) , Community Park (3) . Display/hide their locations on the map
Hotels:
Courts:
Birthplace of: Mark Johnston (American football) - Football player, Brian Lund - Painter and teacher.
DeKalb County has a predicted average indoor radon screening level greater than 4 pCi/L (pico curies per liter) - Highest Potential Drinking water stations with addresses in Sycamore and their reported violations in the past:
SYCAMORE BASEBALL COMPLEX (Population served: 100, Groundwater):
Past monitoring violations:
One regular monitoring violation
Population served: 100, Groundwater):
Past monitoring violations:
One regular monitoring violation
Population served: 42, Groundwater):
Past monitoring violations:
One regular monitoring violation
Population served: 35, Groundwater):
Past monitoring violations:
One regular monitoring violation
Population served: 25, Groundwater):
Past monitoring violations:
One regular monitoring violation
Population served: 25, Groundwater):
Past monitoring violations:
One regular monitoring violation
Population served: 25, Groundwater):
Past monitoring violations:
One regular monitoring violation
Population served: 25, Groundwater):
Past monitoring violations:
One regular monitoring violation
Average household size: This city:
2.5 peopleIllinois:
2.6 people
Percentage of family households: This city:
65.4%Whole state:
65.8%
Percentage of households with unmarried partners: This city:
8.0%Whole state:
6.3%
Likely homosexual households (counted as self-reported same-sex unmarried-partner households)
Lesbian couples: 0.3% of all households Gay men: 0.1% of all households
122 people in local jails and other municipal confinement facilities in 2010people in group homes intended for adults in 2010people in local jails and other confinement facilities (including police lockups) in 2000people in homes for the mentally retarded in 2000
Banks with branches in Sycamore (2011 data):
The National Bank & Trust Company of Sycamore: Coltonville Branch, Messenger Service Branch, The National Bank & Trust Company Of. Info updated 2006/05/11: Bank assets: $589.8 mil, Deposits: $516.0 mil, local headquarters , positive income , Commercial Lending Specialization, 10 total offices , Holding Company: Ni Bancshares Corporation
First National Bank of Omaha: Sycamore Branch at 511 West State Street, branch established on 1991/06/24; Sycamore Mobile Branch at 511 West State Street, branch established on 2006/08/15. Info updated 2010/10/13: Bank assets: $13,433.1 mil, Deposits: $10,746.6 mil, headquarters in Omaha, NE, positive income , Commercial Lending Specialization, 102 total offices , Holding Company: Lauritzen Corporation
American Midwest Bank: at 1985 Dekkalb Avenue, branch established on 1973/10/15; Sycamore Branch at 124 South Main Street, branch established on 1999/10/18. Info updated 2011/12/12: Bank assets: $526.8 mil, Deposits: $460.2 mil, local headquarters , positive income , Commercial Lending Specialization, 8 total offices , Holding Company: National Bancorp, Inc.
Old Second National Bank: Sycamore Branch at 1810 Dekalb Avenue, branch established on 2003/05/28. Info updated 2008/03/03: Bank assets: $1,939.3 mil, Deposits: $1,741.1 mil, headquarters in Aurora, IL, positive income , Commercial Lending Specialization, 27 total offices , Holding Company: Old Second Bancorp, Inc.
Resource Bank, National Association: Sycamore Branch at 403 East State Street, branch established on 2001/07/16. Info updated 2006/11/03: Bank assets: $344.9 mil, Deposits: $293.7 mil, headquarters in Dekalb, IL, positive income , Commercial Lending Specialization, 7 total offices , Holding Company: Resource Bancshares, Inc.
TCF National Bank: Sycamore Jewel #2366 Branch at 220 Peace Rd, branch established on 2008/04/23. Info updated 2009/11/23: Bank assets: $19,007.0 mil, Deposits: $12,377.0 mil, headquarters in Sioux Falls, SD, positive income , Commercial Lending Specialization, 441 total offices , Holding Company: Tcf Financial Corporation
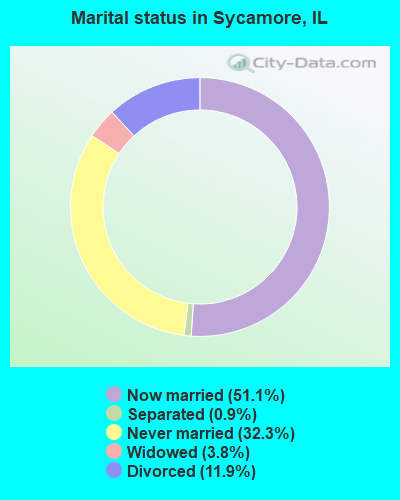
For population 15 years and over in Sycamore:
Never married: 32.3%Now married: 51.1%Separated: 0.9%Widowed: 3.8%Divorced: 11.9% For population 25 years and over in Sycamore:
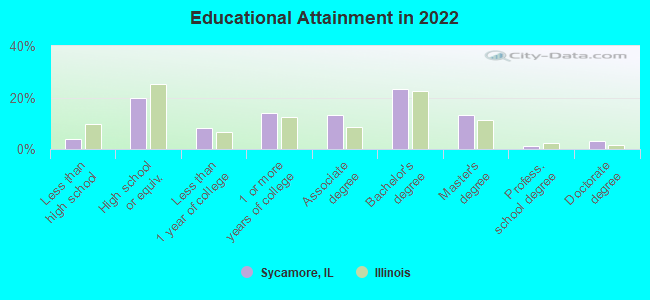
High school or higher: 96.2%Bachelor's degree or higher: 44.8%Graduate or professional degree: 18.5%Unemployed: 2.8%Mean travel time to work (commute): 21.9 minutes
Education Gini index (Inequality in education) Here:
9.8Illinois average:
12.5
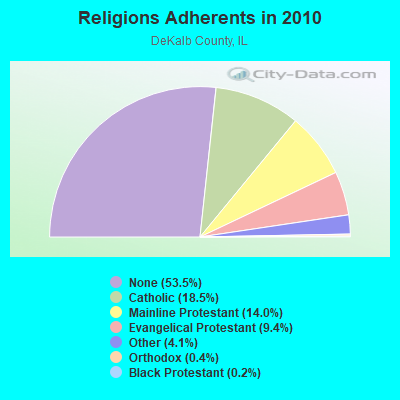
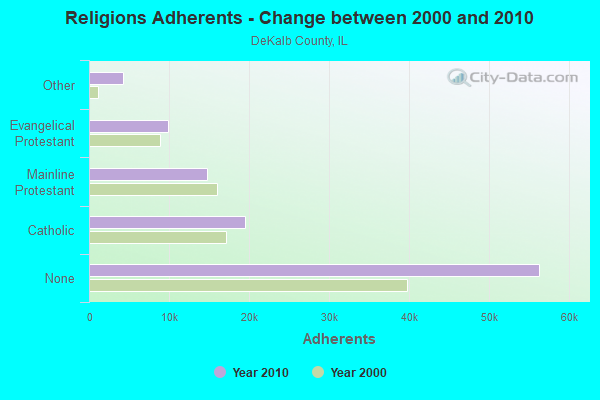
Religion statistics for Sycamore, IL (based on DeKalb County data)
Religion Adherents Congregations Catholic 19,447 6 Mainline Protestant 14,719 37 Evangelical Protestant 9,843 49 Other 4,267 12 Orthodox 400 1 Black Protestant 182 1 None 56,302 -
Source: Clifford Grammich, Kirk Hadaway, Richard Houseal, Dale E.Jones, Alexei Krindatch, Richie Stanley and Richard H.Taylor. 2012. 2010 U.S.Religion Census: Religious Congregations & Membership Study. Association of Statisticians of American Religious Bodies. Jones, Dale E., et al. 2002. Congregations and Membership in the United States 2000. Nashville, TN: Glenmary Research Center. Graphs represent county-level data
Food Environment Statistics: Number of grocery stores : 13DeKalb County :
1.24 / 10,000 pop.Illinois :
2.24 / 10,000 pop.
Number of supercenters and club stores : 1DeKalb County :
0.10 / 10,000 pop.Illinois :
0.08 / 10,000 pop.
Number of convenience stores (no gas) : 6DeKalb County :
0.57 / 10,000 pop.Illinois :
0.75 / 10,000 pop.
Number of convenience stores (with gas) : 32DeKalb County :
3.04 / 10,000 pop.State :
2.61 / 10,000 pop.
Number of full-service restaurants : 67Here :
6.37 / 10,000 pop.State :
6.86 / 10,000 pop.
Adult diabetes rate : DeKalb County :
7.0%Illinois :
8.3%
Adult obesity rate : DeKalb County :
26.1%Illinois :
25.2%
Low-income preschool obesity rate : This county :
16.3%State :
14.5%
Health and Nutrition: Healthy diet rate : Sycamore:
50.4%Illinois:
49.5%
Average overall health of teeth and gums : Sycamore:
49.0%Illinois:
47.2%
Average BMI : Sycamore:
28.9Illinois:
28.6
People feeling badly about themselves : Sycamore:
21.6%Illinois:
20.5%
People not drinking alcohol at all : Average hours sleeping at night : This city:
6.8Illinois:
6.8
General health condition : Sycamore:
58.0%Illinois:
56.4%
Average condition of hearing : Sycamore:
79.6%Illinois:
79.9%
More about Health and Nutrition of Sycamore, IL Residents
Local government employment and payroll (March 2022)
Function
Full-time employees
Monthly full-time payroll
Average yearly full-time wage
Part-time employees
Monthly part-time payroll
Police Protection - Officers
30 $239,630 $95,852 0 $0 Firefighters
27 $270,570 $120,253 0 $0 Streets and Highways
14 $90,090 $77,220 0 $0 Local Libraries
7 $32,685 $56,031 18 $22,222 Sewerage
5 $32,448 $77,875 0 $0 Other Government Administration
4 $26,199 $78,597 11 $6,253 Water Supply
4 $29,322 $87,966 0 $0 Other and Unallocable
4 $25,515 $76,545 0 $0 Housing and Community Development (Local)
2 $14,964 $89,784 0 $0 Financial Administration
2 $9,986 $59,916 1 $1,663 Police - Other
2 $9,524 $57,144 10 $6,712 Fire - Other
1 $5,031 $60,372 0 $0
Totals for Government
102 $785,965 $92,466 40 $36,849
Sycamore government finances - Expenditure in 2018 (per resident):
Construction - Central Staff Services: $14,268,000 ($764.96)
Regular Highways: $598,000 ($32.06)General - Other: $537,000 ($28.79)Current Operations - Central Staff Services: $6,167,000 ($330.63)
Police Protection: $4,353,000 ($233.38)Local Fire Protection: $3,926,000 ($210.49)Water Utilities: $2,122,000 ($113.77)Sewerage: $1,720,000 ($92.22)Libraries: $1,230,000 ($65.94)General - Other: $1,077,000 ($57.74)Regular Highways: $1,014,000 ($54.36)General - Interest on Debt: $323,000 ($17.32)
Intergovernmental to Local - Other - General - Other: $134,000 ($7.18)
Other Capital Outlay - Central Staff Services: $947,000 ($50.77)
Water Utilities: $338,000 ($18.12)Total Salaries and Wages: $9,151,000 ($490.62)
Sycamore government finances - Revenue in 2018 (per resident):
Charges - Sewerage: $3,758,000 ($201.48)
Solid Waste Management: $1,543,000 ($82.73)Other: $1,401,000 ($75.11)Parks and Recreation: $61,000 ($3.27)Local Intergovernmental - Other: $391,000 ($20.96)
Miscellaneous - General Revenue - Other: $306,000 ($16.41)
Fines and Forfeits: $262,000 ($14.05)Interest Earnings: $247,000 ($13.24)Revenue - Water Utilities: $2,733,000 ($146.53)
State Intergovernmental - General Local Government Support: $22,234,000 ($1192.04)
Highways: $474,000 ($25.41)Tax - Property: $4,048,000 ($217.03)
General Sales and Gross Receipts: $2,013,000 ($107.92)Other Selective Sales: $2,010,000 ($107.76)Public Utilities Sales: $613,000 ($32.87)Other License: $133,000 ($7.13)
Sycamore government finances - Debt in 2018 (per resident):
Long Term Debt - Beginning Outstanding - Unspecified Public Purpose: $9,628,000 ($516.19)
Outstanding Unspecified Public Purpose: $8,596,000 ($460.86)Retired Unspecified Public Purpose: $4,547,000 ($243.78)Issue, Unspecified Public Purpose: $3,515,000 ($188.45)
Sycamore government finances - Cash and Securities in 2018 (per resident):
Other Funds - Cash and Securities: $19,827,000 ($1063.00)
Businesses in Sycamore, IL
Name Count Name Count
7-Eleven 1 MasterBrand Cabinets 5 Burger King 1 Mazda 1 Comfort Inn 1 McDonald's 1 Curves 1 Menards 1 DHL 1 Motel 6 1 Dunkin Donuts 1 Pizza Hut 1 FedEx 3 Sprint Nextel 1 Ford 1 T-Mobile 1 H&R Block 1 Taco Bell 1 Holiday Inn 1 The Room Place 1 Honda 1 U-Haul 1 Hyundai 1 UPS 1 Jewel-Osco 1 Walgreens 1 Jimmy John's 1 Wendy's 1 KFC 1 YMCA 1 Long John Silver's 1
Strongest AM radio stations in Sycamore:
WSCR (670 AM; 50 kW; CHICAGO, IL; Owner: INFINITY BROADCASTING OPERATIONS, INC.)
WGN (720 AM; 50 kW; CHICAGO, IL; Owner: WGN CONTINENTAL BROADCASTING CO.)
WBBM (780 AM; 50 kW; CHICAGO, IL; Owner: INFINITY BROADCASTING OPERATIONS, INC.)
WSQR (1560 AM; 0 kW; SYCAMORE, IL; Owner: DEKALB COUNTY BROADCASTERS, INC.)
WLBK (1360 AM; 1 kW; DEKALB, IL; Owner: WPW BROADCASTING, INC.)
WMVP (1000 AM; 50 kW; CHICAGO, IL; Owner: ABC, INC.)
WTMJ (620 AM; 50 kW; MILWAUKEE, WI; Owner: JOURNAL BROADCAST CORPORATION)
WYLL (1160 AM; 50 kW; CHICAGO, IL; Owner: SCA LICENSE CORPORATION)
WLS (890 AM; 50 kW; CHICAGO, IL; Owner: WLS, INC.)
WISN (1130 AM; 50 kW; MILWAUKEE, WI; Owner: CAPSTAR TX LIMITED PARTNERSHIP)
WNVR (1030 AM; 5 kW; VERNON HILLS, IL; Owner: POLNET COMMUNICATIONS, LTD.)
WAUR (930 AM; 4 kW; SANDWICH, IL; Owner: CHRISTIAN BROADCASTING SYSTEM, LTD.)
WROK (1440 AM; 5 kW; ROCKFORD, IL; Owner: CUMULUS LICENSING CORP.)
Strongest FM radio stations in Sycamore:
WDEK (92.5 FM; DEKALB, IL; Owner: SPANISH BROADCASTING SYSTEM OF ILLINOIS, INC.)
WYCH (106.3 FM; GENOA, IL; Owner: DONTRON, INC.)
WDKB (94.9 FM; DEKALB, IL; Owner: DEKALB COUNTY RADIO, LIMITED)
WNIU (89.5 FM; DEKALB, IL; Owner: NORTHERN ILLINOIS UNIVERSITY)
WNIJ (90.5 FM; ROCKFORD, IL; Owner: NORTHERN ILLINOIS UNIVERSITY)
WCKG (105.9 FM; ELMWOOD PARK, IL; Owner: INFINITY HOLDINGS CORPORATION OF ORLANDO)
WLIT-FM (93.9 FM; CHICAGO, IL; Owner: AMFM RADIO LICENSES, L.L.C.)
WJMK (104.3 FM; CHICAGO, IL; Owner: INFINITY BROADCASTING CORP. OF ILLINOIS)
WZSR (105.5 FM; WOODSTOCK, IL; Owner: NM LICENSING, LLC)
WNUA (95.5 FM; CHICAGO, IL; Owner: AMFM RADIO LICENSES, L.L.C.)
WTMX (101.9 FM; SKOKIE, IL; Owner: BONNEVILLE HOLDING COMPANY)
WBBM-FM (96.3 FM; CHICAGO, IL; Owner: INFINITY BROADCASTING OPERATIONS, INC.)
WGCI-FM (107.5 FM; CHICAGO, IL; Owner: AMFM RADIO LICENSES, L.L.C.)
WKSC-FM (103.5 FM; CHICAGO, IL; Owner: AMFM RADIO LICENSES, L.L.C.)
WFMT (98.7 FM; CHICAGO, IL; Owner: WINDOW TO THE WORLD COMMUNICATIONS)
WZZN (94.7 FM; CHICAGO, IL; Owner: ABC CHICAGO FM RADIO,INC.)
WSPY-FM (107.1 FM; PLANO, IL; Owner: NELSON ENTERPRISES, INC.)
WZCH (103.9 FM; DUNDEE, IL; Owner: ENTRAVISION HOLDINGS, LLC)
WERV-FM (95.9 FM; AURORA, IL; Owner: NM LICENSING, LLC)
WGSL (91.1 FM; LOVES PARK, IL; Owner: CHRISTIAN LIFE CENTER SCHOOL)
TV broadcast stations around Sycamore:
W34CK (Channel 34; ARLINGTON HEIGHTS, IL; Owner: FIRST UNITED, INC.)
WLS-TV (Channel 7; CHICAGO, IL; Owner: WLS TELEVISION, INC.)
WMAQ-TV (Channel 5; CHICAGO, IL; Owner: NBC SUBSIDIARY (WMAQ-TV), INC.)
WTTW (Channel 11; CHICAGO, IL; Owner: WINDOW TO THE WORLD COMMUNICATIONS, INC.)
WGN-TV (Channel 9; CHICAGO, IL; Owner: WGN CONTINENTAL BROADCASTING COMPANY)
WGBO-TV (Channel 66; JOLIET, IL; Owner: WGBO LICENSE PARTNERSHIP, G.P.)
WPWR-TV (Channel 50; GARY, IN; Owner: FOX TELEVISION STATIONS, INC.)
WXFT (Channel 60; AURORA, IL; Owner: TELEFUTURA CHICAGO LLC)
WCIU-TV (Channel 26; CHICAGO, IL; Owner: WCIU-TV LIMITED PARTNERSHIP)
WCPX (Channel 38; CHICAGO, IL; Owner: PAXSON CHICAGO LICENSE, INC.)
W64CQ (Channel 64; ARLINGTON HEIGHTS, IL; Owner: TRINITY BROADCASTING NETWORK)
WFLD (Channel 32; CHICAGO, IL; Owner: FOX TELEVISION STATIONS, INC.)
WSPY-LP (Channel 30; PLANO, IL; Owner: WSPY-TV, INC.)
W68DO (Channel 68; PALATINE, IL; Owner: TRINITY BROADCASTING NETWORK)
WFBT-CA (Channel 23; CHICAGO, IL; Owner: CHANNEL 23 LIMITED PARTNERSHIP)
WSNS-TV (Channel 44; CHICAGO, IL; Owner: TELEMUNDO OF CHICAGO, INC.)
WWTO-TV (Channel 35; LASALLE, IL; Owner: TRINITY BROADCASTING NETWORK)
W57DN (Channel 57; ELGIN, IL; Owner: TRINITY BROADCASTING NETWORK)
WIFR (Channel 23; FREEPORT, IL; Owner: GRAY MIDAMERICA TV LICENSEE CORP.)
WTVO (Channel 17; ROCKFORD, IL; Owner: WINNEBAGO TELEVISION CORPORATION)
WFBN-LP (Channel 33; ROCKFORD, IL; Owner: WEIGEL BROADCASTING COMPANY)
W24AJ (Channel 24; AURORA, IL; Owner: NELSON TV, INC.)
WQRF-TV (Channel 39; ROCKFORD, IL; Owner: QUORUM OF ROCKFORD LICENSE, LLC)
WQFL-CA (Channel 8; ROCKFORD, IL; Owner: FAMILY VALUES ORGANIZATION, INC.)
W54BE (Channel 54; SUGAR GROVE, IL; Owner: WAUBONSEE COMMUNITY COLLEGE)
National Bridge Inventory (NBI) Statistics 22 Number of bridges200ft / 60.8m Total length107,425 Total average daily traffic11,647 Total average daily truck traffic132,021 Total future (year 2032) average daily traffic
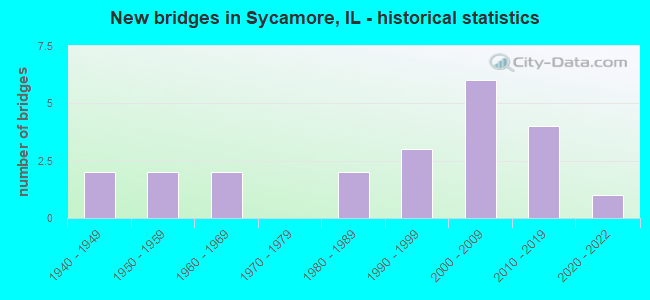
New bridges - historical statistics
2 1940-1949 2 1950-1959 2 1960-1969 2 1980-1989 3 1990-1999 6 2000-2009 4 2010-2019 1 2020-2022
See full National Bridge Inventory statistics for Sycamore, IL
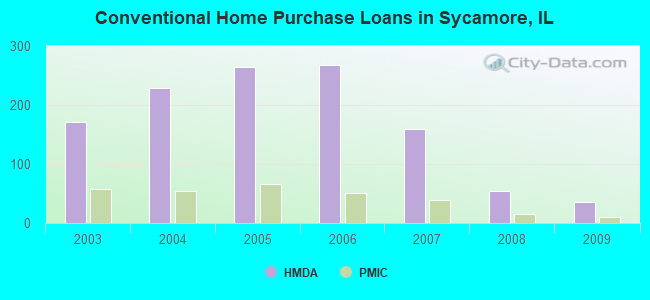
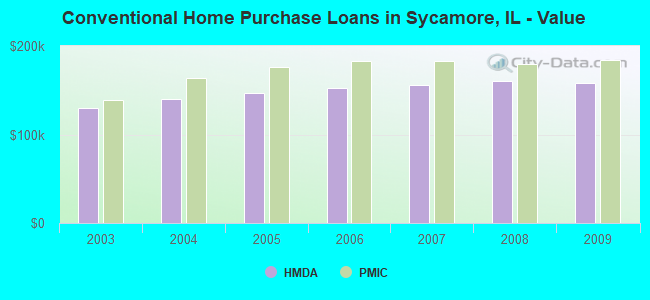
Home Mortgage Disclosure Act Aggregated Statistics For Year 2009(Based on 3 partial tracts) A) FHA, FSA/RHS & VA B) Conventional C) Refinancings D) Home Improvement Loans E) Loans on Dwellings For 5+ Families F) Non-occupant Loans on Number Average Value Number Average Value Number Average Value Number Average Value Number Average Value Number Average Value
LOANS ORIGINATED 26 $165,107 36 $158,261 307 $150,621 4 $33,985 2 $232,170 19 $133,830 APPLICATIONS APPROVED, NOT ACCEPTED 3 $189,690 6 $145,282 32 $165,815 0 $0 0 $0 2 $159,585 APPLICATIONS DENIED 5 $185,098 7 $124,697 49 $194,889 2 $106,420 1 $156,500 5 $112,274 APPLICATIONS WITHDRAWN 5 $147,962 0 $0 48 $187,346 2 $91,235 0 $0 0 $0 FILES CLOSED FOR INCOMPLETENESS 1 $122,500 2 $168,935 8 $225,288 0 $0 0 $0 2 $87,490
Aggregated Statistics For Year 2008(Based on 3 partial tracts) A) FHA, FSA/RHS & VA B) Conventional C) Refinancings D) Home Improvement Loans E) Loans on Dwellings For 5+ Families F) Non-occupant Loans on G) Loans On Manufactured Number Average Value Number Average Value Number Average Value Number Average Value Number Average Value Number Average Value Number Average Value
LOANS ORIGINATED 18 $164,489 55 $160,029 184 $146,013 17 $50,088 4 $170,708 18 $103,526 1 $14,620 APPLICATIONS APPROVED, NOT ACCEPTED 3 $143,770 7 $128,406 25 $149,641 1 $11,270 0 $0 4 $133,090 0 $0 APPLICATIONS DENIED 2 $115,160 13 $168,405 52 $163,994 11 $94,198 0 $0 7 $160,811 2 $34,745 APPLICATIONS WITHDRAWN 1 $154,000 5 $147,004 33 $168,827 2 $14,440 0 $0 2 $102,095 0 $0 FILES CLOSED FOR INCOMPLETENESS 1 $132,110 1 $256,210 6 $241,657 1 $6,260 0 $0 0 $0 0 $0
Aggregated Statistics For Year 2007(Based on 3 partial tracts) A) FHA, FSA/RHS & VA B) Conventional C) Refinancings D) Home Improvement Loans F) Non-occupant Loans on G) Loans On Manufactured Number Average Value Number Average Value Number Average Value Number Average Value Number Average Value Number Average Value
LOANS ORIGINATED 5 $187,746 159 $156,396 157 $153,272 17 $51,234 32 $140,168 0 $0 APPLICATIONS APPROVED, NOT ACCEPTED 0 $0 21 $142,652 31 $170,384 4 $83,202 3 $204,157 0 $0 APPLICATIONS DENIED 3 $135,560 15 $179,380 69 $154,319 12 $94,621 4 $151,605 1 $21,540 APPLICATIONS WITHDRAWN 2 $301,395 10 $148,381 36 $175,518 3 $57,380 2 $150,200 0 $0 FILES CLOSED FOR INCOMPLETENESS 0 $0 3 $161,347 14 $193,300 1 $92,870 2 $182,975 0 $0
Aggregated Statistics For Year 2006(Based on 3 partial tracts) A) FHA, FSA/RHS & VA B) Conventional C) Refinancings D) Home Improvement Loans E) Loans on Dwellings For 5+ Families F) Non-occupant Loans on G) Loans On Manufactured Number Average Value Number Average Value Number Average Value Number Average Value Number Average Value Number Average Value Number Average Value
LOANS ORIGINATED 8 $190,654 268 $152,229 192 $142,786 22 $49,941 2 $615,080 38 $136,165 1 $17,560 APPLICATIONS APPROVED, NOT ACCEPTED 1 $259,110 38 $142,636 43 $134,751 5 $25,868 0 $0 3 $116,637 0 $0 APPLICATIONS DENIED 0 $0 41 $133,075 74 $163,757 15 $79,519 0 $0 4 $127,105 1 $12,240 APPLICATIONS WITHDRAWN 2 $118,695 23 $124,485 68 $159,582 1 $39,080 0 $0 4 $105,788 0 $0 FILES CLOSED FOR INCOMPLETENESS 0 $0 4 $150,908 9 $155,252 2 $170,925 0 $0 0 $0 0 $0
Aggregated Statistics For Year 2005(Based on 3 partial tracts) A) FHA, FSA/RHS & VA B) Conventional C) Refinancings D) Home Improvement Loans E) Loans on Dwellings For 5+ Families F) Non-occupant Loans on Number Average Value Number Average Value Number Average Value Number Average Value Number Average Value Number Average Value
LOANS ORIGINATED 11 $144,015 264 $147,444 217 $131,345 17 $58,782 3 $605,923 43 $132,006 APPLICATIONS APPROVED, NOT ACCEPTED 2 $110,335 25 $134,867 23 $147,989 1 $42,720 0 $0 2 $81,695 APPLICATIONS DENIED 2 $180,105 31 $121,328 93 $140,336 20 $65,445 0 $0 5 $99,358 APPLICATIONS WITHDRAWN 0 $0 23 $171,681 66 $151,285 8 $108,151 1 $940,770 8 $155,826 FILES CLOSED FOR INCOMPLETENESS 1 $219,100 3 $103,030 15 $144,640 2 $21,910 0 $0 1 $108,920
Aggregated Statistics For Year 2004(Based on 3 partial tracts) A) FHA, FSA/RHS & VA B) Conventional C) Refinancings D) Home Improvement Loans E) Loans on Dwellings For 5+ Families F) Non-occupant Loans on G) Loans On Manufactured Number Average Value Number Average Value Number Average Value Number Average Value Number Average Value Number Average Value Number Average Value
LOANS ORIGINATED 15 $149,057 229 $140,314 202 $131,086 20 $46,093 5 $718,212 37 $110,038 0 $0 APPLICATIONS APPROVED, NOT ACCEPTED 1 $99,530 22 $165,365 24 $143,200 1 $41,760 0 $0 4 $102,378 0 $0 APPLICATIONS DENIED 3 $147,223 10 $135,424 87 $123,703 18 $52,904 0 $0 7 $93,500 1 $28,210 APPLICATIONS WITHDRAWN 1 $98,450 13 $168,312 79 $135,938 4 $45,105 0 $0 2 $100,535 0 $0 FILES CLOSED FOR INCOMPLETENESS 2 $101,695 3 $191,830 17 $136,031 2 $20,325 0 $0 3 $114,350 0 $0
Aggregated Statistics For Year 2003(Based on 3 partial tracts) A) FHA, FSA/RHS & VA B) Conventional C) Refinancings D) Home Improvement Loans E) Loans on Dwellings For 5+ Families F) Non-occupant Loans on Number Average Value Number Average Value Number Average Value Number Average Value Number Average Value Number Average Value
LOANS ORIGINATED 36 $141,432 171 $130,428 593 $117,743 18 $19,233 4 $708,500 44 $113,150 APPLICATIONS APPROVED, NOT ACCEPTED 1 $108,300 2 $102,870 37 $115,074 4 $18,002 0 $0 2 $132,285 APPLICATIONS DENIED 2 $90,655 11 $113,552 106 $112,107 8 $16,928 0 $0 7 $84,684 APPLICATIONS WITHDRAWN 2 $132,710 16 $121,064 87 $121,734 1 $1,880 0 $0 4 $100,790 FILES CLOSED FOR INCOMPLETENESS 1 $70,740 2 $139,445 8 $101,039 0 $0 0 $0 1 $66,360
Detailed HMDA statistics for the following Tracts:
0005.00
, 0006.00 , 0007.00
Private Mortgage Insurance Companies Aggregated Statistics For Year 2009(Based on 3 partial tracts) A) Conventional B) Refinancings Number Average Value Number Average Value
LOANS ORIGINATED 11 $183,841 7 $175,926 APPLICATIONS APPROVED, NOT ACCEPTED 1 $110,180 1 $82,630 APPLICATIONS DENIED 3 $195,573 0 $0 APPLICATIONS WITHDRAWN 2 $144,415 1 $78,250 FILES CLOSED FOR INCOMPLETENESS 0 $0 2 $172,740
Aggregated Statistics For Year 2008(Based on 3 partial tracts) A) Conventional B) Refinancings C) Non-occupant Loans on Number Average Value Number Average Value Number Average Value
LOANS ORIGINATED 15 $179,968 14 $207,336 1 $119,570 APPLICATIONS APPROVED, NOT ACCEPTED 7 $177,474 6 $223,120 1 $225,190 APPLICATIONS DENIED 2 $123,335 1 $129,530 1 $71,960 APPLICATIONS WITHDRAWN 1 $263,830 1 $234,100 0 $0 FILES CLOSED FOR INCOMPLETENESS 0 $0 1 $218,470 1 $101,410
Aggregated Statistics For Year 2007(Based on 3 partial tracts) A) Conventional B) Refinancings C) Non-occupant Loans on Number Average Value Number Average Value Number Average Value
LOANS ORIGINATED 39 $182,896 16 $181,662 1 $75,750 APPLICATIONS APPROVED, NOT ACCEPTED 6 $171,727 4 $222,288 0 $0 APPLICATIONS DENIED 1 $142,320 1 $97,030 0 $0 APPLICATIONS WITHDRAWN 2 $189,125 2 $175,280 0 $0 FILES CLOSED FOR INCOMPLETENESS 1 $90,770 0 $0 0 $0
Aggregated Statistics For Year 2006(Based on 3 partial tracts) A) Conventional B) Refinancings C) Non-occupant Loans on Number Average Value Number Average Value Number Average Value
LOANS ORIGINATED 51 $183,290 17 $169,729 5 $115,802 APPLICATIONS APPROVED, NOT ACCEPTED 5 $154,388 3 $167,330 0 $0 APPLICATIONS DENIED 1 $86,390 0 $0 0 $0 APPLICATIONS WITHDRAWN 2 $176,275 2 $247,965 0 $0 FILES CLOSED FOR INCOMPLETENESS 0 $0 0 $0 0 $0
Aggregated Statistics For Year 2005(Based on 3 partial tracts) A) Conventional B) Refinancings C) Non-occupant Loans on Number Average Value Number Average Value Number Average Value
LOANS ORIGINATED 66 $175,744 16 $174,866 4 $130,402 APPLICATIONS APPROVED, NOT ACCEPTED 7 $158,024 3 $164,863 1 $46,950 APPLICATIONS DENIED 0 $0 1 $159,740 0 $0 APPLICATIONS WITHDRAWN 5 $180,470 1 $111,570 0 $0 FILES CLOSED FOR INCOMPLETENESS 0 $0 0 $0 0 $0
Aggregated Statistics For Year 2004(Based on 3 partial tracts) A) Conventional B) Refinancings C) Non-occupant Loans on Number Average Value Number Average Value Number Average Value
LOANS ORIGINATED 54 $163,304 22 $148,178 3 $136,713 APPLICATIONS APPROVED, NOT ACCEPTED 5 $256,306 7 $149,286 0 $0 APPLICATIONS DENIED 2 $173,715 1 $87,640 1 $262,920 APPLICATIONS WITHDRAWN 3 $172,243 2 $158,835 2 $202,870 FILES CLOSED FOR INCOMPLETENESS 0 $0 0 $0 0 $0
Aggregated Statistics For Year 2003(Based on 3 partial tracts) A) Conventional B) Refinancings C) Non-occupant Loans on Number Average Value Number Average Value Number Average Value
LOANS ORIGINATED 57 $139,050 75 $136,319 5 $113,388 APPLICATIONS APPROVED, NOT ACCEPTED 4 $164,315 7 $119,599 0 $0 APPLICATIONS DENIED 1 $68,860 1 $92,020 0 $0 APPLICATIONS WITHDRAWN 5 $163,988 2 $96,290 1 $136,470 FILES CLOSED FOR INCOMPLETENESS 0 $0 1 $250,400 0 $0
Detailed PMIC statistics for the following Tracts:
0005.00
, 0006.00 , 0007.00 Fire-safe hotels and motels in Sycamore, Illinois:
Stratford Inn, 355 W State St, Sycamore, Illinois 60178 Phone: (815) 895-6789, Fax: (815) 895-6563
Comfort Inn, 1475 S Peace Rd, Sycamore, Illinois 60178 Phone: (815) 895-4979, Fax: (815) 895-5069
America's Best Value Inn, 1860 Dekalb Ave, Sycamore, Illinois 60178 Phone: (815) 899-6500, Fax: (815) 895-2321
All 3 fire-safe hotels and motels in Sycamore, Illinois
Most common first names in Sycamore, IL among deceased individuals Name Count Lived (average)
John 94 76.1 years Mary 76 80.4 years William 75 73.7 years Robert 65 71.9 years Helen 63 80.8 years George 53 77.9 years Charles 52 75.8 years James 52 70.2 years Ruth 45 77.6 years Dorothy 44 77.9 years
Most common last names in Sycamore, IL among deceased individuals Last name Count Lived (average)
Johnson 73 78.7 years Anderson 31 79.8 years Larson 30 81.8 years Carlson 25 81.4 years Miller 22 76.2 years Smith 22 70.5 years Nelson 21 81.0 years Jones 20 78.5 years Peterson 20 83.6 years Swanson 18 80.6 years
Sycamore compared to Illinois state average:
Unemployed percentage significantly below state average. Black race population percentage below state average. Median age below state average. Foreign-born population percentage below state average. House age below state average. Percentage of population with a bachelor's degree or higher above state average.
Top Patent Applicants
Joseph D. Bassett (41)
Slobodan Trifunovic (27)
Sushil N. Keswani (19)
Alan E. Zantout (12)
Benjamin D. Swedberg (11)
Daniel Joseph Ryan (10)
Daniel J. Ryan (9)
Teffy R. Chamoun (7)
Brian Moon (7)
Alan Emad Zantout (7)
Total of 262 patent applications in 2008-2024.


 Recent articles from our blog. Our writers, many of them Ph.D. graduates or candidates, create easy-to-read articles on a wide variety of topics.

 (21.2 miles
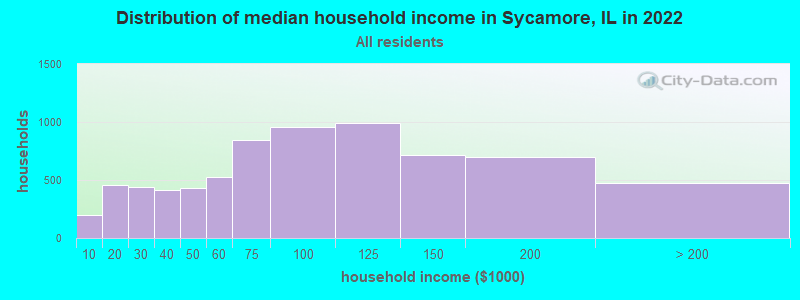


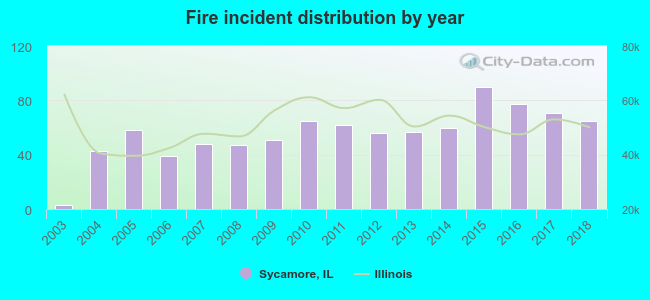 According to the data from the years 2003 - 2018 the average number of fire incidents per year is 56. The highest number of fires - 90 took place in 2015, and the least - 3 in 2003. The data has an increasing trend.
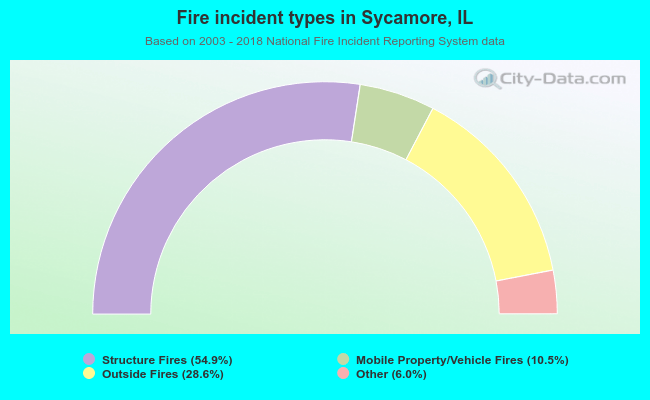 When looking into fire subcategories, the most incidents belonged to: Structure Fires (54.9%), and Outside Fires (28.6%).