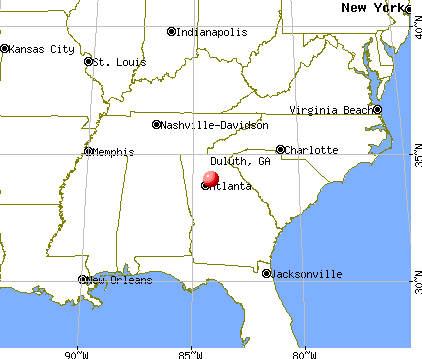
Duluth, Georgia

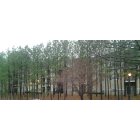
Duluth: Secluded sidestreet in Duluth, GA
Duluth: apartment complex
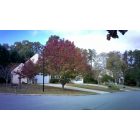
Duluth: the street in duluth
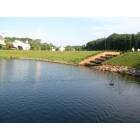
Duluth: At a lake in Duluth.
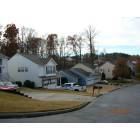
Duluth: Houses in Duluth, GA
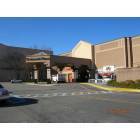
Duluth: Gwinnett Place Mall in Duluth, GA
- add
your
Submit your own pictures of this city and show them to the world
- OSM Map
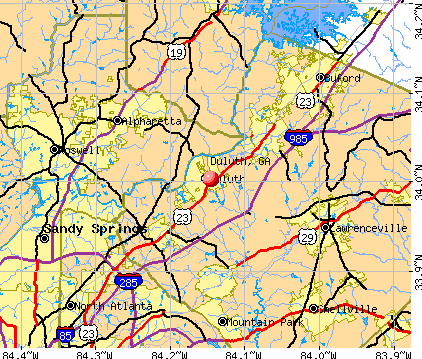
- General Map
- Google Map
- MSN Map
Population change since 2000: +44.8%
| Males: 14,935 | |
| Females: 17,099 |
| Median resident age: | 38.7 years |
| Georgia median age: | 37.6 years |
Zip codes: 30024, 30071, 30097.
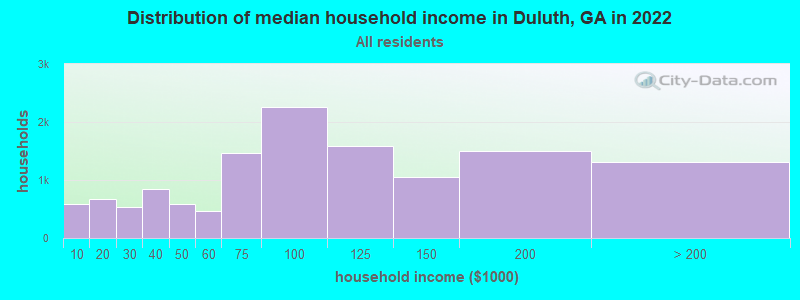
Duluth Zip Code Map| Duluth: | $90,649 |
| GA: | $72,837 |
Estimated per capita income in 2022: $42,288 (it was $29,185 in 2000)
Duluth city income, earnings, and wages data
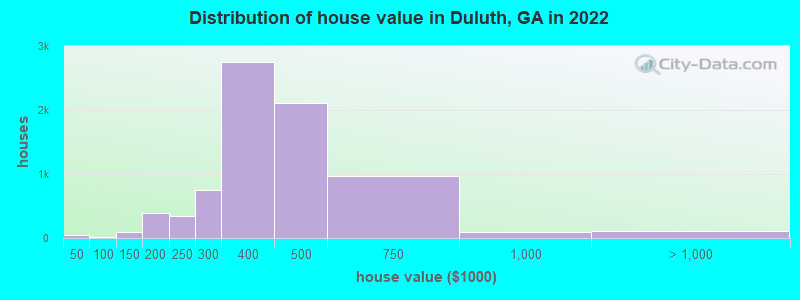
Estimated median house or condo value in 2022: $415,858 (it was $151,200 in 2000)
| Duluth: | $415,858 |
| GA: | $297,400 |
Mean prices in 2022: all housing units: $354,931; detached houses: $392,221; townhouses or other attached units: $236,512; in 3-to-4-unit structures: $211,539; in 5-or-more-unit structures: $272,075; mobile homes: $114,518
Median gross rent in 2022: $1,766.
(6.8% for White Non-Hispanic residents, 9.4% for Black residents, 5.6% for Hispanic or Latino residents, 7.3% for other race residents, 4.3% for two or more races residents)
Detailed information about poverty and poor residents in Duluth, GA


Compare current foreclosures in Duluth, GA:
| Photo | Address | Area | Beds / Baths | Price | Details |
|---|---|---|---|---|---|

|
#1
Champions Pt
Duluth, GA 30097
|
4,363 sq. feet
|
4 baths 4 beds |
show details | |

|
#2
Howell Park Rd
Duluth, GA 30096
|
1,428 sq. feet
|
2 baths 3 beds |
show details | |

|
#3
Knox Park Overlook
Duluth, GA 30097
|
2,098 sq. feet
|
2 baths 3 beds |
show details | |

|
#4
Cardinal Lake Dr
Duluth, GA 30096
|
1,884 sq. feet
|
3 baths 4 beds |
show details | |

|
#5
Glenbarr Dr
Duluth, GA 30097
|
1,720 sq. feet
|
2 baths 3 beds |
show details | |

|
#6
Landington Way
Duluth, GA 30096
|
1,244 sq. feet
|
2 baths 3 beds |
show details | |

|
#7
Beaver Oaks Dr
Duluth, GA 30096
|
1,712 sq. feet
|
2 baths 3 beds |
show details | |

|
#8
Towne Creek Cv
Duluth, GA 30097
|
2,031 sq. feet
|
2 baths 3 beds |
show details | |

|
#9
Old Ivy Rd
Duluth, GA 30096
|
3,433 sq. feet
|
2 baths 4 beds |
show details | |

|
#10
Hunting Wood Walk
Duluth, GA 30096
|
1,928 sq. feet
|
2 baths 4 beds |
show details |
| Photo | Address | Area | Beds / Baths | Price | Details |
|---|---|---|---|---|---|

|
#11
Muirfield Sq
Duluth, GA 30096
|
5,024 sq. feet
|
4 baths 5 beds |
show details | |

|
#12
Harman Park Ct
Duluth, GA 30097
|
5,438 sq. feet
|
3 baths 5 beds |
show details | |

|
#13
Oak Hampton Ct
Duluth, GA 30096
|
3,030 sq. feet
|
2 baths 3 beds |
show details | |

|
#14
Honeycomb Way
Duluth, GA 30096
|
1,412 sq. feet
|
2 baths 3 beds |
show details | |

|
#15
Bunten Rd
Duluth, GA 30096
|
1,654 sq. feet
|
2 baths 3 beds |
show details | |

|
#16
Fosco Dr
Duluth, GA 30097
|
2,128 sq. feet
|
2 baths 3 beds |
show details | |

|
#17
Briaroak Dr
Duluth, GA 30096
|
1,451 sq. feet
|
2 baths 3 beds |
show details | |

|
#18
Song Breeze Trce
Duluth, GA 30097
|
2,079 sq. feet
|
2 baths 3 beds |
show details | |

|
#19
Rogers Creek Ct
Duluth, GA 30096
|
1,736 sq. feet
|
2 baths 3 beds |
show details | |

|
#20
Unicoi Ct
Duluth, GA 30097
|
2,374 sq. feet
|
2 baths 4 beds |
show details |
| Photo | Address | Area | Beds / Baths | Price | Details |
|---|---|---|---|---|---|

|
#21
Rogers Creek Ct
Duluth, GA 30096
|
2,016 sq. feet
|
2 baths 3 beds |
show details | |

|
#22
Elkhorn Ter
Duluth, GA 30096
|
1,716 sq. feet
|
2 baths 3 beds |
show details | |

|
#23
Grady Ridge Dr
Duluth, GA 30097
|
3,347 sq. feet
|
3 baths 4 beds |
show details | |

|
#24
Nelson Dr
Duluth, GA 30096
|
1,932 sq. feet
|
1 baths 3 beds |
show details | |

|
#25
Duluth Highway 120
Duluth, GA 30096
|
1,560 sq. feet
|
2 baths 4 beds |
show details | |

|
#26
Selkirk Ln
Duluth, GA 30097
|
2,970 sq. feet
|
3 baths 5 beds |
show details | |

|
#27
Campestral Ct
Duluth, GA 30097
|
4,663 sq. feet
|
4 baths 4 beds |
show details | |

|
#28
Stillwater Dr
Duluth, GA 30096
|
1,576 sq. feet
|
2 baths 2 beds |
show details | |

|
#29
Berkeley Woods Dr
Duluth, GA 30096
|
1,342 sq. feet
|
2 baths 2 beds |
show details | |

|
#30
Olde Towne Pkwy
Duluth, GA 30097
|
2,045 sq. feet
|
2 baths 3 beds |
show details |
| Photo | Address | Area | Beds / Baths | Price | Details |
|---|---|---|---|---|---|

|
#31
Cooper Farm Way
Duluth, GA 30097
|
3,570 sq. feet
|
4 baths 5 beds |
show details | |

|
#32
Fairford Ln
Duluth, GA 30097
|
2,740 sq. feet
|
2 baths 4 beds |
show details | |

|
#33
Barsham Way
Duluth, GA 30097
|
2,228 sq. feet
|
2 baths 4 beds |
show details | |

|
#34
Harman Park Ct
Duluth, GA 30097
|
2,928 sq. feet
|
2 baths 3 beds |
show details | |

|
#35
Knotsberry Ln
Duluth, GA 30096
|
1,280 sq. feet
|
2 baths 2 beds |
show details | |

|
#36
Jester Ct
Duluth, GA 30096
|
1,102 sq. feet
|
2 baths 2 beds |
show details | |

|
#37
Meadow Peak Rd
Duluth, GA 30097
|
1,732 sq. feet
|
2 baths 3 beds |
show details | |

|
#38
Beaver Oaks Dr
Duluth, GA 30096
|
1,712 sq. feet
|
2 baths 3 beds |
show details | |

|
#39
Staunton Dr
Duluth, GA 30096
|
2,530 sq. feet
|
2 baths 4 beds |
show details | |

|
#40
Regent Walk Dr
Duluth, GA 30096
|
1,250 sq. feet
|
2 baths 3 beds |
show details |
| Photo | Address | Area | Beds / Baths | Price | Details |
|---|---|---|---|---|---|

|
#41
Garland Way
Duluth, GA 30096
|
1,824 sq. feet
|
2 baths 3 beds |
show details | |

|
#42
Mount Pleasant Trl
Duluth, GA 30097
|
7,010 sq. feet
|
5 baths 5 beds |
show details | |

|
#43
Tintern Trce
Duluth, GA 30097
|
4,213 sq. feet
|
4 baths 5 beds |
show details | |

|
#44
Sugar Cane Pl
Duluth, GA 30096
|
2,107 sq. feet
|
2 baths 3 beds |
show details | |

|
#45
Glenleigh Ln
Duluth, GA 30097
|
2,278 sq. feet
|
3 baths 5 beds |
show details | |

|
#46
Whippoorwill Cir
Duluth, GA 30097
|
1,555 sq. feet
|
2 baths 3 beds |
show details | |

|
#47
Dogwood Pond Rd
Duluth, GA 30097
|
3,190 sq. feet
|
4 baths 5 beds |
show details | |

|
#48
Oak Hampton Way
Duluth, GA 30096
|
2,735 sq. feet
|
3 baths 4 beds |
show details | |

|
#49
Cambridge View Dr
Duluth, GA 30096
|
1,938 sq. feet
|
2 baths 3 beds |
show details | |

|
Check over 1 million property listings on Foreclosure.com!
|
browse all offers | |||


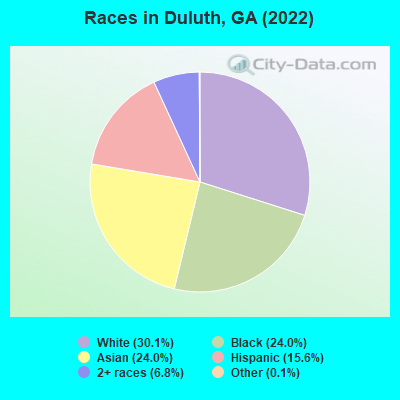
- 9,73530.1%White alone
- 7,76124.0%Black alone
- 7,75424.0%Asian alone
- 5,03615.6%Hispanic
- 2,1946.8%Two or more races
- 340.1%Other race alone
- 150.05%American Indian alone
Races in Duluth detailed stats: ancestries, foreign born residents, place of birth
According to our research of Georgia and other state lists, there were 34 registered sex offenders living in Duluth, Georgia as of April 27, 2024.
The ratio of all residents to sex offenders in Duluth is 875 to 1.
The ratio of registered sex offenders to all residents in this city is lower than the state average.
Type |
2009 |
2010 |
2011 |
2012 |
2013 |
2014 |
2015 |
2016 |
2017 |
2018 |
2019 |
2020 |
2021 |
2022 |
|---|---|---|---|---|---|---|---|---|---|---|---|---|---|---|
| Murders (per 100,000) | 0 (0.0) | 1 (3.8) | 1 (3.7) | 0 (0.0) | 1 (3.5) | 3 (10.4) | 0 (0.0) | 0 (0.0) | 2 (6.7) | 0 (0.0) | 2 (6.7) | 0 (0.0) | 0 (0.0) | 0 (0.0) |
| Rapes (per 100,000) | 2 (7.5) | 3 (11.3) | 8 (29.7) | 1 (3.6) | 4 (14.1) | 0 (0.0) | 1 (3.4) | 2 (6.7) | 3 (10.1) | 2 (6.7) | 6 (20.1) | 5 (16.7) | 7 (23.3) | 6 (18.8) |
| Robberies (per 100,000) | 16 (60.4) | 15 (56.4) | 16 (59.4) | 14 (50.8) | 19 (67.0) | 6 (20.8) | 7 (23.8) | 20 (67.3) | 13 (43.6) | 9 (30.1) | 5 (16.7) | 7 (23.4) | 9 (30.0) | 2 (6.3) |
| Assaults (per 100,000) | 45 (169.8) | 23 (86.5) | 31 (115.0) | 20 (72.6) | 18 (63.5) | 18 (62.4) | 67 (227.9) | 138 (464.3) | 10 (33.6) | 9 (30.1) | 14 (46.8) | 39 (130.2) | 29 (96.7) | 31 (97.4) |
| Burglaries (per 100,000) | 130 (490.7) | 140 (526.3) | 88 (326.5) | 80 (290.4) | 91 (321.0) | 93 (322.4) | 81 (275.5) | 70 (235.5) | 77 (258.4) | 75 (251.0) | 71 (237.5) | 47 (156.9) | 35 (116.7) | 41 (128.8) |
| Thefts (per 100,000) | 792 (2,989) | 469 (1,763) | 440 (1,633) | 453 (1,644) | 545 (1,922) | 483 (1,674) | 469 (1,595) | 529 (1,780) | 405 (1,359) | 442 (1,479) | 367 (1,228) | 346 (1,155) | 301 (1,004) | 331 (1,040) |
| Auto thefts (per 100,000) | 27 (101.9) | 34 (127.8) | 15 (55.7) | 23 (83.5) | 19 (67.0) | 21 (72.8) | 20 (68.0) | 44 (148.0) | 29 (97.3) | 26 (87.0) | 25 (83.6) | 25 (83.5) | 33 (110.1) | 17 (53.4) |
| Arson (per 100,000) | 1 (3.8) | 0 (0.0) | 0 (0.0) | 0 (0.0) | 2 (7.1) | 0 (0.0) | 0 (0.0) | 1 (3.4) | 1 (3.4) | 1 (3.3) | 1 (3.3) | 0 (0.0) | 0 (0.0) | 0 (0.0) |
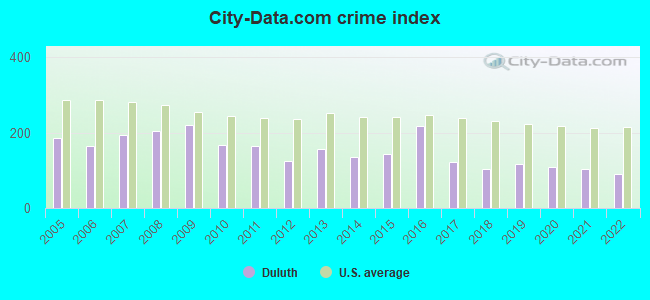
| City-Data.com crime index | 220.2 | 168.3 | 164.6 | 125.4 | 155.9 | 134.9 | 144.0 | 218.0 | 121.5 | 104.1 | 116.2 | 110.3 | 104.1 | 91.3 |
The City-Data.com crime index weighs serious crimes and violent crimes more heavily. Higher means more crime, U.S. average is 246.1. It adjusts for the number of visitors and daily workers commuting into cities.
Crime rate in Duluth detailed stats: murders, rapes, robberies, assaults, burglaries, thefts, arson
Full-time law enforcement employees in 2021, including police officers: 76 (59 officers - 52 male; 7 female).
| Officers per 1,000 residents here: | 1.97 |
| Georgia average: | 2.45 |
 Recent articles from our blog. Our writers, many of them Ph.D. graduates or candidates, create easy-to-read articles on a wide variety of topics.

 | Where to live- Cumming, Alpharetta, Roswell or Duluth? (6 replies) |
| Duluth getting $4,000 per month apartments (55 replies) |
| Houston-Based Shipley Do-Nuts opening 30 Georgia locations starting in Duluth (9 replies) |
| What are your opinions of Duluth, Ga.? (7 replies) |
| Duluth residents, how is the city to you? (31 replies) |
| Moving to Duluth? (6 replies) |
Latest news from Duluth, GA collected exclusively by city-data.com from local newspapers, TV, and radio stations
Ancestries: European (5.6%), American (5.3%), English (4.4%), Scotch-Irish (2.8%), German (2.1%), Irish (1.9%).
Current Local Time: EST time zone
Elevation: 1100 feet
Land area: 8.81 square miles.
Population density: 3,638 people per square mile (average).
9,992 residents are foreign born (18.6% Asia, 7.1% Latin America).
| This city: | 30.9% |
| Georgia: | 10.4% |
Median real estate property taxes paid for housing units with mortgages in 2022: $4,100 (1.0%)
Median real estate property taxes paid for housing units with no mortgage in 2022: $3,053 (0.8%)
Nearest city with pop. 50,000+: Johns Creek, GA (3.9 miles  , pop. 76,728).
Nearest city with pop. 200,000+: Atlanta, GA (22.4 miles , pop. 416,474).
Nearest city with pop. 1,000,000+: Chicago, IL (575.2 miles , pop. 2,896,016).
Nearest cities:
), ), ), Latitude: 34.00 N, Longitude: 84.15 W
Daytime population change due to commuting: +8,189 (+25.3%)
Workers who live and work in this city: 4,736 (26.2%)
Duluth, Georgia accommodation & food services, waste management - Economy and Business Data
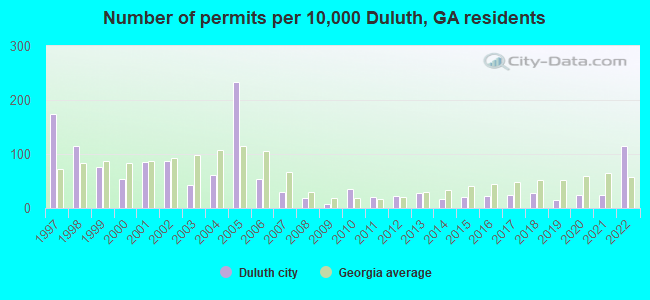
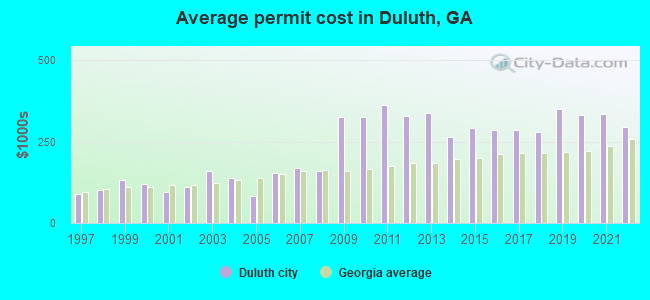
Single-family new house construction building permits:
- 2022: 252 buildings, average cost: $292,800
- 2021: 55 buildings, average cost: $335,000
- 2020: 52 buildings, average cost: $331,700
- 2019: 32 buildings, average cost: $350,000
- 2018: 63 buildings, average cost: $279,800
- 2017: 55 buildings, average cost: $285,700
- 2016: 49 buildings, average cost: $284,500
- 2015: 47 buildings, average cost: $289,500
- 2014: 38 buildings, average cost: $265,000
- 2013: 62 buildings, average cost: $336,800
- 2012: 50 buildings, average cost: $327,800
- 2011: 46 buildings, average cost: $362,700
- 2010: 79 buildings, average cost: $325,600
- 2009: 15 buildings, average cost: $325,500
- 2008: 42 buildings, average cost: $161,300
- 2007: 66 buildings, average cost: $168,300
- 2006: 117 buildings, average cost: $153,100
- 2005: 517 buildings, average cost: $83,300
- 2004: 138 buildings, average cost: $137,600
- 2003: 93 buildings, average cost: $161,100
- 2002: 193 buildings, average cost: $108,500
- 2001: 187 buildings, average cost: $95,400
- 2000: 118 buildings, average cost: $120,500
- 1999: 169 buildings, average cost: $131,700
- 1998: 255 buildings, average cost: $101,800
- 1997: 385 buildings, average cost: $88,500
| Here: | 2.7% |
| Georgia: | 2.9% |
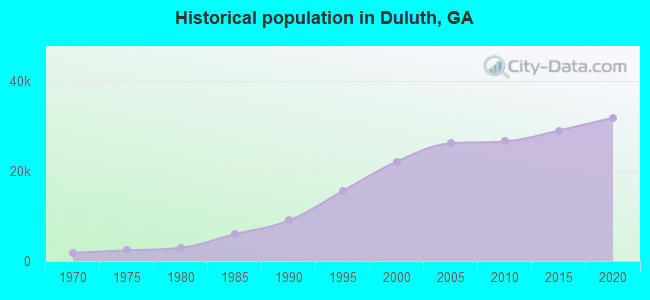
Population change in the 1990s: +12,029 (+119.2%).
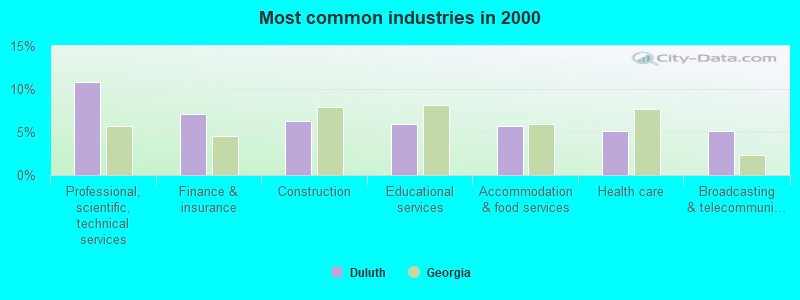
- Professional, scientific, technical services (10.8%)
- Finance & insurance (7.1%)
- Construction (6.3%)
- Educational services (5.9%)
- Accommodation & food services (5.7%)
- Health care (5.2%)
- Broadcasting & telecommunications (5.1%)
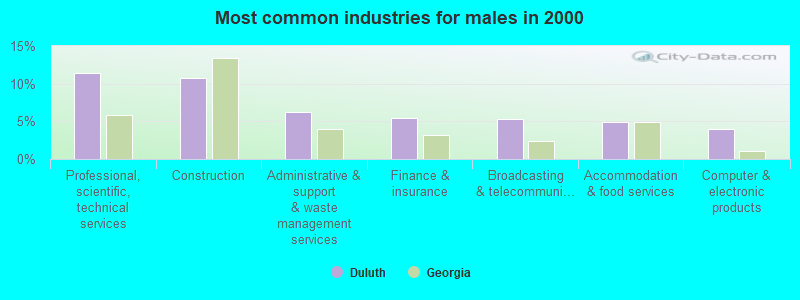
- Professional, scientific, technical services (11.4%)
- Construction (10.8%)
- Administrative & support & waste management services (6.3%)
- Finance & insurance (5.4%)
- Broadcasting & telecommunications (5.3%)
- Accommodation & food services (4.9%)
- Computer & electronic products (4.0%)
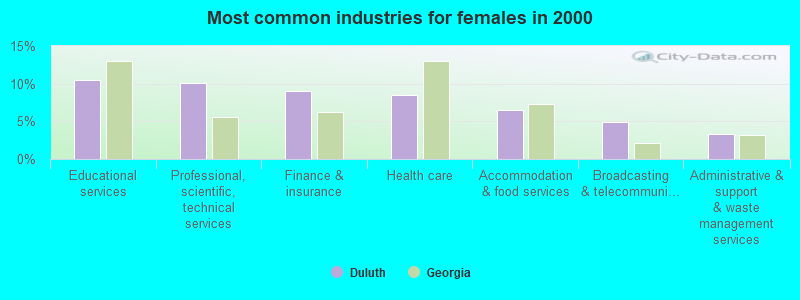
- Educational services (10.4%)
- Professional, scientific, technical services (10.1%)
- Finance & insurance (9.0%)
- Health care (8.4%)
- Accommodation & food services (6.5%)
- Broadcasting & telecommunications (4.9%)
- Administrative & support & waste management services (3.3%)

- Computer specialists (6.7%)
- Other management occupations, except farmers and farm managers (6.0%)
- Other sales and related occupations, including supervisors (4.5%)
- Top executives (3.9%)
- Sales representatives, services, wholesale and manufacturing (3.7%)
- Other office and administrative support workers, including supervisors (3.7%)
- Secretaries and administrative assistants (3.3%)
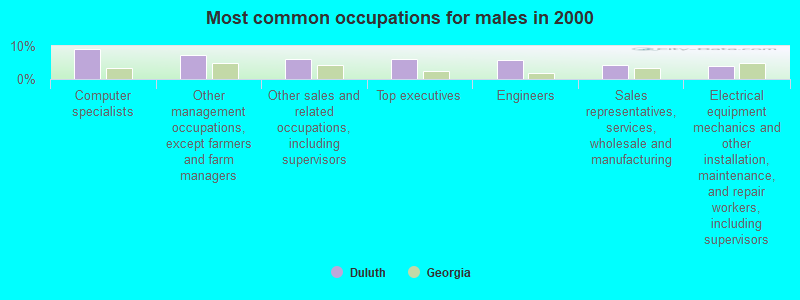
- Computer specialists (9.1%)
- Other management occupations, except farmers and farm managers (7.4%)
- Other sales and related occupations, including supervisors (6.1%)
- Top executives (6.0%)
- Engineers (5.7%)
- Sales representatives, services, wholesale and manufacturing (4.3%)
- Electrical equipment mechanics and other installation, maintenance, and repair workers, including supervisors (4.0%)

- Secretaries and administrative assistants (6.9%)
- Other office and administrative support workers, including supervisors (6.2%)
- Preschool, kindergarten, elementary, and middle school teachers (6.0%)
- Customer service representatives (4.8%)
- Other management occupations, except farmers and farm managers (4.5%)
- Computer specialists (4.1%)
- Accountants and auditors (4.1%)
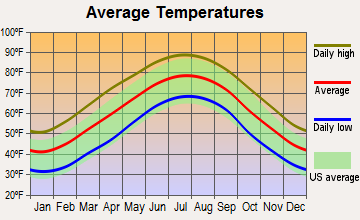
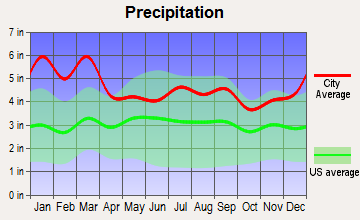
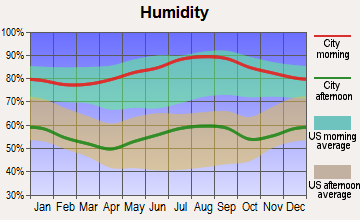
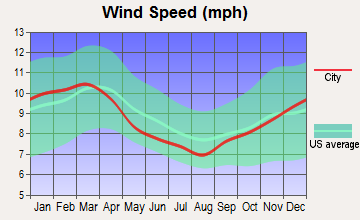
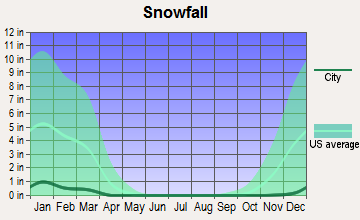
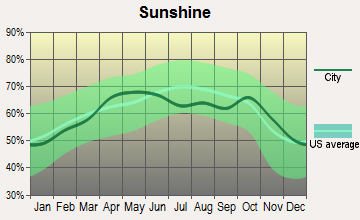
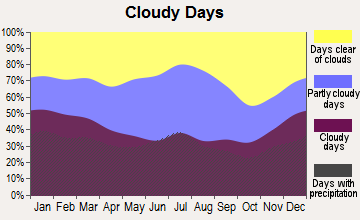
Average climate in Duluth, Georgia
Based on data reported by over 4,000 weather stations
(lower is better)
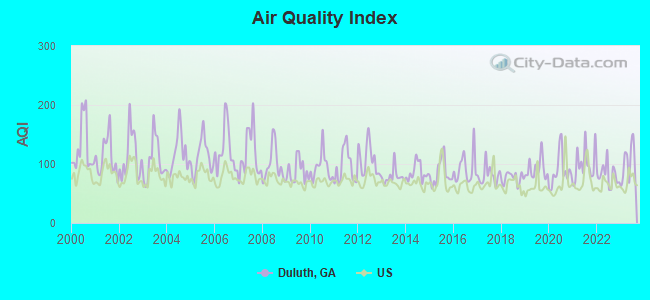
Air Quality Index (AQI) level in 2023 was 102. This is significantly worse than average.
| City: | 102 |
| U.S.: | 73 |
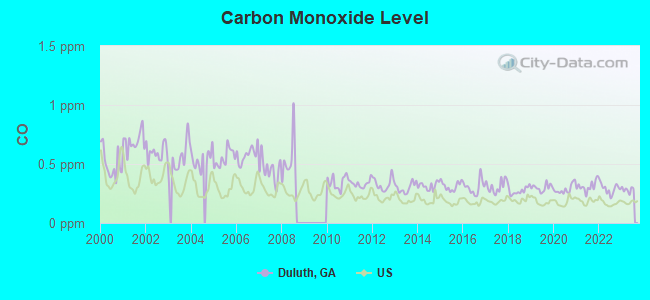
Carbon Monoxide (CO) [ppm] level in 2023 was 0.282. This is about average. Closest monitor was 11.6 miles away from the city center.
| City: | 0.282 |
| U.S.: | 0.251 |
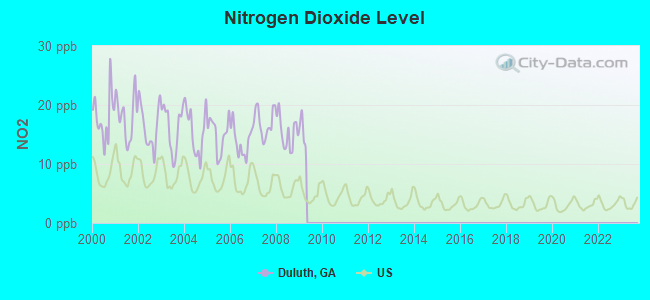
Nitrogen Dioxide (NO2) [ppb] level in 2008 was 15.3. This is significantly worse than average. Closest monitor was 11.6 miles away from the city center.
| City: | 15.3 |
| U.S.: | 5.1 |
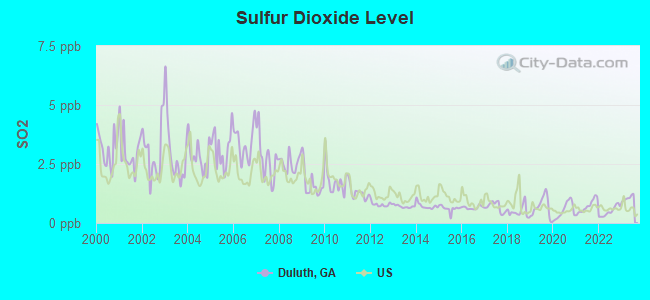
Sulfur Dioxide (SO2) [ppb] level in 2023 was 1.05. This is significantly better than average. Closest monitor was 21.2 miles away from the city center.
| City: | 1.05 |
| U.S.: | 1.51 |

Ozone [ppb] level in 2023 was 28.5. This is about average. Closest monitor was 5.2 miles away from the city center.
| City: | 28.5 |
| U.S.: | 33.3 |
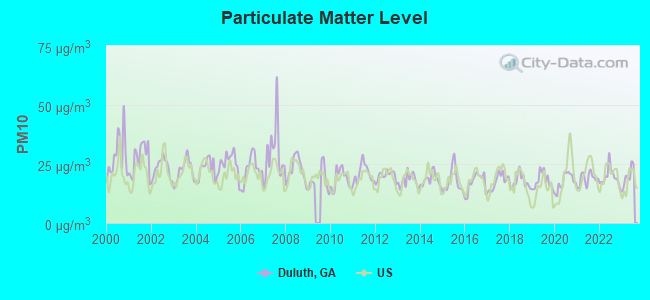
Particulate Matter (PM10) [µg/m3] level in 2023 was 19.7. This is about average. Closest monitor was 10.4 miles away from the city center.
| City: | 19.7 |
| U.S.: | 19.2 |
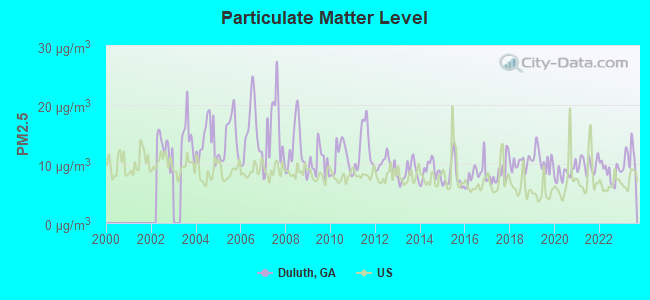
Particulate Matter (PM2.5) [µg/m3] level in 2023 was 11.1. This is worse than average. Closest monitor was 5.2 miles away from the city center.
| City: | 11.1 |
| U.S.: | 8.1 |
Tornado activity:
Duluth-area historical tornado activity is slightly above Georgia state average. It is 52% greater than the overall U.S. average.
On 11/22/1992, a category F4 (max. wind speeds 207-260 mph) tornado 20.0 miles away from the Duluth city center injured 46 people and caused between $5,000,000 and $50,000,000 in damages.
On 4/3/1974, a category F4 tornado 27.5 miles away from the city center killed 6 people and injured 30 people and caused between $500,000 and $5,000,000 in damages.
Earthquake activity:
Duluth-area historical earthquake activity is significantly above Georgia state average. It is 52% greater than the overall U.S. average.On 4/29/2003 at 08:59:39, a magnitude 4.9 (4.4 MB, 4.6 MW, 4.9 LG, Class: Light, Intensity: IV - V) earthquake occurred 91.4 miles away from Duluth center
On 8/2/1974 at 08:52:09, a magnitude 4.9 (4.3 MB, 4.9 LG) earthquake occurred 95.5 miles away from the city center
On 4/29/2003 at 08:59:39, a magnitude 4.6 (4.6 MW, Depth: 12.3 mi) earthquake occurred 91.4 miles away from the city center
On 11/30/1973 at 07:48:41, a magnitude 4.7 (4.7 MB, 4.6 ML) earthquake occurred 124.7 miles away from the city center
On 1/18/1999 at 07:00:53, a magnitude 4.8 (4.8 MB, 4.0 LG, Depth: 0.6 mi) earthquake occurred 183.6 miles away from the city center
On 8/9/2020 at 12:07:37, a magnitude 5.1 (5.1 MW, Depth: 4.7 mi, Class: Moderate, Intensity: VI - VII) earthquake occurred 242.8 miles away from Duluth center
Magnitude types: regional Lg-wave magnitude (LG), body-wave magnitude (MB), local magnitude (ML), moment magnitude (MW)
Natural disasters:
The number of natural disasters in Gwinnett County (9) is smaller than the US average (15).Major Disasters (Presidential) Declared: 4
Emergencies Declared: 4
Causes of natural disasters: Winter Storms: 3, Floods: 2, Hurricanes: 2, Storms: 2, Drought: 1, Snowfall: 1, Tornado: 1, Other: 1 (Note: some incidents may be assigned to more than one category).
Main business address for: ROPER INDUSTRIES INC /DE/ (INDUSTRIAL INSTRUMENTS FOR MEASUREMENT, DISPLAY, AND CONTROL), INNOTRAC CORP (SERVICES-BUSINESS SERVICES, NEC), DELTA APPAREL INC (WHOLESALE-APPAREL, PIECE GOODS & NOTIONS), CONCURRENT COMPUTER CORP/DE (ELECTRONIC COMPUTERS), WEGENER CORP (RADIO & TV BROADCASTING & COMMUNICATIONS EQUIPMENT), AGCO CORP /DE (FARM MACHINERY & EQUIPMENT), GLENAYRE TECHNOLOGIES INC (RADIO & TV BROADCASTING & COMMUNICATIONS EQUIPMENT), GLOBAL PREFERRED HOLDINGS INC (LIFE INSURANCE).
Hospitals and medical centers in Duluth:
Colleges/Universities in Duluth:
- Aviation Institute of Maintenance-Atlanta (Full-time enrollment: 678; Location: 2025 Satellite Pointe; Private, for-profit; Website: www.aviation.edu/AIM-Atlanta/default.aspx)
- ITT Technical Institute-Duluth (Full-time enrollment: 568; Location: 10700 Abbotts Bridge Rd-Ste 190; Private, for-profit; Website: www.itt-tech.edu)
- Atlanta Institute of Music (Full-time enrollment: 178; Location: 2875 Breckinridge Blvd., Suite 700; Private, for-profit; Website: aimm.edu)
Colleges/universities with over 2000 students nearest to Duluth:
- Gwinnett Technical College (about 6 miles; Lawrenceville, GA; Full-time enrollment: 5,138)
- Georgia Gwinnett College (about 9 miles; Lawrenceville, GA; FT enrollment: 7,993)
- Strayer University-Georgia (about 12 miles; Atlanta, GA; FT enrollment: 4,447)
- The Art Institute of Atlanta (about 13 miles; Atlanta, GA; FT enrollment: 3,140)
- Georgia Piedmont Technical College (about 16 miles; Clarkston, GA; FT enrollment: 3,276)
- Emory University (about 18 miles; Atlanta, GA; FT enrollment: 14,382)
- DeVry University-Georgia (about 19 miles; Decatur, GA; FT enrollment: 4,157)
Public high schools in Duluth:
- NORTHVIEW HIGH SCHOOL (Students: 2,743, Location: 10625 PARSONS RD, Grades: 9-12)
- DULUTH HIGH SCHOOL (Students: 2,197, Location: 3737 BROCK RD, Grades: 9-12)
- GEORGIA CONNECTIONS ACADEMY (Location: 2763 MEADOW CHURCH RD STE 208, Grades: KG-12, Charter school)
Private high school in Duluth:
Biggest public elementary/middle schools in Duluth:
- HULL MIDDLE SCHOOL (Students: 2,304, Location: 1950 OLD PEACHTREE RD, Grades: 6-8)
- DULUTH MIDDLE SCHOOL (Students: 1,846, Location: 3200 PLEASANT HILL RD, Grades: 6-8)
- RIVER TRAIL MIDDLE SCHOOL (Students: 1,493, Location: 10795 ROGERS CIR, Grades: 6-8)
- M. H. MASON ELEMENTARY SCHOOL (Students: 1,388, Location: 3030 BUNTEN RD, Grades: PK-5)
- LOUISE RADLOFF MIDDLE SCHOOL (Students: 1,090, Location: 3939 SHACKLEFORD RD, Grades: 6-8)
- WILSON CREEK ELEMENTARY SCHOOL (Students: 881, Location: 6115 WILSON RD, Grades: PK-5)
- CHARLES BRANT CHESNEY ELEMENTARY SCHOOL (Students: 831, Location: 3878 OLD NORCROSS RD, Grades: PK-5)
- ABBOTTS HILL ELEMENTARY SCHOOL (Students: 825, Location: 5575 ABBOTTS BRIDGE RD, Grades: PK-5)
- FINDLEY OAKS ELEMENTARY SCHOOL (Students: 818, Location: 5880 FINDLEY CHASE DR, Grades: PK-5)
- HARRIS ELEMENTARY SCHOOL (Students: 719, Location: 3123 CLAIBORNE DR, Grades: PK-5)
Private elementary/middle schools in Duluth:
- NOTRE DAME ACADEMY (Students: 479, Location: 4635 RIVER GREEN PKWY, Grades: PK-8)
- DULUTH ADVENTIST CHRISTIAN SCHOOL (Students: 159, Location: 2959 DULUTH HIGHWAY 120, Grades: KG-8)
- DULUTH MONTESSORI SCHOOL (Students: 131, Location: 2997 MAIN ST, Grades: PK-5)
- CREME DE LA CREME (Students: 20, Location: 2349 MEADOW CHURCH RD, Grades: PK-1)
User-submitted facts and corrections:
- EMORY NORTHLAKE REGIONAL MEDICAL CEN (about 12 miles; TUCKER, GA is now closed added by bill
- Closest hospital is in Duluth itself--Joan Glancy Memorial Hospital
Points of interest:
Notable locations in Duluth: Duluth Business Park (A), River Green Business Park (B), Duluth Police Station (C), Gwinnett County Fire and Emergency Services Station 7 (D), Southern Railway Museum (E), Duluth Town Hall (F), Glancy Rehabilitation Center (G). Display/hide their locations on the map
Shopping Centers: Duluth Plaza Shopping Center (1), Proctor Square Shopping Center (2), Berkeley Corners Shopping Center (3), Duluth Station Shopping Center (4), French Quarter Shopping Center (5), Howell Center Shopping Center (6), Mooring Plaza Shopping Center (7), Peachtree Hill Shopping Center (8). Display/hide their locations on the map
Main business address in Duluth include: CONCURRENT COMPUTER CORP/DE (A), AGCO CORP /DE (B). Display/hide their locations on the map
Church in Duluth: Open Arms Church (A). Display/hide its location on the map
Cemeteries: Duluth Cemetery (1), Goodwin Cemetery (2). Display/hide their locations on the map
Reservoir: Norman Lake (A). Display/hide its location on the map
Parks in Duluth include: Chattahoochee National Recreation Area (1), Pleasant Hill Park (2). Display/hide their locations on the map
Tourist attractions: Hudgens Center for the Arts Children's Arts Museum (6400 Sugarloaf Parkway), Children's Arts Museum Hudgens Center for the Arts (6400 Sugarloaf Parkway), National Railway Historical Society (Cultural Attractions- Events- & Facilities; 3595 Old Peachtree Road), Laser Quest (Amusement & Theme Parks; 3650 Satellite Boulevard), Gwinnett Travel (3500 Gwinnett Place Dr Ste 8), Classic Flowers and Gifts (3750 Venture Drive), PGA Travel (Recreational Trips & Guides; 4355 River Green Parkway).
Hotels: Amerisuites John's Creek (11505 Medlock Bridge Rd), Gwinnett Conv Visitors Bureau (6500 Sugarloaf Pkwy), Extended Stay America (3430 Venture Parkway), Atlanta Marriott Gwinnett Pl (1775 Pleasant Hill Rd), Caesar's World Marketing Office (2805 Peachtree Industrial), Four Seasons Thrift Shop (3166 Buford Highway), Amerisuites (11505 Medlock Bridge Road), Days Inn Gwinnett Place Mall (1920 Pleasant Hill Road), Days Inn Gwinnett (1920 Pleasant Hill Road).
Birthplace of: Danny Buggs - Football player, George Rogers (American football) - College football player, Gershom Bigham - College football player (UAB Blazers), James Mason (golfer) - Professional golfer, Ralph Sampson III - Basketball player, Robby Bostain - College basketball player (Furman Paladins).
| This city: | 2.5 people |
| Georgia: | 2.6 people |
| This city: | 65.1% |
| Whole state: | 68.5% |
| This city: | 5.3% |
| Whole state: | 5.9% |
Likely homosexual households (counted as self-reported same-sex unmarried-partner households)
- Lesbian couples: 0.3% of all households
- Gay men: 0.2% of all households
6 people in residential treatment centers for adults in 2010
63 people in nursing homes in 2000
2 people in other workers' dormitories in 2000
Banks with most branches in Duluth (2011 data):
- SunTrust Bank: Medlock Bridge Branch, First National Bank Of Gwinnett Bran, Courier Service Branch, Duluth Station Branch, Gwinnett Place Branch, Promendade Branch. Info updated 2010/05/27: Bank assets: $171,291.7 mil, Deposits: $129,833.2 mil, headquarters in Atlanta, GA, positive income, Commercial Lending Specialization, 1716 total offices, Holding Company: Suntrust Banks, Inc.
- Bank of America, National Association: Pleasant Hill Branch, Gwinnett Place Drive-Thru Branch, Sugarloaf Parkway Financial Branch, Medlock Abbotts Bridge Bkg. Ctr. Bra, Gwinnett Place Branch, Howell Ferry Branch. Info updated 2009/11/18: Bank assets: $1,451,969.3 mil, Deposits: $1,077,176.8 mil, headquarters in Charlotte, NC, positive income, 5782 total offices, Holding Company: Bank Of America Corporation
- Wells Fargo Bank, National Association: Peachtree Hill Branch, Sugarloaf Branch, Steve Reynolds, Medlock Bridge Branch, Breckenridge Branch, Gwinnett Place Mall. Info updated 2011/04/05: Bank assets: $1,161,490.0 mil, Deposits: $905,653.0 mil, headquarters in Sioux Falls, SD, positive income, 6395 total offices, Holding Company: Wells Fargo & Company
- PNC Bank, National Association: Duluth Medlock Bridge Branch, Duluth Branch, Sugarloaf Circle Branch. Info updated 2012/03/20: Bank assets: $263,309.6 mil, Deposits: $197,343.0 mil, headquarters in Wilmington, DE, positive income, Commercial Lending Specialization, 3085 total offices, Holding Company: Pnc Financial Services Group, Inc., The
- Branch Banking and Trust Company: Sugarloaf Civic Center Branch, Duluth Branch, Duluth Loan Production Branch. Info updated 2010/03/29: Bank assets: $168,867.6 mil, Deposits: $127,549.5 mil, headquarters in Winston Salem, NC, positive income, Commercial Lending Specialization, 1793 total offices, Holding Company: Bb&T Corporation
- JPMorgan Chase Bank, National Association: Duluth Reynolds Crossing Branch at 3780 Old Norcross Rd, branch established on 2008/09/25; Old Peachtree & Buford Hwy Banking C at 2697 Old Peachtree Rd, branch established on 2010/10/25. Info updated 2011/11/10: Bank assets: $1,811,678.0 mil, Deposits: $1,190,738.0 mil, headquarters in Columbus, OH, positive income, International Specialization, 5577 total offices, Holding Company: Jpmorgan Chase & Co.
- First-Citizens Bank & Trust Company: Sugerloaf Branch at 2140 Satellite Blvd, branch established on 2000/02/14; 5960 States Bridge Road at 5960 States Bridge Road, branch established on 1998/08/31. Info updated 2011/10/11: Bank assets: $20,566.4 mil, Deposits: $17,596.8 mil, headquarters in Raleigh, NC, positive income, Commercial Lending Specialization, 433 total offices, Holding Company: First Citizens Bancshares, Inc.
- Regions Bank: Satellite Place Branch at 3285 Satellite Boulevard, branch established on 2000/06/29; Duluth Financial Center Branch at 1581 Satellite Boulevard, branch established on 2006/04/14. Info updated 2011/02/24: Bank assets: $123,368.2 mil, Deposits: $98,301.3 mil, headquarters in Birmingham, AL, positive income, Commercial Lending Specialization, 1778 total offices, Holding Company: Regions Financial Corporation
- First Intercontinental Bank: Duluth Branch at 2230 Pleasant Hill Road, branch established on 2006/11/08; Johns Creek Branch at 10820 Abbotts Bridge Road, branch established on 2007/06/22. Info updated 2006/11/03: Bank assets: $254.1 mil, Deposits: $221.3 mil, headquarters in Doraville, GA, positive income, Commercial Lending Specialization, 5 total offices
- 15 other banks with 16 local branches
For population 15 years and over in Duluth:
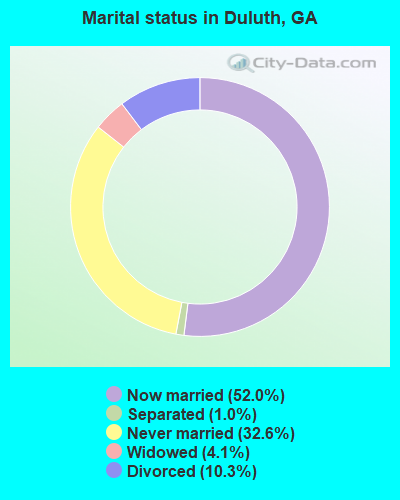
- Never married: 32.6%
- Now married: 52.0%
- Separated: 1.0%
- Widowed: 4.1%
- Divorced: 10.3%
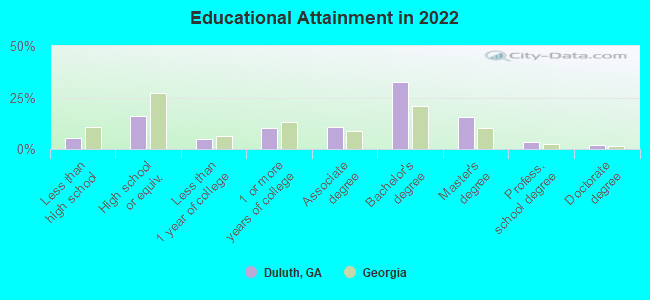
For population 25 years and over in Duluth:
- High school or higher: 94.0%
- Bachelor's degree or higher: 53.0%
- Graduate or professional degree: 20.1%
- Unemployed: 1.8%
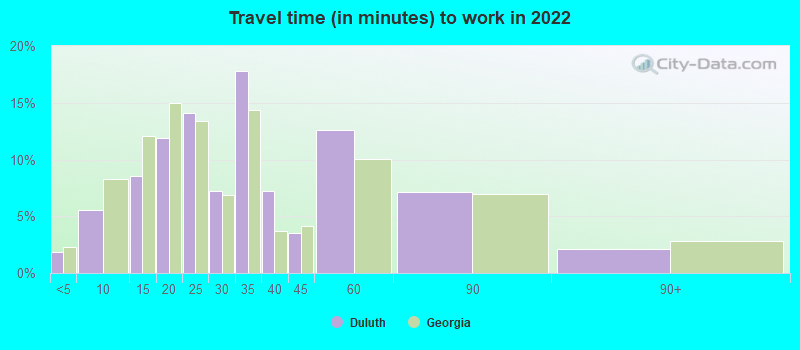
- Mean travel time to work (commute): 24.8 minutes
| Here: | 10.6 |
| Georgia average: | 12.2 |
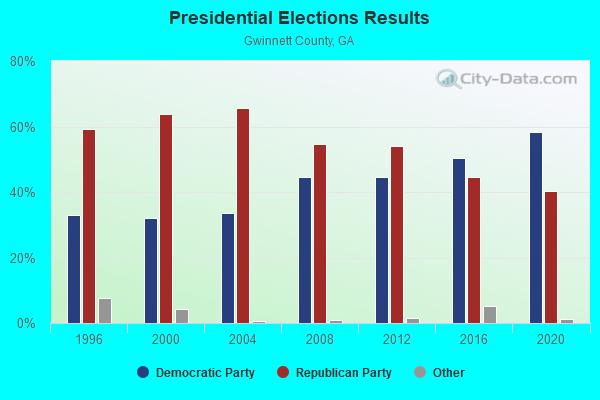
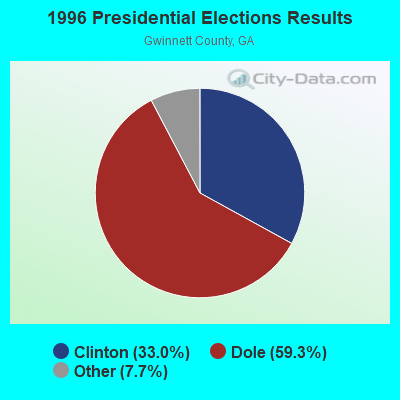
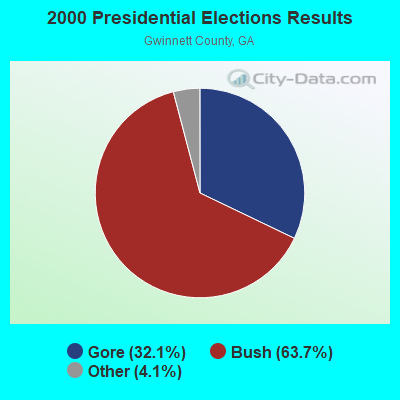
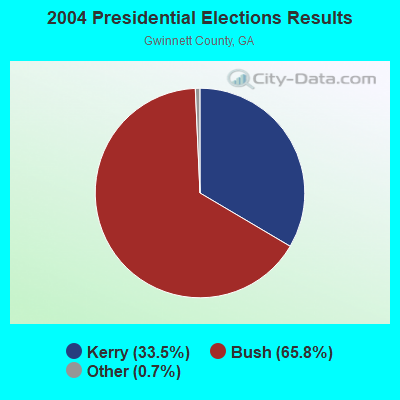
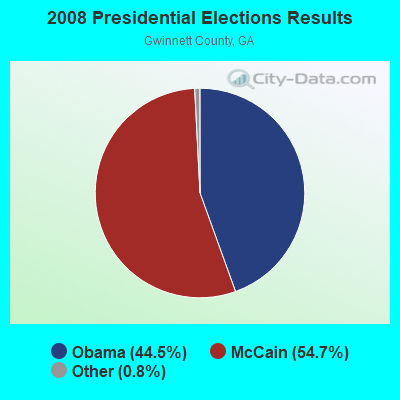
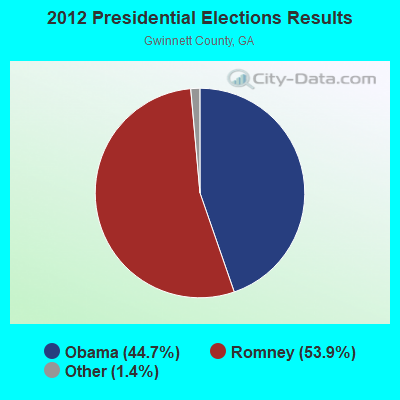


Graphs represent county-level data. Detailed 2008 Election Results
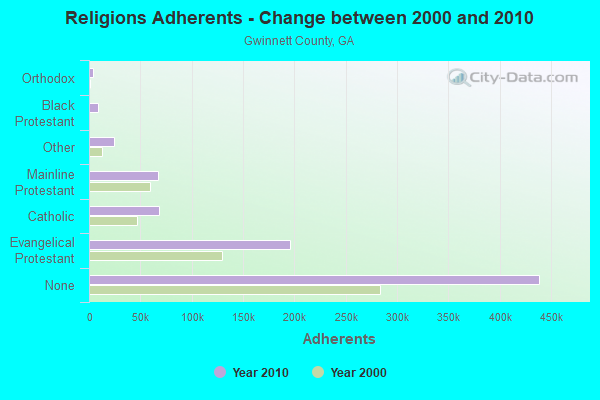
Religion statistics for Duluth, GA (based on Gwinnett County data)
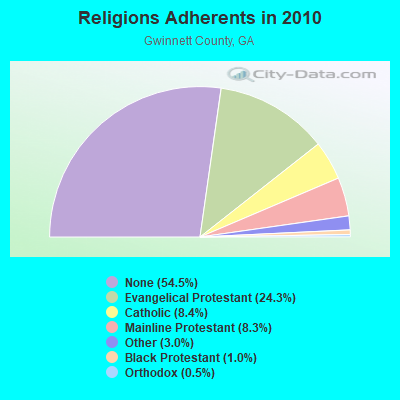
| Religion | Adherents | Congregations |
|---|---|---|
| Evangelical Protestant | 195,348 | 392 |
| Catholic | 67,781 | 12 |
| Mainline Protestant | 67,212 | 69 |
| Other | 23,940 | 57 |
| Black Protestant | 8,423 | 10 |
| Orthodox | 4,004 | 8 |
| None | 438,613 | - |
Food Environment Statistics:
| This county: | 1.62 / 10,000 pop. |
| Georgia: | 1.91 / 10,000 pop. |
| Gwinnett County: | 0.18 / 10,000 pop. |
| State: | 0.15 / 10,000 pop. |
| This county: | 0.66 / 10,000 pop. |
| Georgia: | 0.86 / 10,000 pop. |
| This county: | 3.94 / 10,000 pop. |
| State: | 5.12 / 10,000 pop. |
| Here: | 9.28 / 10,000 pop. |
| Georgia: | 7.41 / 10,000 pop. |
| This county: | 8.4% |
| Georgia: | 10.4% |
| This county: | 25.6% |
| Georgia: | 27.8% |
| Gwinnett County: | 16.4% |
| Georgia: | 14.6% |
Health and Nutrition:
| Duluth: | 50.9% |
| Georgia: | 48.9% |
| Here: | 49.6% |
| Georgia: | 46.5% |
| Here: | 28.0 |
| State: | 28.9 |
| Here: | 19.4% |
| Georgia: | 20.4% |
| Here: | 10.7% |
| Georgia: | 10.8% |
| Here: | 6.8 |
| Georgia: | 6.7 |
| Duluth: | 30.3% |
| Georgia: | 33.5% |
| Duluth: | 59.3% |
| Georgia: | 56.2% |
| Duluth: | 82.8% |
| Georgia: | 80.8% |
More about Health and Nutrition of Duluth, GA Residents
| Local government employment and payroll (March 2022) | |||||
| Function | Full-time employees | Monthly full-time payroll | Average yearly full-time wage | Part-time employees | Monthly part-time payroll |
|---|---|---|---|---|---|
| Police Protection - Officers | 62 | $425,677 | $82,389 | 6 | $17,307 |
| Police - Other | 18 | $81,353 | $54,235 | 3 | $3,293 |
| Solid Waste Management | 15 | $80,487 | $64,390 | 3 | $7,128 |
| Financial Administration | 13 | $76,543 | $70,655 | 3 | $7,876 |
| Parks and Recreation | 11 | $62,350 | $68,018 | 23 | $19,552 |
| Judicial and Legal | 8 | $44,401 | $66,602 | 6 | $4,998 |
| Other Government Administration | 8 | $59,321 | $88,982 | 24 | $12,906 |
| Housing and Community Development (Local) | 8 | $48,763 | $73,145 | 2 | $2,653 |
| Sewerage | 2 | $9,298 | $55,788 | 0 | $0 |
| Totals for Government | 145 | $888,192 | $73,506 | 70 | $75,712 |
Duluth government finances - Expenditure in 2021 (per resident):
- Construction - General - Other: $2,012,000 ($62.81)
Parks and Recreation: $1,216,000 ($37.96)
Police Protection: $202,000 ($6.31)
Regular Highways: $169,000 ($5.28)
- Current Operations - Police Protection: $8,592,000 ($268.22)
General - Other: $3,854,000 ($120.31)
Central Staff Services: $3,447,000 ($107.60)
Regular Highways: $3,391,000 ($105.86)
Parks and Recreation: $1,964,000 ($61.31)
Financial Administration: $1,673,000 ($52.23)
Judicial and Legal Services: $1,432,000 ($44.70)
General Public Buildings: $511,000 ($15.95)
Solid Waste Management: $5,000 ($0.16)
- General - Interest on Debt: $155,000 ($4.84)
- Intergovernmental to Local - Other - General - Other: $56,000 ($1.75)
- Other Capital Outlay - Police Protection: $1,138,000 ($35.52)
Regular Highways: $46,000 ($1.44)
Parks and Recreation: $22,000 ($0.69)
Central Staff Services: $5,000 ($0.16)
Duluth government finances - Revenue in 2021 (per resident):
- Charges - Sewerage: $1,403,000 ($43.80)
Other: $458,000 ($14.30)
Parks and Recreation: $158,000 ($4.93)
Solid Waste Management: $12,000 ($0.37)
- Federal Intergovernmental - Housing and Community Development: $947,000 ($29.56)
Other: $4,000 ($0.12)
- Local Intergovernmental - Other: $11,441,000 ($357.15)
- Miscellaneous - Fines and Forfeits: $4,410,000 ($137.67)
Donations From Private Sources: $174,000 ($5.43)
Interest Earnings: $135,000 ($4.21)
General Revenue - Other: $130,000 ($4.06)
Rents: $97,000 ($3.03)
Sale of Property: $35,000 ($1.09)
- State Intergovernmental - General Local Government Support: $333,000 ($10.40)
Other: $225,000 ($7.02)
Housing and Community Development: $118,000 ($3.68)
- Tax - Property: $11,783,000 ($367.83)
Insurance Premiums Sales: $2,141,000 ($66.84)
Public Utilities Sales: $2,032,000 ($63.43)
Occupation and Business License - Other: $1,192,000 ($37.21)
Other License: $819,000 ($25.57)
Alcoholic Beverage Sales: $773,000 ($24.13)
Alcoholic Beverage License: $313,000 ($9.77)
Other: $82,000 ($2.56)
Other Selective Sales: $61,000 ($1.90)
Duluth government finances - Debt in 2021 (per resident):
- Long Term Debt - Outstanding Unspecified Public Purpose: $30,185,000 ($942.28)
Issue, Unspecified Public Purpose: $27,250,000 ($850.66)
Beginning Outstanding - Unspecified Public Purpose: $3,870,000 ($120.81)
Retired Unspecified Public Purpose: $935,000 ($29.19)
Duluth government finances - Cash and Securities in 2021 (per resident):
- Bond Funds - Cash and Securities: $25,166,000 ($785.60)
- Other Funds - Cash and Securities: $34,534,000 ($1078.04)
8.95% of this county's 2021 resident taxpayers lived in other counties in 2020 ($56,340 average adjusted gross income)
| Here: | 8.95% |
| Georgia average: | 10.21% |
0.02% of residents moved from foreign countries ($109 average AGI)
Gwinnett County: 0.02% Georgia average: 0.04%
Top counties from which taxpayers relocated into this county between 2020 and 2021:
| from DeKalb County, GA | |
| from Fulton County, GA | |
| from Cobb County, GA |
8.96% of this county's 2020 resident taxpayers moved to other counties in 2021 ($67,241 average adjusted gross income)
| Here: | 8.96% |
| Georgia average: | 9.60% |
0.02% of residents moved to foreign countries ($74 average AGI)
Gwinnett County: 0.02% Georgia average: 0.03%
Top counties to which taxpayers relocated from this county between 2020 and 2021:
| to DeKalb County, GA | |
| to Fulton County, GA | |
| to Hall County, GA |
| Businesses in Duluth, GA | ||||
| Name | Count | Name | Count | |
|---|---|---|---|---|
| AT&T | 3 | LensCrafters | 1 | |
| Abercrombie & Fitch | 1 | Little Caesars Pizza | 2 | |
| Abercrombie Kids | 1 | Macy's | 2 | |
| Advance Auto Parts | 1 | Marriott | 2 | |
| Aeropostale | 1 | Marshalls | 1 | |
| American Eagle Outfitters | 1 | MasterBrand Cabinets | 1 | |
| Applebee's | 1 | Mazda | 1 | |
| Ashley Furniture | 1 | McDonald's | 4 | |
| Audi | 1 | Men's Wearhouse | 2 | |
| AutoZone | 1 | Motherhood Maternity | 2 | |
| Avenue | 1 | New Balance | 1 | |
| BMW | 1 | Nike | 19 | |
| Bakers | 1 | Nissan | 1 | |
| Baskin-Robbins | 2 | OfficeMax | 1 | |
| Bath & Body Works | 1 | Old Navy | 1 | |
| Bed Bath & Beyond | 1 | Olive Garden | 1 | |
| Blockbuster | 3 | On The Border | 1 | |
| Burger King | 4 | Pac Sun | 1 | |
| CVS | 1 | Panda Express | 1 | |
| Casual Male XL | 1 | Panera Bread | 1 | |
| Catherines | 1 | Papa John's Pizza | 1 | |
| Chevrolet | 1 | Payless | 2 | |
| Chick-Fil-A | 3 | Penske | 3 | |
| Chipotle | 2 | PetSmart | 1 | |
| Cold Stone Creamery | 1 | Pizza Hut | 2 | |
| Comfort Suites | 1 | Plato's Closet | 1 | |
| Costco | 1 | Publix Super Markets | 3 | |
| Curves | 1 | Quality | 1 | |
| DHL | 1 | Quiznos | 4 | |
| Dairy Queen | 1 | RadioShack | 2 | |
| Days Inn | 1 | Red Lobster | 1 | |
| Discount Tire | 1 | Rite Aid | 3 | |
| Domino's Pizza | 1 | Rooms To Go | 2 | |
| Dunkin Donuts | 3 | Ruby Tuesday | 1 | |
| Express | 1 | SAS Shoes | 1 | |
| Extended Stay America | 1 | SONIC Drive-In | 2 | |
| Extended Stay Deluxe | 1 | Sam's Club | 1 | |
| FedEx | 31 | Sears | 2 | |
| Finish Line | 1 | Shoe Carnival | 1 | |
| Firestone Complete Auto Care | 2 | Spencer Gifts | 1 | |
| Foot Locker | 1 | Sprint Nextel | 3 | |
| Ford | 1 | Staples | 1 | |
| Forever 21 | 1 | Starbucks | 7 | |
| Fredericks Of Hollywood | 1 | Steak 'n Shake | 1 | |
| GNC | 2 | Studio 6 | 1 | |
| GameStop | 3 | Subaru | 1 | |
| Gymboree | 1 | Suburban | 1 | |
| H&R Block | 2 | Subway | 11 | |
| Havertys Furniture | 1 | T-Mobile | 8 | |
| Hilton | 2 | T.G.I. Driday's | 1 | |
| Hobby Lobby | 1 | T.J.Maxx | 2 | |
| Holiday Inn | 4 | Taco Bell | 2 | |
| Home Depot | 2 | Talbots | 1 | |
| Honda | 1 | Target | 2 | |
| Hot Topic | 1 | Toyota | 1 | |
| Hyundai | 1 | Toys"R"Us | 3 | |
| IHOP | 2 | True Value | 1 | |
| InTown Suites | 1 | U-Haul | 6 | |
| JCPenney | 2 | UPS | 32 | |
| Jimmy John's | 1 | Value City Furniture | 1 | |
| JoS. A. Bank | 1 | Vans | 2 | |
| Jones New York | 4 | Verizon Wireless | 1 | |
| Journeys | 1 | Victoria's Secret | 1 | |
| KFC | 1 | Waffle House | 5 | |
| Kohl's | 1 | Walgreens | 4 | |
| Kroger | 3 | Walmart | 1 | |
| LA Fitness | 1 | Wendy's | 4 | |
| La Quinta | 1 | Whole Foods Market | 1 | |
| Lane Furniture | 3 | |||
Strongest AM radio stations in Duluth:
- WCNN (680 AM; 50 kW; NORTH ATLANTA, GA; Owner: DICKEY BROADCASTING COMPANY)
- WSB (750 AM; 50 kW; ATLANTA, GA; Owner: CXR HOLDINGS, INC.)
- WGST (640 AM; 50 kW; ATLANTA, GA; Owner: CITICASTERS LICENSES, L.P.)
- WQXI (790 AM; 28 kW; ATLANTA, GA; Owner: JEFFERSON-PILOT COMMUNICATIONS COMPANY OF GEORGIA)
- WGUN (1010 AM; 50 kW; ATLANTA, GA; Owner: WGUN, INC.)
- WGKA (1190 AM; 25 kW; ATLANTA, GA; Owner: SALEM MEDIA OF GEORGIA, INC.)
- WAZX (1550 AM; 50 kW; SMYRNA, GA; Owner: GA-MEX BROADCASTING, INC.)
- WAOK (1380 AM; 50 kW; ATLANTA, GA; Owner: INFINITY BROADCASTING OPERATIONS, INC.)
- WFTD (1080 AM; daytime; 50 kW; MARIETTA, GA; Owner: PRIETO ENTERPRISES, INC.)
- WMLB (1160 AM; 50 kW; EAST POINT, GA; Owner: ATLANTA AREA BROADCASTING, INC.)
- WXEM (1460 AM; 5 kW; BUFORD, GA; Owner: LA FAVORITA, INC.)
- WPBS (1050 AM; 12 kW; CONYERS, GA; Owner: MIDWAY HOLINESS CHURCH, INC,)
- WPLO (610 AM; 2 kW; GRAYSON, GA; Owner: TERESA PRIETO)
Strongest FM radio stations in Duluth:
- WFOX (97.1 FM; GAINESVILLE, GA; Owner: COX RADIO, INC.)
- WABE (90.1 FM; ATLANTA, GA; Owner: BOARD OF EDUCATION, CITY OF ATLANTA)
- WYAY (106.7 FM; GAINESVILLE, GA; Owner: ABC, INC.)
- WKHX-FM (101.5 FM; MARIETTA, GA; Owner: ABC, INC.)
- WWEV-FM (91.5 FM; CUMMING, GA; Owner: CURRICULUM DEVELOPMENT FOUNDATION)
- WKLS (96.1 FM; ATLANTA, GA; Owner: CITICASTERS LICENSES, L.P.)
- WLTM (94.9 FM; ATLANTA, GA; Owner: CITICASTERS LICENSES, L.P.)
- WFSH-FM (104.7 FM; ATHENS, GA; Owner: SOUTH TEXAS BROADCASTING, INC.)
- WWWQ (100.5 FM; ANNISTON, AL; Owner: WNNX LICO, INC.)
- WNNX (99.7 FM; ATLANTA, GA; Owner: WNNX LICO, INC.)
- WSB-FM (98.5 FM; ATLANTA, GA; Owner: CXR HOLDINGS, INC.)
- WSTR (94.1 FM; SMYRNA, GA; Owner: JEFFERSON-PILOT COMMUNICATIONS COMPANY OF GEORGIA)
- WVEE (103.3 FM; ATLANTA, GA; Owner: INFINITY BROADCASTING OPERATIONS, INC.)
- WZGC (92.9 FM; ATLANTA, GA; Owner: INFINITY BROADCASTING CORP. OF ATLANTA)
- WLCL (105.7 FM; CANTON, GA; Owner: CHEROKEE BROADCASTING CO., INC.)
- W265BD (100.9 FM; WOODSTOCK, GA; Owner: IMMANUEL BROADCASTING NETWORK, INC.)
- WRFG (89.3 FM; ATLANTA, GA; Owner: RADIO FREE GEORGIA BROADCASTING FOUNDATION INC)
- W221AZ (92.1 FM; LILBURN, GA; Owner: TOCCOA FALLS COLLEGE)
- WLKQ-FM (102.3 FM; BUFORD, GA; Owner: LAKE RADIO, INC.)
- WJZZ-FM (107.5 FM; ROSWELL, GA; Owner: ROA LICENSES, LLC)
TV broadcast stations around Duluth:
- WUVG (Channel 34; ATHENS, GA; Owner: UNIVISION ATLANTA LLC)
- WAGA (Channel 5; ATLANTA, GA; Owner: FOX TELEVISION STATIONS, INC.)
- WTBS (Channel 17; ATLANTA, GA; Owner: SUPERSTATION, INC.)
- WATL (Channel 36; ATLANTA, GA; Owner: WATL, LLC)
- WGCL-TV (Channel 46; ATLANTA, GA; Owner: MEREDITH CORPORATION)
- WXIA-TV (Channel 11; ATLANTA, GA; Owner: GANNETT GEORGIA, L.P.)
- WSB-TV (Channel 2; ATLANTA, GA; Owner: WSB-TV HOLDINGS, INC.)
- WSKC-LP (Channel 59; ATLANTA, GA; Owner: KM LPTV OF ATLANTA, L.L.C.)
- WPBA (Channel 30; ATLANTA, GA; Owner: BOARD OF EDUCATION OF THE CITY OF ATLANTA)
- WIRE-CA (Channel 40; ATLANTA, GA; Owner: COMMERCIAL BROADCASTING CORP.)
- WHSG (Channel 63; MONROE, GA; Owner: TRINITY BROADCASTING NETWORK)
- WUPA (Channel 69; ATLANTA, GA; Owner: VIACOM STATIONS GROUP OF ATLANTA INC.)
- WANN-LP (Channel 32; ATLANTA, GA; Owner: PRISM BROADCASTING NETWORK, INC.)
- WDTA-LP (Channel 53; FAYETTEVILLE, GA; Owner: WORD OF GOD FELLOWSHIP, INC.)
- WTHC-LP (Channel 42; ATLANTA, GA; Owner: THE ATLANTA CHANNEL, INC.)
- WANX-LP (Channel 26; ATLANTA, GA; Owner: PRISM BROADCASTING NETWORK, INC.)
- W50AB (Channel 50; HIAWASSEE, GA; Owner: GEORGIA PUBLIC TELECOMMUNICATIONS COMMISSION)
- W24AL (Channel 24; ATLANTA, GA; Owner: VENTANA TELEVISION, INC.)
- WGTV (Channel 8; ATHENS, GA; Owner: GEORGIA PUBLIC TELECOMMUNICATIONS COMMISSION)
- WATC (Channel 57; ATLANTA, GA; Owner: COMMUNITY TELEVISION, INC.)
- WPXA (Channel 14; ROME, GA; Owner: PAXSON ATLANTA LICENSE, INC.)
- W38CU (Channel 38; ATLANTA, GA; Owner: KOREAN AMERICAN TV BROADCASTING CORP.)
- National Bridge Inventory (NBI) Statistics
- 63Number of bridges
- 997ft / 304mTotal length
- $103,021,000Total costs
- 3,310,055Total average daily traffic
- 146,432Total average daily truck traffic
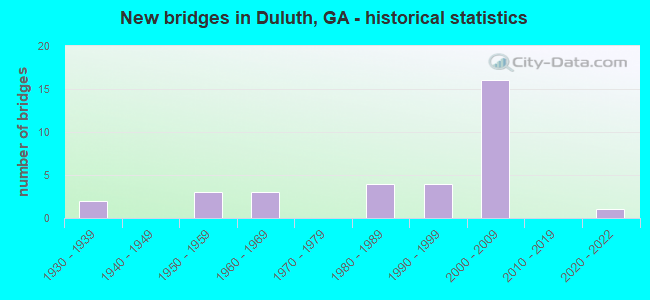
- New bridges - historical statistics
- 21930-1939
- 31950-1959
- 31960-1969
- 41980-1989
- 41990-1999
- 162000-2009
- 12020-2022
FCC Registered Commercial Land Mobile Towers: 1 (See the full list of FCC Registered Commercial Land Mobile Towers in Duluth, GA)
FCC Registered Private Land Mobile Towers: 6 (See the full list of FCC Registered Private Land Mobile Towers)
FCC Registered Broadcast Land Mobile Towers: 51 (See the full list of FCC Registered Broadcast Land Mobile Towers)
FCC Registered Microwave Towers: 38 (See the full list of FCC Registered Microwave Towers in this town)
FCC Registered Paging Towers: 9 (See the full list of FCC Registered Paging Towers)
FCC Registered Amateur Radio Licenses: 272 (See the full list of FCC Registered Amateur Radio Licenses in Duluth)
FAA Registered Aircraft Manufacturers and Dealers: 9 (See the full list of FAA Registered Manufacturers and Dealers in Duluth)
FAA Registered Aircraft: 38 (See the full list of FAA Registered Aircraft)
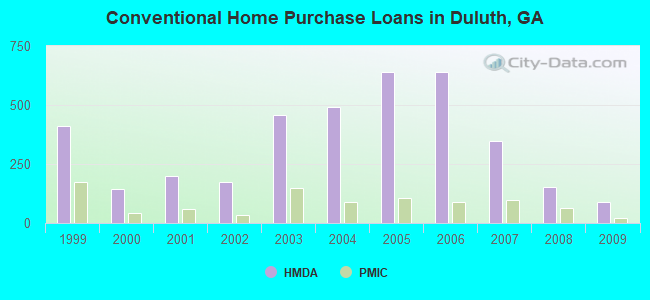
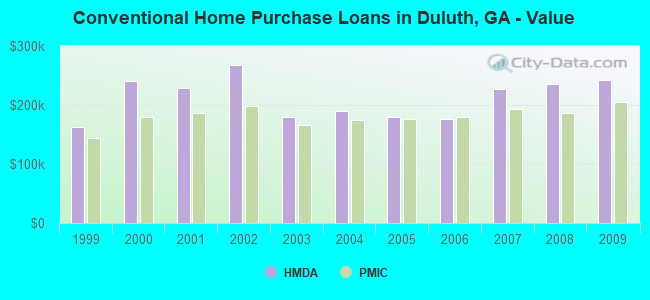
| Home Mortgage Disclosure Act Aggregated Statistics For Year 2009 (Based on 4 partial tracts) | ||||||||||||
| A) FHA, FSA/RHS & VA Home Purchase Loans | B) Conventional Home Purchase Loans | C) Refinancings | D) Home Improvement Loans | F) Non-occupant Loans on < 5 Family Dwellings (A B C & D) | G) Loans On Manufactured Home Dwelling (A B C & D) | |||||||
|---|---|---|---|---|---|---|---|---|---|---|---|---|
| Number | Average Value | Number | Average Value | Number | Average Value | Number | Average Value | Number | Average Value | Number | Average Value | |
| LOANS ORIGINATED | 87 | $164,990 | 90 | $241,849 | 366 | $199,517 | 6 | $130,592 | 21 | $172,642 | 0 | $0 |
| APPLICATIONS APPROVED, NOT ACCEPTED | 3 | $198,837 | 10 | $263,020 | 34 | $227,571 | 1 | $49,220 | 3 | $189,537 | 0 | $0 |
| APPLICATIONS DENIED | 15 | $168,562 | 18 | $364,925 | 137 | $247,359 | 9 | $72,474 | 10 | $199,024 | 1 | $311,870 |
| APPLICATIONS WITHDRAWN | 11 | $206,277 | 21 | $274,522 | 105 | $221,309 | 1 | $116,240 | 7 | $134,939 | 0 | $0 |
| FILES CLOSED FOR INCOMPLETENESS | 3 | $146,840 | 4 | $221,820 | 24 | $230,003 | 1 | $54,560 | 1 | $116,500 | 0 | $0 |
Detailed HMDA statistics for the following Tracts: 0502.04 , 0502.05, 0502.06
| Private Mortgage Insurance Companies Aggregated Statistics For Year 2009 (Based on 4 partial tracts) | ||||
| A) Conventional Home Purchase Loans | B) Refinancings | |||
|---|---|---|---|---|
| Number | Average Value | Number | Average Value | |
| LOANS ORIGINATED | 22 | $204,802 | 18 | $175,894 |
| APPLICATIONS APPROVED, NOT ACCEPTED | 8 | $205,656 | 4 | $246,365 |
| APPLICATIONS DENIED | 3 | $209,600 | 3 | $155,903 |
| APPLICATIONS WITHDRAWN | 1 | $128,020 | 0 | $0 |
| FILES CLOSED FOR INCOMPLETENESS | 0 | $0 | 2 | $184,535 |
Detailed PMIC statistics for the following Tracts: 0502.04 , 0502.05, 0502.06
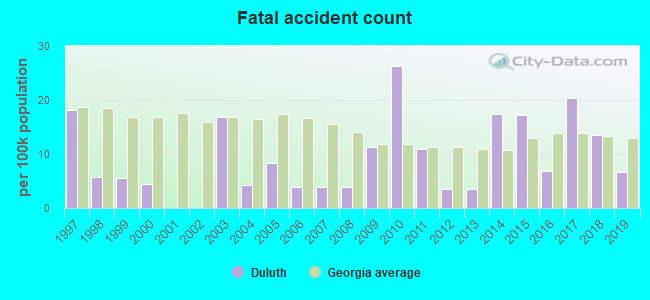
2003 - 2018 National Fire Incident Reporting System (NFIRS) incidents
- Fire incident types reported to NFIRS in Duluth, GA
- 1,02942.7%Structure Fires
- 83234.5%Outside Fires
- 52121.6%Mobile Property/Vehicle Fires
- 291.2%Other
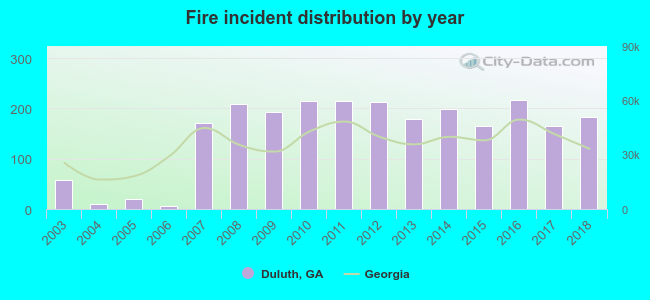 Based on the data from the years 2003 - 2018 the average number of fires per year is 151. The highest number of reported fire incidents - 216 took place in 2016, and the least - 6 in 2006. The data has a rising trend.
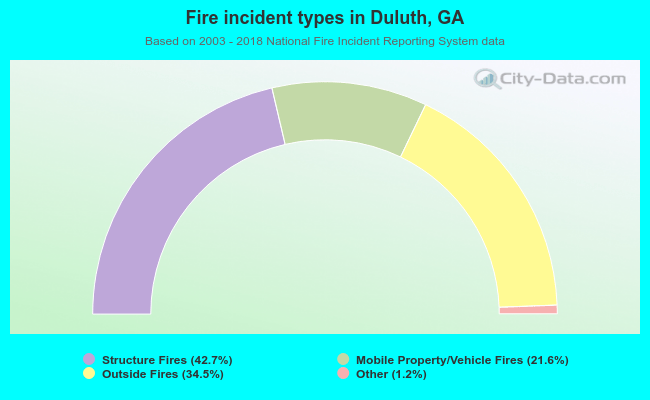 When looking into fire subcategories, the most incidents belonged to: Structure Fires (42.7%), and Outside Fires (34.5%).
Fire-safe hotels and motels in Duluth, Georgia:
- Courtyard Atlanta Gwinnett, 3550 Venture Pkwy, Duluth, Georgia 30096 , Phone: (770) 476-4666, Fax: (770) 623-0198
- Quality Inn, 3500 Venture Pkwy, Duluth, Georgia 30096 , Phone: (770) 623-9300, Fax: (770) 623-9369
- Residence Inn Atlanta Gwinnett Place, 1760 Pineland Rd, Duluth, Georgia 30096 , Phone: (770) 921-2202
- Wingate Inn Duluth, 3450 Venture Pkwy, Duluth, Georgia 30096 , Phone: (770) 622-7277, Fax: (770) 622-7273
- In Town Suites- Duluth, 3750 Satellite Blvd, Duluth, Georgia 30096 , Phone: (770) 622-9700, Fax: (770) 476-5079
- Extended Stay America, 3390 Venture Pkwy, Duluth, Georgia 30096 , Phone: (770) 623-6800
- Hyatt Place Johns Creek, 11505 Medlock Bridge Rd, Duluth, Georgia 30097 , Phone: (770) 622-5858, Fax: (770) 622-1113
- Extended Stay America - Atlanta - Duluth, 3430 Venture Pkwy, Duluth, Georgia 30096 , Phone: (770) 622-0270, Fax: (770) 622-0470
- 18 other hotels and motels
| Most common first names in Duluth, GA among deceased individuals | ||
| Name | Count | Lived (average) |
|---|---|---|
| James | 107 | 72.9 years |
| John | 104 | 76.3 years |
| Mary | 101 | 78.7 years |
| William | 80 | 81.3 years |
| Robert | 65 | 74.0 years |
| Dorothy | 58 | 81.7 years |
| George | 45 | 84.1 years |
| Charles | 44 | 74.7 years |
| Betty | 41 | 74.9 years |
| Margaret | 40 | 77.0 years |
| Most common last names in Duluth, GA among deceased individuals | ||
| Last name | Count | Lived (average) |
|---|---|---|
| Smith | 50 | 78.4 years |
| Kim | 31 | 68.8 years |
| Johnson | 24 | 82.7 years |
| Lee | 22 | 76.1 years |
| Wood | 21 | 81.1 years |
| Jones | 17 | 75.7 years |
| Moore | 17 | 78.2 years |
| Brown | 17 | 74.5 years |
| Anderson | 16 | 80.9 years |
| Turner | 15 | 82.9 years |
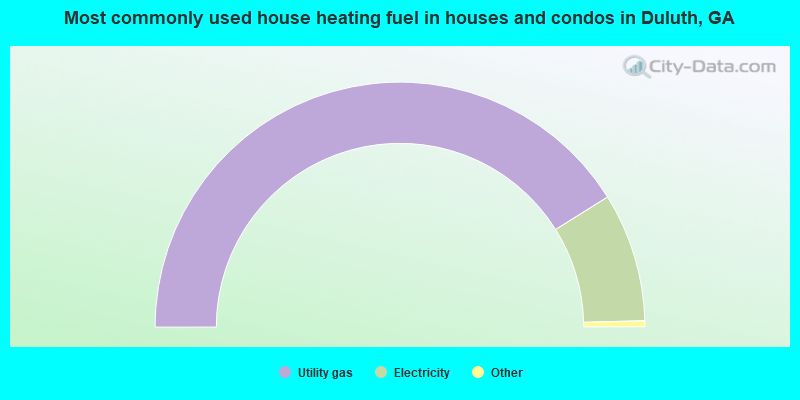
- 82.2%Utility gas
- 17.0%Electricity
- 0.6%No fuel used
- 0.2%Bottled, tank, or LP gas
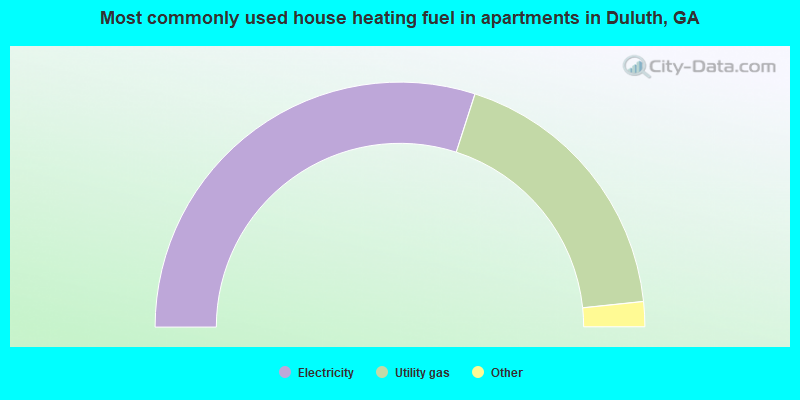
- 60.0%Electricity
- 36.8%Utility gas
- 1.6%Bottled, tank, or LP gas
- 1.4%No fuel used
- 0.3%Fuel oil, kerosene, etc.
Duluth compared to Georgia state average:
- Unemployed percentage significantly below state average.
- Hispanic race population percentage above state average.
- Median age below state average.
- Foreign-born population percentage significantly above state average.
- Length of stay since moving in significantly above state average.
- House age below state average.
- Percentage of population with a bachelor's degree or higher significantly above state average.
Duluth on our top lists:
- #31 on the list of "Top 101 cities with the most residents born in Korea (population 500+)"
- #59 on the list of "Top 101 cities with the most residents born in Eastern Asia (population 500+)"
- #33 (30071) on the list of "Top 101 zip codes with the largest percentage of taxpayers reporting profit/loss from business in 2012 (pop 5,000+)"
- #8 on the list of "Top 101 counties with the lowest number of deaths per 1000 residents 2007-2013 (pop. 50,000+)"
- #24 on the list of "Top 101 counties with the largest number of children under 18 without health insurance coverage in 2000 (pop. 50,000+)"
- #25 on the list of "Top 101 counties with the lowest percentage of residents that smoked 100+ cigarettes in their lives"
- #26 on the list of "Top 101 counties with the highest percentage of residents that visited a dentist within the past year"
- #26 on the list of "Top 101 counties with the largest decrease in the number of births per 1000 residents 2000-2006 to 2007-2013 (pop 50,000+)"

|
|
Total of 1687 patent applications in 2008-2024.