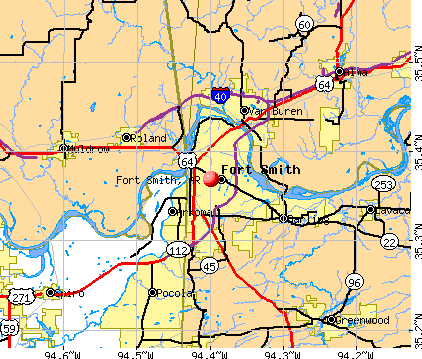
Fort Smith, Arkansas
Fort Smith: Beautiful sunset over the Arkansas River
Fort Smith: Ft. Smith
Fort Smith: Tree at Motel 6 - April 2006
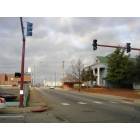
Fort Smith: Fort Smith, Arkansas - April 2006
Fort Smith: Looking West from outside Motel 6
Fort Smith: Rainbow over Fort Smith, AR
Fort Smith: Cardinal Red Bird
Fort Smith: Ft. Smith
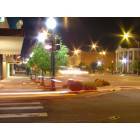
Fort Smith: Downtown Fort Smith, Arkansas
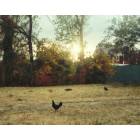
Fort Smith: Chickens being raised just 10 blocks or so north of downtown
Fort Smith: Ft. Smith
- see
30
more - add
your
Submit your own pictures of this city and show them to the world
- OSM Map
- General Map
- Google Map
- MSN Map
Population change since 2000: +12.1%
 |
| Males: 44,565 | |
| Females: 45,427 |
| Median resident age: | 36.0 years |
| Arkansas median age: | 38.9 years |
Zip codes: 72901, 72903, 72904, 72908.
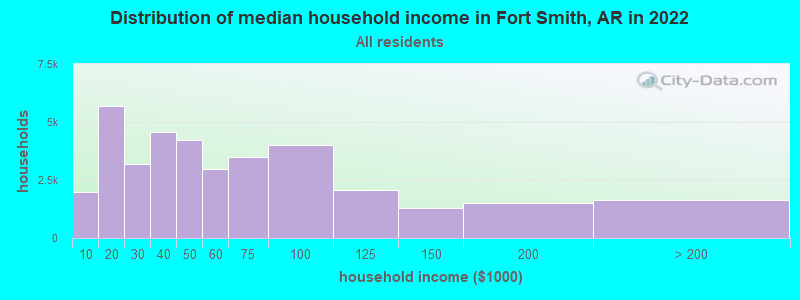
Fort Smith Zip Code Map| Fort Smith: | $47,669 |
| AR: | $55,432 |
Estimated per capita income in 2022: $29,792 (it was $18,994 in 2000)
Fort Smith city income, earnings, and wages data
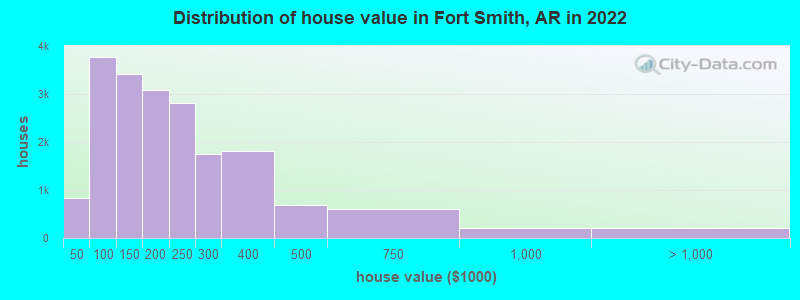
Estimated median house or condo value in 2022: $174,800 (it was $72,900 in 2000)
| Fort Smith: | $174,800 |
| AR: | $179,800 |
Mean prices in 2022: all housing units: $218,160; detached houses: $223,846; townhouses or other attached units: $234,524; in 2-unit structures: $426,381; in 3-to-4-unit structures: $83,557; mobile homes: $73,324
Median gross rent in 2022: $761.
(19.3% for White Non-Hispanic residents, 30.5% for Black residents, 29.1% for Hispanic or Latino residents, 15.2% for American Indian residents, 31.1% for other race residents, 23.9% for two or more races residents)
Detailed information about poverty and poor residents in Fort Smith, AR


Compare current foreclosures in Fort Smith, AR:
| Photo | Address | Area | Beds / Baths | Price | Details |
|---|---|---|---|---|---|

|
#1
N 39th St
Fort Smith, AR 72904
|
843 sq. feet
|
1 baths 2 beds |
$119,900
|
show details |

|
#2
S Y St
Fort Smith, AR 72903
|
1,576 sq. feet
|
1 baths 3 beds |
$114,000
|
show details |

|
#3
Enid St
Fort Smith, AR 72903
|
2,309 sq. feet
|
2 baths 4 beds |
show details | |

|
#4
N 16th St
Fort Smith, AR 72901
|
1,826 sq. feet
|
2 baths 3 beds |
show details | |

|
#5
Colony Ln
Fort Smith, AR 72908
|
1,400 sq. feet
|
1 baths - beds |
show details | |

|
#6
S 22nd St
Fort Smith, AR 72901
|
- sq. feet
|
1 baths 2 beds |
show details | |

|
#7
S 29th St
Fort Smith, AR 72901
|
1,260 sq. feet
|
1 baths - beds |
show details | |

|
#8
Edinburgh Dr
Fort Smith, AR 72908
|
1,976 sq. feet
|
2 baths - beds |
show details | |

|
#9
S 24th St
Fort Smith, AR 72901
|
1,932 sq. feet
|
1 baths - beds |
show details | |

|
#10
Lee Cir
Fort Smith, AR 72903
|
1,429 sq. feet
|
2 baths - beds |
show details |
| Photo | Address | Area | Beds / Baths | Price | Details |
|---|---|---|---|---|---|

|
#11
Trenton Dr
Fort Smith, AR 72908
|
2,121 sq. feet
|
2 baths - beds |
show details | |

|
#12
State Line Rd
Fort Smith, AR 72916
|
860 sq. feet
|
1 baths - beds |
show details | |

|
#13
N 58th Ter
Fort Smith, AR 72904
|
2,232 sq. feet
|
3 baths - beds |
show details | |

|
#14
Burnham Rd
Fort Smith, AR 72903
|
2,156 sq. feet
|
2 baths - beds |
show details | |

|
#15
S 47th St
Fort Smith, AR 72903
|
2,380 sq. feet
|
2 baths - beds |
show details | |

|
#16
S 46th St
Fort Smith, AR 72903
|
2,398 sq. feet
|
3 baths - beds |
show details | |

|
#17
S 32nd St
Fort Smith, AR 72903
|
1,072 sq. feet
|
1 baths - beds |
show details | |

|
#18
Bear Claw Trl
Fort Smith, AR 72916
|
1,352 sq. feet
|
1 baths - beds |
show details | |

|
#19
Chelsea Mead
Fort Smith, AR 72908
|
5,618 sq. feet
|
4 baths - beds |
show details | |

|
#20
N 46th Cir
Fort Smith, AR 72904
|
1,275 sq. feet
|
2 baths - beds |
show details |
| Photo | Address | Area | Beds / Baths | Price | Details |
|---|---|---|---|---|---|

|
#21
S Y St
Fort Smith, AR 72901
|
1,466 sq. feet
|
1 baths - beds |
show details | |

|
#22
S 99th St
Fort Smith, AR 72903
|
1,646 sq. feet
|
2 baths - beds |
show details | |

|
#23
Bartsch Ave
Fort Smith, AR 72908
|
1,125 sq. feet
|
1 baths - beds |
show details | |

|
#24
Old Greenwood Rd
Fort Smith, AR 72901
|
1,110 sq. feet
|
1 baths - beds |
show details | |

|
#25
Fallstone Rd
Fort Smith, AR 72916
|
1,577 sq. feet
|
2 baths - beds |
show details | |

|
#26
N 40th St
Fort Smith, AR 72903
|
1,216 sq. feet
|
1 baths - beds |
show details | |

|
#27
N 33rd St
Fort Smith, AR 72904
|
1,092 sq. feet
|
1 baths - beds |
show details | |

|
#28
N 50th St
Fort Smith, AR 72904
|
881 sq. feet
|
1 baths - beds |
show details | |

|
#29
N 39th St
Fort Smith, AR 72904
|
1,608 sq. feet
|
1 baths - beds |
show details | |

|
#30
Eastwood Dr
Fort Smith, AR 72903
|
2,394 sq. feet
|
3 baths - beds |
show details |
| Photo | Address | Area | Beds / Baths | Price | Details |
|---|---|---|---|---|---|

|
#31
Carthage St
Fort Smith, AR 72903
|
2,544 sq. feet
|
2 baths - beds |
show details | |

|
#32
Avignon
Fort Smith, AR 72908
|
1,408 sq. feet
|
2 baths - beds |
show details | |

|
#33
Houston St
Fort Smith, AR 72901
|
1,406 sq. feet
|
1 baths - beds |
show details | |

|
#34
S S St
Fort Smith, AR 72901
|
1,052 sq. feet
|
1 baths - beds |
show details | |

|
#35
S 21st St
Fort Smith, AR 72901
|
1,194 sq. feet
|
2 baths - beds |
show details | |

|
#36
Ionia St
Fort Smith, AR 72901
|
1,816 sq. feet
|
2 baths - beds |
show details | |

|
#37
Churchill Rd
Fort Smith, AR 72904
|
1,161 sq. feet
|
1 baths - beds |
show details | |

|
#38
Free Ferry Rd
Fort Smith, AR 72903
|
1,378 sq. feet
|
3 baths - beds |
show details | |

|
#39
Sunchase Ln
Fort Smith, AR 72903
|
1,200 sq. feet
|
2 baths - beds |
show details | |

|
#40
Ionia St
Fort Smith, AR 72901
|
1,496 sq. feet
|
3 baths - beds |
show details |
| Photo | Address | Area | Beds / Baths | Price | Details |
|---|---|---|---|---|---|

|
#41
Park Ave
Fort Smith, AR 72903
|
1,882 sq. feet
|
3 baths - beds |
show details | |

|
#42
Packard Pl
Fort Smith, AR 72901
|
1,577 sq. feet
|
1 baths - beds |
show details | |

|
#43
Joseph St
Fort Smith, AR 72908
|
1,064 sq. feet
|
1 baths - beds |
show details | |

|
#44
Memphis St
Fort Smith, AR 72901
|
1,161 sq. feet
|
1 baths - beds |
show details | |

|
#45
Utica St
Fort Smith, AR 72901
|
1,150 sq. feet
|
1 baths - beds |
show details | |

|
#46
Ironwood Ln
Fort Smith, AR 72916
|
1,435 sq. feet
|
2 baths - beds |
show details | |

|
#47
Cypress Ave
Fort Smith, AR 72908
|
1,314 sq. feet
|
2 baths - beds |
show details | |

|
#48
Dover Cir
Fort Smith, AR 72903
|
3,457 sq. feet
|
3 baths - beds |
show details | |

|
#49
Virginia Ave
Fort Smith, AR 72904
|
1,002 sq. feet
|
1 baths - beds |
show details | |

|
Check over 1 million property listings on Foreclosure.com!
|
browse all offers | |||


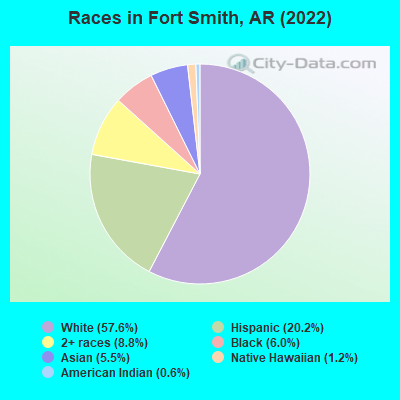
- 51,83657.6%White alone
- 18,20120.2%Hispanic
- 7,9388.8%Two or more races
- 5,3976.0%Black alone
- 4,9685.5%Asian alone
- 1,0591.2%Native Hawaiian and Other
Pacific Islander alone - 5150.6%American Indian alone
- 670.07%Other race alone
According to our research of Arkansas and other state lists, there were 214 registered sex offenders living in Fort Smith, Arkansas as of April 27, 2024.
The ratio of all residents to sex offenders in Fort Smith is 413 to 1.
The ratio of registered sex offenders to all residents in this city is near the state average.
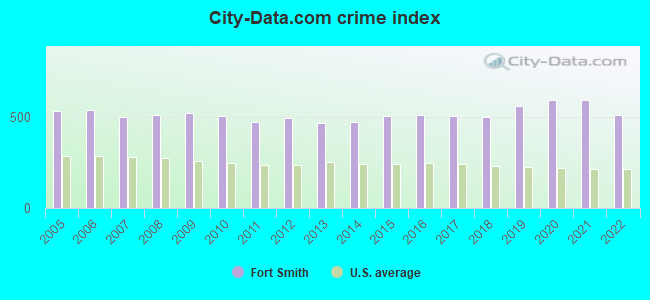
The City-Data.com crime index weighs serious crimes and violent crimes more heavily. Higher means more crime, U.S. average is 246.1. It adjusts for the number of visitors and daily workers commuting into cities.
- means the value is about the same as the state average.- means the value is bigger than the state average.
- means the value is much bigger than the state average.
Crime rate in Fort Smith detailed stats: murders, rapes, robberies, assaults, burglaries, thefts, arson
Full-time law enforcement employees in 2021, including police officers: 184 (138 officers - 124 male; 14 female).
| Officers per 1,000 residents here: | 1.57 |
| Arkansas average: | 2.25 |
 Recent articles from our blog. Our writers, many of them Ph.D. graduates or candidates, create easy-to-read articles on a wide variety of topics.

 | How does Fort Smith compare to Fayetteville/Bentonville? (13 replies) |
| Would you consider Fort Smith to be more culturally tied to Oklahoma than the rest of Arkansas? (11 replies) |
| Driving from Memphis to Fort Smith (1 reply) |
| Fort Smith: Is it in decline? (22 replies) |
| Fort Smith services questions... (0 replies) |
| FORT SMITH AR Is this safe for late Senior Gal (4 replies) |
Latest news from Fort Smith, AR collected exclusively by city-data.com from local newspapers, TV, and radio stations
Ancestries: American (8.6%), English (6.1%), German (5.4%), Irish (3.6%), European (1.5%), Scottish (1.3%).
Current Local Time: CST time zone
Incorporated on 12/24/1842
Elevation: 440 feet
Land area: 50.3 square miles.
Population density: 1,787 people per square mile (low).
10,300 residents are foreign born (7.4% Latin America, 3.2% Asia).
| This city: | 11.5% |
| Arkansas: | 5.0% |
Median real estate property taxes paid for housing units with mortgages in 2022: $1,257 (0.6%)
Median real estate property taxes paid for housing units with no mortgage in 2022: $879 (0.6%)
Nearest city with pop. 200,000+: Tulsa, OK  (101.2 miles , pop. 393,049).
Nearest city with pop. 1,000,000+: Dallas, TX (224.3 miles , pop. 1,188,580).
Nearest cities:
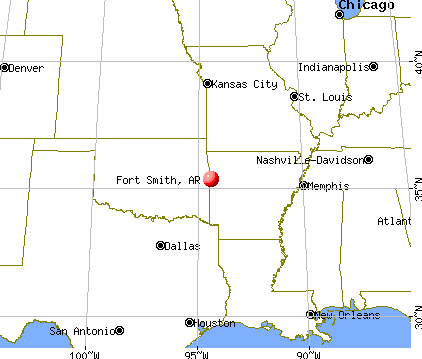
), )Latitude: 35.37 N, Longitude: 94.40 W
Daytime population change due to commuting: +24,454 (+27.2%)
Workers who live and work in this city: 32,698 (84.5%)
Area code: 479
Detailed articles:
- Fort Smith: Introduction
- Fort Smith Basic Facts
- Fort Smith: Communications
- Fort Smith: Convention Facilities
- Fort Smith: Economy
- Fort Smith: Education and Research
- Fort Smith: Geography and Climate
- Fort Smith: Health Care
- Fort Smith: History
- Fort Smith: Municipal Government
- Fort Smith: Population Profile
- Fort Smith: Recreation
- Fort Smith: Transportation
Fort Smith tourist attractions:
- Fort Smith National Historic Site - Fort Smith, Arkansas - National Historic Park
- Fort Smith Trolley Museum - Fort Smith, Arkansas - Museum Featuring Old Street Cars
- Miss Laura's Social Club
- Fort Smith Museum of History - Fort Smith, AR - a century old museum dedicated to preserving the history of Fort Smith
Fort Smith, Arkansas accommodation & food services, waste management - Economy and Business Data
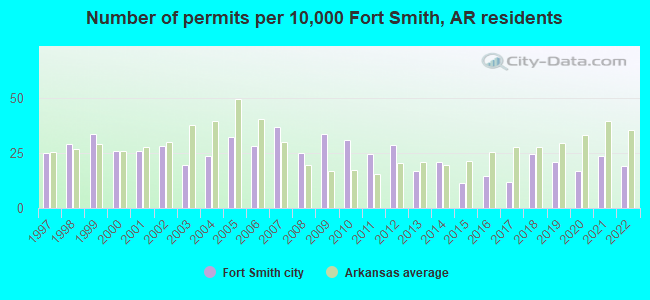
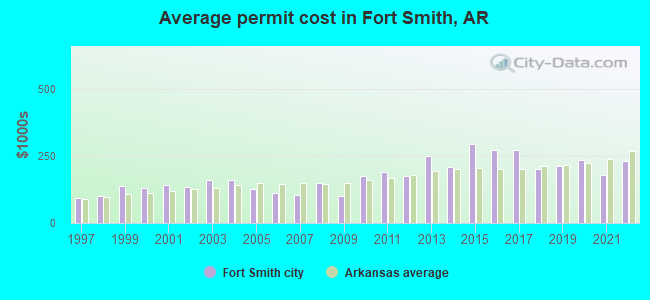
Single-family new house construction building permits:
- 2022: 154 buildings, average cost: $233,300
- 2021: 191 buildings, average cost: $180,600
- 2020: 135 buildings, average cost: $235,000
- 2019: 166 buildings, average cost: $213,400
- 2018: 195 buildings, average cost: $200,600
- 2017: 95 buildings, average cost: $273,100
- 2016: 116 buildings, average cost: $273,700
- 2015: 92 buildings, average cost: $294,900
- 2014: 166 buildings, average cost: $209,700
- 2013: 134 buildings, average cost: $250,600
- 2012: 229 buildings, average cost: $175,600
- 2011: 196 buildings, average cost: $191,000
- 2010: 248 buildings, average cost: $174,100
- 2009: 271 buildings, average cost: $100,600
- 2008: 201 buildings, average cost: $151,400
- 2007: 294 buildings, average cost: $104,800
- 2006: 226 buildings, average cost: $112,900
- 2005: 260 buildings, average cost: $126,500
- 2004: 190 buildings, average cost: $161,400
- 2003: 158 buildings, average cost: $160,300
- 2002: 224 buildings, average cost: $132,600
- 2001: 207 buildings, average cost: $142,900
- 2000: 208 buildings, average cost: $131,600
- 1999: 269 buildings, average cost: $140,200
- 1998: 234 buildings, average cost: $101,200
- 1997: 201 buildings, average cost: $92,400
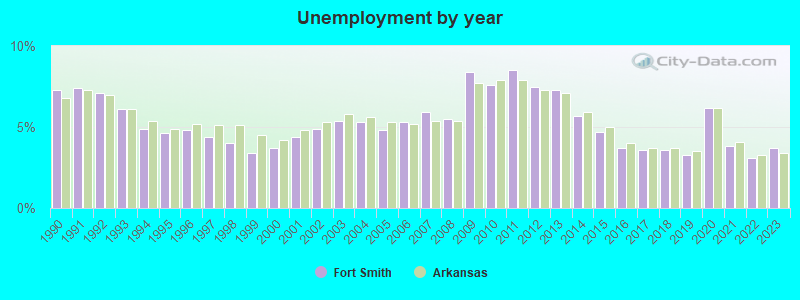
| Here: | 3.7% |
| Arkansas: | 3.4% |
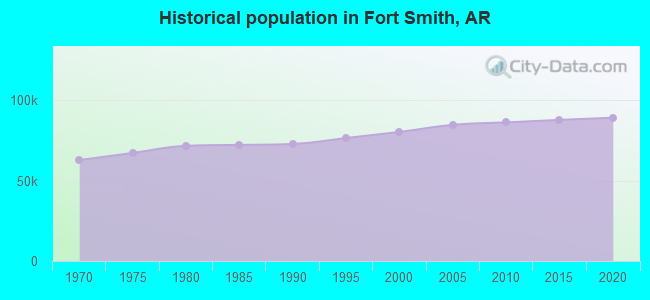
Population change in the 1990s: +7,470 (+10.3%).
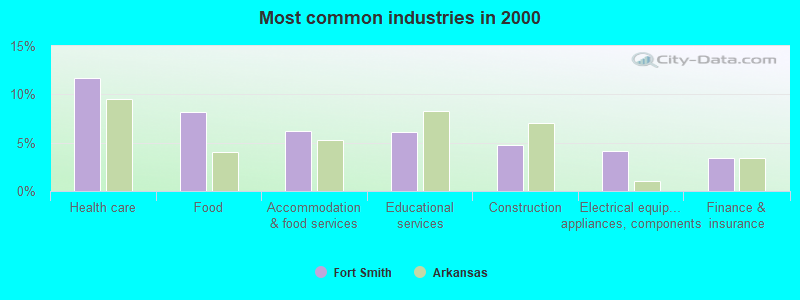
- Health care (11.7%)
- Food (8.2%)
- Accommodation & food services (6.2%)
- Educational services (6.1%)
- Construction (4.8%)
- Electrical equipment, appliances, components (4.2%)
- Finance & insurance (3.4%)
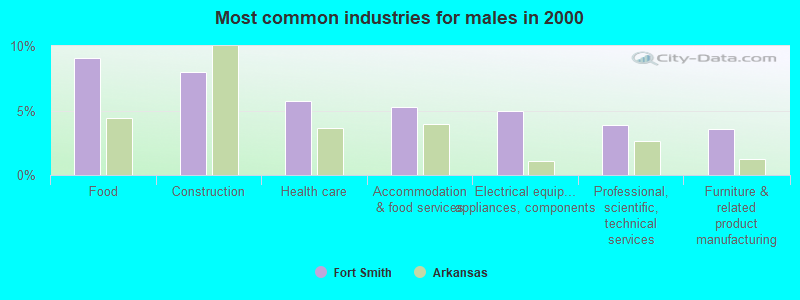
- Food (9.0%)
- Construction (8.0%)
- Health care (5.7%)
- Accommodation & food services (5.3%)
- Electrical equipment, appliances, components (4.9%)
- Professional, scientific, technical services (3.9%)
- Furniture & related product manufacturing (3.6%)
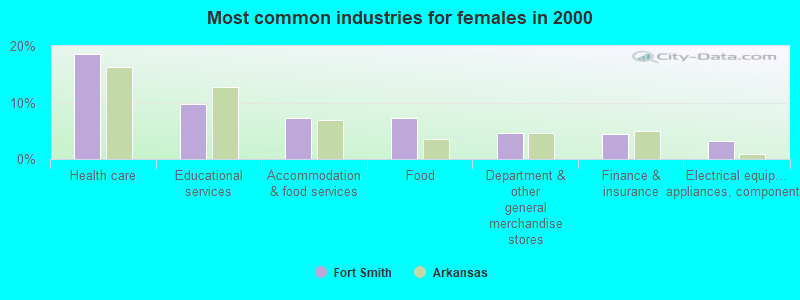
- Health care (18.6%)
- Educational services (9.8%)
- Accommodation & food services (7.3%)
- Food (7.3%)
- Department & other general merchandise stores (4.6%)
- Finance & insurance (4.5%)
- Electrical equipment, appliances, components (3.2%)
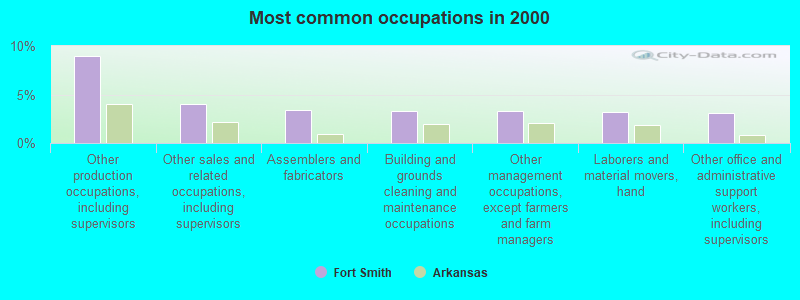
- Other production occupations, including supervisors (8.9%)
- Other sales and related occupations, including supervisors (4.0%)
- Assemblers and fabricators (3.4%)
- Building and grounds cleaning and maintenance occupations (3.3%)
- Other management occupations, except farmers and farm managers (3.2%)
- Laborers and material movers, hand (3.2%)
- Other office and administrative support workers, including supervisors (3.1%)
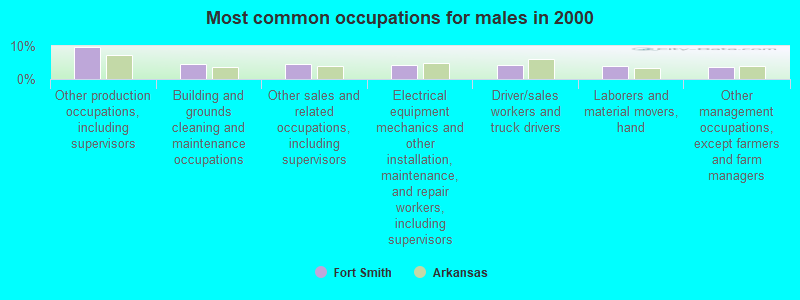
- Other production occupations, including supervisors (9.7%)
- Building and grounds cleaning and maintenance occupations (4.5%)
- Other sales and related occupations, including supervisors (4.5%)
- Electrical equipment mechanics and other installation, maintenance, and repair workers, including supervisors (4.4%)
- Driver/sales workers and truck drivers (4.2%)
- Laborers and material movers, hand (4.0%)
- Other management occupations, except farmers and farm managers (3.7%)
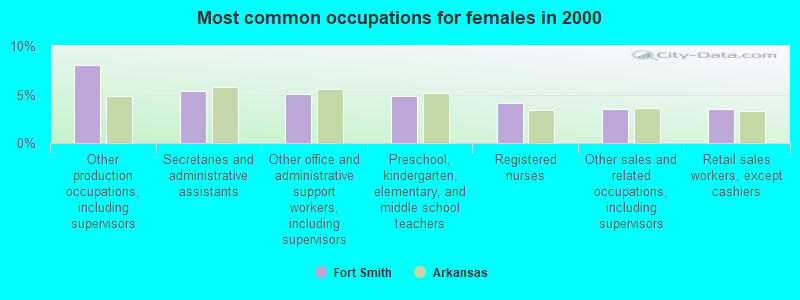
- Other production occupations, including supervisors (8.0%)
- Secretaries and administrative assistants (5.3%)
- Other office and administrative support workers, including supervisors (5.0%)
- Preschool, kindergarten, elementary, and middle school teachers (4.8%)
- Registered nurses (4.1%)
- Other sales and related occupations, including supervisors (3.5%)
- Retail sales workers, except cashiers (3.5%)
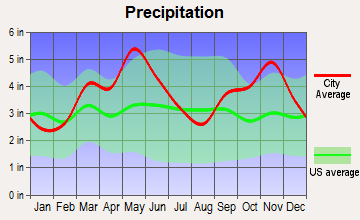
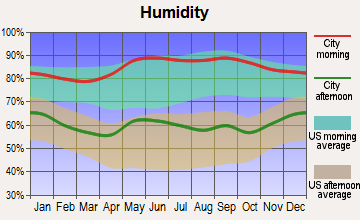
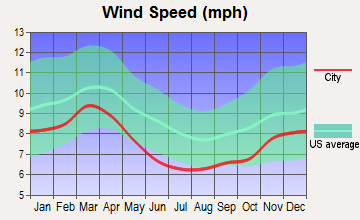
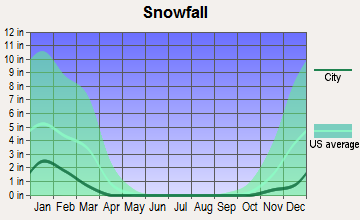
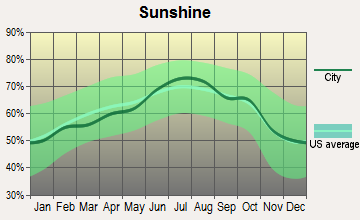
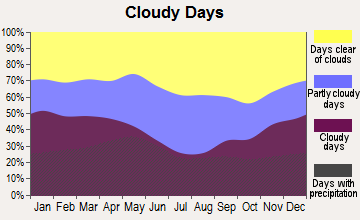
Average climate in Fort Smith, Arkansas
Based on data reported by over 4,000 weather stations

|
|

(lower is better)
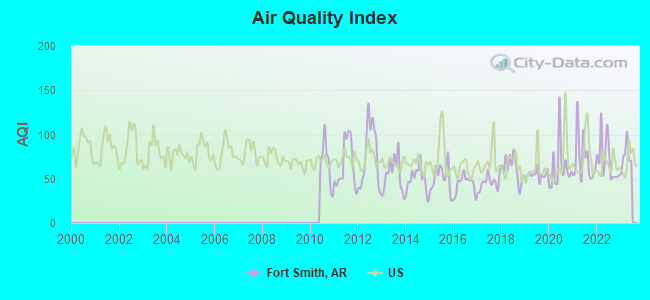
Air Quality Index (AQI) level in 2022 was 70.3. This is about average.
| City: | 70.3 |
| U.S.: | 72.6 |
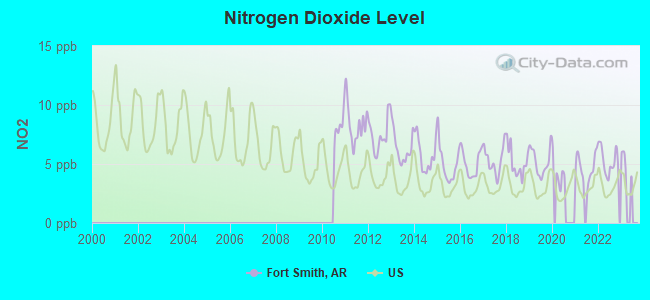
Nitrogen Dioxide (NO2) [ppb] level in 2022 was 5.23. This is about average. Closest monitor was 2.0 miles away from the city center.
| City: | 5.23 |
| U.S.: | 5.11 |
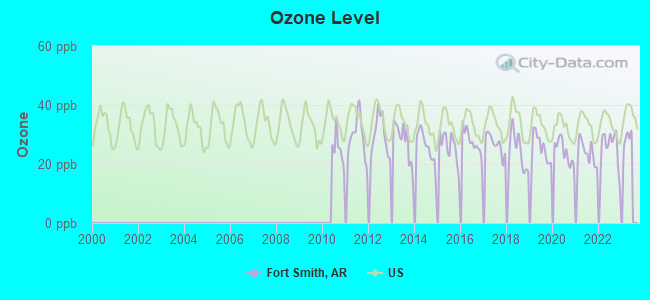
Ozone [ppb] level in 2022 was 25.4. This is better than average. Closest monitor was 7.6 miles away from the city center.
| City: | 25.4 |
| U.S.: | 33.3 |
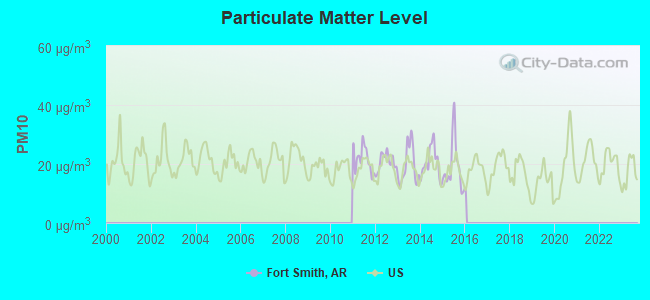
Particulate Matter (PM10) [µg/m3] level in 2015 was 19.2. This is about average. Closest monitor was 2.0 miles away from the city center.
| City: | 19.2 |
| U.S.: | 19.2 |
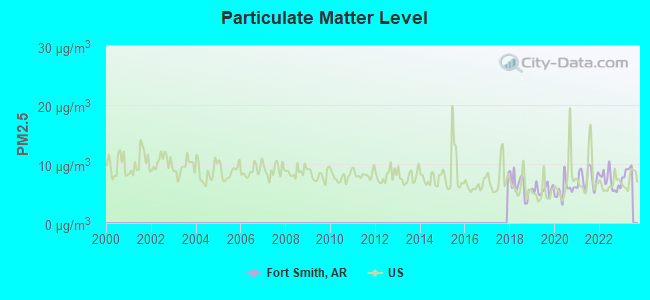
Particulate Matter (PM2.5) [µg/m3] level in 2022 was 7.07. This is about average. Closest monitor was 2.0 miles away from the city center.
| City: | 7.07 |
| U.S.: | 8.11 |
Tornado activity:
Fort Smith-area historical tornado activity is slightly below Arkansas state average. It is 81% greater than the overall U.S. average.
On 3/26/1976, a category F5 (max. wind speeds 261-318 mph) tornado 10.0 miles away from the Fort Smith city center killed 2 people and injured 64 people and caused between $500,000 and $5,000,000 in damages.
On 5/5/1960, a category F4 (max. wind speeds 207-260 mph) tornado 8.0 miles away from the city center killed 5 people and injured 13 people and caused between $50,000 and $500,000 in damages.
Earthquake activity:
Fort Smith-area historical earthquake activity is significantly above Arkansas state average. It is 626% greater than the overall U.S. average.On 11/6/2011 at 03:53:10, a magnitude 5.7 (5.7 MW, Depth: 3.2 mi, Class: Moderate, Intensity: VI - VII) earthquake occurred 133.8 miles away from Fort Smith center
On 9/3/2016 at 12:02:44, a magnitude 5.8 (5.8 MW, Depth: 3.5 mi) earthquake occurred 159.5 miles away from the city center
On 11/7/2016 at 01:44:24, a magnitude 5.0 (5.0 MW, Depth: 2.8 mi) earthquake occurred 141.8 miles away from the city center
On 11/5/2011 at 07:12:45, a magnitude 4.8 (4.8 MW, Depth: 1.9 mi, Class: Light, Intensity: IV - V) earthquake occurred 133.8 miles away from the city center
On 11/8/2011 at 02:46:57, a magnitude 4.8 (4.8 MW, Depth: 3.1 mi) earthquake occurred 135.1 miles away from Fort Smith center
On 2/28/2011 at 05:00:50, a magnitude 4.7 (4.7 MW, Depth: 2.0 mi) earthquake occurred 115.6 miles away from Fort Smith center
Magnitude types: moment magnitude (MW)
Natural disasters:
The number of natural disasters in Sebastian County (16) is near the US average (15).Major Disasters (Presidential) Declared: 10
Emergencies Declared: 4
Causes of natural disasters: Storms: 9, Floods: 7, Tornadoes: 6, Winter Storms: 4, Winds: 2, Drought: 1, Hurricane: 1, Other: 1 (Note: some incidents may be assigned to more than one category).

Main business address for: BALDOR ELECTRIC CO (MOTORS & GENERATORS), BEVERLY ENTERPRISES INC (SERVICES-SKILLED NURSING CARE FACILITIES), ARKANSAS BEST CORP /DE/ (TRUCKING (NO LOCAL)).
Hospitals in Fort Smith:
- AREA AGCY AGING HOSPICE OF WES (524 GARRISON AVENUE)
- HOLT-KROCK SURGERY CENTER (1500 DODSON AVE)
- HOSPICE PEACHTREE, LLC (4300 ROGERS AVENUE, SUITE 33)
- I CARE NETWORK (4300 ROGERS AVENUE SUITE 29)
- SELECT SPECIALTY HOSPITAL FORT SMITH (1311 SOUTH I STREET)
- SPARKS REGIONAL MEDICAL CENTER (Voluntary non-profit - Private, 1001 TOWSON AVENUE)
- ST EDWARD MERCY MED CTR HOSPICE (5401 ELLSWORTH ROAD)
- ST EDWARD MERCY MEDICAL CENTER (Voluntary non-profit - Private, 7301 ROGERS AVE)
Nursing Homes in Fort Smith:
- CHAPEL RIDGE HEALTH AND REHAB (4623 ROGERS AVENUE)
- COVINGTON COURT (4500 OLD GREENWOOD ROAD)
- COVINGTON COURT HEALTH AND REHABILITATION CENTER (4500 OLD GREENWOOD RD)
- FIANNA HILLS NURSING AND REHAB (8411 SOUTH 28TH STREET)
- FORT SMITH NURSING CENTER LLC (425 NORTH 51ST STREET)
- LEGACY HEALTH AND REHABILITATION CENTER (3310 NORTH 50TH STREET)
- METHODIST HEALTH AND REHAB (1915 SOUTH 74TH ST)
- PARKVIEW NH (425 N 51ST ST BOX 11048)
- PARKVIEW NURSING HOME (P O BOX 11048)
- RIVER VALLEY HEALTH AND REHABILITATION CENTER (5301 WHEELER AVENUE)
Dialysis Facilities in Fort Smith:
Home Health Centers in Fort Smith:
Airports and heliports located in Fort Smith:
- Fort Smith Regional Airport (FSM) (Runways: 2, Commercial Ops: 57, Air Taxi Ops: 5,705, Itinerant Ops: 12,782, Local Ops: 6,100, Military Ops: 11,090)
- Sparks Regional Medical Center Heliport (AR40)
- St Edward Mercy Medical Center Heliport (AR21)
Colleges/Universities in Fort Smith:
- University of Arkansas-Fort Smith (Full-time enrollment: 6,103; Location: 5210 Grand Ave; Public; Website: uafs.edu/)
- Academy of Salon and Spa (Full-time enrollment: 113; Location: 311 S 16th St; Private, for-profit; Website: www.academysalonspa.com)
- Arthur's Beauty College Inc-Fort Smith (Full-time enrollment: 52; Location: 2000 North B St; Private, for-profit; Website: www.arthursbeautycollege.com)
Other colleges/universities with over 2000 students near Fort Smith:
- Carl Albert State College (about 27 miles; Poteau, OK; Full-time enrollment: 2,041)
- University of Arkansas (about 50 miles; Fayetteville, AR; FT enrollment: 22,163)
- Northeastern State University (about 50 miles; Tahlequah, OK; FT enrollment: 6,895)
- John Brown University (about 58 miles; Siloam Springs, AR; FT enrollment: 2,097)
- NorthWest Arkansas Community College (about 70 miles; Bentonville, AR; FT enrollment: 5,634)
- Arkansas Tech University (about 72 miles; Russellville, AR; FT enrollment: 9,038)
- Oklahoma State University Institute of Technology (about 89 miles; Okmulgee, OK; FT enrollment: 3,243)
Public high schools in Fort Smith:
- WESTARK TECHNICAL CENTER (Location: 5210 GRAND AVE, Grades: 9-12)
- BELLE POINT ALTERNATIVE CENTER (Location: 1501 DODSON AVE, Grades: 8-12)
- L. A. CHAFFIN JR. HIGH SCHOOL (Location: 3025 MASSARD RD, Grades: 7-9)
- WILLIAM O. DARBY JR. HIGH SCH. (Location: 616 N 14TH ST, Grades: 7-9)
- DORA KIMMONS JR. HIGH SCHOOL (Location: 2201 N 50TH ST, Grades: 7-9)
- NORTHSIDE HIGH SCHOOL (Location: 2301 NORTH B ST, Grades: 10-12)
- RAMSEY JUNIOR HIGH SCHOOL (Location: 3201 JENNY LIND RD, Grades: 7-9)
- SOUTHSIDE HIGH SCHOOL (Location: 4100 GARY ST, Grades: 10-12)
Private high schools in Fort Smith:
Biggest public elementary/middle schools in Fort Smith:
- BALLMAN ELEMENTARY SCHOOL (Location: 2601 SOUTH Q ST, Grades: KG-6)
- BEARD ELEMENTARY SCHOOL (Location: 1600 CAVANAUGH RD, Grades: KG-6)
- BONNEVILLE ELEMENTARY SCHOOL (Location: 2500 S WALDRON RD, Grades: KG-6)
- CARNALL ELEMENTARY SCHOOL (Location: 2524 S TULSA ST, Grades: PK-6)
- CAVANAUGH ELEMENTARY SCHOOL (Location: 1025 SCHOOL ST, Grades: KG-6)
- ELMER H. COOK ELEM. SCHOOL (Location: 3517 BROOKEN HILL DR, Grades: KG-6)
- FAIRVIEW ELEMENTARY SCHOOL (Location: 2400 S DALLAS, Grades: PK-6)
- HOWARD ELEMENTARY SCHOOL (Location: 1301 N 8TH ST, Grades: PK-6)
- HARRY C. MORRISON ELEM. SCHOOL (Location: 3415 NEWLON RD, Grades: PK-6)
- RAYMOND F. ORR ELEM. SCHOOL (Location: 3609 PHOENIX ST, Grades: PK-6)
Private elementary/middle schools in Fort Smith:
- IMMACULATE CONCEPTION ELEMENTARY SCHOOL (Students: 324, Location: 223 S 14TH ST, Grades: PK-6)
- CHRIST THE KING CATHOLIC SCHOOL (Students: 290, Location: 1918 S GREENWOOD AVE, Grades: PK-6)
- UNION CHRISTIAN ACADEMY ELEMENTARY CAMPUS (Students: 180, Location: 3300 BRIAR CLIFF AVE, Grades: PK-4)
- ST BONIFACE CATHOLIC SCHOOL (Students: 171, Location: 201 N 19TH ST, Grades: PK-6)
- FIRST LUTHERAN SCHOOL (Students: 156, Location: 2407 MASSARD RD, Grades: PK-6)
- THE MONTESSORI SCHOOL OF FORT SMITH (Students: 92, Location: 3908 JENNY LIND RD, Grades: PK-6)
User-submitted facts and corrections:
- The school closest to Fort Smith is no longer called Westark. It is now the University of Arkansas at Fort Smith. Just FYI.
- Harborview Mercy is now known as Vista Health
- Fort Smith Christian School, River Valley Christian School and Harvest Time Christian School no longer exist. They merged to form Union Christian Academy in 2005. Grades 5-12 are located at 4201 Windsor Drive. Preschool through 4th grade are located at 3100 Briarcliff Drive.
- The school closest to Fort Smith is no longer called Westark. It is now the University of Arkansas at Fort Smith. Just FYI.
Points of interest:
Notable locations in Fort Smith: Hardscrabble Golf Course (A), Fort Smith Racquet Club (B), Fort Smith Country Club (C), Fianna Hills Country Club (D), Trail of Tears National Historic Trail Overlook (E), City of Fort Smith Landfill (F), Arkansas State Police Troop H (G), Federal Bureau of Investigation (H), 188th Fighter Wing Air National Guard Security Squadron (I), Westark Community College Security (J), Immigration Customs Enforcement (K), Fort Smith Police Department (L), Sebastian County Sheriff's Office (M), 12th Judicial District Drug Task Force (N), United States Drug Enforcement Administration - Fort Smith (O), United States Marshal Service - Fort Smith (P), Bureau of Alcohol, Tobacco, And Firearms - Fort Smith (Q), Community Rescue Mission (R), Fort Smith Inter-Faith Community Center (S), Northside Branch Fort Smith Public Library (T). Display/hide their locations on the map
Shopping Centers: Central Mall Shopping Center (1), Colony Square Shopping Center (2), Green Pointe Shopping Center (3), Park Plaza Shopping Center (4), Phoenix Village Shopping Center (5), Stonewall Village Shopping Center (6), Waldron Square Shopping Center (7), Sunnymede Shopping Center (8), Williamsburg Square Shopping Center (9). Display/hide their locations on the map
Main business address in Fort Smith include: BALDOR ELECTRIC CO (A), BEVERLY ENTERPRISES INC (B), ARKANSAS BEST CORP /DE/ (C). Display/hide their locations on the map
Churches in Fort Smith include: West Arkansas Church (A), Albert Pike Christian Church (B), Apostolic Faith Church (C), Bethel Lutheran Church (D), Bluff Avenue Baptist Church (E), Calvary Apostolic Pentecostal Church (F), Calvary Assembly of God Church (G), Calvary Baptist Church (H), Campbell Chapel African Methodist Episcopal Church (I). Display/hide their locations on the map
Cemeteries: Oak Cemetery (1), Forest Park Cemetery (2), Newlon Cemetery (3), Fort Smith National Cemetery (4), Calvary Cemetery (5), Holy Cross Cemetery (6), Washington Cemetery (7). Display/hide their locations on the map
Reservoirs: Wildcat Mountain Lake (A), Bailey Hill Reservoir (B), Crowe Hill Reservoir (C), Echols Lake (D), Crain Lake (E). Display/hide their locations on the map
Creek: Massard Creek (A). Display/hide its location on the map
Parks in Fort Smith include: West Garrison Avenue Historic District (1), Riverfront Park (2), Latture Park (3), Harper Stadium (4), Harley Wilson Park (5), Belle Grove Historic District (6), Andrews Field (7), Rogers Park (8), Carol Ann Cross Park (9). Display/hide their locations on the map
Tourist attractions: Fort Smith Trolley Museum (100 South 4th Street) (1), Fort Smith Museum of History (320 Rogers Avenue) (2), Clayton House (Cultural Attractions- Events- & Facilities; 514 North 6th Street) (3), Frances D Still Learning Center (Cultural Attractions- Events- & Facilities; 2120 South Waldron Road) (4), METOO! Company (Cultural Attractions- Events- & Facilities; 275 West 120 North) (5), Outback Discovery (Amusement & Theme Parks; 5912 South 28th Street Suite 3) (6), Bucket's Billiards & Amusement (Amusement & Theme Parks; 4711 Grand Avenue) (7), Gator Golf Inc (Amusement & Theme Parks; 7200 Zero Street) (8), Wanna Be Racing (Amusement & Theme Parks; 7200 Zero Street) (9). Display/hide their approximate locations on the map
Hotels: Patel P L (2500 Towson Avenue) (1), Westark Inn Motel (5515 Towson Avenue) (2), Stonewall Jackson Inn (5715 Towson Avenue) (3), Ramada Inn (5103 Towson Avenue) (4), Days Inn (1021 Garrison Ave) (5), John Q'S (700 Rogers Avenue) (6), Beland Manor Bed & Breakfast (1320 South Albert Pike Avenue) (7), Regency Inn Limited (1215 South W Street) (8), Aspen Hotel & Suites (2900 S 68th St) (9). Display/hide their approximate locations on the map
Courts: U S Government - FT Smith Offices- U S District Court- Clerk US District C (USCourthouse Building) (1), U S Government - Ft Smith Offices- U S District Court- Court Security (USPo Building) (2). Display/hide their approximate locations on the map
Birthplace of: James L. Holloway, Jr. - Admiral, William S. Sessions - Judge, James Cotten - Film director, Anne W. Patterson - Diplomat, Ryan Franklin - 2005 Major League Baseball player (Seattle Mariners, born: Mar 5, 1973), Joan Crawford (basketball) - Basketball player, Bradley Hathaway - Folk singer, Marilyn Lloyd - Politician, Priest Holmes - 2005 NFL player (Kansas City Chiefs, born: Oct 7, 1973), Bryant Reeves - Basketball player.
Drinking water stations with addresses in Fort Smith and their reported violations in the past:
T&T DOLLAR STORE FS (Population served: 30, Purch surface water):Past monitoring violations:
- 5 routine major monitoring violations
- One minor monitoring violation
Drinking water stations with addresses in Fort Smith that have no violations reported:
- FORT SMITH WATER UTILITIES (Population served: 86,209, Primary Water Source Type: Surface water)
| This city: | 2.5 people |
| Arkansas: | 2.5 people |
| This city: | 62.2% |
| Whole state: | 67.6% |
| This city: | 7.3% |
| Whole state: | 5.7% |
Likely homosexual households (counted as self-reported same-sex unmarried-partner households)
- Lesbian couples: 0.4% of all households
- Gay men: 0.3% of all households
People in group quarters in Fort Smith in 2010:
- 592 people in nursing facilities/skilled-nursing facilities
- 450 people in college/university student housing
- 417 people in local jails and other municipal confinement facilities
- 214 people in other noninstitutional facilities
- 78 people in emergency and transitional shelters (with sleeping facilities) for people experiencing homelessness
- 59 people in residential treatment centers for adults
- 41 people in group homes intended for adults
- 32 people in correctional facilities intended for juveniles
- 26 people in group homes for juveniles (non-correctional)
- 16 people in residential treatment centers for juveniles (non-correctional)
- 5 people in workers' group living quarters and job corps centers
People in group quarters in Fort Smith in 2000:
- 618 people in nursing homes
- 303 people in local jails and other confinement facilities (including police lockups)
- 260 people in state prisons
- 183 people in mental (psychiatric) hospitals or wards
- 130 people in other noninstitutional group quarters
- 96 people in religious group quarters
- 90 people in hospitals/wards and hospices for chronically ill
- 90 people in other hospitals or wards for chronically ill
- 75 people in orthopedic wards and institutions for the physically handicapped
- 75 people in homes for the mentally retarded
- 54 people in hospitals or wards for drug/alcohol abuse
- 44 people in homes or halfway houses for drug/alcohol abuse
- 23 people in unknown juvenile institutions
- 18 people in residential treatment centers for emotionally disturbed children
- 9 people in other group homes
- 5 people in halfway houses
- 4 people in other nonhousehold living situations
- 3 people in other types of correctional institutions
Banks with most branches in Fort Smith (2011 data):
- The First National Bank of Fort Smith: 9 branches. Info updated 2010/01/29: Bank assets: $1,071.2 mil, Deposits: $880.1 mil, local headquarters, positive income, Commercial Lending Specialization, 17 total offices, Holding Company: First Bank Corp
- Arvest Bank: 9 branches. Info updated 2010/11/29: Bank assets: $12,520.8 mil, Deposits: $10,446.2 mil, headquarters in Fayetteville, AR, positive income, Commercial Lending Specialization, 241 total offices, Holding Company: Arvest Bank Group, Inc.
- Regions Bank: Central Branch, Massard Crossing, Southside, Fianna Hills, Fort Smith Main. Info updated 2011/02/24: Bank assets: $123,368.2 mil, Deposits: $98,301.3 mil, headquarters in Birmingham, AL, positive income, Commercial Lending Specialization, 1778 total offices, Holding Company: Regions Financial Corporation
- BancorpSouth Bank: Riley Farm Branch, East Branch, North Branch, Mall Branch, Fort Smith Main. Info updated 2007/07/18: Bank assets: $12,990.3 mil, Deposits: $10,863.8 mil, headquarters in Tupelo, MS, positive income, Commercial Lending Specialization, 271 total offices, Holding Company: Bancorpsouth, Inc.
- Benefit Bank: Green Road Branch, Highway 71 Branch, at 8300 Phoenix Avenue, Waldron Branch. Info updated 2011/07/21: Bank assets: $210.9 mil, Deposits: $173.6 mil, local headquarters, negative income in the last year, Commercial Lending Specialization, 5 total offices
- Liberty Bank of Arkansas: Highway 71 South Branch, Fort Smith Branch, Rogers Avenue Branch, Fort Smith Drive Thru Branch. Info updated 2008/10/31: Bank assets: $2,807.0 mil, Deposits: $2,160.9 mil, headquarters in Jonesboro, AR, positive income, Commercial Lending Specialization, 46 total offices, Holding Company: Liberty Bancshares, Inc
- Simmons First National Bank: Albert Pike Branch, Stonewood Villge Branch, South Branch, Brooken Hill Branch. Info updated 2010/10/19: Bank assets: $1,849.8 mil, Deposits: $1,513.0 mil, headquarters in Pine Bluff, AR, positive income, 45 total offices, Holding Company: Simmons First National Corporation
- Bank of the Ozarks: Fort Smith Rogers Branch, Fort Smith Phoenix Branch, Fort Smith Zero St Branch. Info updated 2011/05/03: Bank assets: $3,828.0 mil, Deposits: $2,955.2 mil, headquarters in Little Rock, AR, positive income, Commercial Lending Specialization, 115 total offices, Holding Company: Bank Of The Ozarks Inc
- Chambers Bank: Chambers Branch - Fort Smith at 8400 Rogers Avenue, branch established on 2002/01/14; Towson Avenue Branch at 4418 Towson Avenue, branch established on 2001/05/07. Info updated 2008/12/08: Bank assets: $711.4 mil, Deposits: $589.0 mil, headquarters in Danville, AR, negative income in the last year, Commercial Lending Specialization, 20 total offices, Holding Company: Chambers Bancshares, Inc.
- 2 other banks with 3 local branches
For population 15 years and over in Fort Smith:
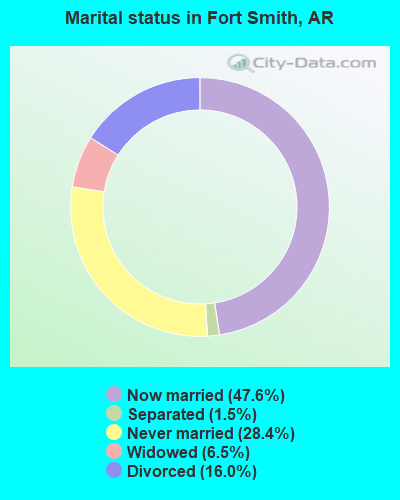
- Never married: 28.4%
- Now married: 47.6%
- Separated: 1.5%
- Widowed: 6.5%
- Divorced: 16.0%
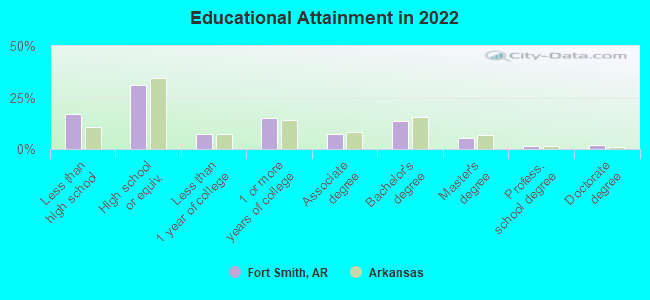
For population 25 years and over in Fort Smith:
- High school or higher: 82.9%
- Bachelor's degree or higher: 22.0%
- Graduate or professional degree: 8.7%
- Unemployed: 5.1%
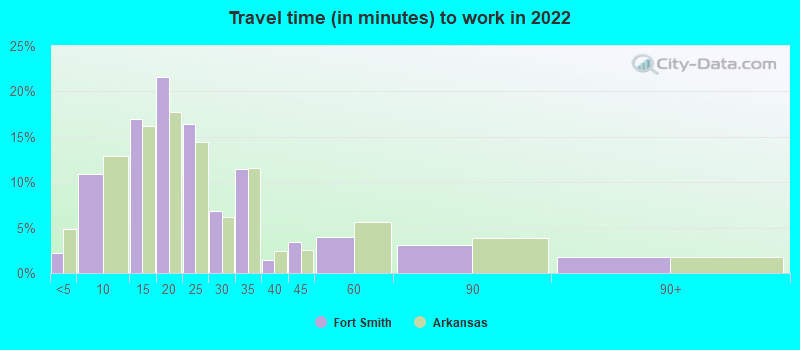
- Mean travel time to work (commute): 14.6 minutes
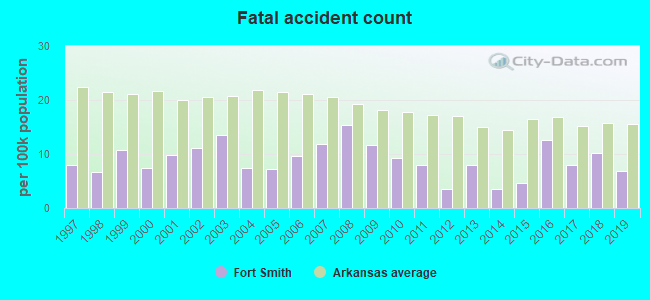
| Here: | 15.8 |
| Arkansas average: | 11.4 |
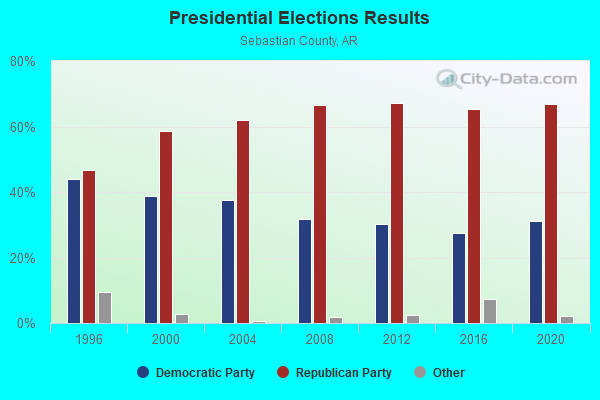
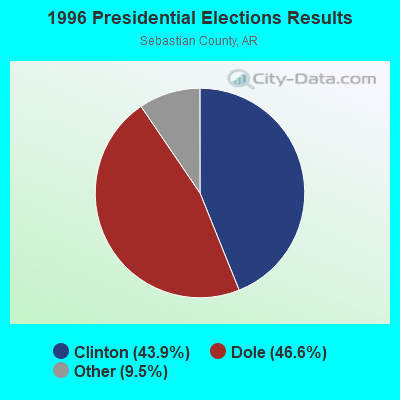
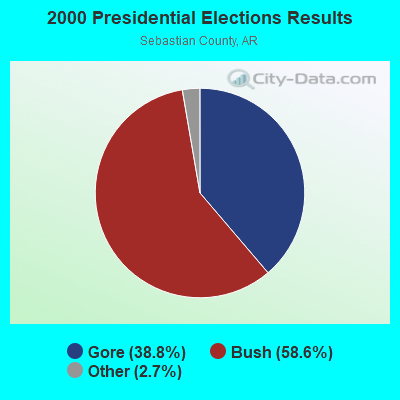
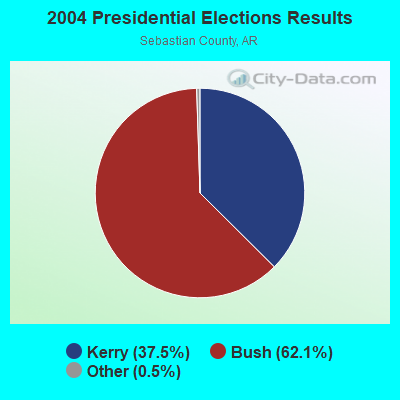

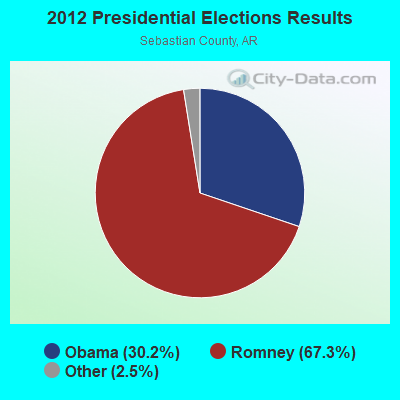
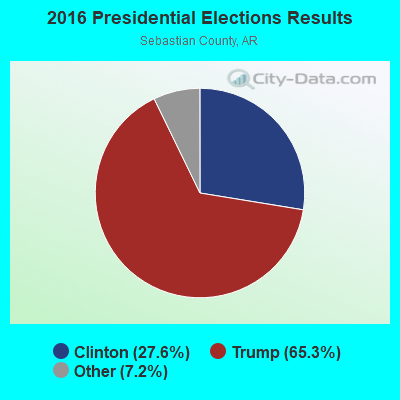
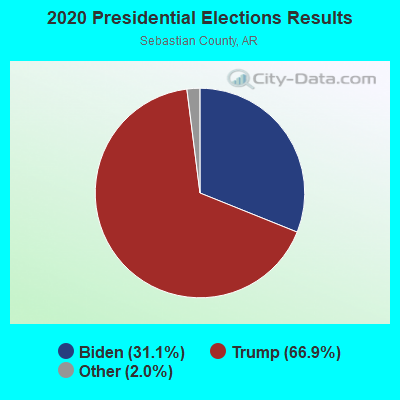
Graphs represent county-level data. Detailed 2008 Election Results
Religion statistics for Fort Smith, AR (based on Sebastian County data)
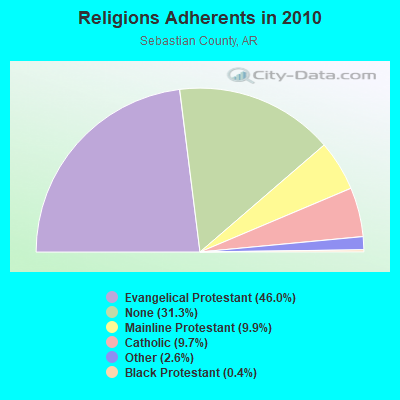
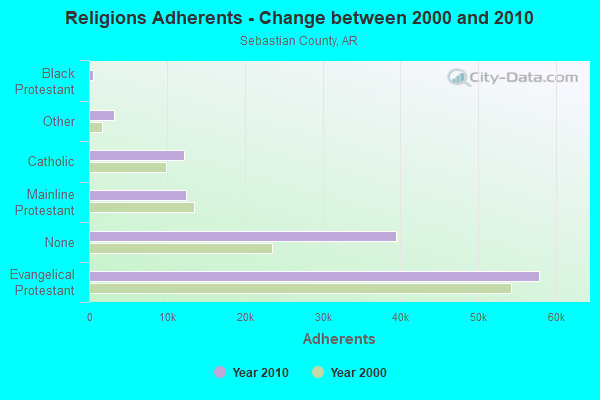
| Religion | Adherents | Congregations |
|---|---|---|
| Evangelical Protestant | 57,844 | 157 |
| Mainline Protestant | 12,423 | 34 |
| Catholic | 12,251 | 6 |
| Other | 3,241 | 13 |
| Black Protestant | 555 | 4 |
| Orthodox | 60 | 1 |
| None | 39,370 | - |
Food Environment Statistics:
| This county: | 1.65 / 10,000 pop. |
| Arkansas: | 2.02 / 10,000 pop. |
| Sebastian County: | 0.33 / 10,000 pop. |
| Arkansas: | 0.25 / 10,000 pop. |
| Sebastian County: | 0.74 / 10,000 pop. |
| Arkansas: | 0.59 / 10,000 pop. |
| This county: | 5.27 / 10,000 pop. |
| State: | 4.94 / 10,000 pop. |
| This county: | 8.57 / 10,000 pop. |
| State: | 6.66 / 10,000 pop. |
| Sebastian County: | 10.1% |
| Arkansas: | 9.8% |
| Sebastian County: | 27.8% |
| Arkansas: | 29.1% |
| This county: | 19.1% |
| State: | 13.6% |
Health and Nutrition:
| Here: | 48.3% |
| State: | 48.2% |
| Fort Smith: | 44.5% |
| Arkansas: | 44.2% |
| Here: | 28.5 |
| Arkansas: | 28.9 |
| Fort Smith: | 21.6% |
| Arkansas: | 21.6% |
| Fort Smith: | 11.3% |
| Arkansas: | 11.3% |
| Fort Smith: | 6.8 |
| State: | 6.8 |
| This city: | 32.4% |
| State: | 34.0% |
| Fort Smith: | 54.6% |
| State: | 54.4% |
| Fort Smith: | 78.3% |
| Arkansas: | 78.0% |
More about Health and Nutrition of Fort Smith, AR Residents
| Local government employment and payroll (March 2022) | |||||
| Function | Full-time employees | Monthly full-time payroll | Average yearly full-time wage | Part-time employees | Monthly part-time payroll |
|---|---|---|---|---|---|
| Water Supply | 175 | $803,531 | $55,099 | 0 | $0 |
| Police Protection - Officers | 147 | $820,971 | $67,018 | 0 | $0 |
| Firefighters | 146 | $926,528 | $76,153 | 0 | $0 |
| Sewerage | 92 | $398,439 | $51,970 | 0 | $0 |
| Solid Waste Management | 86 | $369,542 | $51,564 | 0 | $0 |
| Streets and Highways | 65 | $276,547 | $51,055 | 0 | $0 |
| Police - Other | 41 | $168,693 | $49,374 | 1 | $1,977 |
| Financial Administration | 37 | $205,337 | $66,596 | 0 | $0 |
| Parks and Recreation | 33 | $147,374 | $53,591 | 0 | $0 |
| Transit | 32 | $129,974 | $48,740 | 0 | $0 |
| Other and Unallocable | 27 | $133,902 | $59,512 | 0 | $0 |
| Judicial and Legal | 23 | $97,453 | $50,845 | 0 | $0 |
| Other Government Administration | 20 | $138,497 | $83,098 | 9 | $10,941 |
| Airports | 15 | $119,434 | $95,547 | 0 | $0 |
| Housing and Community Development (Local) | 12 | $72,498 | $72,498 | 0 | $0 |
| Welfare | 8 | $31,516 | $47,274 | 0 | $0 |
| Fire - Other | 5 | $26,835 | $64,404 | 0 | $0 |
| Totals for Government | 964 | $4,867,071 | $60,586 | 10 | $12,918 |
Fort Smith government finances - Expenditure in 2021 (per resident):
- Construction - Regular Highways: $27,341,000 ($303.82)
Sewerage: $7,292,000 ($81.03)
Water Utilities: $5,281,000 ($58.68)
Solid Waste Management: $3,379,000 ($37.55)
Air Transportation: $1,642,000 ($18.25)
- Current Operations - Water Utilities: $19,475,000 ($216.41)
Police Protection: $13,899,000 ($154.45)
Local Fire Protection: $13,088,000 ($145.44)
Solid Waste Management: $12,029,000 ($133.67)
General - Other: $10,652,000 ($118.37)
Sewerage: $9,474,000 ($105.28)
Regular Highways: $7,407,000 ($82.31)
Central Staff Services: $3,332,000 ($37.03)
Libraries: $2,927,000 ($32.53)
Air Transportation: $2,183,000 ($24.26)
Financial Administration: $2,163,000 ($24.04)
Transit Utilities: $2,153,000 ($23.92)
Judicial and Legal Services: $1,908,000 ($21.20)
Parks and Recreation: $1,249,000 ($13.88)
Housing and Community Development: $1,014,000 ($11.27)
Parking Facilities: $174,000 ($1.93)
Health - Other: $173,000 ($1.92)
- General - Interest on Debt: $19,730,000 ($219.24)
- Other Capital Outlay - General - Other: $4,849,000 ($53.88)
Libraries: $42,000 ($0.47)
Parks and Recreation: $32,000 ($0.36)
- Water Utilities - Interest on Debt: $8,632,000 ($95.92)
Fort Smith government finances - Revenue in 2021 (per resident):
- Charges - Sewerage: $26,840,000 ($298.25)
Solid Waste Management: $17,364,000 ($192.95)
Air Transportation: $2,233,000 ($24.81)
Parks and Recreation: $379,000 ($4.21)
Other: $199,000 ($2.21)
Parking Facilities: $134,000 ($1.49)
- Federal Intergovernmental - Air Transportation: $4,653,000 ($51.70)
Health and Hospitals: $3,380,000 ($37.56)
Housing and Community Development: $1,009,000 ($11.21)
- Local Intergovernmental - General Local Government Support: $18,246,000 ($202.75)
- Miscellaneous - Interest Earnings: $18,842,000 ($209.37)
General Revenue - Other: $3,788,000 ($42.09)
Fines and Forfeits: $1,913,000 ($21.26)
Donations From Private Sources: $27,000 ($0.30)
Sale of Property: $16,000 ($0.18)
- Revenue - Water Utilities: $24,523,000 ($272.50)
Transit Utilities: $148,000 ($1.64)
- State Intergovernmental - Highways: $6,490,000 ($72.12)
Other: $3,791,000 ($42.13)
Transit Utilities: $2,391,000 ($26.57)
General Local Government Support: $2,330,000 ($25.89)
Sewerage: $325,000 ($3.61)
Water Utilities: $325,000 ($3.61)
- Tax - General Sales and Gross Receipts: $46,325,000 ($514.77)
Property: $14,374,000 ($159.73)
Public Utilities Sales: $6,114,000 ($67.94)
Other License: $1,909,000 ($21.21)
Other Selective Sales: $632,000 ($7.02)
Fort Smith government finances - Debt in 2021 (per resident):
- Long Term Debt - Outstanding Nonguaranteed - Industrial Revenue: $533,985,000 ($5933.69)
Beginning Outstanding - Public Debt for Private Purpose: $436,735,000 ($4853.04)
Beginning Outstanding - Unspecified Public Purpose: $280,550,000 ($3117.50)
Outstanding Unspecified Public Purpose: $256,360,000 ($2848.70)
Retired Unspecified Public Purpose: $24,190,000 ($268.80)
Fort Smith government finances - Cash and Securities in 2021 (per resident):
- Bond Funds - Cash and Securities: $51,179,000 ($568.71)
- Other Funds - Cash and Securities: $148,847,000 ($1654.00)
- Sinking Funds - Cash and Securities: $558,361,000 ($6204.56)
| Businesses in Fort Smith, AR | ||||
| Name | Count | Name | Count | |
|---|---|---|---|---|
| ALDI | 1 | Lowe's | 1 | |
| AT&T | 6 | Marriott | 1 | |
| Abercrombie & Fitch | 1 | MasterBrand Cabinets | 5 | |
| Academy Sports + Outdoors | 1 | Maurices | 1 | |
| Ace Hardware | 2 | Mazda | 1 | |
| Advance Auto Parts | 2 | McDonald's | 6 | |
| Aeropostale | 1 | Motherhood Maternity | 1 | |
| AmericInn | 1 | New Balance | 1 | |
| American Eagle Outfitters | 1 | Nike | 1 | |
| Applebee's | 1 | Nissan | 1 | |
| Arby's | 2 | Olive Garden | 1 | |
| Ashley Furniture | 1 | Pac Sun | 1 | |
| Bath & Body Works | 1 | Panera Bread | 1 | |
| Baymont Inn | 1 | Papa John's Pizza | 1 | |
| Bed Bath & Beyond | 1 | Payless | 3 | |
| Blockbuster | 1 | Penske | 2 | |
| Budget Car Rental | 1 | Pier 1 Imports | 1 | |
| Burger King | 4 | Pizza Hut | 3 | |
| Catherines | 1 | Plato's Closet | 1 | |
| Charlotte Russe | 1 | Quiznos | 2 | |
| Chevrolet | 1 | RadioShack | 2 | |
| Chick-Fil-A | 1 | Red Lobster | 1 | |
| Cinnabon | 1 | Rue21 | 1 | |
| Cricket Wireless | 5 | SAS Shoes | 2 | |
| Curves | 1 | SONIC Drive-In | 7 | |
| Dairy Queen | 1 | Sears | 3 | |
| Deb | 1 | Sephora | 1 | |
| Domino's Pizza | 1 | Shoe Carnival | 1 | |
| FedEx | 18 | Spencer Gifts | 1 | |
| Finish Line | 1 | Sprint Nextel | 1 | |
| Firestone Complete Auto Care | 1 | Staples | 1 | |
| Ford | 1 | Starbucks | 1 | |
| GNC | 1 | Subway | 8 | |
| GameStop | 2 | Super 8 | 1 | |
| Goodwill | 3 | T-Mobile | 3 | |
| H&R Block | 3 | T.G.I. Driday's | 1 | |
| Hardee's | 4 | T.J.Maxx | 1 | |
| Haworth | 1 | Taco Bell | 5 | |
| Hilton | 1 | Target | 1 | |
| Hobby Lobby | 1 | Toyota | 1 | |
| Holiday Inn | 3 | Toys"R"Us | 1 | |
| Honda | 1 | Travelodge | 1 | |
| Hot Topic | 1 | True Value | 1 | |
| IHOP | 1 | U-Haul | 7 | |
| JCPenney | 1 | UPS | 25 | |
| Jones New York | 3 | Vans | 2 | |
| Journeys | 1 | Verizon Wireless | 1 | |
| Justice | 1 | Victoria's Secret | 1 | |
| KFC | 3 | Village Inn | 1 | |
| Kohl's | 1 | Volkswagen | 1 | |
| La Quinta | 1 | Waffle House | 2 | |
| La-Z-Boy | 2 | Walgreens | 3 | |
| Lane Furniture | 3 | Walmart | 4 | |
| Long John Silver's | 2 | |||
Strongest AM radio stations in Fort Smith:
- KYHN (1320 AM; 10 kW; FORT SMITH, AR; Owner: CAPSTAR TX LIMITED PARTNERSHIP)
- KWHN (1650 AM; 10 kW; FT. SMITH, AR; Owner: CAPSTAR TX LIMITED PARTNERSHIP)
- KFPW (1230 AM; 1 kW; FORT SMITH, AR; Owner: PHARIS BROADCASTING, INC.)
- KFSA (950 AM; 1 kW; FORT SMITH, AR; Owner: FRED H. BAKER, SR.)
- KHGG (1580 AM; 1 kW; VAN BUREN, AR; Owner: PHARIS BROADCASTING, INC.)
- KTCS (1410 AM; 1 kW; FORT SMITH, AR; Owner: BIG CHIEF BROADCASTING CO.)
- KAYR (1060 AM; daytime; 0 kW; VAN BUREN, AR; Owner: CUMULUS LICENSING CORP.)
- KRMG (740 AM; 50 kW; TULSA, OK; Owner: CXR HOLDINGS, INC.)
- KFAQ (1170 AM; 50 kW; TULSA, OK; Owner: JOURNAL BROADCAST CORPORATION)
- KFAY (1030 AM; 10 kW; FARMINGTON, AR; Owner: CUMULUS LICENSING CORP)
- KGHT (880 AM; 50 kW; SHERIDAN, AR; Owner: METROPOLITAN RADIO GROUP, INC.)
- KAAY (1090 AM; 50 kW; LITTLE ROCK, AR; Owner: CITADEL BROADCASTING COMPANY)
- KEEL (710 AM; 50 kW; SHREVEPORT, LA; Owner: CITICASTERS LICENSES, L.P.)
Strongest FM radio stations in Fort Smith:
- KLSZ-FM (102.7 FM; VAN BUREN, AR; Owner: CUMULUS LICENSING CORP.)
- KISR (93.7 FM; FORT SMITH, AR; Owner: STEREO 93, INC.)
- KAOW (88.9 FM; FORT SMITH, AR; Owner: AMERICAN FAMILY ASSOCIATION)
- KREU (92.3 FM; ROLAND, OK; Owner: STAR 92 CO.)
- K209CA (89.7 FM; VAN BUREN, AR; Owner: BIBLE BROADCASTING NETWORK, INC.)
- K254AM (98.7 FM; FORT SMITH, AR; Owner: EDUCATIONAL MEDIA FOUNDATION)
- KZBB (97.9 FM; POTEAU, OK; Owner: CAPSTAR TX LIMITED PARTNERSHIP)
- KMAG (99.1 FM; FORT SMITH, AR; Owner: CAPSTAR TX LIMITED PARTNERSHIP)
- KTCS-FM (99.9 FM; FORT SMITH, AR; Owner: BIG CHIEF BROADCASTING COMPANY)
- K204EW (88.7 FM; POTEAU, OK; Owner: CALVARY CHAPEL OF TWIN FALLS, INC.)
- K219CN (91.7 FM; POTEAU, OK; Owner: AMERICAN FAMILY ASSOCIATION)
- KARG (91.7 FM; POTEAU, OK; Owner: AMERICAN FAMILY ASSOCIATION)
- KOMS (107.3 FM; POTEAU, OK; Owner: CUMULUS LICENSING CORP.)
- KBBQ-FM (100.7 FM; FORT SMITH, AR; Owner: CUMULUS LICENSING CORP.)
- K224AP (92.7 FM; FORT SMITH, AR; Owner: FRED H. BAKER, JR.)
- K232BX (94.3 FM; FORT SMITH, AR; Owner: FRED BAKER, JR.)
- K285CN (104.9 FM; FORT SMITH, AR; Owner: FRED BAKER, JR.)
- KKRI (88.1 FM; POCOLA, OK; Owner: EDUCATIONAL MEDIA FOUNDATION)
- KZKZ-FM (106.3 FM; GREENWOOD, AR; Owner: FAMILY COMMUNICATIONS, INC.)
- KKBD (95.9 FM; SALLISAW, OK; Owner: CAPSTAR TX LIMITED PARTNERSHIP)
TV broadcast stations around Fort Smith:
- KFSM-TV (Channel 5; FORT SMITH, AR; Owner: NEW YORK TIMES MANAGEMENT SERVICES)
- KBBL-CA (Channel 9; WINSLOW, AR; Owner: FORT SMITH 46, INC.)
- KFDF-CA (Channel 10; FORT SMITH, AR; Owner: FORT SMITH 46, INC.)
- K14JJ (Channel 14; FORT SMITH, AR; Owner: ELLERBECK FAMILY PARTNERS II LTD.)
- K36EH (Channel 36; FORT SMITH, AR; Owner: ELLERBECK FAMILY PARTNERS II LTD.)
- K43EZ (Channel 43; FORT SMITH, AR; Owner: FORT SMITH 46, INC.)
- K58FB (Channel 58; FORT SMITH, AR; Owner: GEORGE W. MATTHEWS, JR.)
- K66FM (Channel 66; FORT SMITH, AR; Owner: FORT SMITH 46, INC.)
- K16ER (Channel 16; FORT SMITH, AR; Owner: TRINITY BROADCASTING NETWORK)
- KPBI-CA (Channel 46; FORT SMITH, AR; Owner: FORT SMITH 46, INC.)
- K34EN (Channel 34; FORT SMITH, AR; Owner: TV34, INC.)
- KAFT (Channel 13; FAYETTEVILLE, AR; Owner: ARKANSAS EDUCATIONAL TELEVISION COMMISSION)
- K59GJ (Channel 59; POTEAU, OK; Owner: FORT SMITH 46, INC.)
- KPOM-TV (Channel 24; FORT SMITH, AR; Owner: J.D.G. TELEVISION, INC.)
Medal of Honor Recipients
Medal of Honor Recipient born in Fort Smith: Henry W. Wheeler.
- National Bridge Inventory (NBI) Statistics
- 170Number of bridges
- 2,051ft / 625mTotal length
- $6,733,000Total costs
- 1,847,075Total average daily traffic
- 71,421Total average daily truck traffic
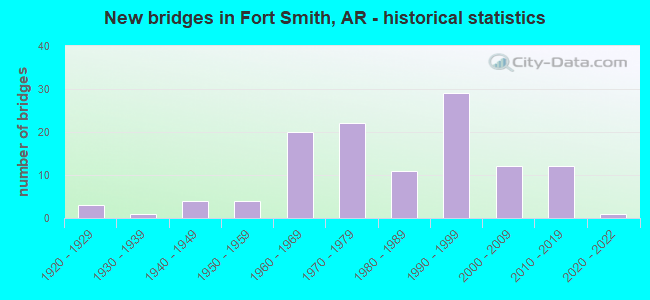
- New bridges - historical statistics
- 31920-1929
- 11930-1939
- 41940-1949
- 41950-1959
- 201960-1969
- 221970-1979
- 111980-1989
- 291990-1999
- 122000-2009
- 122010-2019
- 12020-2022
FCC Registered Commercial Land Mobile Towers: 8 (See the full list of FCC Registered Commercial Land Mobile Towers in Fort Smith, AR)
FCC Registered Private Land Mobile Towers: 4 (See the full list of FCC Registered Private Land Mobile Towers)
FCC Registered Broadcast Land Mobile Towers: 66 (See the full list of FCC Registered Broadcast Land Mobile Towers)
FCC Registered Microwave Towers: 102 (See the full list of FCC Registered Microwave Towers in this town)
FCC Registered Paging Towers: 9 (See the full list of FCC Registered Paging Towers)
FCC Registered Maritime Coast & Aviation Ground Towers: 16 (See the full list of FCC Registered Maritime Coast & Aviation Ground Towers)
FCC Registered Amateur Radio Licenses: 472 (See the full list of FCC Registered Amateur Radio Licenses in Fort Smith)
FAA Registered Aircraft Manufacturers and Dealers: 4 (See the full list of FAA Registered Manufacturers and Dealers in Fort Smith)
FAA Registered Aircraft: 89 (See the full list of FAA Registered Aircraft)
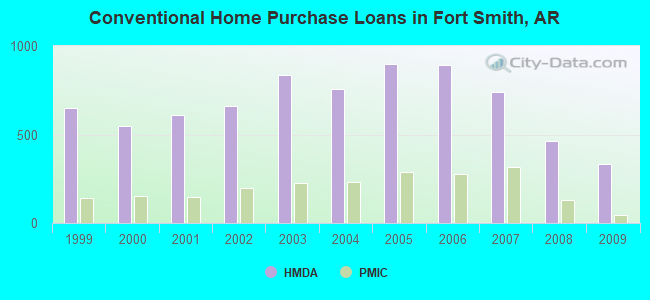
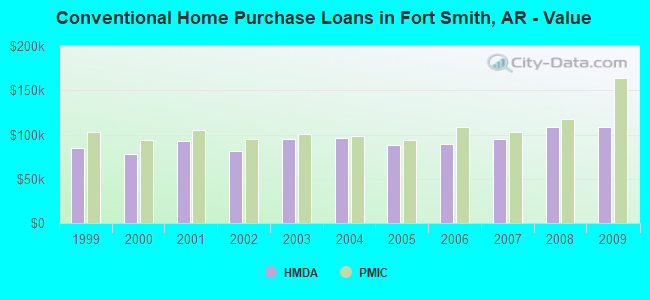
| Home Mortgage Disclosure Act Aggregated Statistics For Year 2009 (Based on 17 full and 4 partial tracts) | ||||||||||||||
| A) FHA, FSA/RHS & VA Home Purchase Loans | B) Conventional Home Purchase Loans | C) Refinancings | D) Home Improvement Loans | E) Loans on Dwellings For 5+ Families | F) Non-occupant Loans on < 5 Family Dwellings (A B C & D) | G) Loans On Manufactured Home Dwelling (A B C & D) | ||||||||
|---|---|---|---|---|---|---|---|---|---|---|---|---|---|---|
| Number | Average Value | Number | Average Value | Number | Average Value | Number | Average Value | Number | Average Value | Number | Average Value | Number | Average Value | |
| LOANS ORIGINATED | 420 | $96,955 | 336 | $108,297 | 998 | $122,236 | 177 | $33,562 | 19 | $752,668 | 252 | $84,728 | 16 | $6,973 |
| APPLICATIONS APPROVED, NOT ACCEPTED | 9 | $103,430 | 13 | $204,935 | 32 | $150,881 | 18 | $23,295 | 0 | $0 | 2 | $58,445 | 0 | $0 |
| APPLICATIONS DENIED | 61 | $87,769 | 52 | $70,089 | 287 | $107,851 | 91 | $21,212 | 2 | $700,000 | 31 | $54,939 | 5 | $38,502 |
| APPLICATIONS WITHDRAWN | 40 | $90,325 | 21 | $71,514 | 189 | $119,818 | 23 | $38,489 | 2 | $305,000 | 17 | $60,547 | 1 | $24,000 |
| FILES CLOSED FOR INCOMPLETENESS | 12 | $78,103 | 6 | $42,667 | 38 | $127,394 | 3 | $28,333 | 0 | $0 | 3 | $57,333 | 0 | $0 |
Detailed mortgage data for all 20 tracts in Fort Smith, AR
| Private Mortgage Insurance Companies Aggregated Statistics For Year 2009 (Based on 16 full and 4 partial tracts) | ||||||
| A) Conventional Home Purchase Loans | B) Refinancings | C) Non-occupant Loans on < 5 Family Dwellings (A & B) | ||||
|---|---|---|---|---|---|---|
| Number | Average Value | Number | Average Value | Number | Average Value | |
| LOANS ORIGINATED | 48 | $163,285 | 43 | $143,963 | 0 | $0 |
| APPLICATIONS APPROVED, NOT ACCEPTED | 11 | $179,959 | 11 | $151,612 | 1 | $28,000 |
| APPLICATIONS DENIED | 3 | $200,693 | 6 | $250,315 | 0 | $0 |
| APPLICATIONS WITHDRAWN | 0 | $0 | 0 | $0 | 0 | $0 |
| FILES CLOSED FOR INCOMPLETENESS | 6 | $57,667 | 0 | $0 | 1 | $37,000 |
2002 - 2018 National Fire Incident Reporting System (NFIRS) incidents
- Fire incident types reported to NFIRS in Fort Smith, AR
- 2,69641.3%Structure Fires
- 2,52738.8%Outside Fires
- 1,13817.5%Mobile Property/Vehicle Fires
- 1602.5%Other
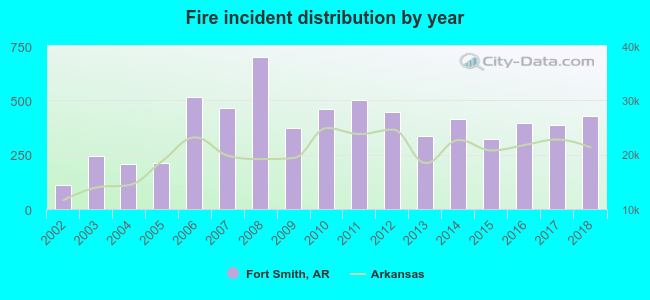 Based on the data from the years 2002 - 2018 the average number of fire incidents per year is 384. The highest number of reported fires - 700 took place in 2008, and the least - 109 in 2002. The data has a growing trend.
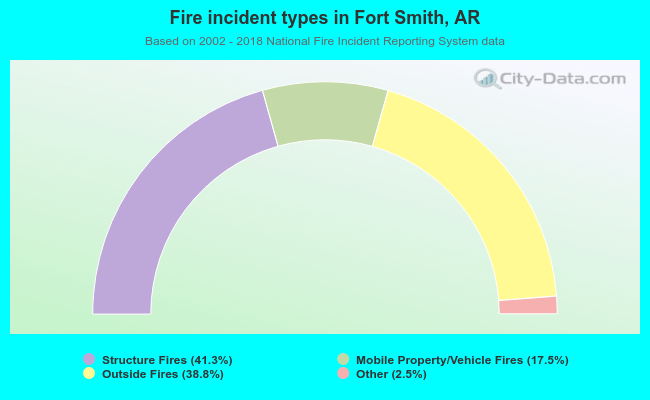 When looking into fire subcategories, the most reports belonged to: Structure Fires (41.3%), and Outside Fires (38.8%).
Fire-safe hotels and motels in Fort Smith, Arkansas:
- Travelodge, 5103 Towson Ave, Fort Smith, Arkansas 72901 , Phone: (479) 646-2931, Fax: (479) 648-9085
- Executive Hotel at City Center, 700 Rogers Ave, Fort Smith, Arkansas 72901 , Phone: (479) 783-1000, Fax: (479) 783-0312
- Baymont Inn & Suites Fort Smith, 2123 Burnham Rd, Fort Smith, Arkansas 72903 , Phone: (479) 484-5770, Fax: (479) 484-0579
- Americinn, 2120 Burnham Rd, Fort Smith, Arkansas 72903 , Phone: (479) 484-0227, Fax: (479) 484-5885
- Guesthouse Inn, 3600 Grinnell Ave, Fort Smith, Arkansas 72908 , Phone: (479) 646-5100, Fax: (479) 646-4598
- Aspen Hotel And Suites, 2900 S 68th, Fort Smith, Arkansas 72903 , Phone: (479) 452-9000, Fax: (479) 484-0551
- Residence Inn By Marriott Fort Smith, 3005 S 74th, Fort Smith, Arkansas 72903 , Phone: (479) 478-8300, Fax: (479) 478-8302
- La Quinta Inn & Suites, 6700 Boston St, Fort Smith, Arkansas 72903 , Phone: (479) 484-0303, Fax: (479) 484-0305
- 7 other hotels and motels
| Most common first names in Fort Smith, AR among deceased individuals | ||
| Name | Count | Lived (average) |
|---|---|---|
| John | 647 | 75.2 years |
| James | 616 | 72.2 years |
| William | 611 | 74.2 years |
| Mary | 604 | 79.2 years |
| Robert | 397 | 71.1 years |
| Charles | 339 | 72.0 years |
| George | 286 | 74.2 years |
| Ruth | 203 | 79.4 years |
| Helen | 194 | 78.2 years |
| Margaret | 184 | 80.5 years |
| Most common last names in Fort Smith, AR among deceased individuals | ||
| Last name | Count | Lived (average) |
|---|---|---|
| Smith | 329 | 76.1 years |
| Jones | 231 | 74.5 years |
| Brown | 217 | 75.7 years |
| Johnson | 202 | 76.3 years |
| Williams | 193 | 74.8 years |
| Moore | 151 | 76.8 years |
| Davis | 143 | 74.0 years |
| Wilson | 126 | 72.9 years |
| Martin | 116 | 74.1 years |
| Harris | 103 | 73.8 years |
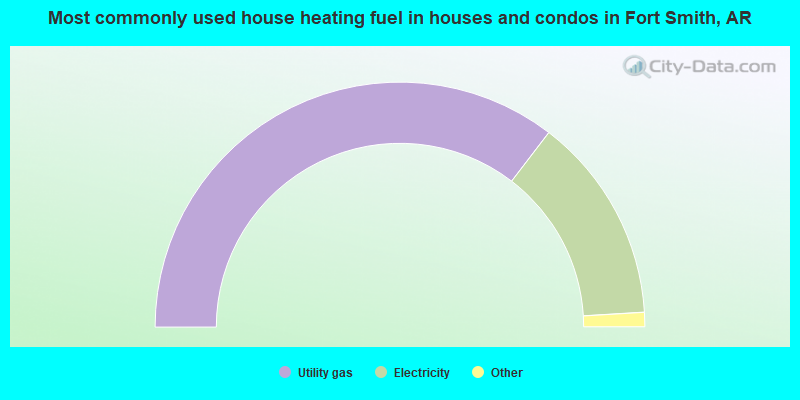
- 70.8%Utility gas
- 27.3%Electricity
- 0.6%Bottled, tank, or LP gas
- 0.6%Wood
- 0.3%No fuel used
- 0.1%Fuel oil, kerosene, etc.
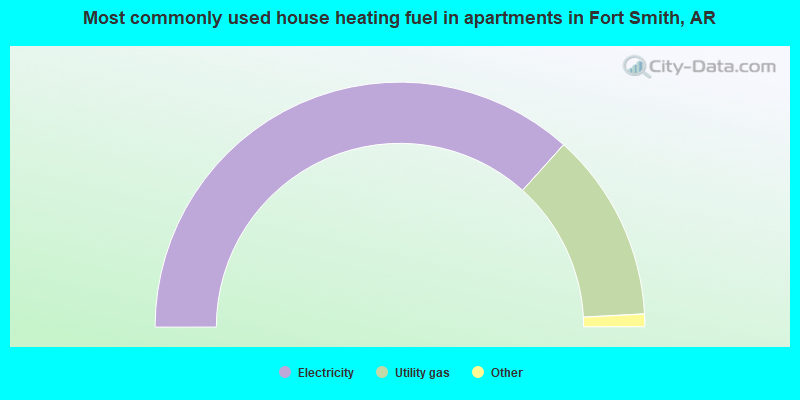
- 73.3%Electricity
- 25.0%Utility gas
- 1.2%Bottled, tank, or LP gas
- 0.4%No fuel used
Fort Smith compared to Arkansas state average:
- Unemployed percentage significantly below state average.
- Black race population percentage below state average.
- Hispanic race population percentage above state average.
- Foreign-born population percentage significantly above state average.
- Length of stay since moving in below state average.
Fort Smith on our top lists:
- #5 on the list of "Top 101 cities with largest percentage of females in industries: manufacturing (population 50,000+)"
- #9 on the list of "Top 101 cities with largest percentage of females in occupations: production occupations (population 50,000+)"
- #19 on the list of "Top 101 cities with largest percentage of males in industries: other services, except public administration (population 50,000+)"
- #26 on the list of "Top 101 cities with largest percentage of males in occupations: building and grounds cleaning and maintenance occupations (population 50,000+)"
- #26 on the list of "Top 101 cities with largest percentage of males in occupations: production occupations (population 50,000+)"
- #28 on the list of "Top 101 cities with the highest number of rapes per 100,000 residents, excludes tourist destinations and others with a lot of outsiders visiting based on city industries data (population 50,000+)"
- #28 on the list of "Top 100 cities with shortest commuting times (pop. 50,000+)"
- #44 on the list of "Top 101 cities with largest percentage of females in industries: construction (population 50,000+)"
- #44 on the list of "Top 101 cities with the largest house values disparities (population 50,000+)"
- #46 on the list of "Top 101 cities with the highest number of thefts per 100,000 residents, excludes tourist destinations and others with a lot of outsiders visiting based on city industries data (population 50,000+)"
- #52 on the list of "Top 101 cities with largest percentage of females in occupations: health technologists and technicians (population 50,000+)"
- #62 on the list of "Top 101 cities with largest percentage of females in occupations: education, training, and library occupations (population 50,000+)"
- #63 on the list of "Top 101 cities with largest percentage of males in industries: mining, quarrying, and oil and gas extraction (population 50,000+)"
- #67 on the list of "Top 101 cities with the highest number of assaults per 100,000 residents, excludes tourist destinations and others with a lot of outsiders visiting based on city industries data (population 50,000+)"
- #68 on the list of "Top 101 cities with largest percentage of males in occupations: healthcare support occupations (population 50,000+)"
- #72 on the list of "Top 101 cities with largest percentage of females in industries: agriculture, forestry, fishing and hunting (population 50,000+)"
- #72 on the list of "Top 101 cities with largest percentage of males in industries: manufacturing (population 50,000+)"
- #73 on the list of "Top 101 cities that people commute into (largest positive percentage daily daytime population change due to commuting) (population 50,000+)"
- #76 on the list of "Top 101 cities with largest percentage of females in industries: mining, quarrying, and oil and gas extraction (population 50,000+)"
- #89 on the list of "Top 101 larger cities with the largest decrease or smallest increase in household income from 2000 (population 50,000+)"
- #68 on the list of "Top 101 counties with the smallest number of people without health insurance coverage in 2000 (pop. 50,000+)"
State forum archive:

|
|
Total of 131 patent applications in 2008-2024.