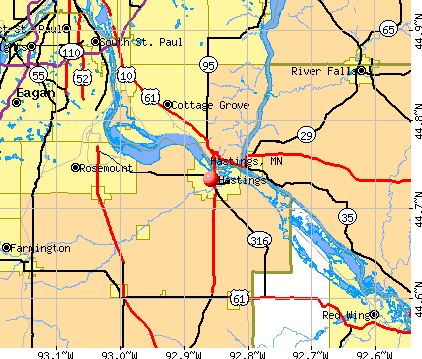
Hastings, Minnesota
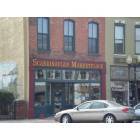
Hastings: Scandinavian Marketplace" in Hastings, MN. A store that sold Scandinavian imports, food, candies, books, etc...
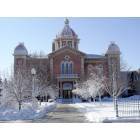
Hastings: Historic Courthouse after fresh snowstorm
Hastings: Veteran
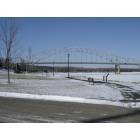
Hastings: Hwy. 61 bridge over the Mississippi River into Hastings

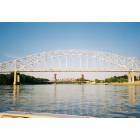
Hastings: The Hastings High Bridge, over the Mississippi River in Hastings, MN. The Bridge was built in 1951 and is sadly slated to be torn down in 2019!
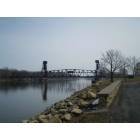
Hastings: Drawbridge over the Mississippi River in Hastings, MN, facing westward.
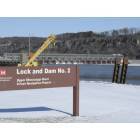
Hastings: Hastings Lock & Dam (also produces hydroelectric power)

Hastings: Hastings bridge
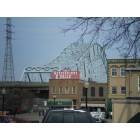
Hastings: A landmark bridge over the Mississippi and the "Mississippi Belle" Italian Restaurant. (Hastings, MN)
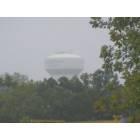
Hastings: Hastings Water Tower
- add
your
Submit your own pictures of this city and show them to the world
- OSM Map
- General Map
- Google Map
- MSN Map
Population change since 2000: +19.3%
| Males: 11,408 | |
| Females: 10,304 |
| Median resident age: | 43.0 years |
| Minnesota median age: | 39.0 years |
Zip codes: 55033.
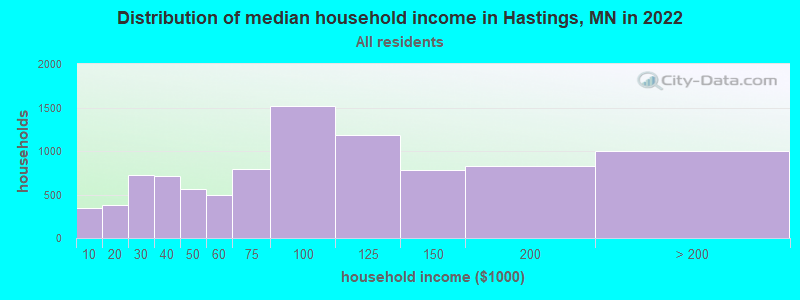
| Hastings: | $84,382 |
| MN: | $82,338 |
Estimated per capita income in 2022: $42,269 (it was $22,075 in 2000)
Hastings city income, earnings, and wages data
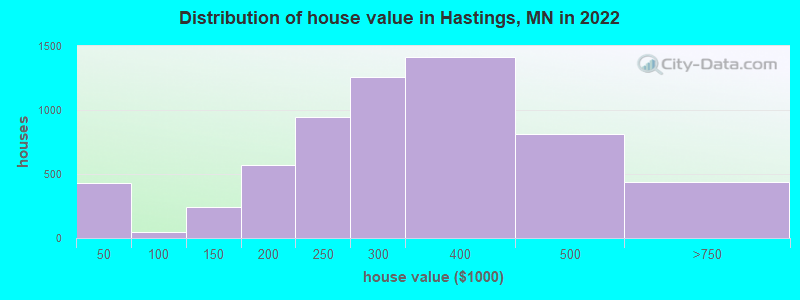
Estimated median house or condo value in 2022: $292,070 (it was $127,200 in 2000)
| Hastings: | $292,070 |
| MN: | $314,600 |
Mean prices in 2022: all housing units: $304,729; detached houses: $350,390; townhouses or other attached units: $283,262; in 2-unit structures: $259,086; in 3-to-4-unit structures: $227,401; in 5-or-more-unit structures: $133,052; mobile homes: $49,460
Median gross rent in 2022: $1,185.
(4.7% for White Non-Hispanic residents, 15.8% for Black residents, 0.5% for Hispanic or Latino residents, 30.2% for other race residents, 23.7% for two or more races residents)
Detailed information about poverty and poor residents in Hastings, MN


Compare current foreclosures in Hastings, MN:
| Photo | Address | Area | Beds / Baths | Price | Details |
|---|---|---|---|---|---|

|
#1
Maple St
Hastings, MN 55033
|
1,068 sq. feet
|
1 baths 3 beds |
show details | |

|
#2
Todd Ct
Hastings, MN 55033
|
1,898 sq. feet
|
4 baths 4 beds |
show details | |

|
#3
Blackbird Trl
Hastings, MN 55033
|
1,186 sq. feet
|
2 baths 4 beds |
show details | |

|
#4
Bailey St
Hastings, MN 55033
|
1,017 sq. feet
|
1 baths 2 beds |
show details | |

|
#5
Saint Croix Trl S
Hastings, MN 55033
|
10,569 sq. feet
|
7 baths 6 beds |
show details | |

|
#6
Ramsey St
Hastings, MN 55033
|
- sq. feet
|
1 baths 3 beds |
show details | |

|
#7
Martin Ln
Hastings, MN 55033
|
- sq. feet
|
2 baths 4 beds |
show details | |

|
#8
Red Wing Blvd
Hastings, MN 55033
|
- sq. feet
|
2 baths 3 beds |
show details | |

|
#9
Brooke Ln
Hastings, MN 55033
|
- sq. feet
|
2 baths 3 beds |
show details | |

|
#10
Glendale Rd
Hastings, MN 55033
|
- sq. feet
|
2 baths 3 beds |
show details |
| Photo | Address | Area | Beds / Baths | Price | Details |
|---|---|---|---|---|---|

|
#11
Steeple Ln
Hastings, MN 55033
|
- sq. feet
|
3 baths 4 beds |
show details | |

|
#12
7th St W
Hastings, MN 55033
|
- sq. feet
|
1 baths 3 beds |
show details | |

|
#13
35th St W
Hastings, MN 55033
|
- sq. feet
|
2 baths 2 beds |
show details | |

|
#14
Bohlken Dr
Hastings, MN 55033
|
- sq. feet
|
2 baths 3 beds |
show details | |

|
#15
18th St E
Hastings, MN 55033
|
- sq. feet
|
5 baths 5 beds |
show details | |

|
#16
Eddy St
Hastings, MN 55033
|
- sq. feet
|
2 baths 3 beds |
show details | |

|
#17
Cari Park Ln
Hastings, MN 55033
|
- sq. feet
|
1 baths 2 beds |
show details | |

|
#18
15th St W
Hastings, MN 55033
|
- sq. feet
|
1 baths 3 beds |
show details | |

|
#19
Bailey St
Hastings, MN 55033
|
- sq. feet
|
1 baths 3 beds |
show details | |

|
#20
15th St W
Hastings, MN 55033
|
- sq. feet
|
3 baths 4 beds |
show details |
| Photo | Address | Area | Beds / Baths | Price | Details |
|---|---|---|---|---|---|

|
#21
Villa Ct
Hastings, MN 55033
|
- sq. feet
|
2 baths 3 beds |
show details | |

|
#22
Brittany Rd
Hastings, MN 55033
|
- sq. feet
|
2 baths 4 beds |
show details | |

|
#23
Ramsey St
Hastings, MN 55033
|
- sq. feet
|
2 baths 2 beds |
show details | |

|
#24
Bailey St
Hastings, MN 55033
|
- sq. feet
|
2 baths 3 beds |
show details | |

|
#25
5th St W
Hastings, MN 55033
|
- sq. feet
|
3 baths 4 beds |
show details | |

|
#26
11th St W
Hastings, MN 55033
|
- sq. feet
|
2 baths 4 beds |
show details | |

|
#27
Red Wing Blvd
Hastings, MN 55033
|
- sq. feet
|
2 baths 4 beds |
show details | |

|
#28
Tiffany Dr
Hastings, MN 55033
|
- sq. feet
|
2 baths 3 beds |
show details | |

|
#29
Rushmore Rd
Hastings, MN 55033
|
- sq. feet
|
2 baths 3 beds |
show details | |

|
#30
Westview Dr Apt 101
Hastings, MN 55033
|
- sq. feet
|
- baths - beds |
show details |
| Photo | Address | Area | Beds / Baths | Price | Details |
|---|---|---|---|---|---|

|
#31
Westview Dr Apt 201
Hastings, MN 55033
|
- sq. feet
|
- baths - beds |
show details | |

|
#32
5th St W
Hastings, MN 55033
|
- sq. feet
|
- baths - beds |
show details | |

|
#33
8th St W
Hastings, MN 55033
|
- sq. feet
|
- baths - beds |
show details | |

|
#34
Village Trl
Hastings, MN 55033
|
- sq. feet
|
- baths - beds |
show details | |

|
#35
Fallbrooke Dr
Hastings, MN 55033
|
- sq. feet
|
- baths - beds |
show details | |

|
#36
Shannon Dr
Hastings, MN 55033
|
- sq. feet
|
- baths - beds |
show details | |

|
#37
Pine St Apt 4
Hastings, MN 55033
|
- sq. feet
|
- baths - beds |
show details | |

|
#38
Whispering Ct Apt 3
Hastings, MN 55033
|
- sq. feet
|
- baths - beds |
show details | |

|
#39
S Frontage Rd Apt 203
Hastings, MN 55033
|
- sq. feet
|
- baths - beds |
show details | |

|
#40
66th St S
Hastings, MN 55033
|
- sq. feet
|
- baths - beds |
show details |
| Photo | Address | Area | Beds / Baths | Price | Details |
|---|---|---|---|---|---|

|
#41
Meggan Dr
Hastings, MN 55033
|
- sq. feet
|
- baths - beds |
show details | |

|
#42
S Frontage Rd Apt C
Hastings, MN 55033
|
- sq. feet
|
- baths - beds |
show details | |

|
#43
18th St E
Hastings, MN 55033
|
- sq. feet
|
- baths - beds |
show details | |

|
Check over 1 million property listings on Foreclosure.com!
|
browse all offers | |||


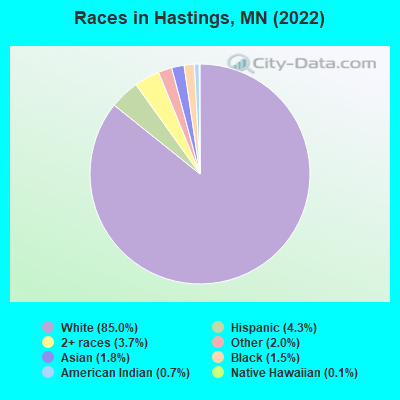
- 18,92285.0%White alone
- 9584.3%Hispanic
- 8213.7%Two or more races
- 4482.0%Other race alone
- 3931.8%Asian alone
- 3371.5%Black alone
- 1630.7%American Indian alone
- 260.1%Native Hawaiian and Other
Pacific Islander alone
Races in Hastings detailed stats: ancestries, foreign born residents, place of birth
According to our research of Minnesota and other state lists, there were 2 registered sex offenders living in Hastings, Minnesota as of April 27, 2024.
The ratio of all residents to sex offenders in Hastings is 11,417 to 1.
The ratio of registered sex offenders to all residents in this city is lower than the state average.
Type |
2009 |
2010 |
2011 |
2012 |
2013 |
2014 |
2015 |
2016 |
2017 |
2018 |
2019 |
2020 |
2021 |
2022 |
|---|---|---|---|---|---|---|---|---|---|---|---|---|---|---|
| Murders (per 100,000) | 0 (0.0) | 0 (0.0) | 0 (0.0) | 0 (0.0) | 0 (0.0) | 1 (4.4) | 0 (0.0) | 1 (4.4) | 0 (0.0) | 0 (0.0) | 0 (0.0) | 0 (0.0) | 1 (4.4) | 0 (0.0) |
| Rapes (per 100,000) | 8 (35.4) | 3 (13.5) | 3 (13.4) | 9 (40.0) | 10 (44.7) | 12 (53.4) | 17 (75.0) | 10 (44.2) | 9 (39.7) | 6 (26.3) | 10 (43.9) | 4 (17.4) | 11 (47.9) | 7 (32.2) |
| Robberies (per 100,000) | 2 (8.8) | 4 (18.0) | 2 (9.0) | 4 (17.8) | 5 (22.4) | 9 (40.0) | 4 (17.7) | 6 (26.5) | 3 (13.2) | 3 (13.2) | 2 (8.8) | 3 (13.1) | 1 (4.4) | 4 (18.4) |
| Assaults (per 100,000) | 11 (48.7) | 16 (72.2) | 24 (107.4) | 20 (88.9) | 17 (76.0) | 18 (80.1) | 22 (97.1) | 29 (128.2) | 24 (105.9) | 33 (144.7) | 27 (118.6) | 30 (130.7) | 9 (39.2) | 26 (119.4) |
| Burglaries (per 100,000) | 84 (371.7) | 60 (270.6) | 88 (393.9) | 106 (471.1) | 57 (254.9) | 54 (240.2) | 61 (269.2) | 53 (234.2) | 53 (233.8) | 49 (214.9) | 57 (250.3) | 44 (191.6) | 43 (187.3) | 35 (160.8) |
| Thefts (per 100,000) | 504 (2,230) | 439 (1,980) | 450 (2,014) | 570 (2,533) | 428 (1,914) | 534 (2,375) | 483 (2,131) | 412 (1,821) | 416 (1,835) | 331 (1,452) | 360 (1,581) | 310 (1,350) | 264 (1,150) | 239 (1,098) |
| Auto thefts (per 100,000) | 19 (84.1) | 26 (117.3) | 25 (111.9) | 26 (115.5) | 22 (98.4) | 16 (71.2) | 22 (97.1) | 30 (132.6) | 25 (110.3) | 32 (140.4) | 33 (144.9) | 37 (161.2) | 23 (100.2) | 14 (64.3) |
| Arson (per 100,000) | 0 (0.0) | 2 (9.0) | 0 (0.0) | 3 (13.3) | 4 (17.9) | 3 (13.3) | 2 (8.8) | 0 (0.0) | 0 (0.0) | 1 (4.4) | 0 (0.0) | 3 (13.1) | 2 (8.7) | 3 (13.8) |
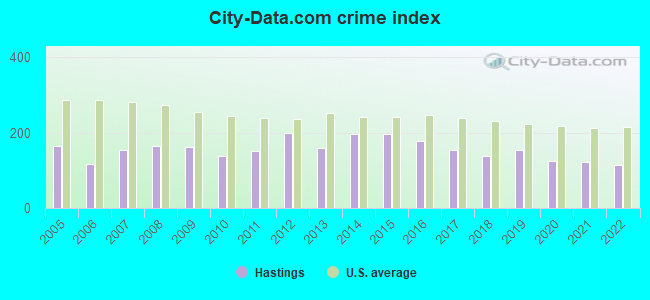
| City-Data.com crime index | 162.7 | 138.2 | 152.0 | 198.6 | 159.9 | 197.1 | 196.6 | 177.6 | 155.5 | 138.3 | 153.8 | 124.3 | 123.3 | 115.4 |
The City-Data.com crime index weighs serious crimes and violent crimes more heavily. Higher means more crime, U.S. average is 246.1. It adjusts for the number of visitors and daily workers commuting into cities.
Crime rate in Hastings detailed stats: murders, rapes, robberies, assaults, burglaries, thefts, arson
Full-time law enforcement employees in 2021, including police officers: 34 (30 officers - 28 male; 2 female).
| Officers per 1,000 residents here: | 1.31 |
| Minnesota average: | 1.76 |
 Recent articles from our blog. Our writers, many of them Ph.D. graduates or candidates, create easy-to-read articles on a wide variety of topics.

 | Cottage Grove , MN 2022 (5 replies) |
| What are the most walkable suburbs? (8 replies) |
| Commute to the Twin City area from red wing (28 replies) |
| Hastings road test? (2 replies) |
| Don't believe everything you read and hear about Twin Cities (29 replies) |
| moving from Cedar Rapids, IA to MSP (12 replies) |
Latest news from Hastings, MN collected exclusively by city-data.com from local newspapers, TV, and radio stations
Hastings, MN City Guides:
Ancestries: German (35.5%), Norwegian (10.6%), American (7.5%), European (6.8%), English (6.6%), Irish (5.4%).
Current Local Time: CST time zone
Incorporated in 1857
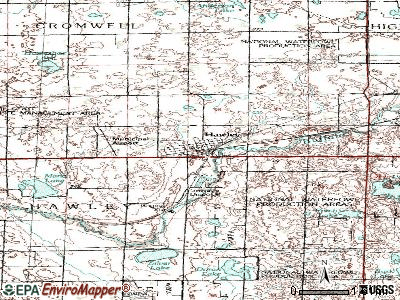
Elevation: 730 feet
Land area: 10.1 square miles.
Population density: 2,145 people per square mile (low).
458 residents are foreign born (1.0% Latin America, 0.4% Asia, 0.4% Europe).
| This city: | 2.1% |
| Minnesota: | 8.5% |
Median real estate property taxes paid for housing units with mortgages in 2022: $2,857 (1.0%)
Median real estate property taxes paid for housing units with no mortgage in 2022: $3,069 (1.1%)
Nearest city with pop. 50,000+: Eagan, MN  (16.3 miles , pop. 63,557).
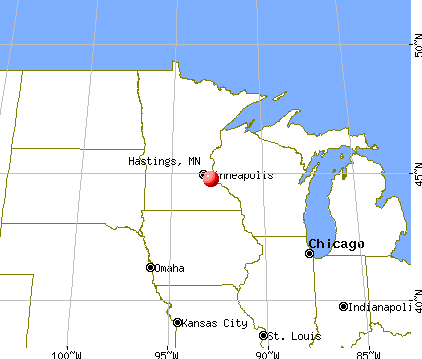
Nearest city with pop. 200,000+: St. Paul, MN (19.8 miles , pop. 287,151).
Nearest city with pop. 1,000,000+: Chicago, IL (328.5 miles , pop. 2,896,016).
Nearest cities:
), ), ), Latitude: 44.73 N, Longitude: 92.86 W
Daytime population change due to commuting: -1,859 (-8.3%)
Workers who live and work in this city: 5,123 (44.3%)
Area code: 651
Hastings, Minnesota accommodation & food services, waste management - Economy and Business Data
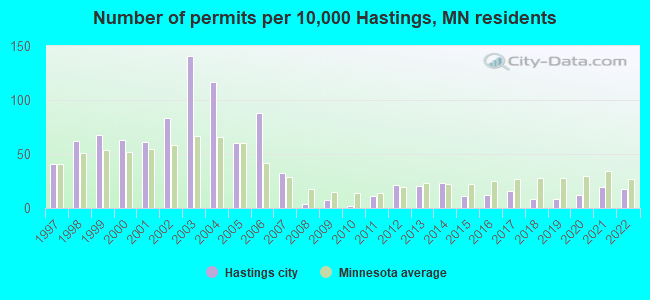
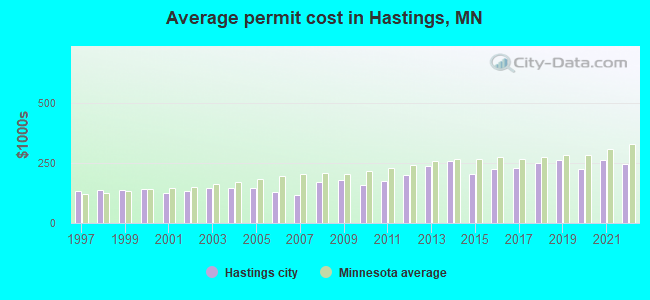
Single-family new house construction building permits:
- 2022: 32 buildings, average cost: $248,000
- 2021: 34 buildings, average cost: $264,100
- 2020: 21 buildings, average cost: $223,500
- 2019: 14 buildings, average cost: $263,400
- 2018: 15 buildings, average cost: $251,300
- 2017: 30 buildings, average cost: $231,000
- 2016: 22 buildings, average cost: $226,400
- 2015: 20 buildings, average cost: $203,100
- 2014: 42 buildings, average cost: $261,300
- 2013: 37 buildings, average cost: $236,800
- 2012: 39 buildings, average cost: $201,100
- 2011: 20 buildings, average cost: $174,000
- 2010: 4 buildings, average cost: $160,700
- 2009: 12 buildings, average cost: $178,400
- 2008: 8 buildings, average cost: $173,300
- 2007: 59 buildings, average cost: $118,500
- 2006: 161 buildings, average cost: $130,300
- 2005: 109 buildings, average cost: $147,600
- 2004: 213 buildings, average cost: $146,700
- 2003: 257 buildings, average cost: $145,200
- 2002: 151 buildings, average cost: $135,200
- 2001: 111 buildings, average cost: $124,800
- 2000: 115 buildings, average cost: $144,400
- 1999: 124 buildings, average cost: $139,300
- 1998: 112 buildings, average cost: $135,900
- 1997: 74 buildings, average cost: $135,200
| Here: | 2.2% |
| Minnesota: | 2.6% |
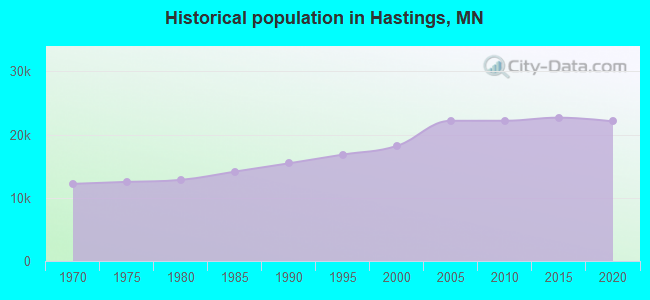
Population change in the 1990s: +2,583 (+16.5%).
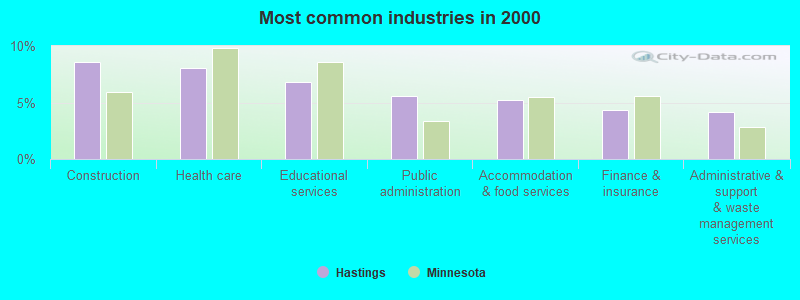
- Construction (8.6%)
- Health care (8.0%)
- Educational services (6.8%)
- Public administration (5.5%)
- Accommodation & food services (5.2%)
- Finance & insurance (4.4%)
- Administrative & support & waste management services (4.2%)
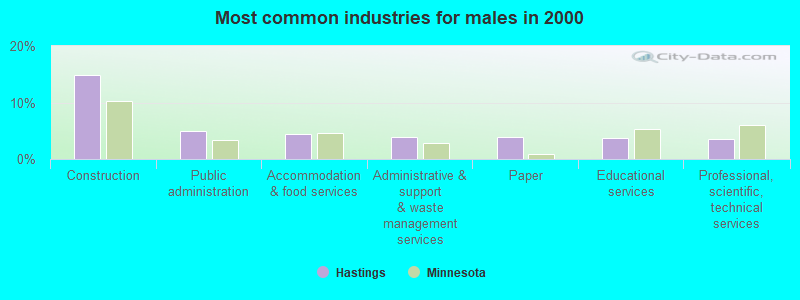
- Construction (14.9%)
- Public administration (5.0%)
- Accommodation & food services (4.4%)
- Administrative & support & waste management services (3.9%)
- Paper (3.8%)
- Educational services (3.7%)
- Professional, scientific, technical services (3.5%)
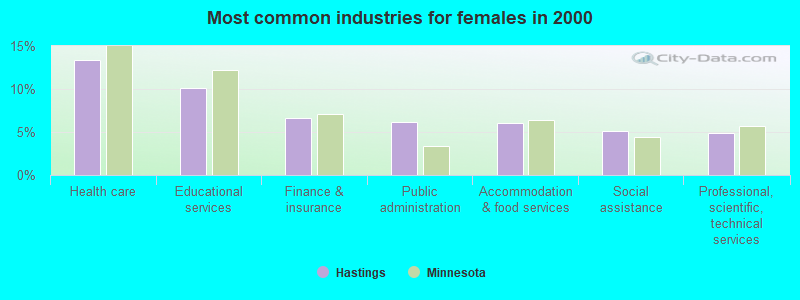
- Health care (13.4%)
- Educational services (10.1%)
- Finance & insurance (6.6%)
- Public administration (6.1%)
- Accommodation & food services (6.1%)
- Social assistance (5.2%)
- Professional, scientific, technical services (4.8%)
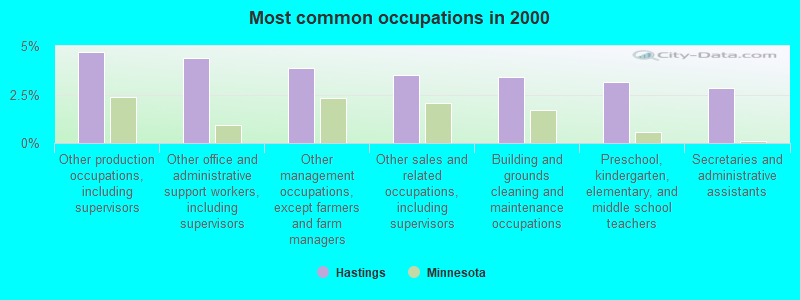
- Other production occupations, including supervisors (4.7%)
- Other office and administrative support workers, including supervisors (4.4%)
- Other management occupations, except farmers and farm managers (3.9%)
- Other sales and related occupations, including supervisors (3.5%)
- Building and grounds cleaning and maintenance occupations (3.4%)
- Preschool, kindergarten, elementary, and middle school teachers (3.1%)
- Secretaries and administrative assistants (2.8%)
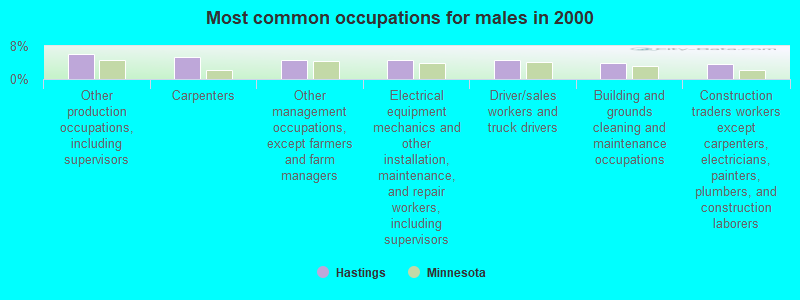
- Other production occupations, including supervisors (6.1%)
- Carpenters (5.2%)
- Other management occupations, except farmers and farm managers (4.7%)
- Electrical equipment mechanics and other installation, maintenance, and repair workers, including supervisors (4.6%)
- Driver/sales workers and truck drivers (4.5%)
- Building and grounds cleaning and maintenance occupations (3.8%)
- Construction traders workers except carpenters, electricians, painters, plumbers, and construction laborers (3.7%)

- Other office and administrative support workers, including supervisors (7.2%)
- Secretaries and administrative assistants (5.7%)
- Preschool, kindergarten, elementary, and middle school teachers (5.1%)
- Registered nurses (4.0%)
- Child care workers (3.5%)
- Other sales and related occupations, including supervisors (3.5%)
- Health technologists and technicians (3.5%)
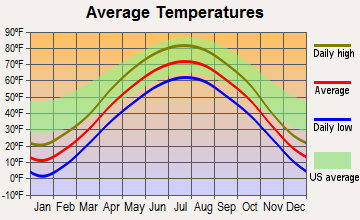
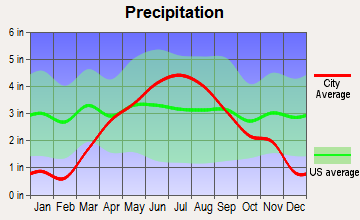
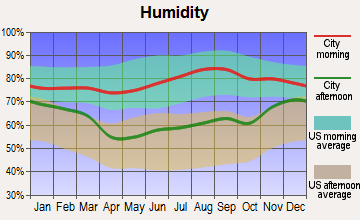
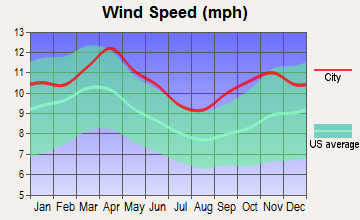
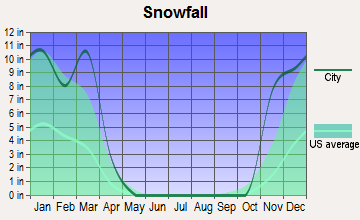
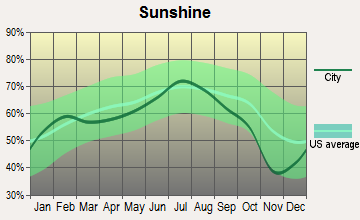
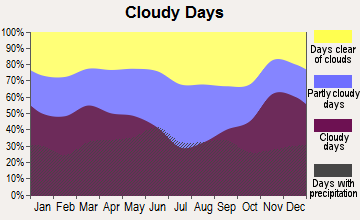
Average climate in Hastings, Minnesota
Based on data reported by over 4,000 weather stations
|
|

(lower is better)
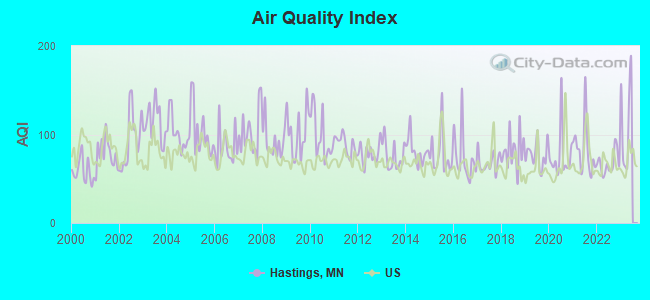
Air Quality Index (AQI) level in 2022 was 67.1. This is about average.
| City: | 67.1 |
| U.S.: | 72.6 |
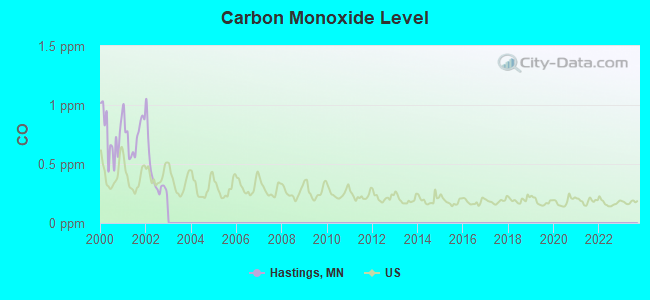
Carbon Monoxide (CO) [ppm] level in 2002 was 0.419. This is significantly worse than average. Closest monitor was 11.9 miles away from the city center.
| City: | 0.419 |
| U.S.: | 0.251 |
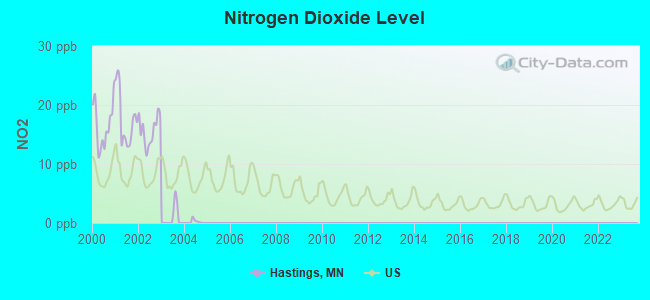
Nitrogen Dioxide (NO2) [ppb] level in 2002 was 15.7. This is significantly worse than average. Closest monitor was 8.8 miles away from the city center.
| City: | 15.7 |
| U.S.: | 5.1 |
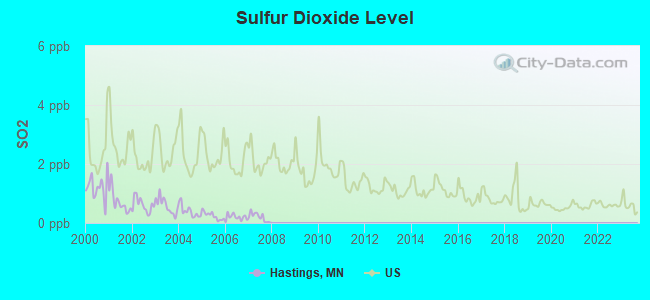
Sulfur Dioxide (SO2) [ppb] level in 2007 was 0.198. This is significantly better than average. Closest monitor was 8.0 miles away from the city center.
| City: | 0.198 |
| U.S.: | 1.515 |
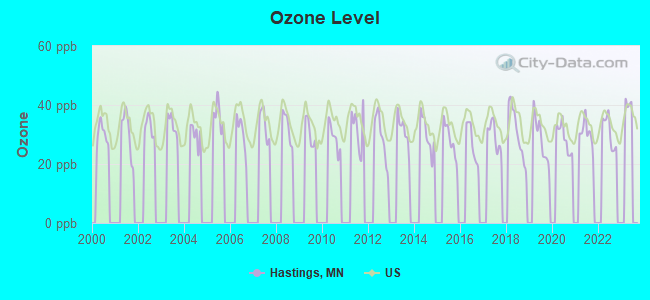
Ozone [ppb] level in 2022 was 30.9. This is about average. Closest monitor was 0.4 miles away from the city center.
| City: | 30.9 |
| U.S.: | 33.3 |
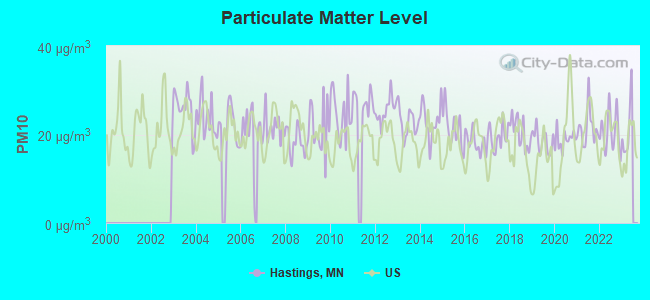
Particulate Matter (PM10) [µg/m3] level in 2022 was 20.6. This is about average. Closest monitor was 8.8 miles away from the city center.
| City: | 20.6 |
| U.S.: | 19.2 |
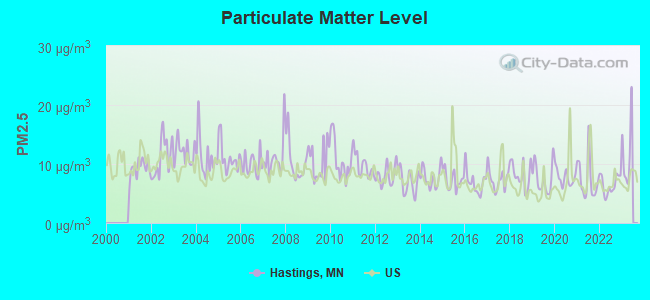
Particulate Matter (PM2.5) [µg/m3] level in 2022 was 6.50. This is better than average. Closest monitor was 1.9 miles away from the city center.
| City: | 6.50 |
| U.S.: | 8.11 |
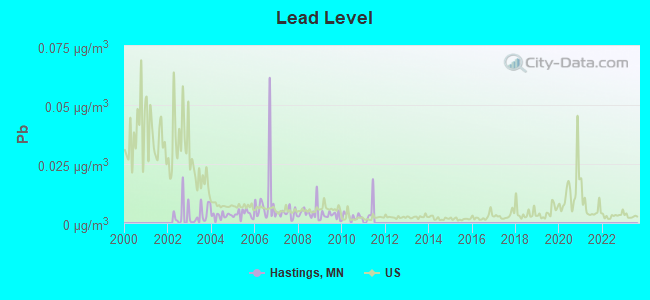
Lead (Pb) [µg/m3] level in 2010 was 0.00275. This is significantly better than average. Closest monitor was 0.6 miles away from the city center.
| City: | 0.00275 |
| U.S.: | 0.00931 |
Tornado activity:
Hastings-area historical tornado activity is slightly above Minnesota state average. It is 32% greater than the overall U.S. average.
On 6/4/1958, a category F5 (max. wind speeds 261-318 mph) tornado 28.3 miles away from the Hastings city center killed 21 people and injured 74 people and caused between $5,000,000 and $50,000,000 in damages.
On 5/6/1965, a category F4 (max. wind speeds 207-260 mph) tornado 29.1 miles away from the city center killed 3 people and injured 175 people and caused between $5,000,000 and $50,000,000 in damages.
Earthquake activity:
Hastings-area historical earthquake activity is significantly above Minnesota state average. It is 59% smaller than the overall U.S. average.On 7/9/1975 at 14:54:15, a magnitude 4.6 (4.6 MB, Class: Light, Intensity: IV - V) earthquake occurred 168.1 miles away from the city center
On 6/5/1993 at 01:24:53, a magnitude 4.1 (4.1 LG, Depth: 6.2 mi) earthquake occurred 179.6 miles away from the city center
On 3/4/1983 at 06:32:18, a magnitude 4.6 (4.4 MB, 4.6 LG, 4.4 ML) earthquake occurred 325.2 miles away from Hastings center
On 10/20/1995 at 15:57:18, a magnitude 3.7 (3.7 LG, Depth: 3.1 mi, Class: Light, Intensity: II - III) earthquake occurred 208.2 miles away from Hastings center
On 6/28/2004 at 06:10:52, a magnitude 4.2 (4.2 MW, Depth: 6.2 mi) earthquake occurred 301.9 miles away from Hastings center
On 2/9/1994 at 08:45:35, a magnitude 3.1 (3.1 LG, Depth: 3.1 mi) earthquake occurred 106.6 miles away from the city center
Magnitude types: regional Lg-wave magnitude (LG), body-wave magnitude (MB), local magnitude (ML), moment magnitude (MW)
Natural disasters:
The number of natural disasters in Dakota County (15) is near the US average (15).Major Disasters (Presidential) Declared: 11
Emergencies Declared: 3
Causes of natural disasters: Floods: 11, Storms: 7, Tornadoes: 5, Drought: 1, Hurricane: 1, Wind: 1, Other: 1 (Note: some incidents may be assigned to more than one category).
Hospitals and medical centers in Hastings:
Airports located in Hastings:
- Sandy Flats Airport (MN55) (Runways: 1)
- Sky Meadow Airport (MN58) (Runways: 1)
- Willow Ridge Airport (49MN) (Runways: 1)
Operable nuclear power plants near Hastings:
- 19 miles: Prairie Island 1 and 2 in Red Wing, MN.
College/University in Hastings:
Colleges/universities with over 2000 students nearest to Hastings:
- Dakota County Technical College (about 11 miles; Rosemount, MN; Full-time enrollment: 2,478)
- Inver Hills Community College (about 12 miles; Inver Grove Heights, MN; FT enrollment: 4,049)
- University of Wisconsin-River Falls (about 15 miles; River Falls, WI; FT enrollment: 5,868)
- Metropolitan State University (about 19 miles; Saint Paul, MN; FT enrollment: 6,159)
- Saint Paul College (about 20 miles; Saint Paul, MN; FT enrollment: 4,778)
- St Catherine University (about 21 miles; Saint Paul, MN; FT enrollment: 3,771)
- Macalester College (about 21 miles; Saint Paul, MN; FT enrollment: 2,174)
Public high schools in Hastings:
- RIVERSIDE SCHOOL (Location: 1600 W HWY 55, Grades: 6-12)
- NEW CHANCE (Location: 1600 W HWY 55, Grades: 6-12)
- HARBOR EDUCATIONAL PROGRAM (Location: 1000 11TH STREET W, Grades: 5-12)
- HASTINGS HIGH SCHOOL (Location: 200 GENERAL SIEBEN DR, Grades: 9-12)
- HASTINGS ALTERNATIVE CENTER (Location: 213 RAMSEY STREET, Grades: 6-12)
- STAARS (Location: 310 RIVER STREET, Grades: 12)
Public elementary/middle schools in Hastings:
- SPECIAL SERVICES (Location: 1000 11TH STREET W, Grades: KG-8)
- HASTINGS MIDDLE SCHOOL (Location: 1000 11TH STREET W, Grades: 5-8)
- KENNEDY ELEMENTARY (Location: 1175 TYLER ST, Grades: KG-4)
- PINECREST ELEMENTARY (Location: 975 12TH ST W, Grades: KG-4)
- CHRISTA MCAULIFFE ELEMENTARY (Location: 1601 W 12TH ST, Grades: KG-4)
Private elementary/middle schools in Hastings:
- ST ELIZABETH ANN SETON SCHOOL (Students: 372, Location: 600 TYLER ST, Grades: UG-8)
- PINE HARBOR CHRISTIAN ACADEMY (Students: 71, Location: 11125 POINT DOUGLAS RD S, Grades: KG-6)
User-submitted facts and corrections:
- private school: ST John the Baptist Catholic School (Students:100; Location: 111 W. Main St; Phone: 651-437-2644; Grades: Pre-5)
Points of interest:
Notable locations in Hastings: Hastings (A), Hastings Country Club (B), Dakota County Government Center (C), Dakota County Sheriff Office (D), Dakota County Courthouse (E), Hastings Police Department (F), Hastings City Hall (G), Hastings Fire Department and Emergency Medical Services (H), Pleasant Hill Library (I). Display/hide their locations on the map
Shopping Centers: Midtown Shopping Center (1), Westview Shopping Center (2). Display/hide their locations on the map
Churches in Hastings include: Calvary Baptist Church (A), Cornerstone Bible Church (B), Our Saviour's Lutheran Church (C), Saint John Evangelical Lutheran Church (D), Saint Philips Lutheran Church (E), Christ's Family Church (F), United Methodist Church (G), Saint Luke's Episcopal Parish (H), Discovery Church (I). Display/hide their locations on the map
Cemeteries: Lakeside Cemetery (1), Guardian Angels Catholic Cemetery (2), Veterans Cemetery (3), Saint Boniface Cemetery (4). Display/hide their locations on the map
Lakes: Lake Rebecca (A), Bull Frog Lake (B), Lake Isabelle (C). Display/hide their locations on the map
Parks in Hastings include: Lake Isabel Park (1), Imperial Estates Park (2), Lake Rebecca Park (3), Pioneer Park (4), Spiral Park (5), Westwood Park (6), Wilson Park (7), Veteran's Park (8), Vermillion Falls Park (9). Display/hide their locations on the map
Tourist attractions: Dakota County - Libraries- Renewals Status (Cultural Attractions- Events- & Facilities; 1590 Highway 55), Carpenter St Croix Valley Nature Center (Nature Centers; 12805 Saint Croix Trail South), Hastings Area Chamber of Commerce & Tourism Bureau (111 3rd Street East).
Hotels: Hastings Inn (1520 Vermillion Street), Country Inn-Suites Hastings (300 33rd Street), Americinn - Hastings- Mn (2400 Vermillion St), Super 8 Hastings (2450 Vermillion Street).
Court: Dakota County Court Adm (1560 Highway 55).
Birthplace of: Harry Oliver - Art director, George Ashley Campbell - Inventor, Gil Dobie - Football player and coach, Ben Utecht - 2005 NFL player (Indianapolis Colts, born: Jun 30, 1981), Craig Kilborn - (born 1962), comedian and talk show host, Derek Stepan - Ice hockey player, Gratia Countryman - Librarian, Jeff Taffe - NHL player (Phoenix Coyotes, born: Feb 19, 1981), W. D. Twichell - Surveyor of portions of Ohio, Harry A. Sieben - Politician.
Drinking water stations with addresses in Hastings and their reported violations in the past:
EMPIRE RENTALS, LLC (Population served: 53, Groundwater):Past monitoring violations:
- 2 routine major monitoring violations
| This city: | 2.5 people |
| Minnesota: | 2.5 people |
| This city: | 66.4% |
| Whole state: | 64.6% |
| This city: | 7.6% |
| Whole state: | 6.9% |
Likely homosexual households (counted as self-reported same-sex unmarried-partner households)
- Lesbian couples: 0.4% of all households
- Gay men: 0.1% of all households
People in group quarters in Hastings in 2010:
- 339 people in nursing facilities/skilled-nursing facilities
- 292 people in local jails and other municipal confinement facilities
- 37 people in group homes intended for adults
- 23 people in residential treatment centers for adults
- 22 people in correctional facilities intended for juveniles
- 17 people in other noninstitutional facilities
- 11 people in group homes for juveniles (non-correctional)
- 8 people in workers' group living quarters and job corps centers
People in group quarters in Hastings in 2000:
- 183 people in other noninstitutional group quarters
- 174 people in other group homes
- 147 people in local jails and other confinement facilities (including police lockups)
- 100 people in nursing homes
- 39 people in homes or halfway houses for drug/alcohol abuse
- 15 people in homes for the mentally retarded
- 3 people in religious group quarters
Banks with most branches in Hastings (2011 data):
- First National Bank: West Branch at 1440 North Frontage Road, branch established on 1979/02/05; Hastings Branch at 119 West Second Street, branch established on 1856/11/07. Info updated 2011/08/30: Bank assets: $193.5 mil, Deposits: $173.7 mil, headquarters in Slayton, MN, positive income, Agricultural Specialization, 11 total offices, Holding Company: Fulda Bancorporation Inc.
- Vermillion State Bank: Hastings Branch at 975 Lyn Way, branch established on 1981/11/24; Hastings Branch at 255 West 33rd Street, branch established on 1991/09/03. Info updated 2011/04/20: Bank assets: $489.0 mil, Deposits: $421.7 mil, headquarters in Vermillion, MN, positive income, Commercial Lending Specialization, 5 total offices, Holding Company: Vermillion Bancshares, Inc.
- Wells Fargo Bank, National Association: Hastings Branch at 1360 Frontage Road South, branch established on 1978/07/26; Hastings Downtown Branch at 401 Vermillion Street, branch established on 1977/05/26. Info updated 2011/04/05: Bank assets: $1,161,490.0 mil, Deposits: $905,653.0 mil, headquarters in Sioux Falls, SD, positive income, 6395 total offices, Holding Company: Wells Fargo & Company
- North American Banking Company: at 1620 Frontage Road, branch established on 2005/11/14. Info updated 2012/02/29: Bank assets: $253.1 mil, Deposits: $217.6 mil, headquarters in Roseville, MN, positive income, Commercial Lending Specialization, 4 total offices, Holding Company: N.A. Corporation
- Premier Bank Minnesota: Hastings Branch at 101 East 10th Street, branch established on 2006/12/18. Info updated 2012/03/28: Bank assets: $176.6 mil, Deposits: $162.7 mil, headquarters in Farmington, MN, negative income in the last year, Commercial Lending Specialization, 8 total offices
- Merchants Bank, National Association: Hastings Branch at 1525 Vermillion Street, branch established on 1991/05/09. Info updated 2012/01/06: Bank assets: $1,241.1 mil, Deposits: $1,007.4 mil, headquarters in Winona, MN, positive income, Commercial Lending Specialization, 19 total offices, Holding Company: Merchants Financial Group, Inc.
- TCF National Bank: Mn Cub Foods - Hastings at 1729 Market Boulevard, branch established on 2002/02/21. Info updated 2009/11/23: Bank assets: $19,007.0 mil, Deposits: $12,377.0 mil, headquarters in Sioux Falls, SD, positive income, Commercial Lending Specialization, 441 total offices, Holding Company: Tcf Financial Corporation
- MidCountry Bank: Hastings Branch at 1320 South Frontage Road, branch established on 1881/01/01. Info updated 2011/07/21: Bank assets: $674.7 mil, Deposits: $534.7 mil, headquarters in Marion, IL, positive income, Commercial Lending Specialization, 23 total offices
- Provincial Bank: Hastings Branch at 1309 Vermillion Street, branch established on 2005/11/28. Info updated 2006/11/03: Bank assets: $75.2 mil, Deposits: $65.1 mil, headquarters in Lakeville, MN, positive income, Commercial Lending Specialization, 3 total offices, Holding Company: Provincial Corp.
For population 15 years and over in Hastings:
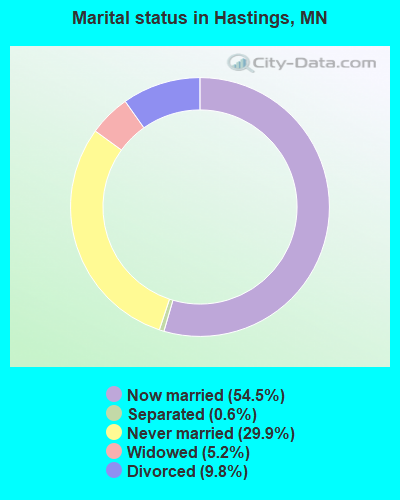
- Never married: 29.9%
- Now married: 54.5%
- Separated: 0.6%
- Widowed: 5.2%
- Divorced: 9.8%
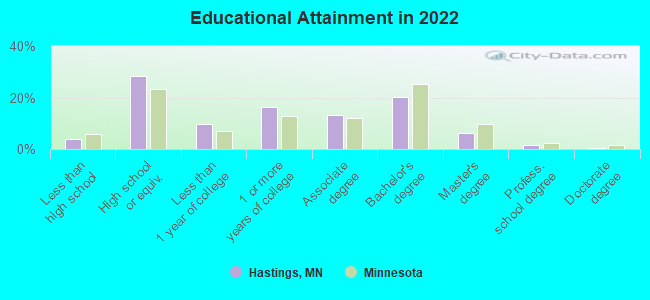
For population 25 years and over in Hastings:
- High school or higher: 95.5%
- Bachelor's degree or higher: 27.2%
- Graduate or professional degree: 7.6%
- Unemployed: 4.5%
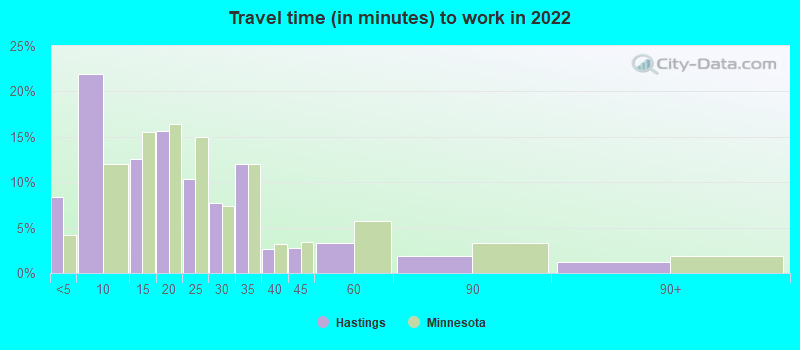
- Mean travel time to work (commute): 19.4 minutes
| Here: | 8.7 |
| Minnesota average: | 10.9 |
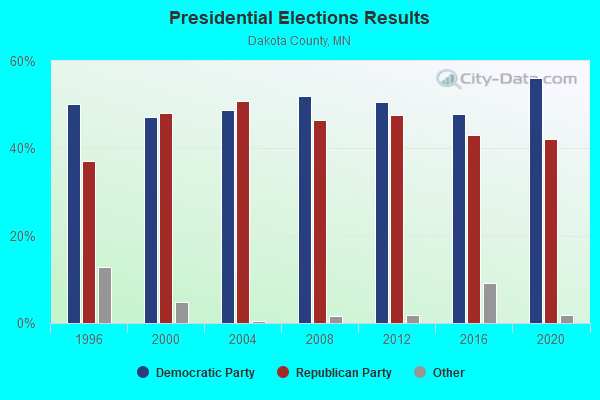
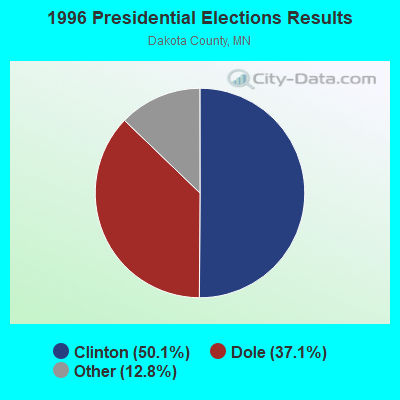
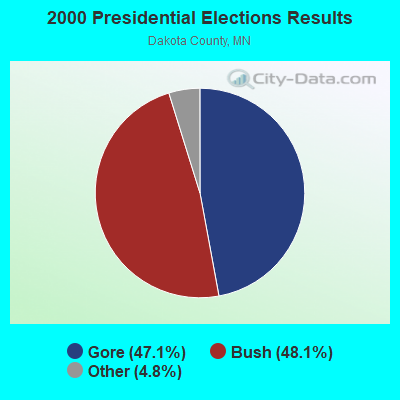

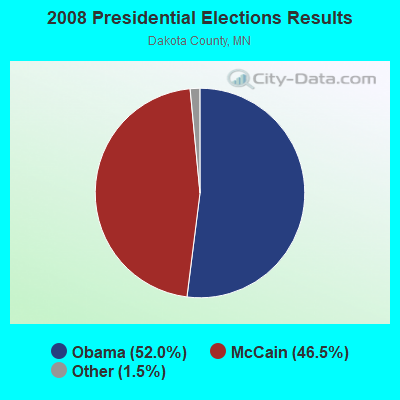
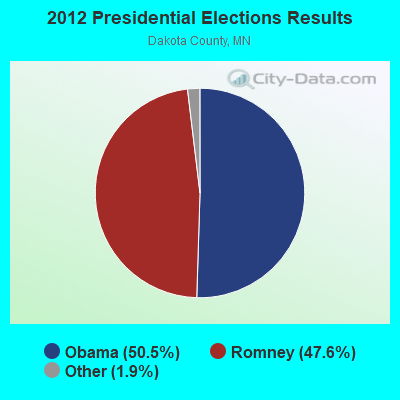
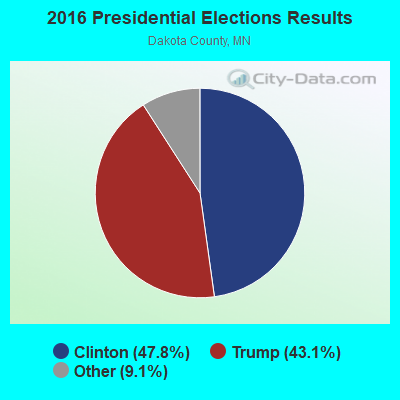
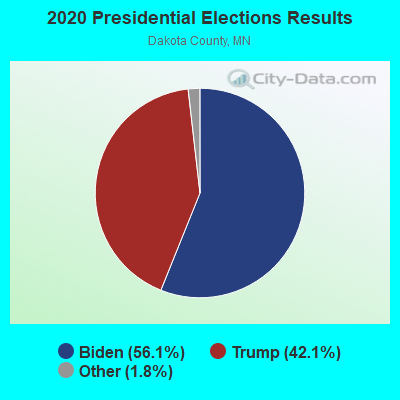
Graphs represent county-level data. Detailed 2008 Election Results
Religion statistics for Hastings, MN (based on Dakota County data)
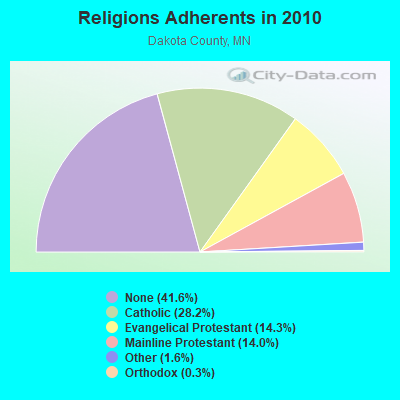
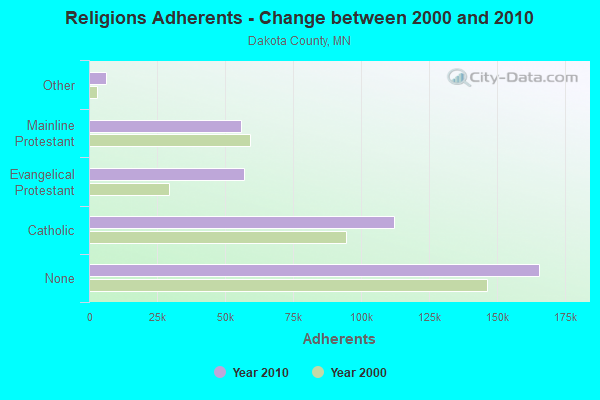
| Religion | Adherents | Congregations |
|---|---|---|
| Catholic | 112,264 | 18 |
| Evangelical Protestant | 57,007 | 111 |
| Mainline Protestant | 55,850 | 56 |
| Other | 6,321 | 27 |
| Orthodox | 1,173 | 5 |
| Black Protestant | 313 | 2 |
| None | 165,624 | - |
Food Environment Statistics:
| Dakota County: | 0.90 / 10,000 pop. |
| Minnesota: | 1.83 / 10,000 pop. |
| This county: | 0.13 / 10,000 pop. |
| Minnesota: | 0.13 / 10,000 pop. |
| Here: | 0.15 / 10,000 pop. |
| Minnesota: | 0.49 / 10,000 pop. |
| This county: | 3.03 / 10,000 pop. |
| Minnesota: | 3.90 / 10,000 pop. |
| This county: | 5.03 / 10,000 pop. |
| State: | 6.98 / 10,000 pop. |
| Here: | 6.1% |
| Minnesota: | 6.5% |
| Here: | 25.6% |
| Minnesota: | 25.9% |
| Here: | 12.6% |
| Minnesota: | 13.0% |
Health and Nutrition:
| Hastings: | 49.3% |
| Minnesota: | 50.6% |
| Hastings: | 46.4% |
| Minnesota: | 48.4% |
| Here: | 28.6 |
| Minnesota: | 28.5 |
| This city: | 20.7% |
| Minnesota: | 21.0% |
| Hastings: | 9.2% |
| State: | 9.8% |
| This city: | 6.8 |
| State: | 6.8 |
| Hastings: | 34.0% |
| Minnesota: | 33.5% |
| Here: | 57.0% |
| Minnesota: | 57.7% |
| Hastings: | 78.8% |
| Minnesota: | 79.3% |
More about Health and Nutrition of Hastings, MN Residents
| Local government employment and payroll (March 2022) | |||||
| Function | Full-time employees | Monthly full-time payroll | Average yearly full-time wage | Part-time employees | Monthly part-time payroll |
|---|---|---|---|---|---|
| Police Protection - Officers | 30 | $271,843 | $108,737 | 0 | $0 |
| Firefighters | 18 | $175,163 | $116,775 | 28 | $28,472 |
| Parks and Recreation | 13 | $88,516 | $81,707 | 13 | $6,621 |
| Streets and Highways | 11 | $78,120 | $85,222 | 1 | $5,390 |
| Other and Unallocable | 10 | $69,298 | $83,158 | 3 | $10,496 |
| Financial Administration | 6 | $50,430 | $100,860 | 3 | $11,262 |
| Police - Other | 6 | $35,542 | $71,084 | 4 | $6,654 |
| Other Government Administration | 5 | $45,468 | $109,123 | 7 | $4,400 |
| Water Supply | 3 | $10,426 | $41,704 | 0 | $0 |
| Housing and Community Development (Local) | 3 | $28,347 | $113,388 | 0 | $0 |
| Fire - Other | 0 | $0 | 1 | $5,361 | |
| Totals for Government | 105 | $853,154 | $97,503 | 60 | $78,655 |
Hastings government finances - Expenditure in 2021 (per resident):
- Current Operations - Police Protection: $5,166,000 ($237.93)
General - Other: $4,229,000 ($194.78)
Local Fire Protection: $3,973,000 ($182.99)
Sewerage: $2,815,000 ($129.65)
Parks and Recreation: $2,376,000 ($109.43)
Water Utilities: $2,045,000 ($94.19)
Regular Highways: $2,029,000 ($93.45)
Housing and Community Development: $1,285,000 ($59.18)
Central Staff Services: $995,000 ($45.83)
Electric Utilities: $863,000 ($39.75)
Protective Inspection and Regulation - Other: $597,000 ($27.50)
Financial Administration: $590,000 ($27.17)
Miscellaneous Commercial Activities - Other: $509,000 ($23.44)
General Public Buildings: $425,000 ($19.57)
Judicial and Legal Services: $206,000 ($9.49)
- General - Interest on Debt: $508,000 ($23.40)
- Other Capital Outlay - General - Other: $539,000 ($24.82)
Parks and Recreation: $447,000 ($20.59)
Police Protection: $74,000 ($3.41)
- Total Salaries and Wages: $9,798,000 ($451.27)
- Water Utilities - Interest on Debt: $116,000 ($5.34)
Hastings government finances - Revenue in 2021 (per resident):
- Charges - Sewerage: $3,341,000 ($153.88)
Other: $3,065,000 ($141.17)
Regular Highways: $566,000 ($26.07)
Parks and Recreation: $421,000 ($19.39)
- Federal Intergovernmental - Health and Hospitals: $1,771,000 ($81.57)
- Local Intergovernmental - Other: $406,000 ($18.70)
Housing and Community Development: $340,000 ($15.66)
Health and Hospitals: $1,000 ($0.05)
- Miscellaneous - Rents: $623,000 ($28.69)
Special Assessments: $468,000 ($21.55)
Interest Earnings: $391,000 ($18.01)
General Revenue - Other: $185,000 ($8.52)
Sale of Property: $73,000 ($3.36)
Fines and Forfeits: $72,000 ($3.32)
Donations From Private Sources: $18,000 ($0.83)
- Revenue - Water Utilities: $2,407,000 ($110.86)
Electric Utilities: $578,000 ($26.62)
- State Intergovernmental - General Local Government Support: $1,355,000 ($62.41)
Highways: $419,000 ($19.30)
Health and Hospitals: $40,000 ($1.84)
Other: $37,000 ($1.70)
- Tax - Property: $14,947,000 ($688.42)
Other License: $436,000 ($20.08)
Occupation and Business License - Other: $33,000 ($1.52)
Other Selective Sales: $2,000 ($0.09)
Hastings government finances - Debt in 2021 (per resident):
- Long Term Debt - Outstanding Unspecified Public Purpose: $24,307,000 ($1119.52)
Beginning Outstanding - Unspecified Public Purpose: $24,266,000 ($1117.63)
Issue, Unspecified Public Purpose: $3,649,000 ($168.06)
Retired Unspecified Public Purpose: $3,608,000 ($166.18)
Hastings government finances - Cash and Securities in 2021 (per resident):
- Other Funds - Cash and Securities: $20,752,000 ($955.78)
- Sinking Funds - Cash and Securities: $7,182,000 ($330.78)
8.01% of this county's 2020 resident taxpayers moved to other counties in 2021 ($77,850 average adjusted gross income)
| Here: | 8.01% |
| Minnesota average: | 7.79% |
0.01% of residents moved to foreign countries ($89 average AGI)
Dakota County: 0.01% Minnesota average: 0.00%
Top counties to which taxpayers relocated from this county between 2020 and 2021:
| to Hennepin County, MN | |
| to Ramsey County, MN | |
| to Scott County, MN |
| Businesses in Hastings, MN | ||||
| Name | Count | Name | Count | |
|---|---|---|---|---|
| AT&T | 1 | Little Caesars Pizza | 1 | |
| Ace Hardware | 1 | MasterBrand Cabinets | 6 | |
| AmericInn | 1 | Maurices | 1 | |
| Applebee's | 1 | McDonald's | 1 | |
| Arby's | 1 | Panera Bread | 1 | |
| Burger King | 1 | Pizza Hut | 1 | |
| Caribou Coffee | 1 | Sears | 1 | |
| Chevrolet | 1 | Subway | 3 | |
| Chipotle | 1 | T-Mobile | 1 | |
| Curves | 1 | Taco Bell | 1 | |
| Dairy Queen | 1 | Target | 1 | |
| Domino's Pizza | 1 | U-Haul | 2 | |
| FedEx | 2 | UPS | 2 | |
| Ford | 1 | Walgreens | 1 | |
| H&R Block | 1 | Walmart | 1 | |
| La-Z-Boy | 1 | YMCA | 1 | |
Strongest AM radio stations in Hastings:
- WCTS (1030 AM; 50 kW; MAPLEWOOD, MN; Owner: CNTL. BAPT. THEO/AL SEMI MINNEAPOLIS)
- KDWA (1460 AM; 1 kW; HASTINGS, MN; Owner: K & M BROADCASTING, INC.)
- KTIS (900 AM; 25 kW; MINNEAPOLIS, MN; Owner: NORTHWESTERN COLLEGE)
- KSTP (1500 AM; 50 kW; ST. PAUL, MN; Owner: KSTP-AM, LLC (DELAWARE))
- KFAN (1130 AM; 50 kW; MINNEAPOLIS, MN; Owner: AMFM RADIO LICENSES, L.L.C.)
- WCCO (830 AM; 50 kW; MINNEAPOLIS, MN; Owner: INFINITY MEDIA CORPORATION)
- WDGY (630 AM; 8 kW; HUDSON, WI; Owner: 630 RADIO, INCORPORATED)
- KKMS (980 AM; 5 kW; RICHFIELD, MN)
- WMNN (1330 AM; 10 kW; MINNEAPOLIS, MN; Owner: MINNESOTA PUBLIC RADIO.)
- KUOM (770 AM; daytime; 5 kW; MINNEAPOLIS, MN)
- WMGT (1220 AM; 5 kW; STILLWATER, MN; Owner: ENDURANCE BROADCASTING, LLC)
- KSMM (1530 AM; 9 kW; SHAKOPEE, MN; Owner: STARBOARD BROADCASTING, INC.)
- WWTC (1280 AM; 5 kW; MINNEAPOLIS, MN; Owner: SCA LICENSE CORPORATION)
Strongest FM radio stations in Hastings:
- WCAL (89.3 FM; NORTHFIELD, MN; Owner: ST. OLAF COLLEGE)
- KNOW-FM (91.1 FM; MINNEAPOLIS-ST. PAUL, MN; Owner: MINNESOTA PUBLIC RADIO)
- WLTE (102.9 FM; MINNEAPOLIS, MN; Owner: INFINITY MEDIA CORPORATION)
- KSTP-FM (94.5 FM; ST. PAUL, MN; Owner: KSTP-FM, LLC, A DELAWARE LLC)
- WGVX (105.1 FM; LAKEVILLE, MN; Owner: KQRS, INC.)
- KEEY-FM (102.1 FM; ST. PAUL, MN; Owner: AMFM RADIO LICENSES, L.L.C.)
- KTIS-FM (98.5 FM; MINNEAPOLIS, MN; Owner: NORTHWESTERN COLLEGE)
- KDWB-FM (101.3 FM; RICHFIELD, MN; Owner: AMFM RADIO LICENSES, L.L.C.)
- KQRS-FM (92.5 FM; GOLDEN VALLEY, MN; Owner: KQRS, Inc.)
- KSJN (99.5 FM; MINNEAPOLIS, MN; Owner: MINNESOTA PUBLIC RADIO)
- KXXR (93.7 FM; MINNEAPOLIS, MN; Owner: KQRS, INC.)
- WXPT (104.1 FM; ST. LOUIS PARK, MN; Owner: THE AUDIO HOUSE, INC.)
- KTCZ-FM (97.1 FM; MINNEAPOLIS, MN; Owner: AMFM RADIO LICENSES, L.L.C.)
- WEVR-FM (106.3 FM; RIVER FALLS, WI; Owner: HANTEN BROADCASTING COMPANY, INC.)
- K294AM (106.7 FM; WEST ST. PAUL, MN; Owner: FRESH AIR, INCORPORATED)
- K214DF (90.7 FM; GOLDEN VALLEY, MN; Owner: EDUCATIONAL MEDIA FOUNDATION)
- KQQL (107.9 FM; ANOKA, MN; Owner: AMFM RADIO LICENSES, L.L.C.)
- KBEM-FM (88.5 FM; MINNEAPOLIS, MN; Owner: BD. OF EDUCATION, S.S.D. NO. 1)
- KQCL (95.9 FM; FARIBAULT, MN; Owner: CUMULUS LICENSING CORP.)
- KFAI (90.3 FM; MINNEAPOLIS, MN; Owner: FRESH AIR, INC.)
TV broadcast stations around Hastings:
- KMSP-TV (Channel 9; MINNEAPOLIS, MN; Owner: FOX TELEVISION STATIONS, INC.)
- KTCA-TV (Channel 2; ST. PAUL, MN; Owner: TWIN CITIES PUBLIC TELEVISION, INC.)
- KARE (Channel 11; MINNEAPOLIS, MN; Owner: MULTIMEDIA HOLDINGS CORPORATION)
- KSTP-TV (Channel 5; ST. PAUL, MN; Owner: HUBBARD BROADCASTING, INC.)
- WCCO-TV (Channel 4; MINNEAPOLIS, MN; Owner: CBS BROADCASTING INC.)
- KTCI-TV (Channel 17; ST. PAUL, MN; Owner: TWIN CITIES PUBLIC TELEVISION, INC.)
- KSTC-TV (Channel 45; MINNEAPOLIS, MN; Owner: HUBBARD BROADCASTING, INC.)
- KMWB (Channel 23; MINNEAPOLIS, MN; Owner: KLGT LICENSEE, LLC)
- WFTC (Channel 29; MINNEAPOLIS, MN; Owner: FOX TELEVISION STATIONS, INC.)
- K07UI (Channel 7; MINNEAPOLIS, ETC., MN; Owner: WORD OF GOD FELLOWSHIP, INC.)
- K58BS (Channel 58; MINNEAPOLIS, MN; Owner: TRINITY BROADCASTING NETWORK)
- K67HG (Channel 67; MINNEAPOLIS, MN; Owner: VENTANA TELEVISION, INC.)
- K14KH (Channel 14; MINNEAPOLIS, MN; Owner: THREE ANGELS BROADCASTING NETWORK)
- K19ER (Channel 19; ST. PAUL, MN; Owner: CATHOLIC VIEWS BROADCASTS, INC.)
- W62BD (Channel 62; MINNEAPOLIS, MN; Owner: WORD OF GOD FELLOWSHIP, INC.)
- W55AP (Channel 55; RIVER FALLS, WI; Owner: STATE OF WISCONSIN - EDUCATIONAL COMMUNICATIONS BOARD)
- WBWX-CA (Channel 13; MINNEAPOLIS, MN; Owner: THE BOX WORLDWIDE LLC)
- National Bridge Inventory (NBI) Statistics
- 24Number of bridges
- 394ft / 120mTotal length
- $742,004,000Total costs
- 178,989Total average daily traffic
- 8,978Total average daily truck traffic
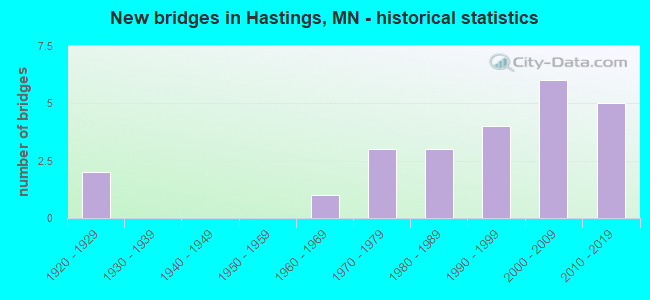
- New bridges - historical statistics
- 21920-1929
- 11960-1969
- 31970-1979
- 31980-1989
- 41990-1999
- 62000-2009
- 52010-2019
FCC Registered Antenna Towers: 45 (See the full list of FCC Registered Antenna Towers)
FCC Registered Private Land Mobile Towers: 4 (See the full list of FCC Registered Private Land Mobile Towers in Hastings, MN)
FCC Registered Broadcast Land Mobile Towers: 37 (See the full list of FCC Registered Broadcast Land Mobile Towers)
FCC Registered Microwave Towers: 28 (See the full list of FCC Registered Microwave Towers in this town)
FCC Registered Paging Towers: 5 (See the full list of FCC Registered Paging Towers)
FCC Registered Maritime Coast & Aviation Ground Towers: 3 (See the full list of FCC Registered Maritime Coast & Aviation Ground Towers)
FCC Registered Amateur Radio Licenses: 97 (See the full list of FCC Registered Amateur Radio Licenses in Hastings)
FAA Registered Aircraft Manufacturers and Dealers: 1 (See the full list of FAA Registered Manufacturers and Dealers in Hastings)
FAA Registered Aircraft: 32 (See the full list of FAA Registered Aircraft)
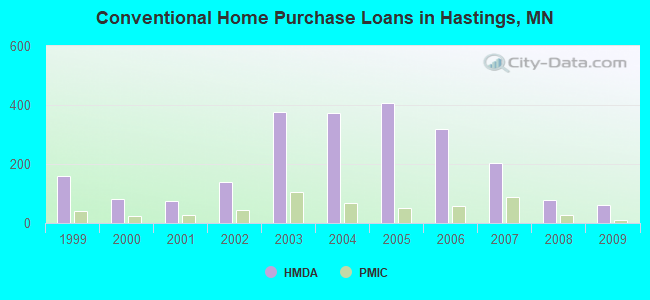
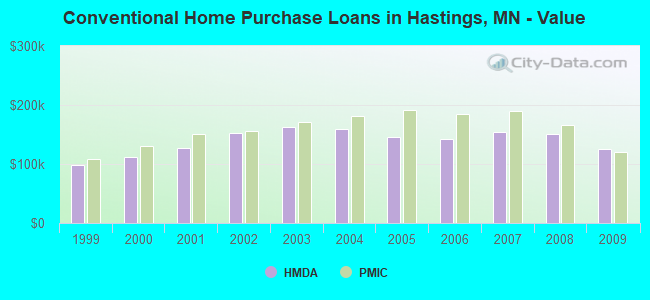
| Home Mortgage Disclosure Act Aggregated Statistics For Year 2009 (Based on 1 full and 4 partial tracts) | ||||||||||||||
| A) FHA, FSA/RHS & VA Home Purchase Loans | B) Conventional Home Purchase Loans | C) Refinancings | D) Home Improvement Loans | E) Loans on Dwellings For 5+ Families | F) Non-occupant Loans on < 5 Family Dwellings (A B C & D) | G) Loans On Manufactured Home Dwelling (A B C & D) | ||||||||
|---|---|---|---|---|---|---|---|---|---|---|---|---|---|---|
| Number | Average Value | Number | Average Value | Number | Average Value | Number | Average Value | Number | Average Value | Number | Average Value | Number | Average Value | |
| LOANS ORIGINATED | 91 | $151,613 | 60 | $125,688 | 329 | $169,109 | 14 | $91,758 | 2 | $2,996,710 | 21 | $119,300 | 2 | $57,880 |
| APPLICATIONS APPROVED, NOT ACCEPTED | 2 | $136,400 | 2 | $92,460 | 27 | $184,887 | 3 | $49,800 | 0 | $0 | 2 | $123,000 | 1 | $72,230 |
| APPLICATIONS DENIED | 9 | $156,052 | 7 | $119,691 | 85 | $182,623 | 11 | $56,524 | 0 | $0 | 8 | $162,516 | 2 | $29,930 |
| APPLICATIONS WITHDRAWN | 7 | $163,726 | 7 | $121,983 | 89 | $178,185 | 6 | $58,135 | 0 | $0 | 4 | $95,318 | 0 | $0 |
| FILES CLOSED FOR INCOMPLETENESS | 2 | $120,815 | 0 | $0 | 23 | $188,269 | 1 | $26,630 | 0 | $0 | 0 | $0 | 0 | $0 |
Detailed HMDA statistics for the following Tracts: 0611.02 , 0611.05, 0611.06, 0611.07, 0611.08
| Private Mortgage Insurance Companies Aggregated Statistics For Year 2009 (Based on 1 full and 4 partial tracts) | ||||
| A) Conventional Home Purchase Loans | B) Refinancings | |||
|---|---|---|---|---|
| Number | Average Value | Number | Average Value | |
| LOANS ORIGINATED | 10 | $120,179 | 3 | $205,023 |
| APPLICATIONS APPROVED, NOT ACCEPTED | 1 | $64,290 | 2 | $205,000 |
| APPLICATIONS DENIED | 0 | $0 | 1 | $310,390 |
| APPLICATIONS WITHDRAWN | 0 | $0 | 1 | $118,410 |
| FILES CLOSED FOR INCOMPLETENESS | 0 | $0 | 1 | $218,000 |
Detailed PMIC statistics for the following Tracts: 0611.02 , 0611.05, 0611.06, 0611.07, 0611.08
2004 - 2018 National Fire Incident Reporting System (NFIRS) incidents
- Fire incident types reported to NFIRS in Hastings, MN
- 40647.7%Structure Fires
- 27732.5%Outside Fires
- 14917.5%Mobile Property/Vehicle Fires
- 202.3%Other
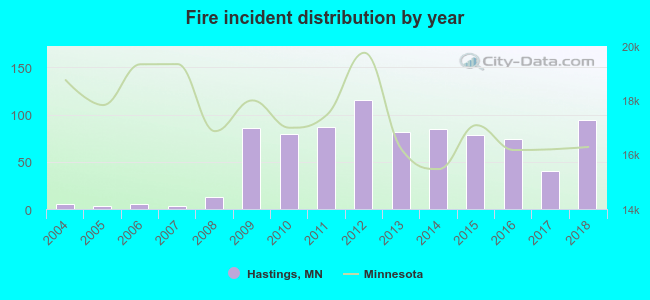 Based on the data from the years 2004 - 2018 the average number of fire incidents per year is 57. The highest number of fire incidents - 115 took place in 2012, and the least - 3 in 2005. The data has an increasing trend.
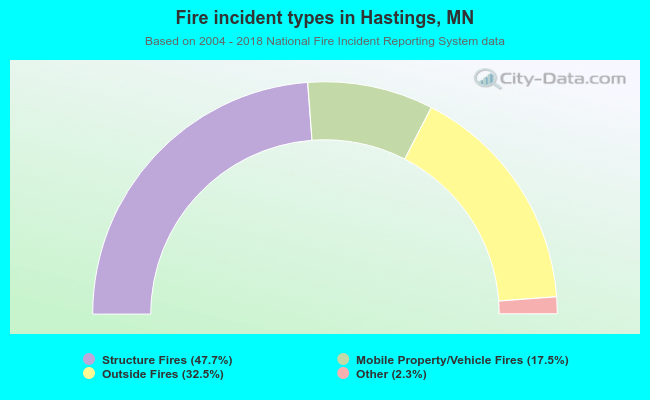 When looking into fire subcategories, the most incidents belonged to: Structure Fires (47.7%), and Outside Fires (32.5%).
| Most common first names in Hastings, MN among deceased individuals | ||
| Name | Count | Lived (average) |
|---|---|---|
| John | 127 | 75.7 years |
| Mary | 105 | 80.7 years |
| William | 71 | 77.2 years |
| Margaret | 71 | 82.0 years |
| Robert | 66 | 72.1 years |
| Joseph | 63 | 74.4 years |
| James | 61 | 68.3 years |
| George | 59 | 76.9 years |
| Helen | 59 | 81.6 years |
| Frank | 57 | 79.6 years |
| Most common last names in Hastings, MN among deceased individuals | ||
| Last name | Count | Lived (average) |
|---|---|---|
| Johnson | 66 | 75.2 years |
| Bauer | 36 | 81.9 years |
| Anderson | 34 | 75.9 years |
| Olson | 31 | 76.5 years |
| Swanson | 31 | 75.8 years |
| Fox | 23 | 80.6 years |
| Reinardy | 22 | 79.6 years |
| Peterson | 21 | 77.6 years |
| Nelson | 20 | 78.1 years |
| Rother | 19 | 80.5 years |
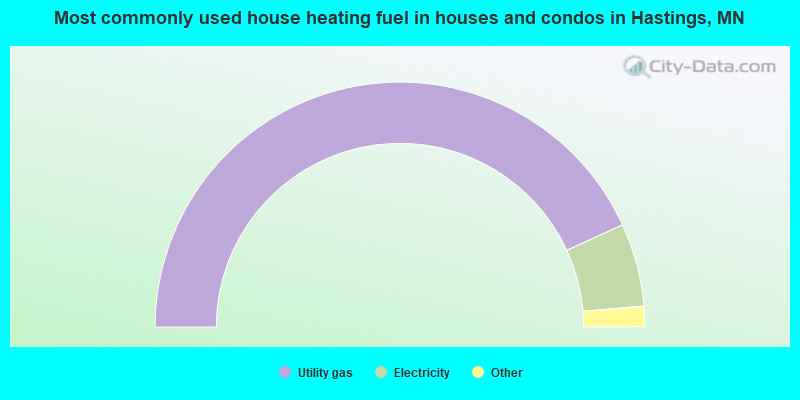
- 86.3%Utility gas
- 11.0%Electricity
- 1.2%Bottled, tank, or LP gas
- 0.9%Wood
- 0.5%No fuel used
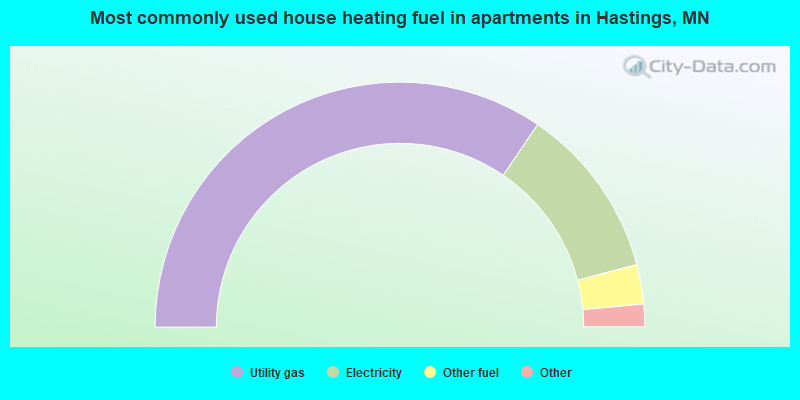
- 69.1%Utility gas
- 22.8%Electricity
- 5.2%Other fuel
- 1.7%No fuel used
- 0.6%Bottled, tank, or LP gas
- 0.6%Wood
Hastings compared to Minnesota state average:
- Unemployed percentage significantly below state average.
- Black race population percentage significantly below state average.
- Median age below state average.
- Foreign-born population percentage significantly below state average.
- Length of stay since moving in significantly above state average.
- Institutionalized population percentage above state average.

|
|
Total of 350 patent applications in 2008-2024.