Eagan, Minnesota Submit your own pictures of this city and show them to the world
OSM Map
General Map
Google Map
MSN Map
OSM Map
General Map
Google Map
MSN Map
OSM Map
General Map
Google Map
MSN Map
OSM Map
General Map
Google Map
MSN Map
Please wait while loading the map...
Population in 2022: 67,534 (100% urban, 0% rural). Population change since 2000: +6.3%Males: 32,713 Females: 34,821
March 2022 cost of living index in Eagan: 114.3 (more than average, U.S. average is 100) Percentage of residents living in poverty in 2022: 5.8%for White Non-Hispanic residents , 13.8% for Black residents , 9.2% for Hispanic or Latino residents , 6.9% for American Indian residents , 10.5% for other race residents , 6.0% for two or more races residents )
Profiles of local businesses
Business Search - 14 Million verified businesses
Data:
Median household income ($)
Median household income (% change since 2000)
Household income diversity
Ratio of average income to average house value (%)
Ratio of average income to average rent
Median household income ($) - White
Median household income ($) - Black or African American
Median household income ($) - Asian
Median household income ($) - Hispanic or Latino
Median household income ($) - American Indian and Alaska Native
Median household income ($) - Multirace
Median household income ($) - Other Race
Median household income for houses/condos with a mortgage ($)
Median household income for apartments without a mortgage ($)
Races - White alone (%)
Races - White alone (% change since 2000)
Races - Black alone (%)
Races - Black alone (% change since 2000)
Races - American Indian alone (%)
Races - American Indian alone (% change since 2000)
Races - Asian alone (%)
Races - Asian alone (% change since 2000)
Races - Hispanic (%)
Races - Hispanic (% change since 2000)
Races - Native Hawaiian and Other Pacific Islander alone (%)
Races - Native Hawaiian and Other Pacific Islander alone (% change since 2000)
Races - Two or more races (%)
Races - Two or more races (% change since 2000)
Races - Other race alone (%)
Races - Other race alone (% change since 2000)
Racial diversity
Unemployment (%)
Unemployment (% change since 2000)
Unemployment (%) - White
Unemployment (%) - Black or African American
Unemployment (%) - Asian
Unemployment (%) - Hispanic or Latino
Unemployment (%) - American Indian and Alaska Native
Unemployment (%) - Multirace
Unemployment (%) - Other Race
Population density (people per square mile)
Population - Males (%)
Population - Females (%)
Population - Males (%) - White
Population - Males (%) - Black or African American
Population - Males (%) - Asian
Population - Males (%) - Hispanic or Latino
Population - Males (%) - American Indian and Alaska Native
Population - Males (%) - Multirace
Population - Males (%) - Other Race
Population - Females (%) - White
Population - Females (%) - Black or African American
Population - Females (%) - Asian
Population - Females (%) - Hispanic or Latino
Population - Females (%) - American Indian and Alaska Native
Population - Females (%) - Multirace
Population - Females (%) - Other Race
Coronavirus confirmed cases (Apr 27, 2024)
Deaths caused by coronavirus (Apr 27, 2024)
Coronavirus confirmed cases (per 100k population) (Apr 27, 2024)
Deaths caused by coronavirus (per 100k population) (Apr 27, 2024)
Daily increase in number of cases (Apr 27, 2024)
Weekly increase in number of cases (Apr 27, 2024)
Cases doubled (in days) (Apr 27, 2024)
Hospitalized patients (Apr 18, 2022)
Negative test results (Apr 18, 2022)
Total test results (Apr 18, 2022)
COVID Vaccine doses distributed (per 100k population) (Sep 19, 2023)
COVID Vaccine doses administered (per 100k population) (Sep 19, 2023)
COVID Vaccine doses distributed (Sep 19, 2023)
COVID Vaccine doses administered (Sep 19, 2023)
Likely homosexual households (%)
Likely homosexual households (% change since 2000)
Likely homosexual households - Lesbian couples (%)
Likely homosexual households - Lesbian couples (% change since 2000)
Likely homosexual households - Gay men (%)
Likely homosexual households - Gay men (% change since 2000)
Cost of living index
Median gross rent ($)
Median contract rent ($)
Median monthly housing costs ($)
Median house or condo value ($)
Median house or condo value ($ change since 2000)
Mean house or condo value by units in structure - 1, detached ($)
Mean house or condo value by units in structure - 1, attached ($)
Mean house or condo value by units in structure - 2 ($)
Mean house or condo value by units in structure by units in structure - 3 or 4 ($)
Mean house or condo value by units in structure - 5 or more ($)
Mean house or condo value by units in structure - Boat, RV, van, etc. ($)
Mean house or condo value by units in structure - Mobile home ($)
Median house or condo value ($) - White
Median house or condo value ($) - Black or African American
Median house or condo value ($) - Asian
Median house or condo value ($) - Hispanic or Latino
Median house or condo value ($) - American Indian and Alaska Native
Median house or condo value ($) - Multirace
Median house or condo value ($) - Other Race
Median resident age
Resident age diversity
Median resident age - Males
Median resident age - Females
Median resident age - White
Median resident age - Black or African American
Median resident age - Asian
Median resident age - Hispanic or Latino
Median resident age - American Indian and Alaska Native
Median resident age - Multirace
Median resident age - Other Race
Median resident age - Males - White
Median resident age - Males - Black or African American
Median resident age - Males - Asian
Median resident age - Males - Hispanic or Latino
Median resident age - Males - American Indian and Alaska Native
Median resident age - Males - Multirace
Median resident age - Males - Other Race
Median resident age - Females - White
Median resident age - Females - Black or African American
Median resident age - Females - Asian
Median resident age - Females - Hispanic or Latino
Median resident age - Females - American Indian and Alaska Native
Median resident age - Females - Multirace
Median resident age - Females - Other Race
Commute - mean travel time to work (minutes)
Travel time to work - Less than 5 minutes (%)
Travel time to work - Less than 5 minutes (% change since 2000)
Travel time to work - 5 to 9 minutes (%)
Travel time to work - 5 to 9 minutes (% change since 2000)
Travel time to work - 10 to 19 minutes (%)
Travel time to work - 10 to 19 minutes (% change since 2000)
Travel time to work - 20 to 29 minutes (%)
Travel time to work - 20 to 29 minutes (% change since 2000)
Travel time to work - 30 to 39 minutes (%)
Travel time to work - 30 to 39 minutes (% change since 2000)
Travel time to work - 40 to 59 minutes (%)
Travel time to work - 40 to 59 minutes (% change since 2000)
Travel time to work - 60 to 89 minutes (%)
Travel time to work - 60 to 89 minutes (% change since 2000)
Travel time to work - 90 or more minutes (%)
Travel time to work - 90 or more minutes (% change since 2000)
Marital status - Never married (%)
Marital status - Now married (%)
Marital status - Separated (%)
Marital status - Widowed (%)
Marital status - Divorced (%)
Median family income ($)
Median family income (% change since 2000)
Median non-family income ($)
Median non-family income (% change since 2000)
Median per capita income ($)
Median per capita income (% change since 2000)
Median family income ($) - White
Median family income ($) - Black or African American
Median family income ($) - Asian
Median family income ($) - Hispanic or Latino
Median family income ($) - American Indian and Alaska Native
Median family income ($) - Multirace
Median family income ($) - Other Race
Median year house/condo built
Median year apartment built
Year house built - Built 2005 or later (%)
Year house built - Built 2000 to 2004 (%)
Year house built - Built 1990 to 1999 (%)
Year house built - Built 1980 to 1989 (%)
Year house built - Built 1970 to 1979 (%)
Year house built - Built 1960 to 1969 (%)
Year house built - Built 1950 to 1959 (%)
Year house built - Built 1940 to 1949 (%)
Year house built - Built 1939 or earlier (%)
Average household size
Household density (households per square mile)
Average household size - White
Average household size - Black or African American
Average household size - Asian
Average household size - Hispanic or Latino
Average household size - American Indian and Alaska Native
Average household size - Multirace
Average household size - Other Race
Occupied housing units (%)
Vacant housing units (%)
Owner occupied housing units (%)
Renter occupied housing units (%)
Vacancy status - For rent (%)
Vacancy status - For sale only (%)
Vacancy status - Rented or sold, not occupied (%)
Vacancy status - For seasonal, recreational, or occasional use (%)
Vacancy status - For migrant workers (%)
Vacancy status - Other vacant (%)
Residents with income below the poverty level (%)
Residents with income below 50% of the poverty level (%)
Children below poverty level (%)
Poor families by family type - Married-couple family (%)
Poor families by family type - Male, no wife present (%)
Poor families by family type - Female, no husband present (%)
Poverty status for native-born residents (%)
Poverty status for foreign-born residents (%)
Poverty among high school graduates not in families (%)
Poverty among people who did not graduate high school not in families (%)
Residents with income below the poverty level (%) - White
Residents with income below the poverty level (%) - Black or African American
Residents with income below the poverty level (%) - Asian
Residents with income below the poverty level (%) - Hispanic or Latino
Residents with income below the poverty level (%) - American Indian and Alaska Native
Residents with income below the poverty level (%) - Multirace
Residents with income below the poverty level (%) - Other Race
Air pollution - Air Quality Index (AQI)
Air pollution - CO
Air pollution - NO2
Air pollution - SO2
Air pollution - Ozone
Air pollution - PM10
Air pollution - PM25
Air pollution - Pb
Crime - Murders per 100,000 population
Crime - Rapes per 100,000 population
Crime - Robberies per 100,000 population
Crime - Assaults per 100,000 population
Crime - Burglaries per 100,000 population
Crime - Thefts per 100,000 population
Crime - Auto thefts per 100,000 population
Crime - Arson per 100,000 population
Crime - City-data.com crime index
Crime - Violent crime index
Crime - Property crime index
Crime - Murders per 100,000 population (5 year average)
Crime - Rapes per 100,000 population (5 year average)
Crime - Robberies per 100,000 population (5 year average)
Crime - Assaults per 100,000 population (5 year average)
Crime - Burglaries per 100,000 population (5 year average)
Crime - Thefts per 100,000 population (5 year average)
Crime - Auto thefts per 100,000 population (5 year average)
Crime - Arson per 100,000 population (5 year average)
Crime - City-data.com crime index (5 year average)
Crime - Violent crime index (5 year average)
Crime - Property crime index (5 year average)
1996 Presidential Elections Results (%) - Democratic Party (Clinton)
1996 Presidential Elections Results (%) - Republican Party (Dole)
1996 Presidential Elections Results (%) - Other
2000 Presidential Elections Results (%) - Democratic Party (Gore)
2000 Presidential Elections Results (%) - Republican Party (Bush)
2000 Presidential Elections Results (%) - Other
2004 Presidential Elections Results (%) - Democratic Party (Kerry)
2004 Presidential Elections Results (%) - Republican Party (Bush)
2004 Presidential Elections Results (%) - Other
2008 Presidential Elections Results (%) - Democratic Party (Obama)
2008 Presidential Elections Results (%) - Republican Party (McCain)
2008 Presidential Elections Results (%) - Other
2012 Presidential Elections Results (%) - Democratic Party (Obama)
2012 Presidential Elections Results (%) - Republican Party (Romney)
2012 Presidential Elections Results (%) - Other
2016 Presidential Elections Results (%) - Democratic Party (Clinton)
2016 Presidential Elections Results (%) - Republican Party (Trump)
2016 Presidential Elections Results (%) - Other
2020 Presidential Elections Results (%) - Democratic Party (Biden)
2020 Presidential Elections Results (%) - Republican Party (Trump)
2020 Presidential Elections Results (%) - Other
Ancestries Reported - Arab (%)
Ancestries Reported - Czech (%)
Ancestries Reported - Danish (%)
Ancestries Reported - Dutch (%)
Ancestries Reported - English (%)
Ancestries Reported - French (%)
Ancestries Reported - French Canadian (%)
Ancestries Reported - German (%)
Ancestries Reported - Greek (%)
Ancestries Reported - Hungarian (%)
Ancestries Reported - Irish (%)
Ancestries Reported - Italian (%)
Ancestries Reported - Lithuanian (%)
Ancestries Reported - Norwegian (%)
Ancestries Reported - Polish (%)
Ancestries Reported - Portuguese (%)
Ancestries Reported - Russian (%)
Ancestries Reported - Scotch-Irish (%)
Ancestries Reported - Scottish (%)
Ancestries Reported - Slovak (%)
Ancestries Reported - Subsaharan African (%)
Ancestries Reported - Swedish (%)
Ancestries Reported - Swiss (%)
Ancestries Reported - Ukrainian (%)
Ancestries Reported - United States (%)
Ancestries Reported - Welsh (%)
Ancestries Reported - West Indian (%)
Ancestries Reported - Other (%)
Educational Attainment - No schooling completed (%)
Educational Attainment - Less than high school (%)
Educational Attainment - High school or equivalent (%)
Educational Attainment - Less than 1 year of college (%)
Educational Attainment - 1 or more years of college (%)
Educational Attainment - Associate degree (%)
Educational Attainment - Bachelor's degree (%)
Educational Attainment - Master's degree (%)
Educational Attainment - Professional school degree (%)
Educational Attainment - Doctorate degree (%)
School Enrollment - Nursery, preschool (%)
School Enrollment - Kindergarten (%)
School Enrollment - Grade 1 to 4 (%)
School Enrollment - Grade 5 to 8 (%)
School Enrollment - Grade 9 to 12 (%)
School Enrollment - College undergrad (%)
School Enrollment - Graduate or professional (%)
School Enrollment - Not enrolled in school (%)
School enrollment - Public schools (%)
School enrollment - Private schools (%)
School enrollment - Not enrolled (%)
Median number of rooms in houses and condos
Median number of rooms in apartments
Housing units lacking complete plumbing facilities (%)
Housing units lacking complete kitchen facilities (%)
Density of houses
Urban houses (%)
Rural houses (%)
Households with people 60 years and over (%)
Households with people 65 years and over (%)
Households with people 75 years and over (%)
Households with one or more nonrelatives (%)
Households with no nonrelatives (%)
Population in households (%)
Family households (%)
Nonfamily households (%)
Population in families (%)
Family households with own children (%)
Median number of bedrooms in owner occupied houses
Mean number of bedrooms in owner occupied houses
Median number of bedrooms in renter occupied houses
Mean number of bedrooms in renter occupied houses
Median number of vehichles in owner occupied houses
Mean number of vehichles in owner occupied houses
Median number of vehichles in renter occupied houses
Mean number of vehichles in renter occupied houses
Mortgage status - with mortgage (%)
Mortgage status - with second mortgage (%)
Mortgage status - with home equity loan (%)
Mortgage status - with both second mortgage and home equity loan (%)
Mortgage status - without a mortgage (%)
Average family size
Average family size - White
Average family size - Black or African American
Average family size - Asian
Average family size - Hispanic or Latino
Average family size - American Indian and Alaska Native
Average family size - Multirace
Average family size - Other Race
Geographical mobility - Same house 1 year ago (%)
Geographical mobility - Moved within same county (%)
Geographical mobility - Moved from different county within same state (%)
Geographical mobility - Moved from different state (%)
Geographical mobility - Moved from abroad (%)
Place of birth - Born in state of residence (%)
Place of birth - Born in other state (%)
Place of birth - Native, outside of US (%)
Place of birth - Foreign born (%)
Housing units in structures - 1, detached (%)
Housing units in structures - 1, attached (%)
Housing units in structures - 2 (%)
Housing units in structures - 3 or 4 (%)
Housing units in structures - 5 to 9 (%)
Housing units in structures - 10 to 19 (%)
Housing units in structures - 20 to 49 (%)
Housing units in structures - 50 or more (%)
Housing units in structures - Mobile home (%)
Housing units in structures - Boat, RV, van, etc. (%)
House/condo owner moved in on average (years ago)
Renter moved in on average (years ago)
Year householder moved into unit - Moved in 1999 to March 2000 (%)
Year householder moved into unit - Moved in 1995 to 1998 (%)
Year householder moved into unit - Moved in 1990 to 1994 (%)
Year householder moved into unit - Moved in 1980 to 1989 (%)
Year householder moved into unit - Moved in 1970 to 1979 (%)
Year householder moved into unit - Moved in 1969 or earlier (%)
Means of transportation to work - Drove car alone (%)
Means of transportation to work - Carpooled (%)
Means of transportation to work - Public transportation (%)
Means of transportation to work - Bus or trolley bus (%)
Means of transportation to work - Streetcar or trolley car (%)
Means of transportation to work - Subway or elevated (%)
Means of transportation to work - Railroad (%)
Means of transportation to work - Ferryboat (%)
Means of transportation to work - Taxicab (%)
Means of transportation to work - Motorcycle (%)
Means of transportation to work - Bicycle (%)
Means of transportation to work - Walked (%)
Means of transportation to work - Other means (%)
Working at home (%)
Industry diversity
Most Common Industries - Agriculture, forestry, fishing and hunting, and mining (%)
Most Common Industries - Agriculture, forestry, fishing and hunting (%)
Most Common Industries - Mining, quarrying, and oil and gas extraction (%)
Most Common Industries - Construction (%)
Most Common Industries - Manufacturing (%)
Most Common Industries - Wholesale trade (%)
Most Common Industries - Retail trade (%)
Most Common Industries - Transportation and warehousing, and utilities (%)
Most Common Industries - Transportation and warehousing (%)
Most Common Industries - Utilities (%)
Most Common Industries - Information (%)
Most Common Industries - Finance and insurance, and real estate and rental and leasing (%)
Most Common Industries - Finance and insurance (%)
Most Common Industries - Real estate and rental and leasing (%)
Most Common Industries - Professional, scientific, and management, and administrative and waste management services (%)
Most Common Industries - Professional, scientific, and technical services (%)
Most Common Industries - Management of companies and enterprises (%)
Most Common Industries - Administrative and support and waste management services (%)
Most Common Industries - Educational services, and health care and social assistance (%)
Most Common Industries - Educational services (%)
Most Common Industries - Health care and social assistance (%)
Most Common Industries - Arts, entertainment, and recreation, and accommodation and food services (%)
Most Common Industries - Arts, entertainment, and recreation (%)
Most Common Industries - Accommodation and food services (%)
Most Common Industries - Other services, except public administration (%)
Most Common Industries - Public administration (%)
Occupation diversity
Most Common Occupations - Management, business, science, and arts occupations (%)
Most Common Occupations - Management, business, and financial occupations (%)
Most Common Occupations - Management occupations (%)
Most Common Occupations - Business and financial operations occupations (%)
Most Common Occupations - Computer, engineering, and science occupations (%)
Most Common Occupations - Computer and mathematical occupations (%)
Most Common Occupations - Architecture and engineering occupations (%)
Most Common Occupations - Life, physical, and social science occupations (%)
Most Common Occupations - Education, legal, community service, arts, and media occupations (%)
Most Common Occupations - Community and social service occupations (%)
Most Common Occupations - Legal occupations (%)
Most Common Occupations - Education, training, and library occupations (%)
Most Common Occupations - Arts, design, entertainment, sports, and media occupations (%)
Most Common Occupations - Healthcare practitioners and technical occupations (%)
Most Common Occupations - Health diagnosing and treating practitioners and other technical occupations (%)
Most Common Occupations - Health technologists and technicians (%)
Most Common Occupations - Service occupations (%)
Most Common Occupations - Healthcare support occupations (%)
Most Common Occupations - Protective service occupations (%)
Most Common Occupations - Fire fighting and prevention, and other protective service workers including supervisors (%)
Most Common Occupations - Law enforcement workers including supervisors (%)
Most Common Occupations - Food preparation and serving related occupations (%)
Most Common Occupations - Building and grounds cleaning and maintenance occupations (%)
Most Common Occupations - Personal care and service occupations (%)
Most Common Occupations - Sales and office occupations (%)
Most Common Occupations - Sales and related occupations (%)
Most Common Occupations - Office and administrative support occupations (%)
Most Common Occupations - Natural resources, construction, and maintenance occupations (%)
Most Common Occupations - Farming, fishing, and forestry occupations (%)
Most Common Occupations - Construction and extraction occupations (%)
Most Common Occupations - Installation, maintenance, and repair occupations (%)
Most Common Occupations - Production, transportation, and material moving occupations (%)
Most Common Occupations - Production occupations (%)
Most Common Occupations - Transportation occupations (%)
Most Common Occupations - Material moving occupations (%)
People in Group quarters - Institutionalized population (%)
People in Group quarters - Correctional institutions (%)
People in Group quarters - Federal prisons and detention centers (%)
People in Group quarters - Halfway houses (%)
People in Group quarters - Local jails and other confinement facilities (including police lockups) (%)
People in Group quarters - Military disciplinary barracks (%)
People in Group quarters - State prisons (%)
People in Group quarters - Other types of correctional institutions (%)
People in Group quarters - Nursing homes (%)
People in Group quarters - Hospitals/wards, hospices, and schools for the handicapped (%)
People in Group quarters - Hospitals/wards and hospices for chronically ill (%)
People in Group quarters - Hospices or homes for chronically ill (%)
People in Group quarters - Military hospitals or wards for chronically ill (%)
People in Group quarters - Other hospitals or wards for chronically ill (%)
People in Group quarters - Hospitals or wards for drug/alcohol abuse (%)
People in Group quarters - Mental (Psychiatric) hospitals or wards (%)
People in Group quarters - Schools, hospitals, or wards for the mentally retarded (%)
People in Group quarters - Schools, hospitals, or wards for the physically handicapped (%)
People in Group quarters - Institutions for the deaf (%)
People in Group quarters - Institutions for the blind (%)
People in Group quarters - Orthopedic wards and institutions for the physically handicapped (%)
People in Group quarters - Wards in general hospitals for patients who have no usual home elsewhere (%)
People in Group quarters - Wards in military hospitals for patients who have no usual home elsewhere (%)
People in Group quarters - Juvenile institutions (%)
People in Group quarters - Long-term care (%)
People in Group quarters - Homes for abused, dependent, and neglected children (%)
People in Group quarters - Residential treatment centers for emotionally disturbed children (%)
People in Group quarters - Training schools for juvenile delinquents (%)
People in Group quarters - Short-term care, detention or diagnostic centers for delinquent children (%)
People in Group quarters - Type of juvenile institution unknown (%)
People in Group quarters - Noninstitutionalized population (%)
People in Group quarters - College dormitories (includes college quarters off campus) (%)
People in Group quarters - Military quarters (%)
People in Group quarters - On base (%)
People in Group quarters - Barracks, unaccompanied personnel housing (UPH), (Enlisted/Officer), ;and similar group living quarters for military personnel (%)
People in Group quarters - Transient quarters for temporary residents (%)
People in Group quarters - Military ships (%)
People in Group quarters - Group homes (%)
People in Group quarters - Homes or halfway houses for drug/alcohol abuse (%)
People in Group quarters - Homes for the mentally ill (%)
People in Group quarters - Homes for the mentally retarded (%)
People in Group quarters - Homes for the physically handicapped (%)
People in Group quarters - Other group homes (%)
People in Group quarters - Religious group quarters (%)
People in Group quarters - Dormitories (%)
People in Group quarters - Agriculture workers' dormitories on farms (%)
People in Group quarters - Job Corps and vocational training facilities (%)
People in Group quarters - Other workers' dormitories (%)
People in Group quarters - Crews of maritime vessels (%)
People in Group quarters - Other nonhousehold living situations (%)
People in Group quarters - Other noninstitutional group quarters (%)
Residents speaking English at home (%)
Residents speaking English at home - Born in the United States (%)
Residents speaking English at home - Native, born elsewhere (%)
Residents speaking English at home - Foreign born (%)
Residents speaking Spanish at home (%)
Residents speaking Spanish at home - Born in the United States (%)
Residents speaking Spanish at home - Native, born elsewhere (%)
Residents speaking Spanish at home - Foreign born (%)
Residents speaking other language at home (%)
Residents speaking other language at home - Born in the United States (%)
Residents speaking other language at home - Native, born elsewhere (%)
Residents speaking other language at home - Foreign born (%)
Class of Workers - Employee of private company (%)
Class of Workers - Self-employed in own incorporated business (%)
Class of Workers - Private not-for-profit wage and salary workers (%)
Class of Workers - Local government workers (%)
Class of Workers - State government workers (%)
Class of Workers - Federal government workers (%)
Class of Workers - Self-employed workers in own not incorporated business and Unpaid family workers (%)
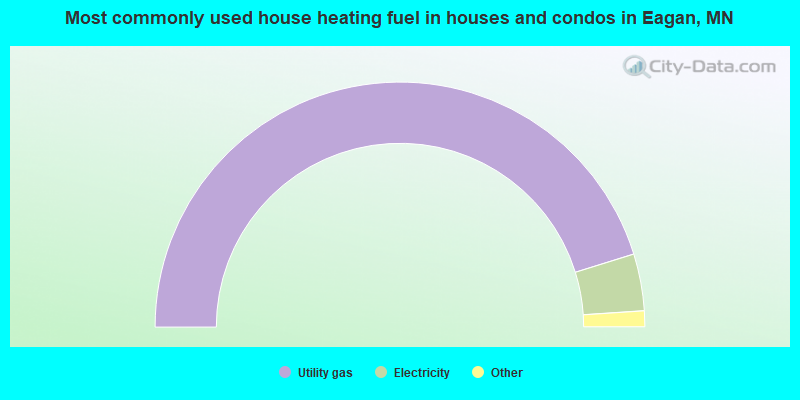
House heating fuel used in houses and condos - Utility gas (%)
House heating fuel used in houses and condos - Bottled, tank, or LP gas (%)
House heating fuel used in houses and condos - Electricity (%)
House heating fuel used in houses and condos - Fuel oil, kerosene, etc. (%)
House heating fuel used in houses and condos - Coal or coke (%)
House heating fuel used in houses and condos - Wood (%)
House heating fuel used in houses and condos - Solar energy (%)
House heating fuel used in houses and condos - Other fuel (%)
House heating fuel used in houses and condos - No fuel used (%)
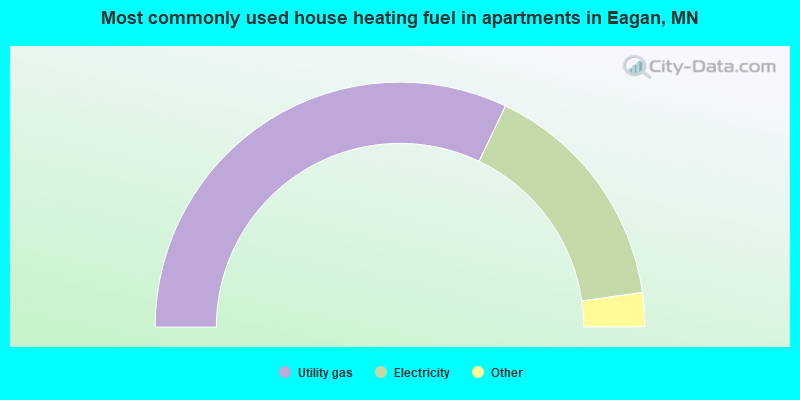
House heating fuel used in apartments - Utility gas (%)
House heating fuel used in apartments - Bottled, tank, or LP gas (%)
House heating fuel used in apartments - Electricity (%)
House heating fuel used in apartments - Fuel oil, kerosene, etc. (%)
House heating fuel used in apartments - Coal or coke (%)
House heating fuel used in apartments - Wood (%)
House heating fuel used in apartments - Solar energy (%)
House heating fuel used in apartments - Other fuel (%)
House heating fuel used in apartments - No fuel used (%)
Armed forces status - In Armed Forces (%)
Armed forces status - Civilian (%)
Armed forces status - Civilian - Veteran (%)
Armed forces status - Civilian - Nonveteran (%)
Fatal accidents locations in years 2005-2021
Fatal accidents locations in 2005
Fatal accidents locations in 2006
Fatal accidents locations in 2007
Fatal accidents locations in 2008
Fatal accidents locations in 2009
Fatal accidents locations in 2010
Fatal accidents locations in 2011
Fatal accidents locations in 2012
Fatal accidents locations in 2013
Fatal accidents locations in 2014
Fatal accidents locations in 2015
Fatal accidents locations in 2016
Fatal accidents locations in 2017
Fatal accidents locations in 2018
Fatal accidents locations in 2019
Fatal accidents locations in 2020
Fatal accidents locations in 2021
Alcohol use - People drinking some alcohol every month (%)
Alcohol use - People not drinking at all (%)
Alcohol use - Average days/month drinking alcohol
Alcohol use - Average drinks/week
Alcohol use - Average days/year people drink much
Audiometry - Average condition of hearing (%)
Audiometry - People that can hear a whisper from across a quiet room (%)
Audiometry - People that can hear normal voice from across a quiet room (%)
Audiometry - Ears ringing, roaring, buzzing (%)
Audiometry - Had a job exposure to loud noise (%)
Audiometry - Had off-work exposure to loud noise (%)
Blood Pressure & Cholesterol - Has high blood pressure (%)
Blood Pressure & Cholesterol - Checking blood pressure at home (%)
Blood Pressure & Cholesterol - Frequently checking blood cholesterol (%)
Blood Pressure & Cholesterol - Has high cholesterol level (%)
Consumer Behavior - Money monthly spent on food at supermarket/grocery store
Consumer Behavior - Money monthly spent on food at other stores
Consumer Behavior - Money monthly spent on eating out
Consumer Behavior - Money monthly spent on carryout/delivered foods
Consumer Behavior - Income spent on food at supermarket/grocery store (%)
Consumer Behavior - Income spent on food at other stores (%)
Consumer Behavior - Income spent on eating out (%)
Consumer Behavior - Income spent on carryout/delivered foods (%)
Current Health Status - General health condition (%)
Current Health Status - Blood donors (%)
Current Health Status - Has blood ever tested for HIV virus (%)
Current Health Status - Left-handed people (%)
Dermatology - People using sunscreen (%)
Diabetes - Diabetics (%)
Diabetes - Had a blood test for high blood sugar (%)
Diabetes - People taking insulin (%)
Diet Behavior & Nutrition - Diet health (%)
Diet Behavior & Nutrition - Milk product consumption (# of products/month)
Diet Behavior & Nutrition - Meals not home prepared (#/week)
Diet Behavior & Nutrition - Meals from fast food or pizza place (#/week)
Diet Behavior & Nutrition - Ready-to-eat foods (#/month)
Diet Behavior & Nutrition - Frozen meals/pizza (#/month)
Drug Use - People that ever used marijuana or hashish (%)
Drug Use - Ever used hard drugs (%)
Drug Use - Ever used any form of cocaine (%)
Drug Use - Ever used heroin (%)
Drug Use - Ever used methamphetamine (%)
Health Insurance - People covered by health insurance (%)
Kidney Conditions-Urology - Avg. # of times urinating at night
Medical Conditions - People with asthma (%)
Medical Conditions - People with anemia (%)
Medical Conditions - People with psoriasis (%)
Medical Conditions - People with overweight (%)
Medical Conditions - Elderly people having difficulties in thinking or remembering (%)
Medical Conditions - People who ever received blood transfusion (%)
Medical Conditions - People having trouble seeing even with glass/contacts (%)
Medical Conditions - People with arthritis (%)
Medical Conditions - People with gout (%)
Medical Conditions - People with congestive heart failure (%)
Medical Conditions - People with coronary heart disease (%)
Medical Conditions - People with angina pectoris (%)
Medical Conditions - People who ever had heart attack (%)
Medical Conditions - People who ever had stroke (%)
Medical Conditions - People with emphysema (%)
Medical Conditions - People with thyroid problem (%)
Medical Conditions - People with chronic bronchitis (%)
Medical Conditions - People with any liver condition (%)
Medical Conditions - People who ever had cancer or malignancy (%)
Mental Health - People who have little interest in doing things (%)
Mental Health - People feeling down, depressed, or hopeless (%)
Mental Health - People who have trouble sleeping or sleeping too much (%)
Mental Health - People feeling tired or having little energy (%)
Mental Health - People with poor appetite or overeating (%)
Mental Health - People feeling bad about themself (%)
Mental Health - People who have trouble concentrating on things (%)
Mental Health - People moving or speaking slowly or too fast (%)
Mental Health - People having thoughts they would be better off dead (%)
Oral Health - Average years since last visit a dentist
Oral Health - People embarrassed because of mouth (%)
Oral Health - People with gum disease (%)
Oral Health - General health of teeth and gums (%)
Oral Health - Average days a week using dental floss/device
Oral Health - Average days a week using mouthwash for dental problem
Oral Health - Average number of teeth
Pesticide Use - Households using pesticides to control insects (%)
Pesticide Use - Households using pesticides to kill weeds (%)
Physical Activity - People doing vigorous-intensity work activities (%)
Physical Activity - People doing moderate-intensity work activities (%)
Physical Activity - People walking or bicycling (%)
Physical Activity - People doing vigorous-intensity recreational activities (%)
Physical Activity - People doing moderate-intensity recreational activities (%)
Physical Activity - Average hours a day doing sedentary activities
Physical Activity - Average hours a day watching TV or videos
Physical Activity - Average hours a day using computer
Physical Functioning - People having limitations keeping them from working (%)
Physical Functioning - People limited in amount of work they can do (%)
Physical Functioning - People that need special equipment to walk (%)
Physical Functioning - People experiencing confusion/memory problems (%)
Physical Functioning - People requiring special healthcare equipment (%)
Prescription Medications - Average number of prescription medicines taking
Preventive Aspirin Use - Adults 40+ taking low-dose aspirin (%)
Reproductive Health - Vaginal deliveries (%)
Reproductive Health - Cesarean deliveries (%)
Reproductive Health - Deliveries resulted in a live birth (%)
Reproductive Health - Pregnancies resulted in a delivery (%)
Reproductive Health - Women breastfeeding newborns (%)
Reproductive Health - Women that had a hysterectomy (%)
Reproductive Health - Women that had both ovaries removed (%)
Reproductive Health - Women that have ever taken birth control pills (%)
Reproductive Health - Women taking birth control pills (%)
Reproductive Health - Women that have ever used Depo-Provera or injectables (%)
Reproductive Health - Women that have ever used female hormones (%)
Sexual Behavior - People 18+ that ever had sex (vaginal, anal, or oral) (%)
Sexual Behavior - Males 18+ that ever had vaginal sex with a woman (%)
Sexual Behavior - Males 18+ that ever performed oral sex on a woman (%)
Sexual Behavior - Males 18+ that ever had anal sex with a woman (%)
Sexual Behavior - Males 18+ that ever had any sex with a man (%)
Sexual Behavior - Females 18+ that ever had vaginal sex with a man (%)
Sexual Behavior - Females 18+ that ever performed oral sex on a man (%)
Sexual Behavior - Females 18+ that ever had anal sex with a man (%)
Sexual Behavior - Females 18+ that ever had any kind of sex with a woman (%)
Sexual Behavior - Average age people first had sex
Sexual Behavior - Average number of female sex partners in lifetime (males 18+)
Sexual Behavior - Average number of female vaginal sex partners in lifetime (males 18+)
Sexual Behavior - Average age people first performed oral sex on a woman (18+)
Sexual Behavior - Average number of woman performed oral sex on in lifetime (18+)
Sexual Behavior - Average number of male sex partners in lifetime (males 18+)
Sexual Behavior - Average number of male anal sex partners in lifetime (males 18+)
Sexual Behavior - Average age people first performed oral sex on a man (18+)
Sexual Behavior - Average number of male oral sex partners in lifetime (18+)
Sexual Behavior - People using protection when performing oral sex (%)
Sexual Behavior - Average number of times people have vaginal or anal sex a year
Sexual Behavior - People having sex without condom (%)
Sexual Behavior - Average number of male sex partners in lifetime (females 18+)
Sexual Behavior - Average number of male vaginal sex partners in lifetime (females 18+)
Sexual Behavior - Average number of female sex partners in lifetime (females 18+)
Sexual Behavior - Circumcised males 18+ (%)
Sleep Disorders - Average hours sleeping at night
Sleep Disorders - People that has trouble sleeping (%)
Smoking-Cigarette Use - People smoking cigarettes (%)
Taste & Smell - People 40+ having problems with smell (%)
Taste & Smell - People 40+ having problems with taste (%)
Taste & Smell - People 40+ that ever had wisdom teeth removed (%)
Taste & Smell - People 40+ that ever had tonsils teeth removed (%)
Taste & Smell - People 40+ that ever had a loss of consciousness because of a head injury (%)
Taste & Smell - People 40+ that ever had a broken nose or other serious injury to face or skull (%)
Taste & Smell - People 40+ that ever had two or more sinus infections (%)
Weight - Average height (inches)
Weight - Average weight (pounds)
Weight - Average BMI
Weight - People that are obese (%)
Weight - People that ever were obese (%)
Weight - People trying to lose weight (%)
According to our research of Minnesota and other state lists, there was 1 registered sex offender living in Eagan, Minnesota as of April 27, 2024 . The ratio of all residents to sex offenders in Eagan is 66,848 to 1.The ratio of registered sex offenders to all residents in this city is much lower than the state average.
The City-Data.com crime index weighs serious crimes and violent crimes more heavily. Higher means more crime, U.S. average is 246.1. It adjusts for the number of visitors and daily workers commuting into cities.
- means the value is smaller than the state average.
- means the value is about the same as the state average.
- means the value is bigger than the state average.
- means the value is much bigger than the state average.
Crime rate in Eagan detailed stats: murders, rapes, robberies, assaults, burglaries, thefts, arson Officers per 1,000 residents here:
1.10Minnesota average:
1.76
Latest news from Eagan, MN collected exclusively by city-data.com from local newspapers, TV, and radio stations
Ancestries: German (18.3%), Norwegian (6.1%), European (5.5%), Irish (5.2%), Somali (4.8%), Ethiopian (3.8%).
Current Local Time:
Land area: 32.3 square miles.
Population density: 2,091 people per square mile (low).
9,931 residents are foreign born (6.6% Asia , 3.9% Africa , 1.7% Latin America , 1.6% Europe ).
This city:
14.4%Minnesota:
8.5%
Median real estate property taxes paid for housing units with mortgages in 2022: $3,774 (1.0%)Median real estate property taxes paid for housing units with no mortgage in 2022: $3,916 (1.0%)
Nearest city with pop. 200,000+: St. Paul, MN
Nearest city with pop. 1,000,000+: Chicago, IL
Nearest cities:
Mendota, MN (2.2 miles),
Latitude: 44.81 N, Longitude: 93.17 W
Daytime population change due to commuting: +16,013 (+23.7%)Workers who live and work in this city: 15,531 (40.3%)
Single-family new house construction building permits:
2022: 45 buildings , average cost: $262,3002021: 33 buildings , average cost: $344,8002020: 15 buildings , average cost: $412,6002019: 35 buildings , average cost: $413,9002018: 43 buildings , average cost: $363,7002017: 91 buildings , average cost: $352,6002016: 88 buildings , average cost: $342,9002015: 49 buildings , average cost: $347,9002014: 156 buildings , average cost: $257,5002013: 186 buildings , average cost: $287,9002012: 174 buildings , average cost: $246,8002011: 73 buildings , average cost: $286,5002010: 31 buildings , average cost: $294,6002009: 13 buildings , average cost: $301,5002008: 30 buildings , average cost: $299,1002007: 70 buildings , average cost: $290,8002006: 84 buildings , average cost: $206,1002005: 110 buildings , average cost: $158,3002004: 147 buildings , average cost: $155,9002003: 184 buildings , average cost: $163,8002002: 243 buildings , average cost: $163,9002001: 216 buildings , average cost: $153,8002000: 259 buildings , average cost: $166,0001999: 274 buildings , average cost: $183,7001998: 202 buildings , average cost: $168,9001997: 193 buildings , average cost: $147,200Unemployment in December 2023:
Population change in the 1990s: +15,641 (+32.6%).
Most common occupations in Eagan, MN (%)
Both Males Females
Computer specialists (7.1%)
Other management occupations, except farmers and farm managers (6.8%)
Cooks and food preparation workers (4.4%)
Other office and administrative support workers, including supervisors (3.5%)
Top executives (2.4%)
Cashiers (2.3%)
Material recording, scheduling, dispatching, and distributing workers (2.2%)
Computer specialists (9.7%)
Other management occupations, except farmers and farm managers (8.1%)
Cooks and food preparation workers (5.0%)
Engineers (3.6%)
Material recording, scheduling, dispatching, and distributing workers (3.0%)
Top executives (2.9%)
Driver/sales workers and truck drivers (2.9%)
Other management occupations, except farmers and farm managers (5.5%)
Other office and administrative support workers, including supervisors (5.0%)
Computer specialists (4.3%)
Cooks and food preparation workers (3.8%)
Registered nurses (3.6%)
Secretaries and administrative assistants (3.4%)
Information and record clerks, except customer service representatives (3.4%)
Tornado activity:
Eagan-area historical tornado activity is slightly above Minnesota state average. It is 32% greater than the overall U.S. average.
On 5/6/1965, a category F4 (max. wind speeds 207-260 mph) tornado 15.5 miles away from the Eagan city center killed 6 people and injured 158 people and caused between $5,000,000 and $50,000,000 in damages.
On 5/6/1965, a category F4 tornado 15.9 miles away from the city center killed 3 people and injured 175 people and caused between $5,000,000 and $50,000,000 in damages.
Earthquake activity:
Eagan-area historical earthquake activity is significantly above Minnesota state average. It is 57% smaller than the overall U.S. average. On 7/9/1975 at 14:54:15, a magnitude 4.6 (4.6 MB, Class: Light, Intensity: IV - V) earthquake occurred 151.8 miles away from Eagan center On 6/5/1993 at 01:24:53, a magnitude 4.1 (4.1 LG, Depth: 6.2 mi) earthquake occurred 163.3 miles away from the city center On 3/4/1983 at 06:32:18, a magnitude 4.6 (4.4 MB, 4.6 LG, 4.4 ML) earthquake occurred 310.5 miles away from the city center On 10/20/1995 at 15:57:18, a magnitude 3.7 (3.7 LG, Depth: 3.1 mi, Class: Light, Intensity: II - III) earthquake occurred 192.0 miles away from the city center On 2/9/1994 at 08:45:35, a magnitude 3.1 (3.1 LG, Depth: 3.1 mi) earthquake occurred 90.6 miles away from Eagan center On 11/3/2002 at 20:41:56, a magnitude 4.3 (4.3 MB, Depth: 3.1 mi) earthquake occurred 318.9 miles away from the city center Magnitude types: regional Lg-wave magnitude (LG), body-wave magnitude (MB), local magnitude (ML) Natural disasters: The number of natural disasters in Dakota County (15) is near the US average (15).Major Disasters (Presidential) Declared: 11Emergencies Declared: 3Floods: 11, Storms: 7, Tornadoes: 5, Drought: 1, Hurricane: 1, Wind: 1, Other: 1 (Note: some incidents may be assigned to more than one category). Main business address for: BUFFETS INC RETAIL-EATING PLACES ), NORTHWEST AIRLINES CORP AIR TRANSPORTATION, SCHEDULED ), Norcraft Holdings, L.P. MILLWOOD, VENEER, PLYWOOD & STRUCTURAL WOOD MEMBERS ), BUFFETS HOLDINGS, INC. RETAIL-EATING PLACES ), NORCRAFT COMPANIES LP MILLWOOD, VENEER, PLYWOOD & STRUCTURAL WOOD MEMBERS ), TRANSPORT CORPORATION OF AMERICA INC TRUCKING (NO LOCAL) ).
Hospitals and medical centers in Eagan: WARREN P EUSTIS HOUSE (720 BLUE GENTIAN ROAD)
EAGAN DIALYSIS OF DAVITA (2750 BLUE WATER RD, SUITE 300)
ALLIANCE HEALTH SERVICES INC (2260 CLIFF ROAD)
Amtrak station near Eagan: 11 miles: ST. PAUL/MINNEAPOLIS (ST. PAUL, 730 TRANSFER RD.) Services: ticket office, fully wheelchair accessible, enclosed waiting area, public restrooms, public payphones, vending machines, free short-term parking, free long-term parking, call for car rental service, taxi stand.
Colleges/Universities in Eagan: Argosy University-Twin Cities Full-time enrollment: 1,194; Location: 1515 Central Parkway; Private, for-profit; Website: www.argosy.edu/twincities/; Offers Doctor's degree )
Everest Institute-Eagan Full-time enrollment: 508; Location: 1000 Blue Gentian Road, Suite 250; Private, for-profit; Website: www.everest.edu/campus/eagan)
Northwest Technical Institute Full-time enrollment: 38; Location: 950 Blue Gentian Road Suite#500; Private, for-profit; Website: www.nti.edu)
Colleges/universities with over 2000 students nearest to Eagan:
Inver Hills Community College (about 6 miles; Inver Grove Heights, MN ; Full-time enrollment: 4,049)
Dakota County Technical College (about 7 miles; Rosemount, MN ; FT enrollment: 2,478)
St Catherine University (about 8 miles; Saint Paul, MN ; FT enrollment: 3,771)
Normandale Community College (about 9 miles; Bloomington, MN ; FT enrollment: 7,048)
Macalester College (about 9 miles; Saint Paul, MN ; FT enrollment: 2,174)
University of St Thomas (about 9 miles; Saint Paul, MN ; FT enrollment: 8,762)
Concordia University-Saint Paul (about 10 miles; Saint Paul, MN ; FT enrollment: 2,501)
Public high schools in Eagan:
Private high school in Eagan: TRINITY SCHOOL AT RIVER RIDGE Students: 305, Location: 601 RIVER RIDGE PKWY STE 200, Grades: 7-12)
Biggest public elementary/middle schools in Eagan: RAHN ELEMENTARY Location: 4424 SANDSTONE DR, Grades: KG-6)DAKOTA HILLS MIDDLE Location: 4183 BRADDOCK TR, Grades: 6-8)DEERWOOD ELEMENTARY Location: 1480 DEERWOOD DR, Grades: KG-5)GLACIER HILLS ELEMENTARY Location: 3825 GLACIER DR, Grades: KG-5)NORTHVIEW ELEMENTARY Location: 965 DIFFLEY RD, Grades: KG-5)THOMAS LAKE ELEMENTARY Location: 4350 THOMAS LAKE RD, Grades: KG-5)WOODLAND ELEMENTARY Location: 945 WESCOTT RD, Grades: KG-5)
PINEWOOD EL. Location: 4300 DODD RD, Grades: KG-5)OAK RIDGE ELEMENTARY Location: 4350 JOHNNY CAKE RIDGE RD, Grades: KG-5)BLACK HAWK MIDDLE Location: 1540 DEERWOOD DR, Grades: 6-8)Private elementary/middle schools in Eagan: FAITHFUL SHEPHERD CATHOLIC SCHOOL Students: 549, Location: 3355 COLUMBIA DR, Grades: KG-8)TRINITY LONE OAK LUTHERAN SCHOOL Students: 172, Location: 2950 HIGHWAY 55, Grades: PK-8)
See full list of schools located in Eagan Library in Eagan: DAKOTA COUNTY LIBRARY Operating income: $13,007,165; Location: 1340 WESCOTT ROAD; 760,586 books ; 20,986 e-books ; 50,487 audio materials ; 36,438 video materials ; 18 local licensed databases ; 14 state licensed databases ; 12 other licensed databases ; 1,538 print serial subscriptions )
Notable locations in Eagan: (A) , Lost Spur Country Club (B) , Carriage Hills Country Club (C) , Seneca Water Treatment Facility (D) , Camp Butwin (E) , Eagan Fire Department Station 6 Headquarters (F) , Eagan Fire Department Station 1 (G) , Eagan Fire Department Station 2 (H) , Eagan Fire Department Station 3 (I) , Eagan Fire Department Station 5 (J) , Eagan Fire Department Station 4 (K) . Display/hide their locations on the map
Shopping Centers: (1) , Cedarvale Shopping Center (2) , Cliff Lake Centre Shopping Center (3) , Diffley Square Shopping Center (4) , Duckwood Square Shopping Center (5) , Eagan Town Centre Shopping Center (6) , Rahn Cliff Shopping Center (7) , Shoppes at Promenade Shopping Center (8) , Silver Bell Shopping Center (9) . Display/hide their locations on the map
Main business address in Eagan include: (A) , NORTHWEST AIRLINES CORP (B) , Norcraft Holdings, L.P. (C) , BUFFETS HOLDINGS, INC. (D) , NORCRAFT COMPANIES LP (E) , TRANSPORT CORPORATION OF AMERICA INC (F) . Display/hide their locations on the map
Churches in Eagan include: (A) , Cedar Valley Church (B) , Advent United Methodist Church (C) , Grace Slavic Church (D) , Community of Joy Lutheran Brethren Church (E) , Heritage Church (F) . Display/hide their locations on the map
Cemeteries: (1) , Saint Johns Cemetery (2) . Display/hide their locations on the map
Lakes: (A) , Gun Club Lake (B) , Thomas Lake (C) , Quigley Lake (D) , O'Leary Lake (E) , O'Brien Lake (F) , McDonough Lake (G) , McCarthy Lake (H) . Display/hide their locations on the map
Parks in Eagan include: (1) , Wescott Station Park (2) , Burr Oaks Park (3) , Captain Dodd Park (4) , Lakeside Park (5) , Wandering Walk Park (6) , South Oaks Park (7) , Bridle Ridge Park (8) , George Ohmann Park (9) . Display/hide their locations on the map
Hotels: (1) , Hilton Garden Inn Eagan (1975 Rahncliff Ct) (2) , Homestead Minneapolis Eagan (3015 Denmark Ave) (3) , Best Western Yankee Square Inn (3450 Washington Dr) (4) . Display/hide their approximate locations on the map
Birthplace of: Natalie Darwitz - Ice hockey player, Dan Bjornlie - Ice hockey player, Doug Wardlow - Politician, Rob Rankin - Ice hockey player, Ryan Kees - Football player.
Dakota County has a predicted average indoor radon screening level greater than 4 pCi/L (pico curies per liter) - Highest Potential Drinking water stations with addresses in Eagan and their reported violations in the past:
WALMART SUPERCENTER 03837 (Address: 1030 LONE OAK RD SUITE 110 Serves IL, Population served: 100, Purch groundwater):
Past monitoring violations:
One regular monitoring violation
Address: 1030 LONE OAK RD SUITE 110 Serves IL, Population served: 50, Purch groundwater):
Past monitoring violations:
2 regular monitoring violations
Address: 1030 LONE OAK RD SUITE 110 Serves IL, Population served: 25, Purch surface water):
Past monitoring violations:
One regular monitoring violation
Address: 1030 LONE OAK RD SUITE 110 Serves IL, Population served: 25, Purch groundwater):
Past monitoring violations:
One routine major monitoring violation
One regular monitoring violation
Address: 1030 LONE OAK RD SUITE 110 Serves IL, Population served: 25, Purch groundwater):
Past monitoring violations:
One regular monitoring violation
Address: 1030 LONE OAK RD SUITE 110 Serves IL, Population served: 25, Purch groundwater):
Past monitoring violations:
One regular monitoring violation
Address: 1030 LONE OAK RD SUITE 110 Serves IL, Population served: 25, Purch groundwater):
Past monitoring violations:
One regular monitoring violation
Address: 1030 LONE OAK RD SUITE 110 Serves IL, Population served: 25, Purch groundwater):
Past monitoring violations:
One routine major monitoring violation
Drinking water stations with addresses in Eagan that have no violations reported:
EAGAN (Address: 3830 Pilot Knob Road Population served: 67,106, Primary Water Source Type: Groundwater)
WALMART SUPER STORE (Address: 1030 LONE OAK RD SUITE 110 Serves IL, Population served: 1,000, Primary Water Source Type: Purch groundwater)
WAL-MART SUPERCENTER 2491 (Address: 1030 LONE OAK RD SUITE 110 Serves IL, Population served: 600, Primary Water Source Type: Purch groundwater)
WALMART SUPERCENTER EAST PEORIA (Address: 1030 LONE OAK RD SUITE 110 Serves IL, Population served: 500, Primary Water Source Type: Purch groundwater)
MEIJERS (142182) (Address: 1030 LONE OAK RD SUITE 110 Serves IL, Population served: 200, Primary Water Source Type: Purch groundwater)
WALMART ROMEOVILLE (152330) (Address: 1030 LONE OAK RD SUITE 110 Serves IL, Population served: 200, Primary Water Source Type: Purch groundwater)
MEIJER #182 (Address: 1030 LONE OAK RD SUITE 110 Serves IL, Population served: 150, Primary Water Source Type: Purch groundwater)
HY-VEE INC (Address: 1030 LONE OAK RD SUITE 110 Serves IL, Population served: 135, Primary Water Source Type: Purch groundwater)
WALMART SUPERCENTER 1596 BOLINGBROOK (Address: 1030 LONE OAK RD SUITE 110 Serves IL, Population served: 100, Primary Water Source Type: Purch groundwater)
SUPERMERCADO LA LOMA VENDING #2 (Address: 1030 LONE OAK RD SUITE 110 Serves IL, Population served: 100, Primary Water Source Type: Purch groundwater)
Average household size: This city:
2.5 peopleMinnesota:
2.5 people
Percentage of family households: This city:
66.9%Whole state:
64.6%
Percentage of households with unmarried partners: This city:
5.9%Whole state:
6.9%
Likely homosexual households (counted as self-reported same-sex unmarried-partner households)
Lesbian couples: 0.3% of all households Gay men: 0.3% of all households
People in group quarters in Eagan in 2010:
61 people in nursing facilities/skilled-nursing facilities
61 people in group homes intended for adults
56 people in emergency and transitional shelters (with sleeping facilities) for people experiencing homelessness
15 people in other noninstitutional facilities
4 people in residential treatment centers for adults
People in group quarters in Eagan in 2000:
101 people in homes for the mentally retarded
55 people in other noninstitutional group quarters
7 people in homes for the mentally ill
2 people in other nonhousehold living situations
Banks with most branches in Eagan (2011 data):
U.S. Bank National Association: Eagan Cliff Lake Branch, Eagan Byerly's Branch, Thomson Reuters, Eagan Branch. Info updated 2012/01/30: Bank assets: $330,470.8 mil, Deposits: $236,091.5 mil, headquarters in Cincinnati, OH, positive income , 3121 total offices , Holding Company: U.S. Bancorp
TCF National Bank: Eagan Cub Branch, Eagan East Cub Branch, Eagan Promenade Branch. Info updated 2009/11/23: Bank assets: $19,007.0 mil, Deposits: $12,377.0 mil, headquarters in Sioux Falls, SD, positive income , Commercial Lending Specialization, 441 total offices , Holding Company: Tcf Financial Corporation
Guaranty Bank: Eagan Branch at 1276 Town Centre Drive, branch established on 2004/10/19. Info updated 2011/07/21: Bank assets: $1,179.1 mil, Deposits: $1,102.7 mil, headquarters in Milwaukee, WI, negative income in the last year , Mortgage Lending Specialization, 166 total offices
Think Mutual Bank: Eagan Branch at 4245 Johnny Cake Ridge Rd, branch established on 2011/01/13. Info updated 2011/07/21: Bank assets: $1,458.5 mil, Deposits: $1,165.9 mil, headquarters in Rochester, MN, positive income , Mortgage Lending Specialization, 11 total offices
Prime Security Bank: Eagan Branch at 1595 Thomas Center Drive, branch established on 2008/02/06. Info updated 2006/11/03: Bank assets: $68.8 mil, Deposits: $59.4 mil, headquarters in Karlstad, MN, negative income in the last year , Commercial Lending Specialization, 4 total offices , Holding Company: North State Bancshares, Inc.
Venture Bank: Eagan Branch at 2640 Eagan Woods Drive, branch established on 2006/11/15. Info updated 2006/11/03: Bank assets: $319.9 mil, Deposits: $291.2 mil, headquarters in Bloomington, MN, positive income , Commercial Lending Specialization, 3 total offices , Holding Company: Venture Bancshares, Inc.
Associated Bank, National Association: Eagan Branch at 1270 Yankee Doodle Road, branch established on 1973/09/17. Info updated 2008/09/12: Bank assets: $21,715.0 mil, Deposits: $15,244.4 mil, headquarters in Green Bay, WI, positive income , Commercial Lending Specialization, 282 total offices , Holding Company: Associated Banc-Corp
Wells Fargo Bank, National Association: Eagan Branch at 3390 Pilot Knob Road, branch established on 1983/02/15. Info updated 2011/04/05: Bank assets: $1,161,490.0 mil, Deposits: $905,653.0 mil, headquarters in Sioux Falls, SD, positive income , 6395 total offices , Holding Company: Wells Fargo & Company
Home Federal Savings Bank: 19 Eagan Branch at 2805 Dodd Road Ste 160, branch established on 2007/08/07. Info updated 2011/07/21: Bank assets: $790.1 mil, Deposits: $657.4 mil, headquarters in Rochester, MN, negative income in the last year , Commercial Lending Specialization, 14 total offices
3 other banks with 3 local branches
For population 15 years and over in Eagan:
Never married: 34.4%Now married: 55.7%Separated: 1.3%Widowed: 1.9%Divorced: 6.7% For population 25 years and over in Eagan:
High school or higher: 97.1%Bachelor's degree or higher: 55.9%Graduate or professional degree: 18.7%Unemployed: 3.1%Mean travel time to work (commute): 16.8 minutes
Education Gini index (Inequality in education) Here:
9.0Minnesota average:
10.9
Religion statistics for Eagan, MN (based on Dakota County data)
Religion Adherents Congregations Catholic 112,264 18 Evangelical Protestant 57,007 111 Mainline Protestant 55,850 56 Other 6,321 27 Orthodox 1,173 5 Black Protestant 313 2 None 165,624 -
Source: Clifford Grammich, Kirk Hadaway, Richard Houseal, Dale E.Jones, Alexei Krindatch, Richie Stanley and Richard H.Taylor. 2012. 2010 U.S.Religion Census: Religious Congregations & Membership Study. Association of Statisticians of American Religious Bodies. Jones, Dale E., et al. 2002. Congregations and Membership in the United States 2000. Nashville, TN: Glenmary Research Center. Graphs represent county-level data
Food Environment Statistics: Number of grocery stores : 35This county :
0.90 / 10,000 pop.Minnesota :
1.83 / 10,000 pop.
Number of supercenters and club stores : 5This county :
0.13 / 10,000 pop.Minnesota :
0.13 / 10,000 pop.
Number of convenience stores (no gas) : 6Here :
0.15 / 10,000 pop.State :
0.49 / 10,000 pop.
Number of convenience stores (with gas) : 118Here :
3.03 / 10,000 pop.Minnesota :
3.90 / 10,000 pop.
Number of full-service restaurants : 196This county :
5.03 / 10,000 pop.State :
6.98 / 10,000 pop.
Adult diabetes rate : Dakota County :
6.1%Minnesota :
6.5%
Adult obesity rate : Here :
25.6%Minnesota :
25.9%
Low-income preschool obesity rate : This county :
12.6%Minnesota :
13.0%
Health and Nutrition: Healthy diet rate : Eagan:
51.7%Minnesota:
50.6%
Average overall health of teeth and gums : This city:
51.0%Minnesota:
48.4%
People feeling badly about themselves : This city:
20.7%Minnesota:
21.0%
People not drinking alcohol at all : Average hours sleeping at night : General health condition : Average condition of hearing : Eagan:
82.2%Minnesota:
79.3%
More about Health and Nutrition of Eagan, MN Residents
Local government employment and payroll (March 2022)
Function
Full-time employees
Monthly full-time payroll
Average yearly full-time wage
Part-time employees
Monthly part-time payroll
Police Protection - Officers
74 $705,181 $114,354 0 $0 Firefighters
42 $379,808 $108,517 0 $0 Parks and Recreation
39 $287,704 $88,524 105 $82,385 Other and Unallocable
31 $232,819 $90,123 16 $13,330 Streets and Highways
22 $186,266 $101,600 1 $1,219 Sewerage
21 $135,843 $77,625 0 $0 Financial Administration
19 $163,058 $102,984 0 $0 Police - Other
17 $101,479 $71,632 0 $0 Other Government Administration
17 $130,687 $92,250 1 $245 Housing and Community Development (Local)
11 $96,964 $105,779 0 $0 Water Supply
6 $46,981 $93,962 0 $0 Fire - Other
1 $4,770 $57,240 0 $0
Totals for Government
300 $2,471,558 $98,862 123 $97,178
Eagan government finances - Expenditure in 2021 (per resident):
Construction - Regular Highways: $4,703,000 ($69.64)
Current Operations - Police Protection: $17,326,000 ($256.55)
General - Other: $11,198,000 ($165.81)Parks and Recreation: $10,068,000 ($149.08)Regular Highways: $8,503,000 ($125.91)Sewerage: $8,027,000 ($118.86)Water Utilities: $7,934,000 ($117.48)Local Fire Protection: $5,811,000 ($86.05)Financial Administration: $2,296,000 ($34.00)Central Staff Services: $148,000 ($2.19)Housing and Community Development: $115,000 ($1.70)General - Interest on Debt: $1,339,000 ($19.83)
Other Capital Outlay - Parks and Recreation: $3,935,000 ($58.27)
Regular Highways: $2,420,000 ($35.83)General - Other: $2,092,000 ($30.98)Local Fire Protection: $1,361,000 ($20.15)Police Protection: $1,150,000 ($17.03)Water Utilities: $62,000 ($0.92)Sewerage: $2,000 ($0.03)
Eagan government finances - Revenue in 2021 (per resident):
Charges - Sewerage: $6,442,000 ($95.39)
Regular Highways: $3,021,000 ($44.73)Other: $2,134,000 ($31.60)Parks and Recreation: $2,001,000 ($29.63)Federal Intergovernmental - Health and Hospitals: $5,177,000 ($76.66)
Other: $1,817,000 ($26.90)Housing and Community Development: $36,000 ($0.53)Local Intergovernmental - Other: $78,000 ($1.15)
Highways: $2,000 ($0.03)Miscellaneous - Special Assessments: $1,883,000 ($27.88)
General Revenue - Other: $518,000 ($7.67)Interest Earnings: $478,000 ($7.08)Fines and Forfeits: $386,000 ($5.72)Revenue - Water Utilities: $6,196,000 ($91.75)
State Intergovernmental - Highways: $4,478,000 ($66.31)
Other: $1,190,000 ($17.62)Tax - Property: $39,225,000 ($580.82)
Other License: $2,030,000 ($30.06)Public Utilities Sales: $986,000 ($14.60)
Eagan government finances - Debt in 2021 (per resident):
Long Term Debt - Beginning Outstanding - Unspecified Public Purpose: $45,150,000 ($668.55)
Outstanding Unspecified Public Purpose: $42,375,000 ($627.46)Beginning Outstanding - Public Debt for Private Purpose: $33,004,000 ($488.70)Outstanding Nonguaranteed - Industrial Revenue: $32,629,000 ($483.15)Retired Unspecified Public Purpose: $2,775,000 ($41.09)Retired Nonguaranteed - Public Debt for Private Purpose: $375,000 ($5.55)
Eagan government finances - Cash and Securities in 2021 (per resident):
Other Funds - Cash and Securities: $31,152,000 ($461.28)
Sinking Funds - Cash and Securities: $32,858,000 ($486.54)
8.01% of this county's 2020 resident taxpayers moved to other counties in 2021 ($77,850 average adjusted gross income )
Here:
8.01%Minnesota average:
7.79%
0.01% of residents moved to foreign countries ($89 average AGI )Dakota County:
0.01%Minnesota average:
0.00%
Top counties to which taxpayers relocated from this county between 2020 and 2021:
Businesses in Eagan, MN
Name Count Name Count
AT&T 1 Little Caesars Pizza 1 Ace Hardware 1 Marriott 2 Arby's 1 MasterBrand Cabinets 4 Barnes & Noble 1 McDonald's 5 Bed Bath & Beyond 1 Microtel 1 Best Western 1 Nike 2 Blockbuster 2 Office Depot 1 Buffalo Wild Wings 1 OfficeMax 1 Burger King 2 Old Navy 1 CVS 1 Panda Express 1 Caribou Coffee 5 Panera Bread 1 Chipotle 1 Papa John's Pizza 1 Cold Stone Creamery 1 Penske 2 Curves 1 PetSmart 1 DHL 1 Pier 1 Imports 1 Dairy Queen 2 Pizza Hut 2 Days Inn 1 Quiznos 1 Domino's Pizza 2 RadioShack 1 Extended Stay America 1 Sam's Club 1 Famous Footwear 1 Sears 1 FedEx 11 Slumberland 1 Firestone Complete Auto Care 1 Sprint Nextel 1 GNC 2 Starbucks 3 GameStop 1 T-Mobile 3 H&R Block 2 T.J.Maxx 1 Hilton 2 Taco Bell 2 Holiday Inn 3 Target 1 Home Depot 1 U-Haul 2 Homestead Studio Suites 1 UPS 5 Houlihan's 1 Verizon Wireless 2 Jimmy John's 2 Walgreens 3 Jones New York 1 Walmart 1 KFC 2 Wendy's 2 Kohl's 1 YMCA 1 La-Z-Boy 1
Strongest AM radio stations in Eagan:
KKMS (980 AM; 5 kW; RICHFIELD, MN)
WCTS (1030 AM; 50 kW; MAPLEWOOD, MN; Owner: CNTL. BAPT. THEO/AL SEMI MINNEAPOLIS)
KFAN (1130 AM; 50 kW; MINNEAPOLIS, MN; Owner: AMFM RADIO LICENSES, L.L.C.)
KSTP (1500 AM; 50 kW; ST. PAUL, MN; Owner: KSTP-AM, LLC (DELAWARE))
KTIS (900 AM; 25 kW; MINNEAPOLIS, MN; Owner: NORTHWESTERN COLLEGE)
WMNN (1330 AM; 10 kW; MINNEAPOLIS, MN; Owner: MINNESOTA PUBLIC RADIO.)
WCCO (830 AM; 50 kW; MINNEAPOLIS, MN; Owner: INFINITY MEDIA CORPORATION)
KUOM (770 AM; daytime; 5 kW; MINNEAPOLIS, MN)
WWTC (1280 AM; 5 kW; MINNEAPOLIS, MN; Owner: SCA LICENSE CORPORATION)
WDGY (630 AM; 8 kW; HUDSON, WI; Owner: 630 RADIO, INCORPORATED)
KSMM (1530 AM; 9 kW; SHAKOPEE, MN; Owner: STARBOARD BROADCASTING, INC.)
KDIZ (1440 AM; 5 kW; GOLDEN VALLEY, MN; Owner: KQRS, INC.)
KYCR (1570 AM; 4 kW; GOLDEN VALLEY, MN; Owner: COMMON GROUND BROADCASTING COMPANY,)
Strongest FM radio stations in Eagan:
WCAL (89.3 FM; NORTHFIELD, MN; Owner: ST. OLAF COLLEGE)
WGVX (105.1 FM; LAKEVILLE, MN; Owner: KQRS, INC.)
KNOW-FM (91.1 FM; MINNEAPOLIS-ST. PAUL, MN; Owner: MINNESOTA PUBLIC RADIO)
WLTE (102.9 FM; MINNEAPOLIS, MN; Owner: INFINITY MEDIA CORPORATION)
KSTP-FM (94.5 FM; ST. PAUL, MN; Owner: KSTP-FM, LLC, A DELAWARE LLC)
KEEY-FM (102.1 FM; ST. PAUL, MN; Owner: AMFM RADIO LICENSES, L.L.C.)
KTIS-FM (98.5 FM; MINNEAPOLIS, MN; Owner: NORTHWESTERN COLLEGE)
K294AM (106.7 FM; WEST ST. PAUL, MN; Owner: FRESH AIR, INCORPORATED)
KDWB-FM (101.3 FM; RICHFIELD, MN; Owner: AMFM RADIO LICENSES, L.L.C.)
KQRS-FM (92.5 FM; GOLDEN VALLEY, MN; Owner: KQRS, Inc.)
KSJN (99.5 FM; MINNEAPOLIS, MN; Owner: MINNESOTA PUBLIC RADIO)
KXXR (93.7 FM; MINNEAPOLIS, MN; Owner: KQRS, INC.)
KTCZ-FM (97.1 FM; MINNEAPOLIS, MN; Owner: AMFM RADIO LICENSES, L.L.C.)
K214DF (90.7 FM; GOLDEN VALLEY, MN; Owner: EDUCATIONAL MEDIA FOUNDATION)
KNOF (95.3 FM; ST. PAUL, MN; Owner: SELBY GOSPEL BROADCASTING CORPORATION)
KBEM-FM (88.5 FM; MINNEAPOLIS, MN; Owner: BD. OF EDUCATION, S.S.D. NO. 1)
KFAI (90.3 FM; MINNEAPOLIS, MN; Owner: FRESH AIR, INC.)
KQQL (107.9 FM; ANOKA, MN; Owner: AMFM RADIO LICENSES, L.L.C.)
WXPT (104.1 FM; ST. LOUIS PARK, MN; Owner: THE AUDIO HOUSE, INC.)
WGVZ (105.7 FM; EDEN PRAIRIE, MN; Owner: KQRS, INC.)
TV broadcast stations around Eagan:
KMSP-TV (Channel 9; MINNEAPOLIS, MN; Owner: FOX TELEVISION STATIONS, INC.)
KARE (Channel 11; MINNEAPOLIS, MN; Owner: MULTIMEDIA HOLDINGS CORPORATION)
KSTP-TV (Channel 5; ST. PAUL, MN; Owner: HUBBARD BROADCASTING, INC.)
KTCA-TV (Channel 2; ST. PAUL, MN; Owner: TWIN CITIES PUBLIC TELEVISION, INC.)
K07UI (Channel 7; MINNEAPOLIS, ETC., MN; Owner: WORD OF GOD FELLOWSHIP, INC.)
WCCO-TV (Channel 4; MINNEAPOLIS, MN; Owner: CBS BROADCASTING INC.)
K58BS (Channel 58; MINNEAPOLIS, MN; Owner: TRINITY BROADCASTING NETWORK)
KTCI-TV (Channel 17; ST. PAUL, MN; Owner: TWIN CITIES PUBLIC TELEVISION, INC.)
KSTC-TV (Channel 45; MINNEAPOLIS, MN; Owner: HUBBARD BROADCASTING, INC.)
K67HG (Channel 67; MINNEAPOLIS, MN; Owner: VENTANA TELEVISION, INC.)
K14KH (Channel 14; MINNEAPOLIS, MN; Owner: THREE ANGELS BROADCASTING NETWORK)
KMWB (Channel 23; MINNEAPOLIS, MN; Owner: KLGT LICENSEE, LLC)
K19ER (Channel 19; ST. PAUL, MN; Owner: CATHOLIC VIEWS BROADCASTS, INC.)
W62BD (Channel 62; MINNEAPOLIS, MN; Owner: WORD OF GOD FELLOWSHIP, INC.)
WFTC (Channel 29; MINNEAPOLIS, MN; Owner: FOX TELEVISION STATIONS, INC.)
WBWX-CA (Channel 13; MINNEAPOLIS, MN; Owner: THE BOX WORLDWIDE LLC)
KPXM (Channel 41; ST. CLOUD, MN; Owner: PAXSON MINNEAPOLIS LICENSE, INC.)
National Bridge Inventory (NBI) Statistics 69 Number of bridges1,759ft / 536m Total length $3,270,999,000 Total costs2,511,252 Total average daily traffic90,057 Total average daily truck traffic
New bridges - historical statistics
24 1970-1979 34 1980-1989 1 1990-1999 3 2000-2009 7 2010-2019
See full National Bridge Inventory statistics for Eagan, MN
Home Mortgage Disclosure Act Aggregated Statistics For Year 2009(Based on 16 full tracts) A) FHA, FSA/RHS & VA B) Conventional C) Refinancings D) Home Improvement Loans E) Loans on Dwellings For 5+ Families F) Non-occupant Loans on G) Loans On Manufactured Number Average Value Number Average Value Number Average Value Number Average Value Number Average Value Number Average Value Number Average Value
LOANS ORIGINATED 351 $173,322 324 $198,133 2,109 $213,378 121 $109,339 0 $0 52 $140,962 0 $0 APPLICATIONS APPROVED, NOT ACCEPTED 13 $162,154 23 $215,261 185 $209,005 17 $79,765 0 $0 3 $142,000 0 $0 APPLICATIONS DENIED 39 $181,179 26 $147,577 425 $226,788 41 $49,707 0 $0 15 $132,333 1 $84,000 APPLICATIONS WITHDRAWN 24 $180,792 43 $221,116 370 $221,230 25 $119,760 1 $8,000,000 16 $156,688 0 $0 FILES CLOSED FOR INCOMPLETENESS 3 $177,333 6 $165,500 140 $202,586 7 $109,429 0 $0 1 $177,000 1 $15,000
Aggregated Statistics For Year 2008(Based on 16 full tracts) A) FHA, FSA/RHS & VA B) Conventional C) Refinancings D) Home Improvement Loans E) Loans on Dwellings For 5+ Families F) Non-occupant Loans on G) Loans On Manufactured Number Average Value Number Average Value Number Average Value Number Average Value Number Average Value Number Average Value Number Average Value
LOANS ORIGINATED 228 $190,811 486 $221,160 872 $201,662 129 $61,357 2 $1,443,000 80 $176,525 1 $41,000 APPLICATIONS APPROVED, NOT ACCEPTED 14 $188,429 54 $242,741 156 $178,962 22 $109,273 0 $0 10 $136,400 0 $0 APPLICATIONS DENIED 16 $198,938 60 $193,667 389 $207,082 73 $73,274 2 $1,167,500 22 $137,273 9 $36,778 APPLICATIONS WITHDRAWN 17 $182,529 62 $220,016 238 $204,542 26 $103,615 0 $0 21 $198,048 0 $0 FILES CLOSED FOR INCOMPLETENESS 2 $172,500 16 $235,125 65 $180,554 11 $100,818 0 $0 0 $0 0 $0
Aggregated Statistics For Year 2007(Based on 16 full tracts) A) FHA, FSA/RHS & VA B) Conventional C) Refinancings D) Home Improvement Loans E) Loans on Dwellings For 5+ Families F) Non-occupant Loans on G) Loans On Manufactured Number Average Value Number Average Value Number Average Value Number Average Value Number Average Value Number Average Value Number Average Value
LOANS ORIGINATED 56 $186,161 815 $196,936 1,008 $179,316 182 $55,599 3 $5,806,333 85 $175,788 1 $63,000 APPLICATIONS APPROVED, NOT ACCEPTED 1 $182,000 92 $186,022 213 $173,484 41 $66,073 0 $0 15 $198,867 3 $37,667 APPLICATIONS DENIED 4 $215,250 171 $193,795 635 $197,683 54 $74,889 0 $0 78 $160,231 13 $41,462 APPLICATIONS WITHDRAWN 5 $163,800 70 $194,200 297 $206,990 17 $98,353 0 $0 39 $179,487 0 $0 FILES CLOSED FOR INCOMPLETENESS 0 $0 17 $194,353 73 $193,781 9 $79,111 0 $0 4 $178,750 0 $0
Aggregated Statistics For Year 2006(Based on 16 full tracts) A) FHA, FSA/RHS & VA B) Conventional C) Refinancings D) Home Improvement Loans E) Loans on Dwellings For 5+ Families F) Non-occupant Loans on G) Loans On Manufactured Number Average Value Number Average Value Number Average Value Number Average Value Number Average Value Number Average Value Number Average Value
LOANS ORIGINATED 85 $181,871 1,350 $176,373 1,188 $174,606 215 $64,237 1 $7,685,000 169 $162,053 0 $0 APPLICATIONS APPROVED, NOT ACCEPTED 6 $139,333 177 $161,407 271 $159,244 45 $62,644 0 $0 36 $147,167 3 $36,000 APPLICATIONS DENIED 5 $159,400 225 $158,409 608 $185,526 78 $58,910 0 $0 40 $132,325 9 $60,889 APPLICATIONS WITHDRAWN 5 $228,400 147 $177,735 451 $189,632 43 $99,116 0 $0 47 $157,213 0 $0 FILES CLOSED FOR INCOMPLETENESS 1 $255,000 40 $134,725 139 $209,410 13 $124,923 0 $0 14 $144,571 0 $0
Aggregated Statistics For Year 2005(Based on 16 full tracts) A) FHA, FSA/RHS & VA B) Conventional C) Refinancings D) Home Improvement Loans E) Loans on Dwellings For 5+ Families F) Non-occupant Loans on G) Loans On Manufactured Number Average Value Number Average Value Number Average Value Number Average Value Number Average Value Number Average Value Number Average Value
LOANS ORIGINATED 74 $175,797 1,586 $170,762 1,899 $187,810 227 $52,515 4 $2,685,750 195 $147,226 4 $46,250 APPLICATIONS APPROVED, NOT ACCEPTED 3 $145,667 171 $150,152 248 $176,883 33 $46,636 0 $0 17 $171,412 4 $31,500 APPLICATIONS DENIED 5 $153,000 260 $144,769 644 $191,185 85 $67,106 0 $0 60 $153,133 6 $33,333 APPLICATIONS WITHDRAWN 9 $191,000 191 $163,220 669 $209,106 77 $145,883 0 $0 47 $144,000 0 $0 FILES CLOSED FOR INCOMPLETENESS 0 $0 46 $146,674 186 $206,215 11 $129,818 0 $0 10 $135,000 0 $0
Aggregated Statistics For Year 2004(Based on 16 full tracts) A) FHA, FSA/RHS & VA B) Conventional C) Refinancings D) Home Improvement Loans E) Loans on Dwellings For 5+ Families F) Non-occupant Loans on G) Loans On Manufactured Number Average Value Number Average Value Number Average Value Number Average Value Number Average Value Number Average Value Number Average Value
LOANS ORIGINATED 101 $168,960 1,585 $183,342 2,053 $177,098 213 $59,493 4 $3,542,500 138 $156,022 4 $78,250 APPLICATIONS APPROVED, NOT ACCEPTED 3 $146,667 138 $182,645 293 $173,563 32 $61,469 0 $0 21 $187,476 2 $64,000 APPLICATIONS DENIED 7 $146,571 193 $161,321 626 $183,942 90 $84,367 1 $10,700,000 53 $159,094 12 $41,667 APPLICATIONS WITHDRAWN 5 $134,600 134 $184,291 548 $193,509 46 $59,783 2 $77,500 17 $198,000 2 $84,500 FILES CLOSED FOR INCOMPLETENESS 6 $151,833 30 $175,433 189 $198,926 17 $35,588 0 $0 8 $334,125 0 $0
Aggregated Statistics For Year 2003(Based on 16 full tracts) A) FHA, FSA/RHS & VA B) Conventional C) Refinancings D) Home Improvement Loans E) Loans on Dwellings For 5+ Families F) Non-occupant Loans on Number Average Value Number Average Value Number Average Value Number Average Value Number Average Value Number Average Value
LOANS ORIGINATED 189 $163,841 1,638 $182,695 6,389 $162,204 209 $40,957 3 $3,133,333 186 $151,817 APPLICATIONS APPROVED, NOT ACCEPTED 5 $148,800 132 $183,939 517 $160,170 39 $33,897 0 $0 22 $171,045 APPLICATIONS DENIED 12 $154,333 161 $156,795 782 $162,347 87 $43,046 0 $0 44 $149,818 APPLICATIONS WITHDRAWN 4 $146,250 134 $184,448 741 $161,949 11 $44,909 0 $0 23 $141,304 FILES CLOSED FOR INCOMPLETENESS 7 $149,429 32 $196,469 191 $166,283 8 $37,500 0 $0 13 $181,077
Aggregated Statistics For Year 2002(Based on 4 full tracts) A) FHA, FSA/RHS & VA B) Conventional C) Refinancings D) Home Improvement Loans F) Non-occupant Loans on Number Average Value Number Average Value Number Average Value Number Average Value Number Average Value
LOANS ORIGINATED 63 $155,032 301 $150,193 824 $141,034 44 $25,591 36 $117,611 APPLICATIONS APPROVED, NOT ACCEPTED 4 $162,750 26 $136,462 87 $134,908 11 $38,455 1 $200,000 APPLICATIONS DENIED 3 $184,667 13 $281,077 124 $113,339 18 $24,444 4 $502,500 APPLICATIONS WITHDRAWN 2 $144,000 35 $177,600 143 $145,245 9 $42,333 2 $125,500 FILES CLOSED FOR INCOMPLETENESS 0 $0 3 $96,667 57 $149,842 0 $0 1 $88,000
Aggregated Statistics For Year 2001(Based on 4 full tracts) A) FHA, FSA/RHS & VA B) Conventional C) Refinancings D) Home Improvement Loans F) Non-occupant Loans on Number Average Value Number Average Value Number Average Value Number Average Value Number Average Value
LOANS ORIGINATED 87 $146,586 257 $140,502 631 $120,937 45 $20,489 12 $107,167 APPLICATIONS APPROVED, NOT ACCEPTED 2 $141,500 13 $104,231 60 $84,633 10 $26,900 4 $78,000 APPLICATIONS DENIED 0 $0 15 $88,933 128 $93,414 26 $45,577 4 $91,000 APPLICATIONS WITHDRAWN 4 $99,750 9 $222,111 126 $122,698 11 $39,455 2 $137,500 FILES CLOSED FOR INCOMPLETENESS 0 $0 2 $112,000 34 $110,118 2 $45,000 2 $125,000
Aggregated Statistics For Year 2000(Based on 4 full tracts) A) FHA, FSA/RHS & VA B) Conventional C) Refinancings D) Home Improvement Loans F) Non-occupant Loans on Number Average Value Number Average Value Number Average Value Number Average Value Number Average Value
LOANS ORIGINATED 105 $128,486 266 $134,496 167 $92,198 60 $19,983 7 $106,286 APPLICATIONS APPROVED, NOT ACCEPTED 7 $142,000 21 $116,286 22 $55,273 7 $16,143 0 $0 APPLICATIONS DENIED 5 $126,000 27 $93,963 77 $71,481 25 $28,880 1 $50,000 APPLICATIONS WITHDRAWN 3 $143,000 12 $117,583 75 $94,347 7 $23,429 0 $0 FILES CLOSED FOR INCOMPLETENESS 1 $119,000 3 $306,000 31 $106,258 1 $15,000 0 $0
Aggregated Statistics For Year 1999(Based on 9 full tracts) A) FHA, FSA/RHS & VA B) Conventional C) Refinancings D) Home Improvement Loans E) Loans on Dwellings For 5+ Families F) Non-occupant Loans on Number Average Value Number Average Value Number Average Value Number Average Value Number Average Value Number Average Value
LOANS ORIGINATED 323 $116,098 1,219 $135,276 1,408 $108,276 282 $22,651 5 $13,441,708 48 $88,166 APPLICATIONS APPROVED, NOT ACCEPTED 4 $123,472 91 $121,762 211 $96,218 36 $25,429 0 $0 1 $65,000 APPLICATIONS DENIED 11 $111,581 171 $80,035 338 $87,665 106 $21,119 0 $0 12 $106,138 APPLICATIONS WITHDRAWN 11 $101,308 95 $135,772 293 $107,732 36 $39,366 1 $111,000 3 $164,303 FILES CLOSED FOR INCOMPLETENESS 3 $125,020 26 $145,182 70 $117,302 5 $28,360 0 $0 6 $153,207
Detailed mortgage data for all 16 tracts in Eagan, MN
Private Mortgage Insurance Companies Aggregated Statistics For Year 2009(Based on 16 full tracts) A) Conventional B) Refinancings C) Non-occupant Loans on Number Average Value Number Average Value Number Average Value
LOANS ORIGINATED 59 $221,729 54 $236,185 1 $66,000 APPLICATIONS APPROVED, NOT ACCEPTED 11 $259,091 23 $240,174 0 $0 APPLICATIONS DENIED 4 $223,250 8 $164,500 0 $0 APPLICATIONS WITHDRAWN 1 $101,000 4 $272,000 0 $0 FILES CLOSED FOR INCOMPLETENESS 2 $206,000 2 $296,000 0 $0
Aggregated Statistics For Year 2008(Based on 16 full tracts) A) Conventional B) Refinancings C) Non-occupant Loans on Number Average Value Number Average Value Number Average Value
LOANS ORIGINATED 152 $217,164 93 $228,914 7 $171,571 APPLICATIONS APPROVED, NOT ACCEPTED 40 $250,650 38 $250,026 2 $219,500 APPLICATIONS DENIED 10 $248,900 8 $236,125 1 $196,000 APPLICATIONS WITHDRAWN 12 $281,583 10 $283,200 1 $190,000 FILES CLOSED FOR INCOMPLETENESS 7 $201,143 4 $194,750 4 $221,750
Aggregated Statistics For Year 2007(Based on 16 full tracts) A) Conventional B) Refinancings C) Non-occupant Loans on Number Average Value Number Average Value Number Average Value
LOANS ORIGINATED 317 $203,155 119 $228,714 22 $227,273 APPLICATIONS APPROVED, NOT ACCEPTED 17 $213,471 28 $263,893 1 $262,000 APPLICATIONS DENIED 1 $121,000 1 $176,000 0 $0 APPLICATIONS WITHDRAWN 13 $197,846 9 $208,000 2 $255,000 FILES CLOSED FOR INCOMPLETENESS 1 $170,000 0 $0 0 $0
Aggregated Statistics For Year 2006(Based on 16 full tracts) A) Conventional B) Refinancings C) Non-occupant Loans on Number Average Value Number Average Value Number Average Value
LOANS ORIGINATED 157 $205,879 57 $241,070 2 $187,500 APPLICATIONS APPROVED, NOT ACCEPTED 20 $213,150 18 $227,833 1 $167,000 APPLICATIONS DENIED 2 $220,000 3 $254,000 1 $241,000 APPLICATIONS WITHDRAWN 3 $218,667 9 $235,778 1 $154,000 FILES CLOSED FOR INCOMPLETENESS 0 $0 0 $0 0 $0
Aggregated Statistics For Year 2005(Based on 16 full tracts) A) Conventional B) Refinancings C) Non-occupant Loans on Number Average Value Number Average Value Number Average Value
LOANS ORIGINATED 185 $202,389 90 $208,456 14 $178,643 APPLICATIONS APPROVED, NOT ACCEPTED 22 $199,773 22 $230,455 2 $271,000 APPLICATIONS DENIED 0 $0 1 $164,000 0 $0 APPLICATIONS WITHDRAWN 13 $222,308 10 $206,600 0 $0 FILES CLOSED FOR INCOMPLETENESS 2 $200,000 1 $362,000 0 $0
Aggregated Statistics For Year 2004(Based on 16 full tracts) A) Conventional B) Refinancings C) Non-occupant Loans on Number Average Value Number Average Value Number Average Value
LOANS ORIGINATED 284 $200,130 92 $215,935 25 $256,000 APPLICATIONS APPROVED, NOT ACCEPTED 52 $201,596 31 $211,935 2 $172,000 APPLICATIONS DENIED 4 $350,250 3 $296,333 3 $382,000 APPLICATIONS WITHDRAWN 16 $233,688 10 $190,900 5 $205,800 FILES CLOSED FOR INCOMPLETENESS 1 $204,000 9 $222,000 1 $204,000
Aggregated Statistics For Year 2003(Based on 16 full tracts) A) Conventional B) Refinancings C) Non-occupant Loans on Number Average Value Number Average Value Number Average Value
LOANS ORIGINATED 478 $181,954 337 $178,599 29 $149,862 APPLICATIONS APPROVED, NOT ACCEPTED 70 $186,129 85 $176,306 7 $132,857 APPLICATIONS DENIED 4 $240,500 4 $212,750 1 $187,000 APPLICATIONS WITHDRAWN 19 $182,789 19 $171,789 9 $155,444 FILES CLOSED FOR INCOMPLETENESS 4 $170,250 3 $178,000 0 $0
Aggregated Statistics For Year 2002(Based on 4 full tracts) A) Conventional B) Refinancings C) Non-occupant Loans on Number Average Value Number Average Value Number Average Value
LOANS ORIGINATED 106 $163,255 59 $169,746 7 $151,571 APPLICATIONS APPROVED, NOT ACCEPTED 11 $147,000 17 $160,353 0 $0 APPLICATIONS DENIED 0 $0 0 $0 0 $0 APPLICATIONS WITHDRAWN 3 $188,333 3 $170,333 0 $0 FILES CLOSED FOR INCOMPLETENESS 0 $0 1 $128,000 0 $0
Aggregated Statistics For Year 2001(Based on 4 full tracts) A) Conventional B) Refinancings C) Non-occupant Loans on Number Average Value Number Average Value Number Average Value
LOANS ORIGINATED 119 $155,252 62 $155,145 4 $102,750 APPLICATIONS APPROVED, NOT ACCEPTED 9 $169,222 11 $133,727 1 $128,000 APPLICATIONS DENIED 1 $124,000 3 $154,000 0 $0 APPLICATIONS WITHDRAWN 3 $132,333 2 $174,000 1 $145,000 FILES CLOSED FOR INCOMPLETENESS 0 $0 0 $0 0 $0
Aggregated Statistics For Year 2000(Based on 4 full tracts) A) Conventional B) Refinancings C) Non-occupant Loans on Number Average Value Number Average Value Number Average Value
LOANS ORIGINATED 105 $143,057 17 $119,294 2 $82,500 APPLICATIONS APPROVED, NOT ACCEPTED 8 $111,375 6 $157,000 0 $0 APPLICATIONS DENIED 3 $131,000 1 $238,000 0 $0 APPLICATIONS WITHDRAWN 3 $109,000 0 $0 0 $0 FILES CLOSED FOR INCOMPLETENESS 0 $0 0 $0 0 $0
Aggregated Statistics For Year 1999(Based on 9 full tracts) A) Conventional B) Refinancings C) Non-occupant Loans on Number Average Value Number Average Value Number Average Value
LOANS ORIGINATED 448 $135,264 171 $134,428 7 $104,823 APPLICATIONS APPROVED, NOT ACCEPTED 34 $141,657 26 $154,603 0 $0 APPLICATIONS DENIED 12 $153,634 8 $127,372 2 $146,690 APPLICATIONS WITHDRAWN 7 $149,674 8 $147,201 0 $0 FILES CLOSED FOR INCOMPLETENESS 4 $130,798 2 $109,765 0 $0
Fire-safe hotels and motels in Eagan, Minnesota:
Crowne Plaza Minneapolis/St Paul Airport - Eagan, 2700 Pilot Knob Rd, Eagan, Minnesota 55121 Phone: (651) 454-3434, Fax: (651) 454-4904
Extended Stay America - Minneapolis - Airport - Eagan - South, 3384 Norwest Ct, Eagan, Minnesota 55121 Phone: (952) 681-9991, Fax: (651) 681-9993
Extended Stay America - Minneapolis - Airport - Eagan - North, 3015 Demark Ave, Eagan, Minnesota 55121 Phone: (612) 905-1778, Fax: (612) 905-1779
Quality Inn & Suites, 1950 Rahncliff Ct, Eagan, Minnesota 55122 Phone: (651) 681-9266, Fax: (651) 688-6306
Duplicate Entry See #MN610 For Info, Duplicate Entry See #MN610 For Info, Eagan, Minnesota 55122 Phone: (651) 994-7810
Comfort Inn & Suties Eagan, 3035 Holiday Ln, Eagan, Minnesota 55121 Phone: (651) 287-0790, Fax: (651) 287-0830
Staybridge Suites Eagan Arpt South - Mall Area, 4675 Rahncliff Rd, Eagan, Minnesota 55122 Phone: (651) 994-7810, Fax: (651) 405-9041
Hilton Garden Inn Minneapolis / Eagan, 1975 Rahncliff Ct, Eagan, Minnesota 55122 Phone: (651) 686-4605, Fax: (651) 686-4226
All 8 fire-safe hotels and motels in Eagan, Minnesota Eagan compared to Minnesota state average:
Unemployed percentage significantly below state average. Black race population percentage above state average. Median age below state average. Foreign-born population percentage above state average. House age below state average. Percentage of population with a bachelor's degree or higher above state average.
#8 on the list of "Top 101 cities with the largest temperature differences during a year (population 50,000+)"
#13 on the list of "Top 101 cities with the coldest winters (population 50,000+)"
#15 on the list of "Top 101 cities with largest percentage of females in occupations: installation, maintenance, and repair occupations (population 50,000+)"
#16 on the list of "Top 101 cities with the lowest number of assaults per 100,000 residents (population 50,000+)"
#17 on the list of "Top 101 cities with the lowest daily low temperatures (population 50,000+)"
#21 on the list of "Top 101 cities with the lowest number of murders per 100,000 residents (population 50,000+)"
#25 on the list of "Top 101 cities with the lowest average temperatures (population 50,000+)"
#30 on the list of "Top 101 cities with largest percentage of females in occupations: computer and mathematical occupations (population 50,000+)"
#37 on the list of "Top 101 cities with largest percentage of females in occupations: legal occupations (population 50,000+)"
#37 on the list of "Top 100 safest cities (lowest city-data.com crime index) (pop. 50,000+)"
#38 on the list of "Top 101 cities with the least people below 50% of the poverty level (population 50,000+)"
#39 on the list of "Top 101 cities with the lowest number of robberies per 100,000 residents (population 50,000+)"
#40 on the list of "Top 101 cities with largest percentage of females in occupations: construction and extraction occupations (population 50,000+)"
#42 on the list of "Top 101 cities with largest percentage of males in occupations: business and financial operations occupations (population 50,000+)"
#46 on the list of "Top 101 cities with largest percentage of males in industries: finance and insurance (population 50,000+)"
#50 on the list of "Top 101 cities with largest percentage of males in occupations: computer and mathematical occupations (population 50,000+)"
#52 on the list of "Top 101 cities with the lowest number of auto thefts per 100,000 residents (population 50,000+)"
#61 on the list of "Top 101 cities with the smallest household incomes disparities (population 50,000+)"
#66 on the list of "Top 101 cities with the lowest number of burglaries per 100,000 residents (population 50,000+)"
#68 on the list of "Top 101 cities with largest percentage of males in industries: management of companies and enterprises (population 50,000+)"
#1 on the list of "Top 101 counties with the highest percentage of residents that visited a dentist within the past year"
#8 on the list of "Top 101 counties with the highest percentage of residents that exercised in the past month"
#9 on the list of "Top 101 counties with the lowest number of infant deaths per 1000 residents 2007-2013 (pop. 50,000+)"
#9 on the list of "Top 101 counties with the largest decrease in the number of infant deaths per 1000 residents 2000-2006 to 2007-2013 (pop. 50,000+)"
#15 on the list of "Top 101 counties with the best general health status score of residents (1-5), 3 years of data"
Top Patent Applicants
Insik Jin (62)
Michael S. Rosenberg (48)
George W. Griesgraber (38)
Michael C. Kautzky (36)
Michael Christopher Kautzky (36)
Craig L. Schmidt (32)
Billy L. Weaver (28)
Kimberly A. Anderson (25)
Kristofer J. James (24)
Ishmael Bentley (23)
Total of 1759 patent applications in 2008-2024.

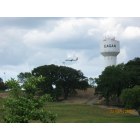
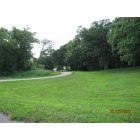
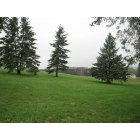

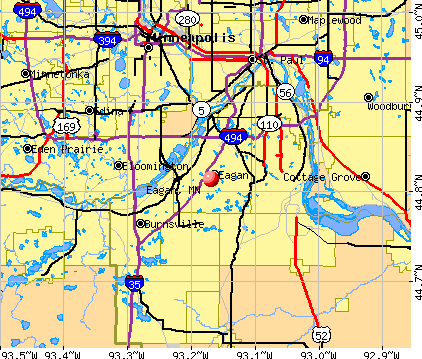


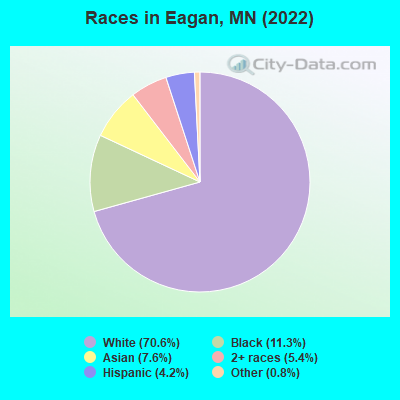
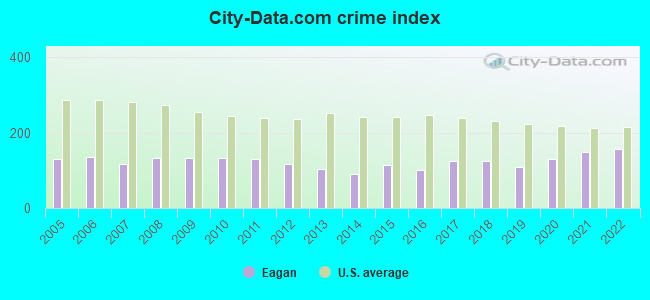
 Recent articles from our blog. Our writers, many of them Ph.D. graduates or candidates, create easy-to-read articles on a wide variety of topics.

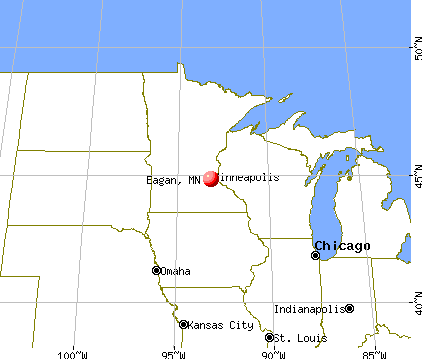
 (10.1 miles
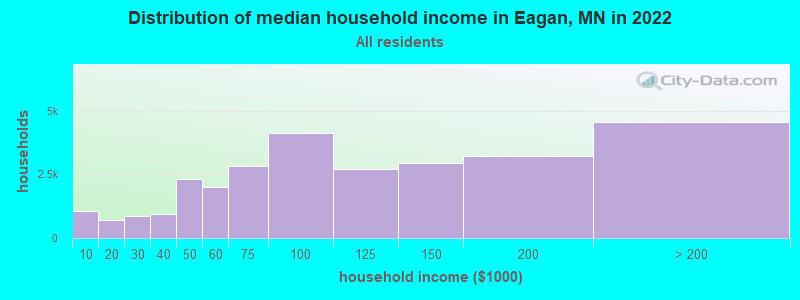
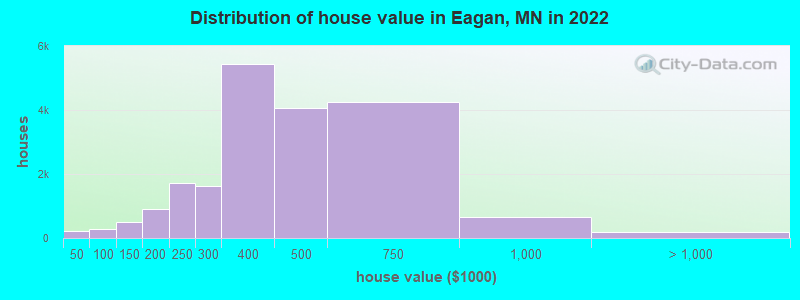
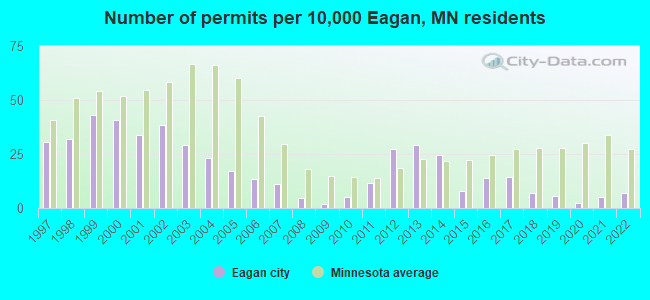
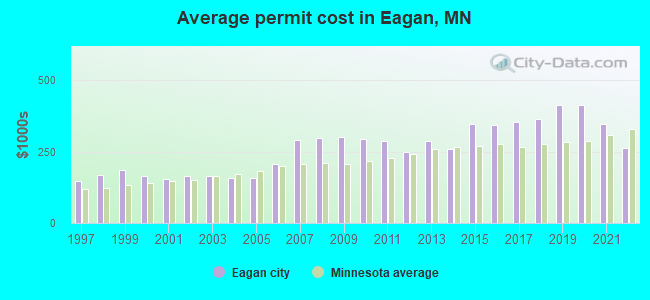
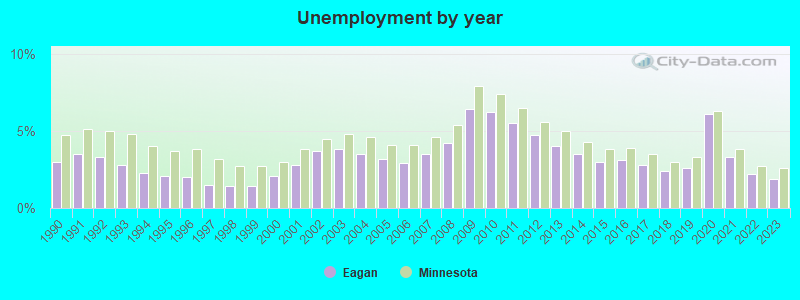
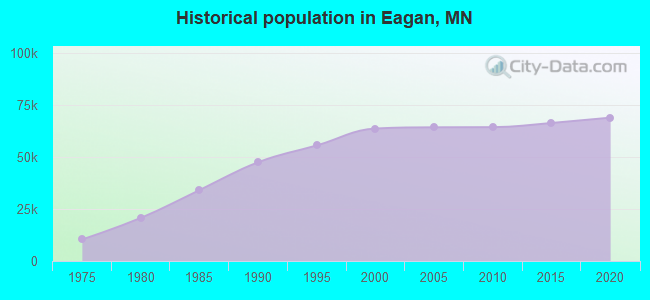
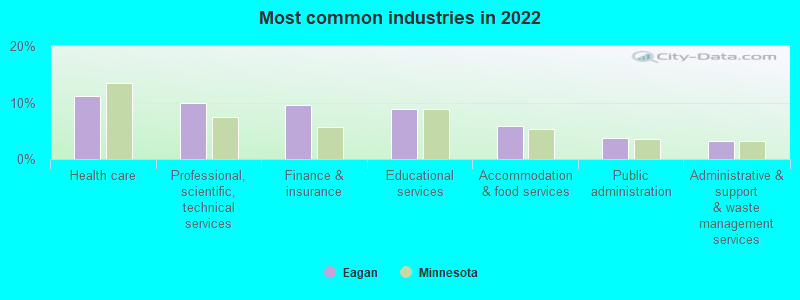
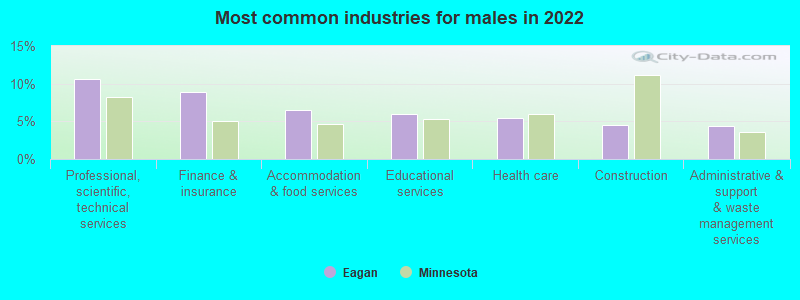
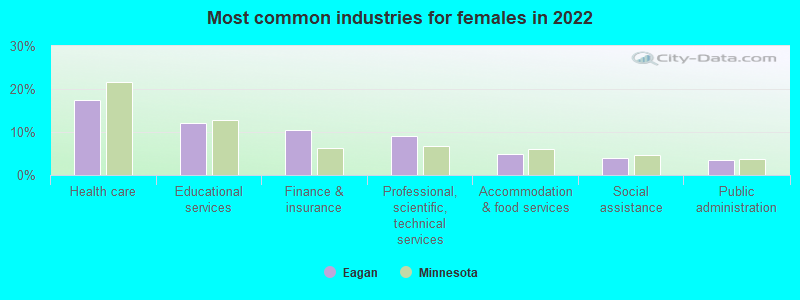
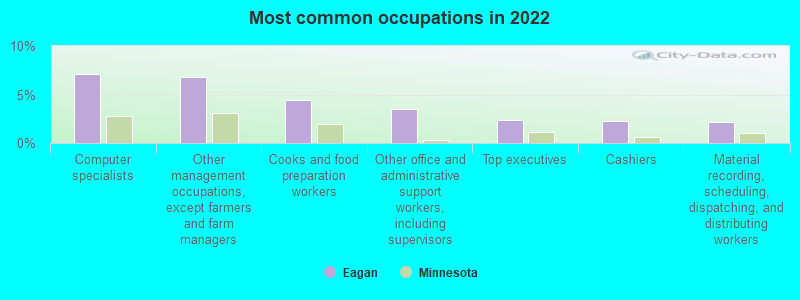
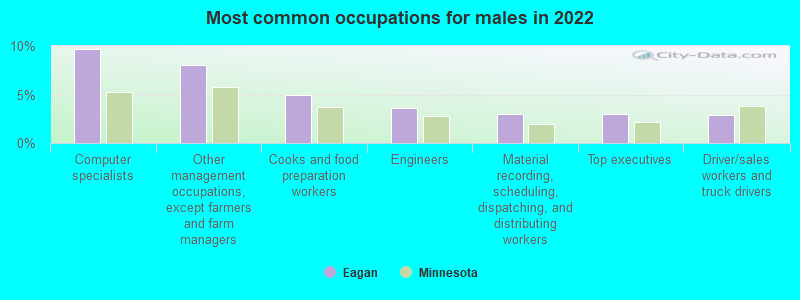
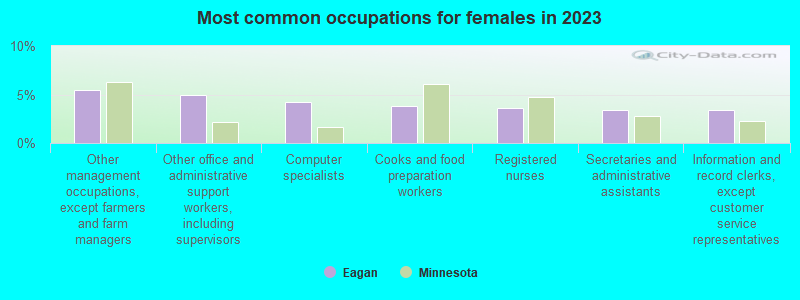
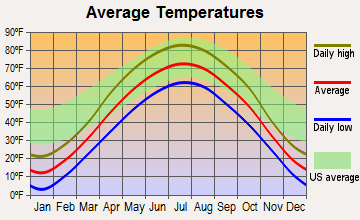
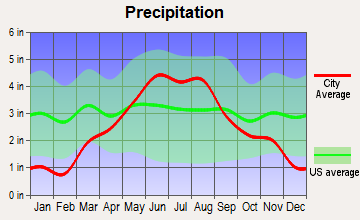
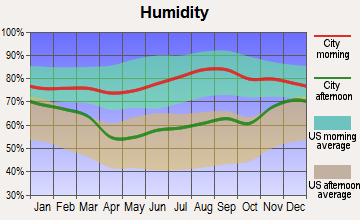
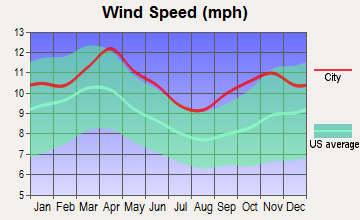
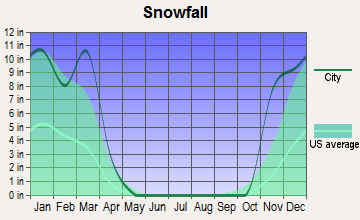
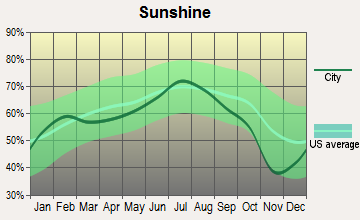
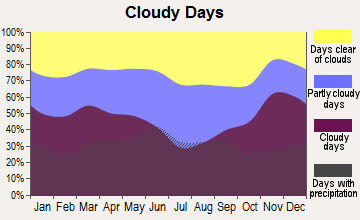


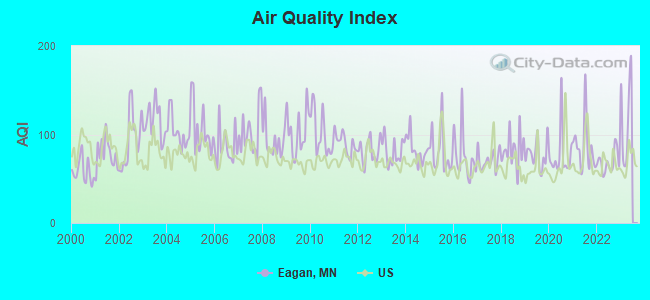
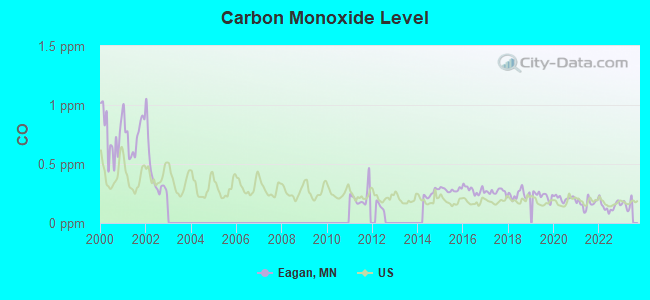
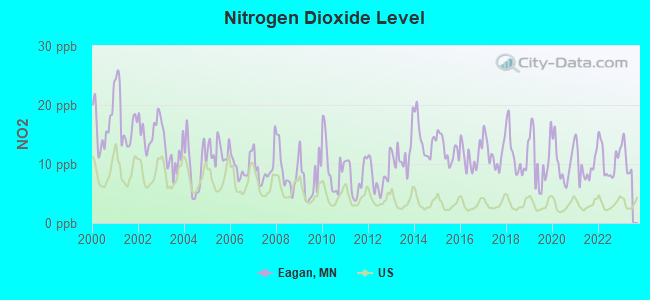
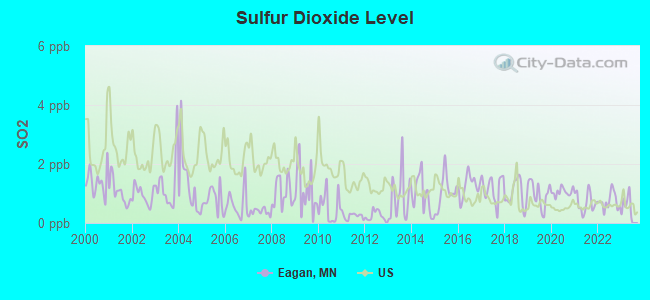
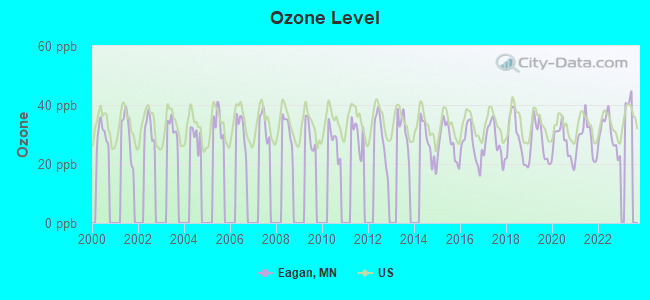
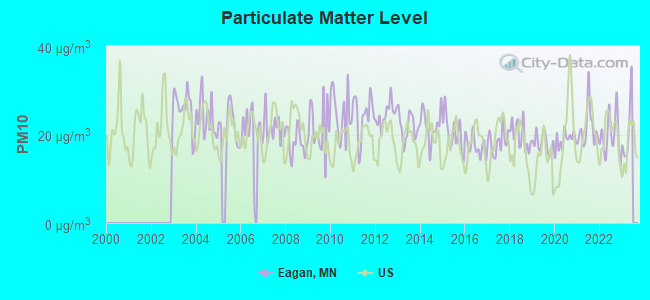
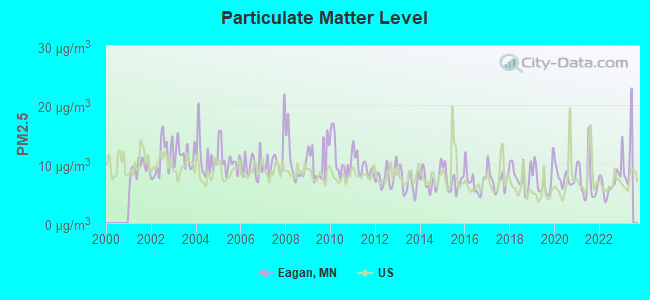
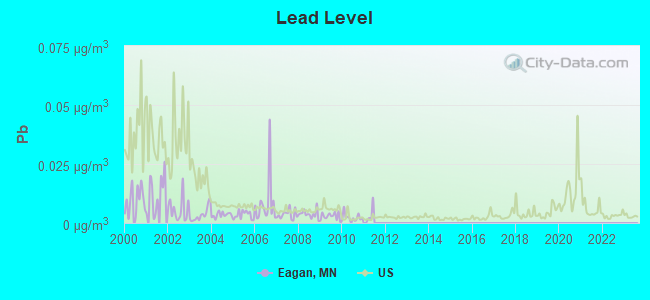
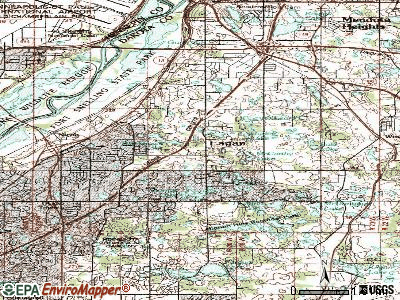
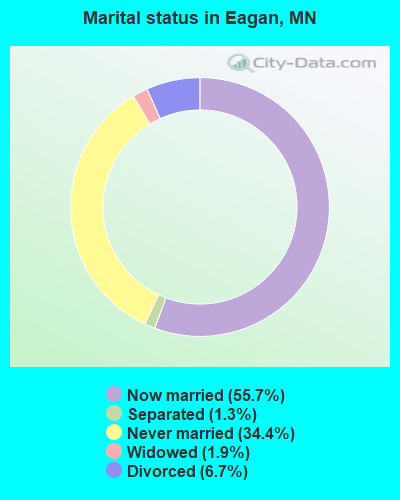
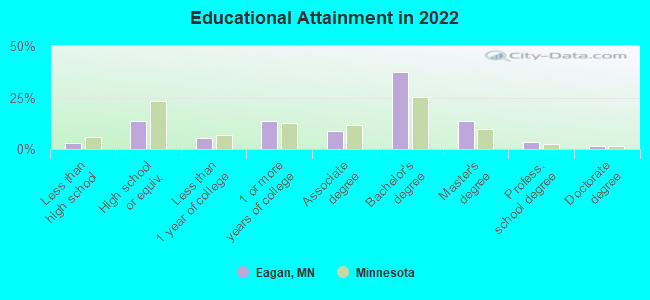
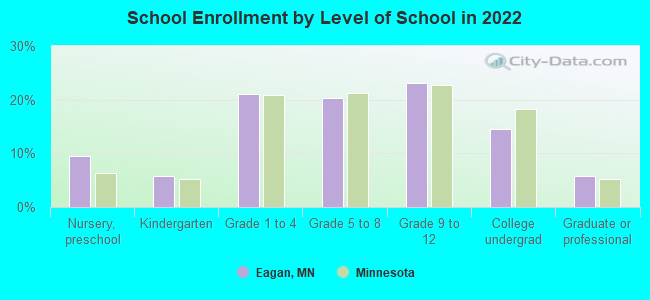
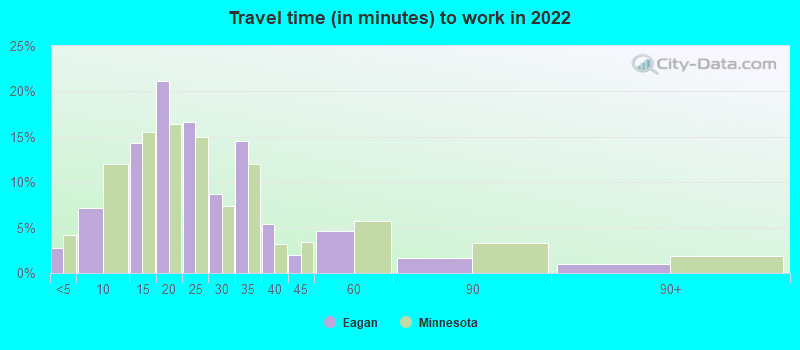
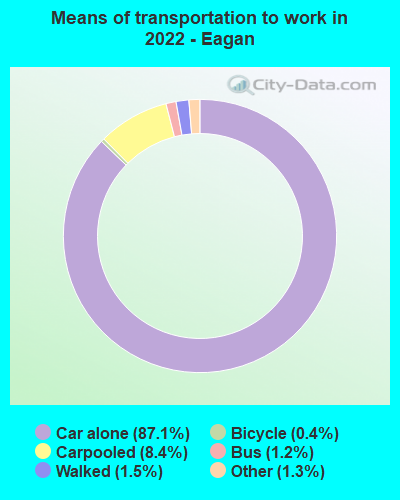
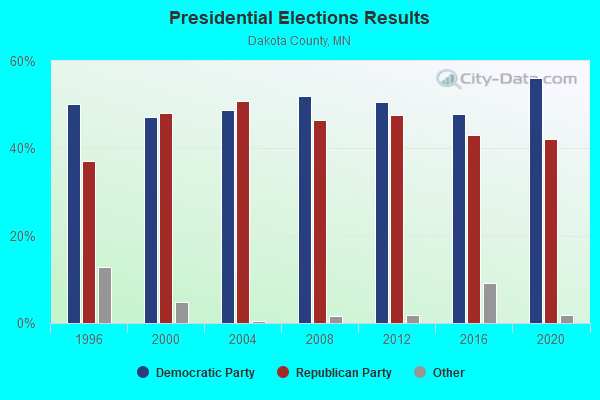
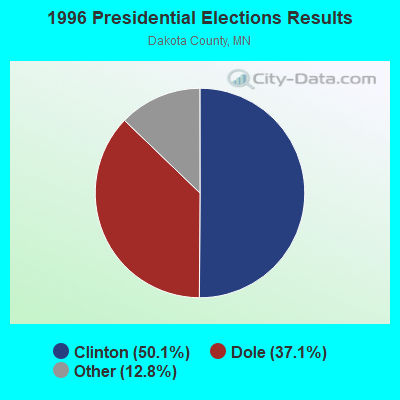
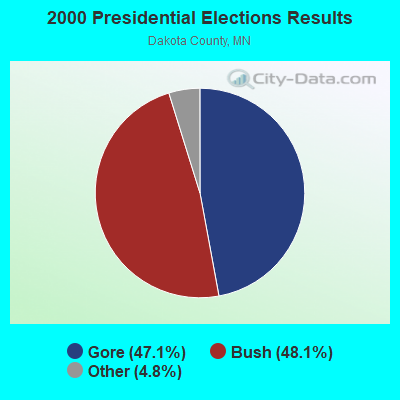
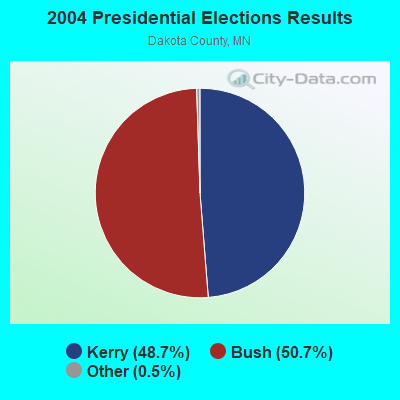
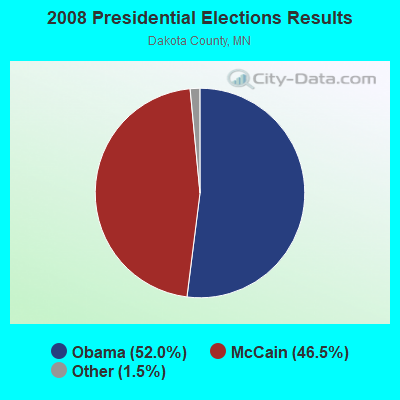
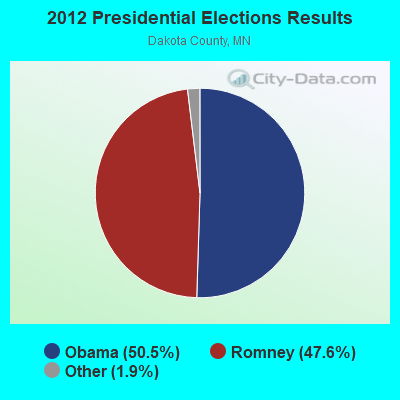
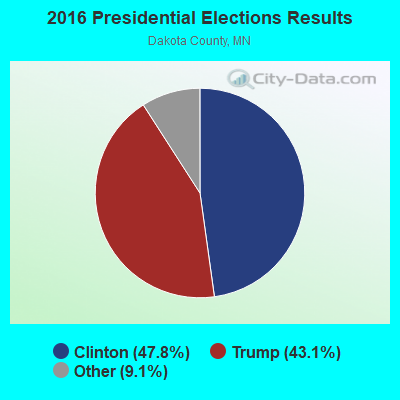
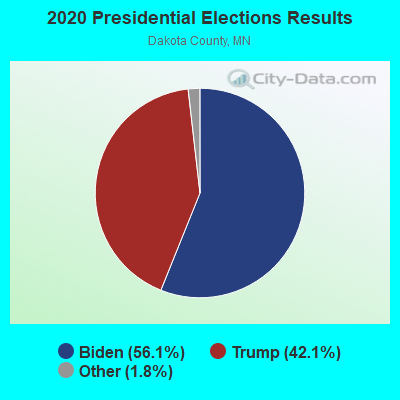
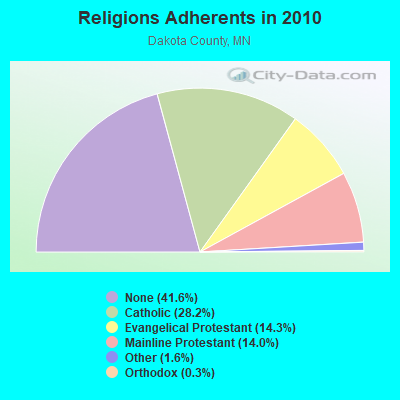
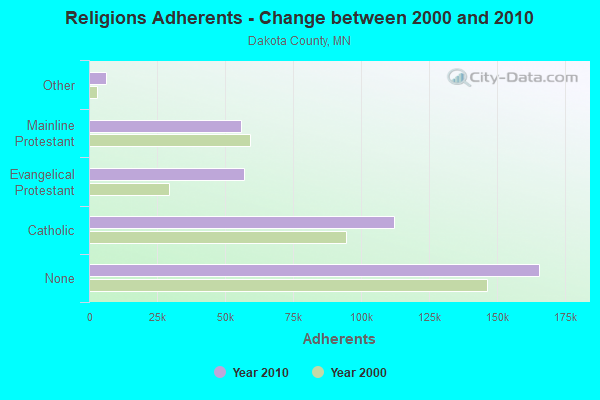
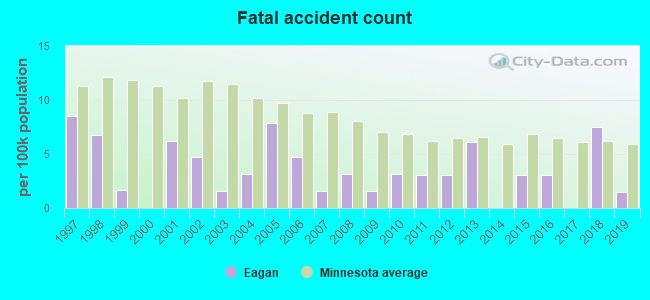
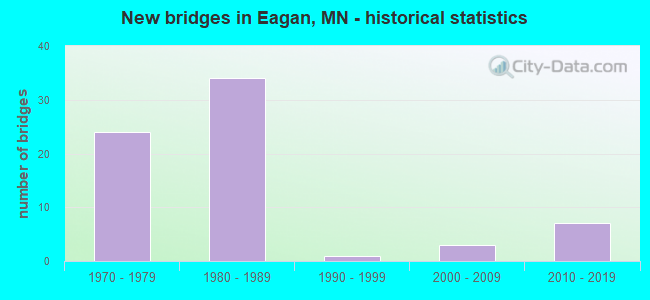
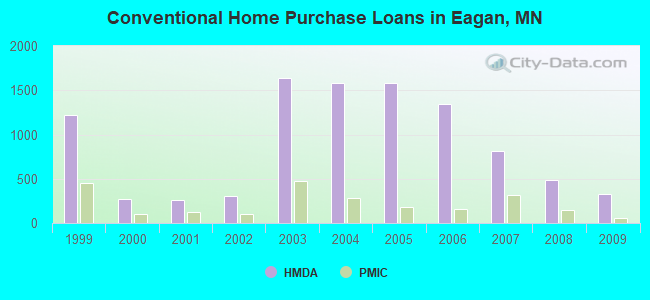
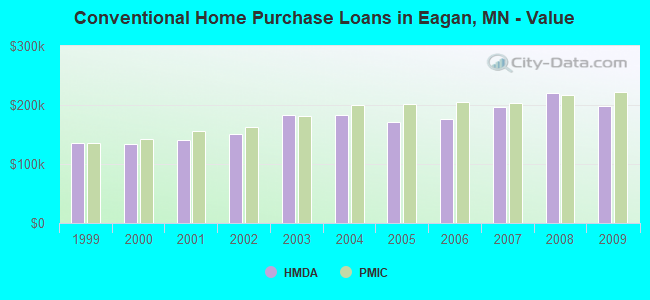
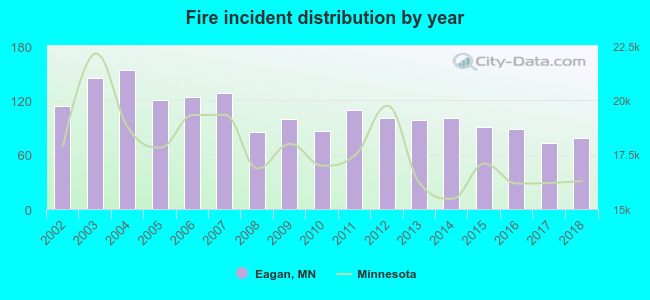 According to the data from the years 2002 - 2018 the average number of fires per year is 105. The highest number of reported fires - 153 took place in 2004, and the least - 73 in 2017. The data has a dropping trend.
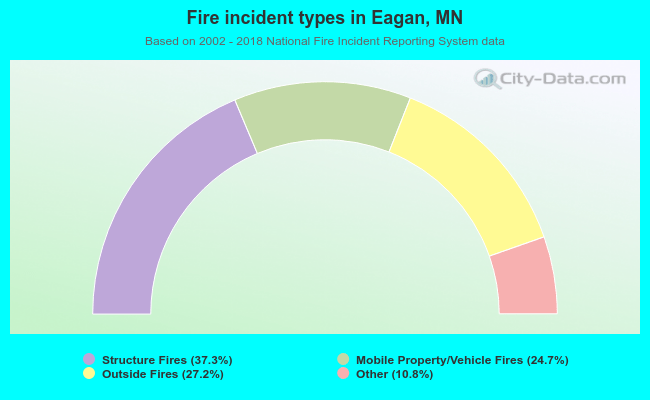 When looking into fire subcategories, the most reports belonged to: Structure Fires (37.3%), and Outside Fires (27.2%).