Burnsville, Minnesota Submit your own pictures of this city and show them to the world
OSM Map
General Map
Google Map
MSN Map
OSM Map
General Map
Google Map
MSN Map
OSM Map
General Map
Google Map
MSN Map
OSM Map
General Map
Google Map
MSN Map
Please wait while loading the map...
Population in 2022: 63,936 (100% urban, 0% rural). Population change since 2000: +6.2%Males: 31,238 Females: 32,698
March 2022 cost of living index in Burnsville: 114.3 (more than average, U.S. average is 100) Percentage of residents living in poverty in 2022: 8.0%for White Non-Hispanic residents , 14.2% for Black residents , 21.6% for Hispanic or Latino residents , 37.6% for American Indian residents , 14.8% for other race residents , 17.9% for two or more races residents )
Profiles of local businesses
Business Search - 14 Million verified businesses
Data:
Median household income ($)
Median household income (% change since 2000)
Household income diversity
Ratio of average income to average house value (%)
Ratio of average income to average rent
Median household income ($) - White
Median household income ($) - Black or African American
Median household income ($) - Asian
Median household income ($) - Hispanic or Latino
Median household income ($) - American Indian and Alaska Native
Median household income ($) - Multirace
Median household income ($) - Other Race
Median household income for houses/condos with a mortgage ($)
Median household income for apartments without a mortgage ($)
Races - White alone (%)
Races - White alone (% change since 2000)
Races - Black alone (%)
Races - Black alone (% change since 2000)
Races - American Indian alone (%)
Races - American Indian alone (% change since 2000)
Races - Asian alone (%)
Races - Asian alone (% change since 2000)
Races - Hispanic (%)
Races - Hispanic (% change since 2000)
Races - Native Hawaiian and Other Pacific Islander alone (%)
Races - Native Hawaiian and Other Pacific Islander alone (% change since 2000)
Races - Two or more races (%)
Races - Two or more races (% change since 2000)
Races - Other race alone (%)
Races - Other race alone (% change since 2000)
Racial diversity
Unemployment (%)
Unemployment (% change since 2000)
Unemployment (%) - White
Unemployment (%) - Black or African American
Unemployment (%) - Asian
Unemployment (%) - Hispanic or Latino
Unemployment (%) - American Indian and Alaska Native
Unemployment (%) - Multirace
Unemployment (%) - Other Race
Population density (people per square mile)
Population - Males (%)
Population - Females (%)
Population - Males (%) - White
Population - Males (%) - Black or African American
Population - Males (%) - Asian
Population - Males (%) - Hispanic or Latino
Population - Males (%) - American Indian and Alaska Native
Population - Males (%) - Multirace
Population - Males (%) - Other Race
Population - Females (%) - White
Population - Females (%) - Black or African American
Population - Females (%) - Asian
Population - Females (%) - Hispanic or Latino
Population - Females (%) - American Indian and Alaska Native
Population - Females (%) - Multirace
Population - Females (%) - Other Race
Coronavirus confirmed cases (Apr 27, 2024)
Deaths caused by coronavirus (Apr 27, 2024)
Coronavirus confirmed cases (per 100k population) (Apr 27, 2024)
Deaths caused by coronavirus (per 100k population) (Apr 27, 2024)
Daily increase in number of cases (Apr 27, 2024)
Weekly increase in number of cases (Apr 27, 2024)
Cases doubled (in days) (Apr 27, 2024)
Hospitalized patients (Apr 18, 2022)
Negative test results (Apr 18, 2022)
Total test results (Apr 18, 2022)
COVID Vaccine doses distributed (per 100k population) (Sep 19, 2023)
COVID Vaccine doses administered (per 100k population) (Sep 19, 2023)
COVID Vaccine doses distributed (Sep 19, 2023)
COVID Vaccine doses administered (Sep 19, 2023)
Likely homosexual households (%)
Likely homosexual households (% change since 2000)
Likely homosexual households - Lesbian couples (%)
Likely homosexual households - Lesbian couples (% change since 2000)
Likely homosexual households - Gay men (%)
Likely homosexual households - Gay men (% change since 2000)
Cost of living index
Median gross rent ($)
Median contract rent ($)
Median monthly housing costs ($)
Median house or condo value ($)
Median house or condo value ($ change since 2000)
Mean house or condo value by units in structure - 1, detached ($)
Mean house or condo value by units in structure - 1, attached ($)
Mean house or condo value by units in structure - 2 ($)
Mean house or condo value by units in structure by units in structure - 3 or 4 ($)
Mean house or condo value by units in structure - 5 or more ($)
Mean house or condo value by units in structure - Boat, RV, van, etc. ($)
Mean house or condo value by units in structure - Mobile home ($)
Median house or condo value ($) - White
Median house or condo value ($) - Black or African American
Median house or condo value ($) - Asian
Median house or condo value ($) - Hispanic or Latino
Median house or condo value ($) - American Indian and Alaska Native
Median house or condo value ($) - Multirace
Median house or condo value ($) - Other Race
Median resident age
Resident age diversity
Median resident age - Males
Median resident age - Females
Median resident age - White
Median resident age - Black or African American
Median resident age - Asian
Median resident age - Hispanic or Latino
Median resident age - American Indian and Alaska Native
Median resident age - Multirace
Median resident age - Other Race
Median resident age - Males - White
Median resident age - Males - Black or African American
Median resident age - Males - Asian
Median resident age - Males - Hispanic or Latino
Median resident age - Males - American Indian and Alaska Native
Median resident age - Males - Multirace
Median resident age - Males - Other Race
Median resident age - Females - White
Median resident age - Females - Black or African American
Median resident age - Females - Asian
Median resident age - Females - Hispanic or Latino
Median resident age - Females - American Indian and Alaska Native
Median resident age - Females - Multirace
Median resident age - Females - Other Race
Commute - mean travel time to work (minutes)
Travel time to work - Less than 5 minutes (%)
Travel time to work - Less than 5 minutes (% change since 2000)
Travel time to work - 5 to 9 minutes (%)
Travel time to work - 5 to 9 minutes (% change since 2000)
Travel time to work - 10 to 19 minutes (%)
Travel time to work - 10 to 19 minutes (% change since 2000)
Travel time to work - 20 to 29 minutes (%)
Travel time to work - 20 to 29 minutes (% change since 2000)
Travel time to work - 30 to 39 minutes (%)
Travel time to work - 30 to 39 minutes (% change since 2000)
Travel time to work - 40 to 59 minutes (%)
Travel time to work - 40 to 59 minutes (% change since 2000)
Travel time to work - 60 to 89 minutes (%)
Travel time to work - 60 to 89 minutes (% change since 2000)
Travel time to work - 90 or more minutes (%)
Travel time to work - 90 or more minutes (% change since 2000)
Marital status - Never married (%)
Marital status - Now married (%)
Marital status - Separated (%)
Marital status - Widowed (%)
Marital status - Divorced (%)
Median family income ($)
Median family income (% change since 2000)
Median non-family income ($)
Median non-family income (% change since 2000)
Median per capita income ($)
Median per capita income (% change since 2000)
Median family income ($) - White
Median family income ($) - Black or African American
Median family income ($) - Asian
Median family income ($) - Hispanic or Latino
Median family income ($) - American Indian and Alaska Native
Median family income ($) - Multirace
Median family income ($) - Other Race
Median year house/condo built
Median year apartment built
Year house built - Built 2005 or later (%)
Year house built - Built 2000 to 2004 (%)
Year house built - Built 1990 to 1999 (%)
Year house built - Built 1980 to 1989 (%)
Year house built - Built 1970 to 1979 (%)
Year house built - Built 1960 to 1969 (%)
Year house built - Built 1950 to 1959 (%)
Year house built - Built 1940 to 1949 (%)
Year house built - Built 1939 or earlier (%)
Average household size
Household density (households per square mile)
Average household size - White
Average household size - Black or African American
Average household size - Asian
Average household size - Hispanic or Latino
Average household size - American Indian and Alaska Native
Average household size - Multirace
Average household size - Other Race
Occupied housing units (%)
Vacant housing units (%)
Owner occupied housing units (%)
Renter occupied housing units (%)
Vacancy status - For rent (%)
Vacancy status - For sale only (%)
Vacancy status - Rented or sold, not occupied (%)
Vacancy status - For seasonal, recreational, or occasional use (%)
Vacancy status - For migrant workers (%)
Vacancy status - Other vacant (%)
Residents with income below the poverty level (%)
Residents with income below 50% of the poverty level (%)
Children below poverty level (%)
Poor families by family type - Married-couple family (%)
Poor families by family type - Male, no wife present (%)
Poor families by family type - Female, no husband present (%)
Poverty status for native-born residents (%)
Poverty status for foreign-born residents (%)
Poverty among high school graduates not in families (%)
Poverty among people who did not graduate high school not in families (%)
Residents with income below the poverty level (%) - White
Residents with income below the poverty level (%) - Black or African American
Residents with income below the poverty level (%) - Asian
Residents with income below the poverty level (%) - Hispanic or Latino
Residents with income below the poverty level (%) - American Indian and Alaska Native
Residents with income below the poverty level (%) - Multirace
Residents with income below the poverty level (%) - Other Race
Air pollution - Air Quality Index (AQI)
Air pollution - CO
Air pollution - NO2
Air pollution - SO2
Air pollution - Ozone
Air pollution - PM10
Air pollution - PM25
Air pollution - Pb
Crime - Murders per 100,000 population
Crime - Rapes per 100,000 population
Crime - Robberies per 100,000 population
Crime - Assaults per 100,000 population
Crime - Burglaries per 100,000 population
Crime - Thefts per 100,000 population
Crime - Auto thefts per 100,000 population
Crime - Arson per 100,000 population
Crime - City-data.com crime index
Crime - Violent crime index
Crime - Property crime index
Crime - Murders per 100,000 population (5 year average)
Crime - Rapes per 100,000 population (5 year average)
Crime - Robberies per 100,000 population (5 year average)
Crime - Assaults per 100,000 population (5 year average)
Crime - Burglaries per 100,000 population (5 year average)
Crime - Thefts per 100,000 population (5 year average)
Crime - Auto thefts per 100,000 population (5 year average)
Crime - Arson per 100,000 population (5 year average)
Crime - City-data.com crime index (5 year average)
Crime - Violent crime index (5 year average)
Crime - Property crime index (5 year average)
1996 Presidential Elections Results (%) - Democratic Party (Clinton)
1996 Presidential Elections Results (%) - Republican Party (Dole)
1996 Presidential Elections Results (%) - Other
2000 Presidential Elections Results (%) - Democratic Party (Gore)
2000 Presidential Elections Results (%) - Republican Party (Bush)
2000 Presidential Elections Results (%) - Other
2004 Presidential Elections Results (%) - Democratic Party (Kerry)
2004 Presidential Elections Results (%) - Republican Party (Bush)
2004 Presidential Elections Results (%) - Other
2008 Presidential Elections Results (%) - Democratic Party (Obama)
2008 Presidential Elections Results (%) - Republican Party (McCain)
2008 Presidential Elections Results (%) - Other
2012 Presidential Elections Results (%) - Democratic Party (Obama)
2012 Presidential Elections Results (%) - Republican Party (Romney)
2012 Presidential Elections Results (%) - Other
2016 Presidential Elections Results (%) - Democratic Party (Clinton)
2016 Presidential Elections Results (%) - Republican Party (Trump)
2016 Presidential Elections Results (%) - Other
2020 Presidential Elections Results (%) - Democratic Party (Biden)
2020 Presidential Elections Results (%) - Republican Party (Trump)
2020 Presidential Elections Results (%) - Other
Ancestries Reported - Arab (%)
Ancestries Reported - Czech (%)
Ancestries Reported - Danish (%)
Ancestries Reported - Dutch (%)
Ancestries Reported - English (%)
Ancestries Reported - French (%)
Ancestries Reported - French Canadian (%)
Ancestries Reported - German (%)
Ancestries Reported - Greek (%)
Ancestries Reported - Hungarian (%)
Ancestries Reported - Irish (%)
Ancestries Reported - Italian (%)
Ancestries Reported - Lithuanian (%)
Ancestries Reported - Norwegian (%)
Ancestries Reported - Polish (%)
Ancestries Reported - Portuguese (%)
Ancestries Reported - Russian (%)
Ancestries Reported - Scotch-Irish (%)
Ancestries Reported - Scottish (%)
Ancestries Reported - Slovak (%)
Ancestries Reported - Subsaharan African (%)
Ancestries Reported - Swedish (%)
Ancestries Reported - Swiss (%)
Ancestries Reported - Ukrainian (%)
Ancestries Reported - United States (%)
Ancestries Reported - Welsh (%)
Ancestries Reported - West Indian (%)
Ancestries Reported - Other (%)
Educational Attainment - No schooling completed (%)
Educational Attainment - Less than high school (%)
Educational Attainment - High school or equivalent (%)
Educational Attainment - Less than 1 year of college (%)
Educational Attainment - 1 or more years of college (%)
Educational Attainment - Associate degree (%)
Educational Attainment - Bachelor's degree (%)
Educational Attainment - Master's degree (%)
Educational Attainment - Professional school degree (%)
Educational Attainment - Doctorate degree (%)
School Enrollment - Nursery, preschool (%)
School Enrollment - Kindergarten (%)
School Enrollment - Grade 1 to 4 (%)
School Enrollment - Grade 5 to 8 (%)
School Enrollment - Grade 9 to 12 (%)
School Enrollment - College undergrad (%)
School Enrollment - Graduate or professional (%)
School Enrollment - Not enrolled in school (%)
School enrollment - Public schools (%)
School enrollment - Private schools (%)
School enrollment - Not enrolled (%)
Median number of rooms in houses and condos
Median number of rooms in apartments
Housing units lacking complete plumbing facilities (%)
Housing units lacking complete kitchen facilities (%)
Density of houses
Urban houses (%)
Rural houses (%)
Households with people 60 years and over (%)
Households with people 65 years and over (%)
Households with people 75 years and over (%)
Households with one or more nonrelatives (%)
Households with no nonrelatives (%)
Population in households (%)
Family households (%)
Nonfamily households (%)
Population in families (%)
Family households with own children (%)
Median number of bedrooms in owner occupied houses
Mean number of bedrooms in owner occupied houses
Median number of bedrooms in renter occupied houses
Mean number of bedrooms in renter occupied houses
Median number of vehichles in owner occupied houses
Mean number of vehichles in owner occupied houses
Median number of vehichles in renter occupied houses
Mean number of vehichles in renter occupied houses
Mortgage status - with mortgage (%)
Mortgage status - with second mortgage (%)
Mortgage status - with home equity loan (%)
Mortgage status - with both second mortgage and home equity loan (%)
Mortgage status - without a mortgage (%)
Average family size
Average family size - White
Average family size - Black or African American
Average family size - Asian
Average family size - Hispanic or Latino
Average family size - American Indian and Alaska Native
Average family size - Multirace
Average family size - Other Race
Geographical mobility - Same house 1 year ago (%)
Geographical mobility - Moved within same county (%)
Geographical mobility - Moved from different county within same state (%)
Geographical mobility - Moved from different state (%)
Geographical mobility - Moved from abroad (%)
Place of birth - Born in state of residence (%)
Place of birth - Born in other state (%)
Place of birth - Native, outside of US (%)
Place of birth - Foreign born (%)
Housing units in structures - 1, detached (%)
Housing units in structures - 1, attached (%)
Housing units in structures - 2 (%)
Housing units in structures - 3 or 4 (%)
Housing units in structures - 5 to 9 (%)
Housing units in structures - 10 to 19 (%)
Housing units in structures - 20 to 49 (%)
Housing units in structures - 50 or more (%)
Housing units in structures - Mobile home (%)
Housing units in structures - Boat, RV, van, etc. (%)
House/condo owner moved in on average (years ago)
Renter moved in on average (years ago)
Year householder moved into unit - Moved in 1999 to March 2000 (%)
Year householder moved into unit - Moved in 1995 to 1998 (%)
Year householder moved into unit - Moved in 1990 to 1994 (%)
Year householder moved into unit - Moved in 1980 to 1989 (%)
Year householder moved into unit - Moved in 1970 to 1979 (%)
Year householder moved into unit - Moved in 1969 or earlier (%)
Means of transportation to work - Drove car alone (%)
Means of transportation to work - Carpooled (%)
Means of transportation to work - Public transportation (%)
Means of transportation to work - Bus or trolley bus (%)
Means of transportation to work - Streetcar or trolley car (%)
Means of transportation to work - Subway or elevated (%)
Means of transportation to work - Railroad (%)
Means of transportation to work - Ferryboat (%)
Means of transportation to work - Taxicab (%)
Means of transportation to work - Motorcycle (%)
Means of transportation to work - Bicycle (%)
Means of transportation to work - Walked (%)
Means of transportation to work - Other means (%)
Working at home (%)
Industry diversity
Most Common Industries - Agriculture, forestry, fishing and hunting, and mining (%)
Most Common Industries - Agriculture, forestry, fishing and hunting (%)
Most Common Industries - Mining, quarrying, and oil and gas extraction (%)
Most Common Industries - Construction (%)
Most Common Industries - Manufacturing (%)
Most Common Industries - Wholesale trade (%)
Most Common Industries - Retail trade (%)
Most Common Industries - Transportation and warehousing, and utilities (%)
Most Common Industries - Transportation and warehousing (%)
Most Common Industries - Utilities (%)
Most Common Industries - Information (%)
Most Common Industries - Finance and insurance, and real estate and rental and leasing (%)
Most Common Industries - Finance and insurance (%)
Most Common Industries - Real estate and rental and leasing (%)
Most Common Industries - Professional, scientific, and management, and administrative and waste management services (%)
Most Common Industries - Professional, scientific, and technical services (%)
Most Common Industries - Management of companies and enterprises (%)
Most Common Industries - Administrative and support and waste management services (%)
Most Common Industries - Educational services, and health care and social assistance (%)
Most Common Industries - Educational services (%)
Most Common Industries - Health care and social assistance (%)
Most Common Industries - Arts, entertainment, and recreation, and accommodation and food services (%)
Most Common Industries - Arts, entertainment, and recreation (%)
Most Common Industries - Accommodation and food services (%)
Most Common Industries - Other services, except public administration (%)
Most Common Industries - Public administration (%)
Occupation diversity
Most Common Occupations - Management, business, science, and arts occupations (%)
Most Common Occupations - Management, business, and financial occupations (%)
Most Common Occupations - Management occupations (%)
Most Common Occupations - Business and financial operations occupations (%)
Most Common Occupations - Computer, engineering, and science occupations (%)
Most Common Occupations - Computer and mathematical occupations (%)
Most Common Occupations - Architecture and engineering occupations (%)
Most Common Occupations - Life, physical, and social science occupations (%)
Most Common Occupations - Education, legal, community service, arts, and media occupations (%)
Most Common Occupations - Community and social service occupations (%)
Most Common Occupations - Legal occupations (%)
Most Common Occupations - Education, training, and library occupations (%)
Most Common Occupations - Arts, design, entertainment, sports, and media occupations (%)
Most Common Occupations - Healthcare practitioners and technical occupations (%)
Most Common Occupations - Health diagnosing and treating practitioners and other technical occupations (%)
Most Common Occupations - Health technologists and technicians (%)
Most Common Occupations - Service occupations (%)
Most Common Occupations - Healthcare support occupations (%)
Most Common Occupations - Protective service occupations (%)
Most Common Occupations - Fire fighting and prevention, and other protective service workers including supervisors (%)
Most Common Occupations - Law enforcement workers including supervisors (%)
Most Common Occupations - Food preparation and serving related occupations (%)
Most Common Occupations - Building and grounds cleaning and maintenance occupations (%)
Most Common Occupations - Personal care and service occupations (%)
Most Common Occupations - Sales and office occupations (%)
Most Common Occupations - Sales and related occupations (%)
Most Common Occupations - Office and administrative support occupations (%)
Most Common Occupations - Natural resources, construction, and maintenance occupations (%)
Most Common Occupations - Farming, fishing, and forestry occupations (%)
Most Common Occupations - Construction and extraction occupations (%)
Most Common Occupations - Installation, maintenance, and repair occupations (%)
Most Common Occupations - Production, transportation, and material moving occupations (%)
Most Common Occupations - Production occupations (%)
Most Common Occupations - Transportation occupations (%)
Most Common Occupations - Material moving occupations (%)
People in Group quarters - Institutionalized population (%)
People in Group quarters - Correctional institutions (%)
People in Group quarters - Federal prisons and detention centers (%)
People in Group quarters - Halfway houses (%)
People in Group quarters - Local jails and other confinement facilities (including police lockups) (%)
People in Group quarters - Military disciplinary barracks (%)
People in Group quarters - State prisons (%)
People in Group quarters - Other types of correctional institutions (%)
People in Group quarters - Nursing homes (%)
People in Group quarters - Hospitals/wards, hospices, and schools for the handicapped (%)
People in Group quarters - Hospitals/wards and hospices for chronically ill (%)
People in Group quarters - Hospices or homes for chronically ill (%)
People in Group quarters - Military hospitals or wards for chronically ill (%)
People in Group quarters - Other hospitals or wards for chronically ill (%)
People in Group quarters - Hospitals or wards for drug/alcohol abuse (%)
People in Group quarters - Mental (Psychiatric) hospitals or wards (%)
People in Group quarters - Schools, hospitals, or wards for the mentally retarded (%)
People in Group quarters - Schools, hospitals, or wards for the physically handicapped (%)
People in Group quarters - Institutions for the deaf (%)
People in Group quarters - Institutions for the blind (%)
People in Group quarters - Orthopedic wards and institutions for the physically handicapped (%)
People in Group quarters - Wards in general hospitals for patients who have no usual home elsewhere (%)
People in Group quarters - Wards in military hospitals for patients who have no usual home elsewhere (%)
People in Group quarters - Juvenile institutions (%)
People in Group quarters - Long-term care (%)
People in Group quarters - Homes for abused, dependent, and neglected children (%)
People in Group quarters - Residential treatment centers for emotionally disturbed children (%)
People in Group quarters - Training schools for juvenile delinquents (%)
People in Group quarters - Short-term care, detention or diagnostic centers for delinquent children (%)
People in Group quarters - Type of juvenile institution unknown (%)
People in Group quarters - Noninstitutionalized population (%)
People in Group quarters - College dormitories (includes college quarters off campus) (%)
People in Group quarters - Military quarters (%)
People in Group quarters - On base (%)
People in Group quarters - Barracks, unaccompanied personnel housing (UPH), (Enlisted/Officer), ;and similar group living quarters for military personnel (%)
People in Group quarters - Transient quarters for temporary residents (%)
People in Group quarters - Military ships (%)
People in Group quarters - Group homes (%)
People in Group quarters - Homes or halfway houses for drug/alcohol abuse (%)
People in Group quarters - Homes for the mentally ill (%)
People in Group quarters - Homes for the mentally retarded (%)
People in Group quarters - Homes for the physically handicapped (%)
People in Group quarters - Other group homes (%)
People in Group quarters - Religious group quarters (%)
People in Group quarters - Dormitories (%)
People in Group quarters - Agriculture workers' dormitories on farms (%)
People in Group quarters - Job Corps and vocational training facilities (%)
People in Group quarters - Other workers' dormitories (%)
People in Group quarters - Crews of maritime vessels (%)
People in Group quarters - Other nonhousehold living situations (%)
People in Group quarters - Other noninstitutional group quarters (%)
Residents speaking English at home (%)
Residents speaking English at home - Born in the United States (%)
Residents speaking English at home - Native, born elsewhere (%)
Residents speaking English at home - Foreign born (%)
Residents speaking Spanish at home (%)
Residents speaking Spanish at home - Born in the United States (%)
Residents speaking Spanish at home - Native, born elsewhere (%)
Residents speaking Spanish at home - Foreign born (%)
Residents speaking other language at home (%)
Residents speaking other language at home - Born in the United States (%)
Residents speaking other language at home - Native, born elsewhere (%)
Residents speaking other language at home - Foreign born (%)
Class of Workers - Employee of private company (%)
Class of Workers - Self-employed in own incorporated business (%)
Class of Workers - Private not-for-profit wage and salary workers (%)
Class of Workers - Local government workers (%)
Class of Workers - State government workers (%)
Class of Workers - Federal government workers (%)
Class of Workers - Self-employed workers in own not incorporated business and Unpaid family workers (%)
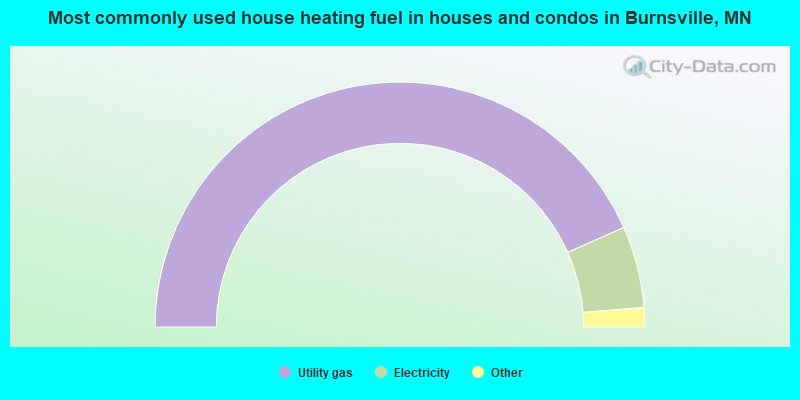
House heating fuel used in houses and condos - Utility gas (%)
House heating fuel used in houses and condos - Bottled, tank, or LP gas (%)
House heating fuel used in houses and condos - Electricity (%)
House heating fuel used in houses and condos - Fuel oil, kerosene, etc. (%)
House heating fuel used in houses and condos - Coal or coke (%)
House heating fuel used in houses and condos - Wood (%)
House heating fuel used in houses and condos - Solar energy (%)
House heating fuel used in houses and condos - Other fuel (%)
House heating fuel used in houses and condos - No fuel used (%)
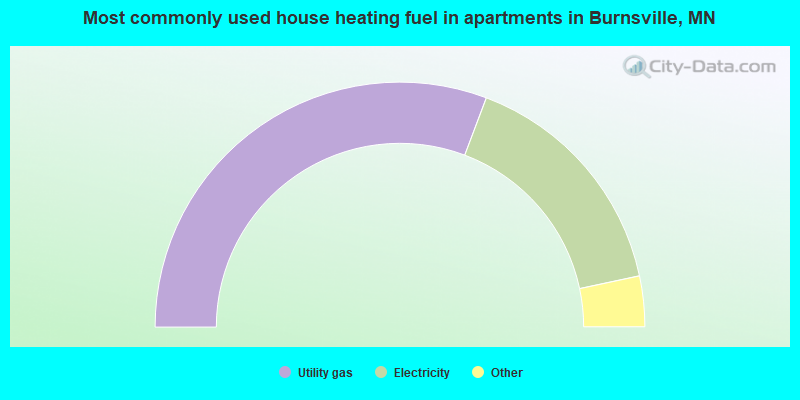
House heating fuel used in apartments - Utility gas (%)
House heating fuel used in apartments - Bottled, tank, or LP gas (%)
House heating fuel used in apartments - Electricity (%)
House heating fuel used in apartments - Fuel oil, kerosene, etc. (%)
House heating fuel used in apartments - Coal or coke (%)
House heating fuel used in apartments - Wood (%)
House heating fuel used in apartments - Solar energy (%)
House heating fuel used in apartments - Other fuel (%)
House heating fuel used in apartments - No fuel used (%)
Armed forces status - In Armed Forces (%)
Armed forces status - Civilian (%)
Armed forces status - Civilian - Veteran (%)
Armed forces status - Civilian - Nonveteran (%)
Fatal accidents locations in years 2005-2021
Fatal accidents locations in 2005
Fatal accidents locations in 2006
Fatal accidents locations in 2007
Fatal accidents locations in 2008
Fatal accidents locations in 2009
Fatal accidents locations in 2010
Fatal accidents locations in 2011
Fatal accidents locations in 2012
Fatal accidents locations in 2013
Fatal accidents locations in 2014
Fatal accidents locations in 2015
Fatal accidents locations in 2016
Fatal accidents locations in 2017
Fatal accidents locations in 2018
Fatal accidents locations in 2019
Fatal accidents locations in 2020
Fatal accidents locations in 2021
Alcohol use - People drinking some alcohol every month (%)
Alcohol use - People not drinking at all (%)
Alcohol use - Average days/month drinking alcohol
Alcohol use - Average drinks/week
Alcohol use - Average days/year people drink much
Audiometry - Average condition of hearing (%)
Audiometry - People that can hear a whisper from across a quiet room (%)
Audiometry - People that can hear normal voice from across a quiet room (%)
Audiometry - Ears ringing, roaring, buzzing (%)
Audiometry - Had a job exposure to loud noise (%)
Audiometry - Had off-work exposure to loud noise (%)
Blood Pressure & Cholesterol - Has high blood pressure (%)
Blood Pressure & Cholesterol - Checking blood pressure at home (%)
Blood Pressure & Cholesterol - Frequently checking blood cholesterol (%)
Blood Pressure & Cholesterol - Has high cholesterol level (%)
Consumer Behavior - Money monthly spent on food at supermarket/grocery store
Consumer Behavior - Money monthly spent on food at other stores
Consumer Behavior - Money monthly spent on eating out
Consumer Behavior - Money monthly spent on carryout/delivered foods
Consumer Behavior - Income spent on food at supermarket/grocery store (%)
Consumer Behavior - Income spent on food at other stores (%)
Consumer Behavior - Income spent on eating out (%)
Consumer Behavior - Income spent on carryout/delivered foods (%)
Current Health Status - General health condition (%)
Current Health Status - Blood donors (%)
Current Health Status - Has blood ever tested for HIV virus (%)
Current Health Status - Left-handed people (%)
Dermatology - People using sunscreen (%)
Diabetes - Diabetics (%)
Diabetes - Had a blood test for high blood sugar (%)
Diabetes - People taking insulin (%)
Diet Behavior & Nutrition - Diet health (%)
Diet Behavior & Nutrition - Milk product consumption (# of products/month)
Diet Behavior & Nutrition - Meals not home prepared (#/week)
Diet Behavior & Nutrition - Meals from fast food or pizza place (#/week)
Diet Behavior & Nutrition - Ready-to-eat foods (#/month)
Diet Behavior & Nutrition - Frozen meals/pizza (#/month)
Drug Use - People that ever used marijuana or hashish (%)
Drug Use - Ever used hard drugs (%)
Drug Use - Ever used any form of cocaine (%)
Drug Use - Ever used heroin (%)
Drug Use - Ever used methamphetamine (%)
Health Insurance - People covered by health insurance (%)
Kidney Conditions-Urology - Avg. # of times urinating at night
Medical Conditions - People with asthma (%)
Medical Conditions - People with anemia (%)
Medical Conditions - People with psoriasis (%)
Medical Conditions - People with overweight (%)
Medical Conditions - Elderly people having difficulties in thinking or remembering (%)
Medical Conditions - People who ever received blood transfusion (%)
Medical Conditions - People having trouble seeing even with glass/contacts (%)
Medical Conditions - People with arthritis (%)
Medical Conditions - People with gout (%)
Medical Conditions - People with congestive heart failure (%)
Medical Conditions - People with coronary heart disease (%)
Medical Conditions - People with angina pectoris (%)
Medical Conditions - People who ever had heart attack (%)
Medical Conditions - People who ever had stroke (%)
Medical Conditions - People with emphysema (%)
Medical Conditions - People with thyroid problem (%)
Medical Conditions - People with chronic bronchitis (%)
Medical Conditions - People with any liver condition (%)
Medical Conditions - People who ever had cancer or malignancy (%)
Mental Health - People who have little interest in doing things (%)
Mental Health - People feeling down, depressed, or hopeless (%)
Mental Health - People who have trouble sleeping or sleeping too much (%)
Mental Health - People feeling tired or having little energy (%)
Mental Health - People with poor appetite or overeating (%)
Mental Health - People feeling bad about themself (%)
Mental Health - People who have trouble concentrating on things (%)
Mental Health - People moving or speaking slowly or too fast (%)
Mental Health - People having thoughts they would be better off dead (%)
Oral Health - Average years since last visit a dentist
Oral Health - People embarrassed because of mouth (%)
Oral Health - People with gum disease (%)
Oral Health - General health of teeth and gums (%)
Oral Health - Average days a week using dental floss/device
Oral Health - Average days a week using mouthwash for dental problem
Oral Health - Average number of teeth
Pesticide Use - Households using pesticides to control insects (%)
Pesticide Use - Households using pesticides to kill weeds (%)
Physical Activity - People doing vigorous-intensity work activities (%)
Physical Activity - People doing moderate-intensity work activities (%)
Physical Activity - People walking or bicycling (%)
Physical Activity - People doing vigorous-intensity recreational activities (%)
Physical Activity - People doing moderate-intensity recreational activities (%)
Physical Activity - Average hours a day doing sedentary activities
Physical Activity - Average hours a day watching TV or videos
Physical Activity - Average hours a day using computer
Physical Functioning - People having limitations keeping them from working (%)
Physical Functioning - People limited in amount of work they can do (%)
Physical Functioning - People that need special equipment to walk (%)
Physical Functioning - People experiencing confusion/memory problems (%)
Physical Functioning - People requiring special healthcare equipment (%)
Prescription Medications - Average number of prescription medicines taking
Preventive Aspirin Use - Adults 40+ taking low-dose aspirin (%)
Reproductive Health - Vaginal deliveries (%)
Reproductive Health - Cesarean deliveries (%)
Reproductive Health - Deliveries resulted in a live birth (%)
Reproductive Health - Pregnancies resulted in a delivery (%)
Reproductive Health - Women breastfeeding newborns (%)
Reproductive Health - Women that had a hysterectomy (%)
Reproductive Health - Women that had both ovaries removed (%)
Reproductive Health - Women that have ever taken birth control pills (%)
Reproductive Health - Women taking birth control pills (%)
Reproductive Health - Women that have ever used Depo-Provera or injectables (%)
Reproductive Health - Women that have ever used female hormones (%)
Sexual Behavior - People 18+ that ever had sex (vaginal, anal, or oral) (%)
Sexual Behavior - Males 18+ that ever had vaginal sex with a woman (%)
Sexual Behavior - Males 18+ that ever performed oral sex on a woman (%)
Sexual Behavior - Males 18+ that ever had anal sex with a woman (%)
Sexual Behavior - Males 18+ that ever had any sex with a man (%)
Sexual Behavior - Females 18+ that ever had vaginal sex with a man (%)
Sexual Behavior - Females 18+ that ever performed oral sex on a man (%)
Sexual Behavior - Females 18+ that ever had anal sex with a man (%)
Sexual Behavior - Females 18+ that ever had any kind of sex with a woman (%)
Sexual Behavior - Average age people first had sex
Sexual Behavior - Average number of female sex partners in lifetime (males 18+)
Sexual Behavior - Average number of female vaginal sex partners in lifetime (males 18+)
Sexual Behavior - Average age people first performed oral sex on a woman (18+)
Sexual Behavior - Average number of woman performed oral sex on in lifetime (18+)
Sexual Behavior - Average number of male sex partners in lifetime (males 18+)
Sexual Behavior - Average number of male anal sex partners in lifetime (males 18+)
Sexual Behavior - Average age people first performed oral sex on a man (18+)
Sexual Behavior - Average number of male oral sex partners in lifetime (18+)
Sexual Behavior - People using protection when performing oral sex (%)
Sexual Behavior - Average number of times people have vaginal or anal sex a year
Sexual Behavior - People having sex without condom (%)
Sexual Behavior - Average number of male sex partners in lifetime (females 18+)
Sexual Behavior - Average number of male vaginal sex partners in lifetime (females 18+)
Sexual Behavior - Average number of female sex partners in lifetime (females 18+)
Sexual Behavior - Circumcised males 18+ (%)
Sleep Disorders - Average hours sleeping at night
Sleep Disorders - People that has trouble sleeping (%)
Smoking-Cigarette Use - People smoking cigarettes (%)
Taste & Smell - People 40+ having problems with smell (%)
Taste & Smell - People 40+ having problems with taste (%)
Taste & Smell - People 40+ that ever had wisdom teeth removed (%)
Taste & Smell - People 40+ that ever had tonsils teeth removed (%)
Taste & Smell - People 40+ that ever had a loss of consciousness because of a head injury (%)
Taste & Smell - People 40+ that ever had a broken nose or other serious injury to face or skull (%)
Taste & Smell - People 40+ that ever had two or more sinus infections (%)
Weight - Average height (inches)
Weight - Average weight (pounds)
Weight - Average BMI
Weight - People that are obese (%)
Weight - People that ever were obese (%)
Weight - People trying to lose weight (%)
According to our research of Minnesota and other state lists, there was 1 registered sex offender living in Burnsville, Minnesota as of April 27, 2024 . The ratio of all residents to sex offenders in Burnsville is 62,062 to 1.The ratio of registered sex offenders to all residents in this city is much lower than the state average.
The City-Data.com crime index weighs serious crimes and violent crimes more heavily. Higher means more crime, U.S. average is 246.1. It adjusts for the number of visitors and daily workers commuting into cities.
- means the value is smaller than the state average.
- means the value is about the same as the state average.
- means the value is bigger than the state average.
- means the value is much bigger than the state average.
Crime rate in Burnsville detailed stats: murders, rapes, robberies, assaults, burglaries, thefts, arson Officers per 1,000 residents here:
1.22Minnesota average:
1.76
Latest news from Burnsville, MN collected exclusively by city-data.com from local newspapers, TV, and radio stations
Burnsville, MN City Guides: Ancestries: German (15.7%), Norwegian (5.0%), Somali (4.5%), Irish (3.3%), European (3.3%), American (2.7%).
Current Local Time:
Land area: 24.9 square miles.
Population density: 2,570 people per square mile (average).
9,470 residents are foreign born (4.6% Asia , 4.4% Latin America , 4.3% Africa ).
This city:
14.6%Minnesota:
8.5%
Median real estate property taxes paid for housing units with mortgages in 2022: $3,192 (0.9%)Median real estate property taxes paid for housing units with no mortgage in 2022: $3,234 (1.0%)
Nearest city with pop. 200,000+: Minneapolis, MN
Nearest city with pop. 1,000,000+: Chicago, IL
Nearest cities:
Latitude: 44.76 N, Longitude: 93.28 W
Daytime population change due to commuting: +1,139 (+1.8%)Workers who live and work in this city: 12,614 (36.3%)
Burnsville tourist attractions:
Single-family new house construction building permits:
2022: 20 buildings , average cost: $270,7002021: 31 buildings , average cost: $176,5002020: 4 buildings , average cost: $271,8002019: 17 buildings , average cost: $207,4002018: 22 buildings , average cost: $196,3002017: 18 buildings , average cost: $224,0002016: 26 buildings , average cost: $254,7002015: 49 buildings , average cost: $219,6002014: 34 buildings , average cost: $238,8002013: 16 buildings , average cost: $263,8002012: 5 buildings , average cost: $338,8002011: 10 buildings , average cost: $244,6002010: 6 buildings , average cost: $231,0002009: 5 buildings , average cost: $147,1002008: 12 buildings , average cost: $334,7002007: 34 buildings , average cost: $232,3002006: 20 buildings , average cost: $247,3002005: 53 buildings , average cost: $276,7002004: 58 buildings , average cost: $327,7002003: 64 buildings , average cost: $194,7002002: 120 buildings , average cost: $134,9002001: 128 buildings , average cost: $159,1002000: 118 buildings , average cost: $155,7001999: 113 buildings , average cost: $138,0001998: 90 buildings , average cost: $139,7001997: 383 buildings , average cost: $103,100Unemployment in December 2023:
Population change in the 1990s: +8,430 (+16.3%).
Most common occupations in Burnsville, MN (%)
Both Males Females
Cooks and food preparation workers (6.2%)
Computer specialists (5.2%)
Other management occupations, except farmers and farm managers (3.4%)
Retail sales workers, except cashiers (3.4%)
Registered nurses (2.8%)
Other office and administrative support workers, including supervisors (2.5%)
Building and grounds cleaning and maintenance occupations (2.4%)
Computer specialists (7.5%)
Cooks and food preparation workers (6.0%)
Retail sales workers, except cashiers (3.6%)
Driver/sales workers and truck drivers (3.3%)
Building and grounds cleaning and maintenance occupations (3.1%)
Other management occupations, except farmers and farm managers (3.1%)
Electrical equipment mechanics and other installation, maintenance, and repair workers, including supervisors (2.8%)
Cooks and food preparation workers (6.5%)
Registered nurses (4.8%)
Other office and administrative support workers, including supervisors (3.9%)
Personal appearance workers (3.8%)
Secretaries and administrative assistants (3.8%)
Other management occupations, except farmers and farm managers (3.7%)
Waiters and waitresses (3.4%)
Tornado activity:
Burnsville-area historical tornado activity is slightly above Minnesota state average. It is 34% greater than the overall U.S. average.
On 5/6/1965, a category F4 (max. wind speeds 207-260 mph) tornado 13.8 miles away from the Burnsville city center caused between $5,000,000 and $50,000,000 in damages.
On 5/6/1965, a category F4 tornado 16.2 miles away from the city center killed 6 people and injured 158 people and caused between $5,000,000 and $50,000,000 in damages.
Earthquake activity:
Burnsville-area historical earthquake activity is significantly above Minnesota state average. It is 56% smaller than the overall U.S. average. On 7/9/1975 at 14:54:15, a magnitude 4.6 (4.6 MB, Class: Light, Intensity: IV - V) earthquake occurred 148.6 miles away from the city center On 6/5/1993 at 01:24:53, a magnitude 4.1 (4.1 LG, Depth: 6.2 mi) earthquake occurred 159.9 miles away from Burnsville center On 3/4/1983 at 06:32:18, a magnitude 4.6 (4.4 MB, 4.6 LG, 4.4 ML) earthquake occurred 304.6 miles away from Burnsville center On 10/20/1995 at 15:57:18, a magnitude 3.7 (3.7 LG, Depth: 3.1 mi, Class: Light, Intensity: II - III) earthquake occurred 188.4 miles away from Burnsville center On 2/9/1994 at 08:45:35, a magnitude 3.1 (3.1 LG, Depth: 3.1 mi) earthquake occurred 85.9 miles away from the city center On 11/3/2002 at 20:41:56, a magnitude 4.3 (4.3 MB, Depth: 3.1 mi) earthquake occurred 312.3 miles away from the city center Magnitude types: regional Lg-wave magnitude (LG), body-wave magnitude (MB), local magnitude (ML) Natural disasters: The number of natural disasters in Dakota County (15) is near the US average (15).Major Disasters (Presidential) Declared: 11Emergencies Declared: 3Floods: 11, Storms: 7, Tornadoes: 5, Drought: 1, Hurricane: 1, Wind: 1, Other: 1 (Note: some incidents may be assigned to more than one category). Main business address for: TELEX COMMUNICATIONS INC TELEPHONE & TELEGRAPH APPARATUS ), TELEX COMMUNICATIONS INC TELEPHONE & TELEGRAPH APPARATUS ), TELEX COMMUNICATIONS INC TELEPHONE & TELEGRAPH APPARATUS ).
Hospitals and medical centers in Burnsville: DCI KENNELLY (12000 KENNELLY ROAD) FAIRVIEW RIDGES HOSPITAL (Voluntary non-profit - Church, provides emergency services, 201 EAST NICOLLET BOULEVARD) EBENEZER RIDGES GERIATRIC CARE CENTER (13820 COMMUNITY DRIVE)
BURNSVILLE DIALYSIS OF DAVITA (501 E NICOLLET BLVD)
Amtrak station near Burnsville: 16 miles: ST. PAUL/MINNEAPOLIS (ST. PAUL, 730 TRANSFER RD.) Services: ticket office, fully wheelchair accessible, enclosed waiting area, public restrooms, public payphones, vending machines, free short-term parking, free long-term parking, call for car rental service, taxi stand.
Colleges/Universities in Burnsville: Regency Beauty Institute-Burnsville Full-time enrollment: 133; Location: 14350 Buck Hill Road; Private, for-profit; Website: www.regency.edu)
National American University-Burnsville Full-time enrollment: 94; Location: 513 West Travelers Trail; Private, for-profit; Website: www.national.edu/locations/burnsville)
Colleges/universities with over 2000 students nearest to Burnsville:
Normandale Community College (about 6 miles; Bloomington, MN ; Full-time enrollment: 7,048)
Dakota County Technical College (about 10 miles; Rosemount, MN ; FT enrollment: 2,478)
Inver Hills Community College (about 13 miles; Inver Grove Heights, MN ; FT enrollment: 4,049)
St Catherine University (about 13 miles; Saint Paul, MN ; FT enrollment: 3,771)
University of St Thomas (about 14 miles; Saint Paul, MN ; FT enrollment: 8,762)
Macalester College (about 14 miles; Saint Paul, MN ; FT enrollment: 2,174)
Augsburg College (about 15 miles; Minneapolis, MN ; FT enrollment: 2,954)
Public high schools in Burnsville:
Private high school in Burnsville:
Public elementary/middle schools in Burnsville:
Private elementary/middle schools in Burnsville:
See full list of schools located in Burnsville
Notable locations in Burnsville: (A) , Buck Hill Ski Area (B) , Orchard Gardens Golf Course (C) , Regan (D) , Burnsville Fire Department Station 1 (E) , Burnsville Fire Department Station 2 (F) , Burnsville Chamber of Commerce (G) . Display/hide their locations on the map
Shopping Centers: (1) , Burnhaven Shopping Center (2) , Burnhill Plaza Shopping Center (3) , Burnhill Shoppers Corner Shopping Center (4) , Burnside Plaza Shopping Center (5) , Burnsville Center Shopping Center (6) , Burnsville Crossings Shopping Center (7) , Burnsville Marketplace Shopping Center (8) , Byerlys Burnsville Center Shopping Center (9) . Display/hide their locations on the map
Main business address in Burnsville: (A) . Display/hide its location on the map
Churches in Burnsville include: (A) , Burnsville Church (B) , Crystal Lake Church (C) , Destiny Christian Center (D) , Good Shepherd Church (E) , Grace Church (F) , Holy Cross Church (G) , Saint James Church (H) , Redeemer Church (I) . Display/hide their locations on the map
Cemeteries: (1) , Pleasant View Memorial Gardens (2) . Display/hide their locations on the map
Lakes and reservoirs: (A) , Horseshoe Lake (B) , Earley Lake (C) , Crystal Lake (D) , Alimagnet Lake (E) , Black Dog Lake (F) , Blackdog Lake (G) . Display/hide their locations on the map
Parks in Burnsville include: (1) , South River Hills Park (2) , Lake Park (3) , Cedarbridge Park (4) , Wood Lane Trail Park (5) , Tennisioux Park (6) , Twin Lakes Park (7) , Cam Ram Park (8) , Hollows Park (9) . Display/hide their locations on the map
Tourist attractions: (1) , Carousel at Burnsville Center (Amusement & Theme Parks; 915 County Road 42 West) (2) , Adventure Zone Paintball (Amusement & Theme Parks; 13700 Nicollet Avenue) (3) , Champions Indoor Golf (Amusement & Theme Parks; 2999 County Road 42 West) (4) , Pump It Up (1182 Cliff Road East) (5) , Pro K A R T Indoor Racing Inc (12500 Chowen Avenue South) (6) , Ecommercebiz (Tours & Charters; 825 Bryant Lane) (7) , Convention & Visitors Bureau (Tours & Charters; 101 West Burnsville Parkway Suite 150) (8) , Metro Connections Event OFC & Warehouse (Tours & Charters; 401 Cliff Road East) (9) . Display/hide their approximate locations on the map
Hotels: (1) , Fantasuite Hotel (250 North River Ridge Circle) (2) , Super 8 Burnsville MN (1101 Burnsville Parkway) (3) , Red Roof Inns (12920 Aldrich Avenue South) (4) , Hampton Inn Minneapolis-Burnsville (14400 Nicollet Court) (5) , Prime Rate Motel (12850 West Frontage Road) (6) , Ramada Limited - Burnsville (250 N River Ridge Cir) (7) , Fairfield Inn (14350 Nicollet Court) (8) , Country Inn Burnsville (14331 Nicollet Court) (9) . Display/hide their approximate locations on the map
Birthplace of: Laura Osnes - Actress, Cole Aldrich - Basketball player, Mark Osiecki - Ice hockey player, Sean Curry - Ice hockey player, Jarred Tinordi - Ice hockey player, Tara Mack - Politician, Andrew Conboy - Ice hockey player, Joseph LaBate - Ice hockey player, Kirsten Olson - Figure skater, Ryan Amoroso - College basketball player (Marquette Golden Eagles).
Dakota County has a predicted average indoor radon screening level greater than 4 pCi/L (pico curies per liter) - Highest Potential Drinking water stations with addresses in Burnsville that have no violations reported:
BURNSVILLE (Address: 100 Civic Center Parkway Population served: 61,262, Primary Water Source Type: Surface water)
Average household size: This city:
2.5 peopleMinnesota:
2.5 people
Percentage of family households: This city:
64.5%Whole state:
64.6%
Percentage of households with unmarried partners: This city:
7.4%Whole state:
6.9%
Likely homosexual households (counted as self-reported same-sex unmarried-partner households)
Lesbian couples: 0.3% of all households Gay men: 0.3% of all households
People in group quarters in Burnsville in 2010:
287 people in nursing facilities/skilled-nursing facilities
129 people in group homes intended for adults
10 people in emergency and transitional shelters (with sleeping facilities) for people experiencing homelessness
9 people in residential treatment centers for adults
4 people in correctional residential facilities
3 people in group homes for juveniles (non-correctional)
People in group quarters in Burnsville in 2000:
102 people in hospitals/wards and hospices for chronically ill
102 people in other hospitals or wards for chronically ill
96 people in homes for the mentally retarded
86 people in other noninstitutional group quarters
30 people in other group homes
29 people in nursing homes
Banks with most branches in Burnsville (2011 data):
U.S. Bank National Association: Burnsville North Branch, Burnsville Byerly's Branch, Burnsville South Branch. Info updated 2012/01/30: Bank assets: $330,470.8 mil, Deposits: $236,091.5 mil, headquarters in Cincinnati, OH, positive income , 3121 total offices , Holding Company: U.S. Bancorp
TCF National Bank: Burnsville South Cub Branch, Burnsville Branch, Burnsville Cub Branch. Info updated 2009/11/23: Bank assets: $19,007.0 mil, Deposits: $12,377.0 mil, headquarters in Sioux Falls, SD, positive income , Commercial Lending Specialization, 441 total offices , Holding Company: Tcf Financial Corporation
Wells Fargo Bank, National Association: Burnsville Branch at 925 County Road 42 West, branch established on 1981/06/19; Burnsville Parkway Branch at 100 West Burnsville Parkway, branch established on 1985/12/31. Info updated 2011/04/05: Bank assets: $1,161,490.0 mil, Deposits: $905,653.0 mil, headquarters in Sioux Falls, SD, positive income , 6395 total offices , Holding Company: Wells Fargo & Company
BMO Harris Bank National Association: The Rivers at 11111 River Hills Drive, branch established on 2002/06/01; Burnsville Office at 14201 Grand Avenue South, branch established on 1982/06/04. Info updated 2011/07/14: Bank assets: $97,264.0 mil, Deposits: $75,624.6 mil, headquarters in Chicago, IL, positive income , 717 total offices , Holding Company: Bank Of Montreal
KleinBank: Burnsville Branch at 3000 County Road, 42 West, branch established on 2002/01/28. Info updated 2010/11/22: Bank assets: $1,504.4 mil, Deposits: $1,255.9 mil, headquarters in Big Lake, MN, positive income , Commercial Lending Specialization, 22 total offices , Holding Company: Klein Financial, Inc.
Associated Bank, National Association: Burnsville Branch at 2999 West County Road 42, Suite 130, branch established on 2000/05/25. Info updated 2008/09/12: Bank assets: $21,715.0 mil, Deposits: $15,244.4 mil, headquarters in Green Bay, WI, positive income , Commercial Lending Specialization, 282 total offices , Holding Company: Associated Banc-Corp
Anchor Bank, National Association: Burnsville Branch at 550 West Burnsville Parkway, branch established on 2007/04/02. Info updated 2009/11/24: Bank assets: $1,290.6 mil, Deposits: $1,116.1 mil, headquarters in Saint Paul, MN, positive income , Commercial Lending Specialization, 16 total offices , Holding Company: Anchor Bancorp, Inc.
Sterling State Bank: at 13810 Community Drive, branch established on 2011/02/24. Info updated 2006/11/03: Bank assets: $308.5 mil, Deposits: $267.4 mil, headquarters in Austin, MN, positive income , Commercial Lending Specialization, 12 total offices , Holding Company: Sterling Financial Group, Inc.
American Bank of St. Paul: Burnsville Branch at 14300 Nicollet Court, branch established on 1989/09/08. Info updated 2006/11/03: Bank assets: $413.3 mil, Deposits: $387.8 mil, headquarters in Saint Paul, MN, negative income in the last year , Commercial Lending Specialization, 10 total offices , Holding Company: American Bancorporation
For population 15 years and over in Burnsville:
Never married: 33.8%Now married: 52.1%Separated: 0.6%Widowed: 4.4%Divorced: 9.1% For population 25 years and over in Burnsville:
High school or higher: 93.6%Bachelor's degree or higher: 39.9%Graduate or professional degree: 11.9%Unemployed: 2.8%Mean travel time to work (commute): 18.4 minutes
Education Gini index (Inequality in education) Here:
11.1Minnesota average:
10.9
Religion statistics for Burnsville, MN (based on Dakota County data)
Religion Adherents Congregations Catholic 112,264 18 Evangelical Protestant 57,007 111 Mainline Protestant 55,850 56 Other 6,321 27 Orthodox 1,173 5 Black Protestant 313 2 None 165,624 -
Source: Clifford Grammich, Kirk Hadaway, Richard Houseal, Dale E.Jones, Alexei Krindatch, Richie Stanley and Richard H.Taylor. 2012. 2010 U.S.Religion Census: Religious Congregations & Membership Study. Association of Statisticians of American Religious Bodies. Jones, Dale E., et al. 2002. Congregations and Membership in the United States 2000. Nashville, TN: Glenmary Research Center. Graphs represent county-level data
Food Environment Statistics: Number of grocery stores : 35This county :
0.90 / 10,000 pop.State :
1.83 / 10,000 pop.
Number of supercenters and club stores : 5This county :
0.13 / 10,000 pop.Minnesota :
0.13 / 10,000 pop.
Number of convenience stores (no gas) : 6This county :
0.15 / 10,000 pop.State :
0.49 / 10,000 pop.
Number of convenience stores (with gas) : 118Here :
3.03 / 10,000 pop.Minnesota :
3.90 / 10,000 pop.
Number of full-service restaurants : 196Dakota County :
5.03 / 10,000 pop.State :
6.98 / 10,000 pop.
Adult diabetes rate : This county :
6.1%State :
6.5%
Adult obesity rate : This county :
25.6%Minnesota :
25.9%
Low-income preschool obesity rate : This county :
12.6%Minnesota :
13.0%
Health and Nutrition: Healthy diet rate : This city:
47.3%Minnesota:
50.6%
Average overall health of teeth and gums : Here:
43.2%Minnesota:
48.4%
People feeling badly about themselves : Burnsville:
22.2%Minnesota:
21.0%
People not drinking alcohol at all : This city:
10.4%Minnesota:
9.8%
Average hours sleeping at night : Overweight people : Burnsville:
32.4%Minnesota:
33.5%
General health condition : This city:
55.1%State:
57.7%
Average condition of hearing : Burnsville:
79.2%Minnesota:
79.3%
More about Health and Nutrition of Burnsville, MN Residents
Local government employment and payroll (March 2022)
Function
Full-time employees
Monthly full-time payroll
Average yearly full-time wage
Part-time employees
Monthly part-time payroll
Police Protection - Officers
74 $700,788 $113,641 0 $0 Firefighters
46 $449,263 $117,199 0 $0 Other and Unallocable
36 $277,702 $92,567 2 $310 Parks and Recreation
28 $198,444 $85,047 17 $10,195 Streets and Highways
28 $232,981 $99,849 0 $0 Financial Administration
16 $144,075 $108,056 2 $10,691 Other Government Administration
15 $139,347 $111,478 6 $7,728 Water Supply
14 $107,550 $92,186 0 $0 Police - Other
11 $68,900 $75,164 5 $21,935 Natural Resources
8 $60,133 $90,200 0 $0 Solid Waste Management
2 $12,976 $77,856 0 $0 Fire - Other
1 $6,397 $76,764 0 $0
Totals for Government
279 $2,398,556 $103,164 32 $50,858
Burnsville government finances - Expenditure in 2021 (per resident):
Construction - Regular Highways: $9,174,000 ($143.49)
Parks and Recreation: $5,423,000 ($84.82)Local Fire Protection: $5,036,000 ($78.77)Water Utilities: $3,451,000 ($53.98)Sewerage: $3,218,000 ($50.33)General Public Buildings: $612,000 ($9.57)General - Other: $151,000 ($2.36)Current Operations - Police Protection: $14,642,000 ($229.01)
Sewerage: $9,738,000 ($152.31)Local Fire Protection: $8,088,000 ($126.50)Central Staff Services: $5,179,000 ($81.00)Water Utilities: $4,985,000 ($77.97)Regular Highways: $3,605,000 ($56.38)Natural Resources - Other: $2,910,000 ($45.51)Housing and Community Development: $2,750,000 ($43.01)Parks and Recreation: $2,475,000 ($38.71)General - Other: $1,754,000 ($27.43)Protective Inspection and Regulation - Other: $1,244,000 ($19.46)Financial Administration: $723,000 ($11.31)General Public Buildings: $544,000 ($8.51)Judicial and Legal Services: $535,000 ($8.37)Miscellaneous Commercial Activities - Other: $412,000 ($6.44)Solid Waste Management: $337,000 ($5.27)Parking Facilities: $136,000 ($2.13)General - Interest on Debt: $1,198,000 ($18.74)
Other Capital Outlay - Local Fire Protection: $1,361,000 ($21.29)
Police Protection: $615,000 ($9.62)Central Staff Services: $547,000 ($8.56)Parks and Recreation: $432,000 ($6.76)Regular Highways: $358,000 ($5.60)Water Utilities: $265,000 ($4.14)Sewerage: $143,000 ($2.24)Protective Inspection and Regulation - Other: $61,000 ($0.95)Natural Resources - Other: $38,000 ($0.59)General - Other: $31,000 ($0.48)Total Salaries and Wages: $27,126,000 ($424.27)
Water Utilities - Interest on Debt: $1,359,000 ($21.26)
Burnsville government finances - Revenue in 2021 (per resident):
Charges - Sewerage: $11,934,000 ($186.66)
Other: $7,375,000 ($115.35)Parks and Recreation: $1,565,000 ($24.48)Miscellaneous Commercial Activities: $307,000 ($4.80)Federal Intergovernmental - Other: $4,823,000 ($75.43)
Local Intergovernmental - Other: $1,797,000 ($28.11)
General Local Government Support: $72,000 ($1.13)Miscellaneous - Special Assessments: $1,932,000 ($30.22)
Interest Earnings: $1,076,000 ($16.83)Rents: $870,000 ($13.61)General Revenue - Other: $806,000 ($12.61)Donations From Private Sources: $247,000 ($3.86)Fines and Forfeits: $205,000 ($3.21)Sale of Property: $83,000 ($1.30)Revenue - Water Utilities: $9,429,000 ($147.48)
State Intergovernmental - Highways: $2,738,000 ($42.82)
Other: $2,653,000 ($41.49)Water Utilities: $14,000 ($0.22)General Local Government Support: $14,000 ($0.22)Tax - Property: $37,703,000 ($589.70)
Other License: $4,694,000 ($73.42)Occupation and Business License - Other: $405,000 ($6.33)Alcoholic Beverage License: $174,000 ($2.72)Other Selective Sales: $174,000 ($2.72)
Burnsville government finances - Debt in 2021 (per resident):
Long Term Debt - Outstanding Unspecified Public Purpose: $76,634,000 ($1198.60)
Beginning Outstanding - Unspecified Public Purpose: $63,910,000 ($999.59)Issue, Unspecified Public Purpose: $21,557,000 ($337.17)Retired Unspecified Public Purpose: $8,833,000 ($138.15)
Burnsville government finances - Cash and Securities in 2021 (per resident):
Bond Funds - Cash and Securities: $19,090,000 ($298.58)
Other Funds - Cash and Securities: $63,912,000 ($999.62)
Sinking Funds - Cash and Securities: $6,516,000 ($101.91)
8.01% of this county's 2020 resident taxpayers moved to other counties in 2021 ($77,850 average adjusted gross income )
Here:
8.01%Minnesota average:
7.79%
0.01% of residents moved to foreign countries ($89 average AGI )Dakota County:
0.01%Minnesota average:
0.00%
Top counties to which taxpayers relocated from this county between 2020 and 2021:
Businesses in Burnsville, MN
Name Count Name Count
ALDI 1 Little Caesars Pizza 1 AT&T 2 Macy's 1 Advance Auto Parts 1 Marriott 1 Aeropostale 1 MasterBrand Cabinets 12 American Eagle Outfitters 2 Maurices 1 Applebee's 1 Mazda 1 Arby's 2 McDonald's 2 AutoZone 1 Men's Wearhouse 2 Barnes & Noble 1 Menards 1 Bath & Body Works 1 Motherhood Maternity 3 Budget Car Rental 1 New Balance 5 Burger King 2 Nike 18 Caribou Coffee 5 Nissan 1 Casual Male XL 1 Office Depot 1 Catherines 1 OfficeMax 1 Charlotte Russe 1 Old Country Buffet 1 Chipotle 1 Old Navy 1 Chuck E. Cheese's 1 Olive Garden 1 Cinnabon 1 Outback 1 Dairy Queen 2 Outback Steakhouse 1 Days Inn 1 Pac Sun 1 Deb 1 Panera Bread 1 Discount Tire 1 Papa John's Pizza 1 Domino's Pizza 1 Payless 1 DressBarn 1 Penske 1 Dressbarn 1 PetSmart 1 Eddie Bauer 1 Pier 1 Imports 1 Express 1 Pizza Hut 1 Famous Footwear 1 Plato's Closet 1 FedEx 9 RadioShack 1 Finish Line 1 Red Lobster 1 Foot Locker 1 Rue21 1 GNC 1 Ryder Rental & Truck Leasing 1 GameStop 2 SAS Shoes 1 Gap 2 Sears 3 Gymboree 1 Slumberland 1 H&R Block 5 Spencer Gifts 1 Hilton 1 Sprint Nextel 2 Hollister Co. 1 Starbucks 1 Home Depot 1 Subaru 1 Honda 1 Subway 6 Hot Topic 1 T-Mobile 6 Hyundai 1 T.G.I. Driday's 1 IHOP 1 T.J.Maxx 1 InTown Suites 1 Taco Bell 2 JCPenney 1 Target 1 Jones New York 1 Toyota 1 Journeys 1 Toys"R"Us 2 Justice 1 Travelodge 1 KFC 1 U-Haul 2 Kincaid 1 UPS 12 Kmart 1 Vans 4 Kohl's 1 Verizon Wireless 2 Kroger 1 Victoria's Secret 1 LA Fitness 1 Volkswagen 1 La-Z-Boy 1 Walgreens 3 Lane Bryant 1 Wendy's 1 Lane Furniture 1 Wet Seal 1 LensCrafters 1 YMCA 1
Strongest AM radio stations in Burnsville:
WMNN (1330 AM; 10 kW; MINNEAPOLIS, MN; Owner: MINNESOTA PUBLIC RADIO.)
KFAN (1130 AM; 50 kW; MINNEAPOLIS, MN; Owner: AMFM RADIO LICENSES, L.L.C.)
KKMS (980 AM; 5 kW; RICHFIELD, MN)
WCTS (1030 AM; 50 kW; MAPLEWOOD, MN; Owner: CNTL. BAPT. THEO/AL SEMI MINNEAPOLIS)
KSTP (1500 AM; 50 kW; ST. PAUL, MN; Owner: KSTP-AM, LLC (DELAWARE))
WCCO (830 AM; 50 kW; MINNEAPOLIS, MN; Owner: INFINITY MEDIA CORPORATION)
KTIS (900 AM; 25 kW; MINNEAPOLIS, MN; Owner: NORTHWESTERN COLLEGE)
KSMM (1530 AM; 9 kW; SHAKOPEE, MN; Owner: STARBOARD BROADCASTING, INC.)
KUOM (770 AM; daytime; 5 kW; MINNEAPOLIS, MN)
WWTC (1280 AM; 5 kW; MINNEAPOLIS, MN; Owner: SCA LICENSE CORPORATION)
KDIZ (1440 AM; 5 kW; GOLDEN VALLEY, MN; Owner: KQRS, INC.)
KYCR (1570 AM; 4 kW; GOLDEN VALLEY, MN; Owner: COMMON GROUND BROADCASTING COMPANY,)
WDGY (630 AM; 8 kW; HUDSON, WI; Owner: 630 RADIO, INCORPORATED)
Strongest FM radio stations in Burnsville:
WGVX (105.1 FM; LAKEVILLE, MN; Owner: KQRS, INC.)
WCAL (89.3 FM; NORTHFIELD, MN; Owner: ST. OLAF COLLEGE)
KNOW-FM (91.1 FM; MINNEAPOLIS-ST. PAUL, MN; Owner: MINNESOTA PUBLIC RADIO)
WLTE (102.9 FM; MINNEAPOLIS, MN; Owner: INFINITY MEDIA CORPORATION)
KTCZ-FM (97.1 FM; MINNEAPOLIS, MN; Owner: AMFM RADIO LICENSES, L.L.C.)
KSTP-FM (94.5 FM; ST. PAUL, MN; Owner: KSTP-FM, LLC, A DELAWARE LLC)
KEEY-FM (102.1 FM; ST. PAUL, MN; Owner: AMFM RADIO LICENSES, L.L.C.)
KTIS-FM (98.5 FM; MINNEAPOLIS, MN; Owner: NORTHWESTERN COLLEGE)
KDWB-FM (101.3 FM; RICHFIELD, MN; Owner: AMFM RADIO LICENSES, L.L.C.)
KQRS-FM (92.5 FM; GOLDEN VALLEY, MN; Owner: KQRS, Inc.)
KSJN (99.5 FM; MINNEAPOLIS, MN; Owner: MINNESOTA PUBLIC RADIO)
KXXR (93.7 FM; MINNEAPOLIS, MN; Owner: KQRS, INC.)
K214DF (90.7 FM; GOLDEN VALLEY, MN; Owner: EDUCATIONAL MEDIA FOUNDATION)
WGVZ (105.7 FM; EDEN PRAIRIE, MN; Owner: KQRS, INC.)
KFAI (90.3 FM; MINNEAPOLIS, MN; Owner: FRESH AIR, INC.)
KQQL (107.9 FM; ANOKA, MN; Owner: AMFM RADIO LICENSES, L.L.C.)
KBEM-FM (88.5 FM; MINNEAPOLIS, MN; Owner: BD. OF EDUCATION, S.S.D. NO. 1)
K294AM (106.7 FM; WEST ST. PAUL, MN; Owner: FRESH AIR, INCORPORATED)
KNOF (95.3 FM; ST. PAUL, MN; Owner: SELBY GOSPEL BROADCASTING CORPORATION)
WXPT (104.1 FM; ST. LOUIS PARK, MN; Owner: THE AUDIO HOUSE, INC.)
TV broadcast stations around Burnsville:
KMSP-TV (Channel 9; MINNEAPOLIS, MN; Owner: FOX TELEVISION STATIONS, INC.)
KARE (Channel 11; MINNEAPOLIS, MN; Owner: MULTIMEDIA HOLDINGS CORPORATION)
KSTP-TV (Channel 5; ST. PAUL, MN; Owner: HUBBARD BROADCASTING, INC.)
KTCA-TV (Channel 2; ST. PAUL, MN; Owner: TWIN CITIES PUBLIC TELEVISION, INC.)
K07UI (Channel 7; MINNEAPOLIS, ETC., MN; Owner: WORD OF GOD FELLOWSHIP, INC.)
K58BS (Channel 58; MINNEAPOLIS, MN; Owner: TRINITY BROADCASTING NETWORK)
WCCO-TV (Channel 4; MINNEAPOLIS, MN; Owner: CBS BROADCASTING INC.)
K67HG (Channel 67; MINNEAPOLIS, MN; Owner: VENTANA TELEVISION, INC.)
K14KH (Channel 14; MINNEAPOLIS, MN; Owner: THREE ANGELS BROADCASTING NETWORK)
K19ER (Channel 19; ST. PAUL, MN; Owner: CATHOLIC VIEWS BROADCASTS, INC.)
W62BD (Channel 62; MINNEAPOLIS, MN; Owner: WORD OF GOD FELLOWSHIP, INC.)
KTCI-TV (Channel 17; ST. PAUL, MN; Owner: TWIN CITIES PUBLIC TELEVISION, INC.)
KSTC-TV (Channel 45; MINNEAPOLIS, MN; Owner: HUBBARD BROADCASTING, INC.)
KMWB (Channel 23; MINNEAPOLIS, MN; Owner: KLGT LICENSEE, LLC)
WFTC (Channel 29; MINNEAPOLIS, MN; Owner: FOX TELEVISION STATIONS, INC.)
WBWX-CA (Channel 13; MINNEAPOLIS, MN; Owner: THE BOX WORLDWIDE LLC)
KPXM (Channel 41; ST. CLOUD, MN; Owner: PAXSON MINNEAPOLIS LICENSE, INC.)
National Bridge Inventory (NBI) Statistics 47 Number of bridges449ft / 137m Total length $2,869,704,000 Total costs1,393,458 Total average daily traffic68,133 Total average daily truck traffic
New bridges - historical statistics
7 1950-1959 6 1960-1969 15 1970-1979 13 1980-1989 2 1990-1999 1 2000-2009 3 2010-2019
See full National Bridge Inventory statistics for Burnsville, MN
Home Mortgage Disclosure Act Aggregated Statistics For Year 2009(Based on 12 full tracts) A) FHA, FSA/RHS & VA B) Conventional C) Refinancings D) Home Improvement Loans E) Loans on Dwellings For 5+ Families F) Non-occupant Loans on G) Loans On Manufactured Number Average Value Number Average Value Number Average Value Number Average Value Number Average Value Number Average Value Number Average Value
LOANS ORIGINATED 352 $176,640 248 $169,515 1,345 $190,012 46 $97,217 1 $97,990 51 $148,941 5 $63,800 APPLICATIONS APPROVED, NOT ACCEPTED 18 $156,721 21 $196,901 130 $187,369 16 $35,062 0 $0 4 $121,245 2 $51,500 APPLICATIONS DENIED 27 $157,481 30 $117,000 432 $201,329 38 $41,921 0 $0 14 $102,428 6 $41,167 APPLICATIONS WITHDRAWN 28 $135,820 34 $166,469 268 $197,017 15 $61,267 0 $0 9 $176,330 0 $0 FILES CLOSED FOR INCOMPLETENESS 5 $138,398 9 $146,220 125 $180,726 3 $30,330 0 $0 4 $194,498 3 $41,667
Aggregated Statistics For Year 2008(Based on 12 full tracts) A) FHA, FSA/RHS & VA B) Conventional C) Refinancings D) Home Improvement Loans E) Loans on Dwellings For 5+ Families F) Non-occupant Loans on G) Loans On Manufactured Number Average Value Number Average Value Number Average Value Number Average Value Number Average Value Number Average Value Number Average Value
LOANS ORIGINATED 233 $193,534 357 $175,161 666 $183,494 103 $54,854 2 $7,748,500 51 $148,273 6 $28,167 APPLICATIONS APPROVED, NOT ACCEPTED 22 $197,635 47 $185,360 127 $191,233 18 $76,222 0 $0 4 $51,250 4 $52,000 APPLICATIONS DENIED 29 $180,414 67 $165,327 379 $204,927 65 $66,399 0 $0 15 $132,597 13 $24,923 APPLICATIONS WITHDRAWN 27 $193,071 37 $216,891 146 $218,587 19 $71,316 0 $0 5 $254,198 0 $0 FILES CLOSED FOR INCOMPLETENESS 5 $175,600 11 $164,363 61 $224,375 10 $40,000 0 $0 4 $213,500 0 $0
Aggregated Statistics For Year 2007(Based on 12 full tracts) A) FHA, FSA/RHS & VA B) Conventional C) Refinancings D) Home Improvement Loans E) Loans on Dwellings For 5+ Families F) Non-occupant Loans on G) Loans On Manufactured Number Average Value Number Average Value Number Average Value Number Average Value Number Average Value Number Average Value Number Average Value
LOANS ORIGINATED 64 $199,358 728 $183,139 861 $169,255 157 $69,484 4 $5,773,250 105 $169,924 7 $43,571 APPLICATIONS APPROVED, NOT ACCEPTED 4 $184,000 91 $174,658 209 $176,377 36 $66,389 1 $6,300,000 15 $212,131 2 $46,000 APPLICATIONS DENIED 5 $154,598 167 $213,400 631 $198,266 98 $83,683 1 $4,800,000 55 $271,798 19 $31,421 APPLICATIONS WITHDRAWN 3 $192,663 63 $207,840 260 $197,082 17 $102,646 0 $0 28 $228,642 2 $179,500 FILES CLOSED FOR INCOMPLETENESS 1 $231,000 27 $210,444 58 $176,912 11 $57,000 0 $0 3 $169,667 0 $0
Aggregated Statistics For Year 2006(Based on 12 full tracts) A) FHA, FSA/RHS & VA B) Conventional C) Refinancings D) Home Improvement Loans E) Loans on Dwellings For 5+ Families F) Non-occupant Loans on G) Loans On Manufactured Number Average Value Number Average Value Number Average Value Number Average Value Number Average Value Number Average Value Number Average Value
LOANS ORIGINATED 68 $180,013 1,130 $166,323 1,104 $162,493 179 $67,318 3 $3,848,333 127 $160,069 11 $25,909 APPLICATIONS APPROVED, NOT ACCEPTED 1 $274,000 157 $157,336 235 $149,327 35 $72,942 0 $0 24 $150,458 4 $31,500 APPLICATIONS DENIED 10 $185,998 231 $186,870 595 $179,138 118 $79,447 0 $0 33 $183,333 15 $27,200 APPLICATIONS WITHDRAWN 9 $202,556 107 $185,214 435 $191,644 40 $89,374 0 $0 28 $159,178 1 $155,000 FILES CLOSED FOR INCOMPLETENESS 0 $0 40 $224,148 120 $181,499 8 $91,748 0 $0 5 $343,000 0 $0
Aggregated Statistics For Year 2005(Based on 12 full tracts) A) FHA, FSA/RHS & VA B) Conventional C) Refinancings D) Home Improvement Loans E) Loans on Dwellings For 5+ Families F) Non-occupant Loans on G) Loans On Manufactured Number Average Value Number Average Value Number Average Value Number Average Value Number Average Value Number Average Value Number Average Value
LOANS ORIGINATED 58 $169,810 1,346 $163,132 1,518 $179,750 182 $76,098 8 $1,860,250 143 $154,118 11 $39,908 APPLICATIONS APPROVED, NOT ACCEPTED 4 $191,750 176 $167,766 209 $173,098 33 $75,182 0 $0 23 $174,694 10 $38,200 APPLICATIONS DENIED 4 $151,495 297 $148,790 627 $187,546 108 $79,036 0 $0 55 $175,490 35 $37,886 APPLICATIONS WITHDRAWN 2 $171,490 178 $169,617 549 $189,806 55 $133,816 0 $0 28 $158,071 5 $32,600 FILES CLOSED FOR INCOMPLETENESS 1 $184,980 58 $145,551 188 $207,073 15 $83,599 0 $0 7 $161,000 0 $0
Aggregated Statistics For Year 2004(Based on 12 full tracts) A) FHA, FSA/RHS & VA B) Conventional C) Refinancings D) Home Improvement Loans E) Loans on Dwellings For 5+ Families F) Non-occupant Loans on G) Loans On Manufactured Number Average Value Number Average Value Number Average Value Number Average Value Number Average Value Number Average Value Number Average Value
LOANS ORIGINATED 124 $166,756 1,206 $166,412 1,736 $167,041 157 $58,267 1 $820,000 133 $162,946 17 $36,529 APPLICATIONS APPROVED, NOT ACCEPTED 6 $174,500 153 $152,346 263 $169,896 24 $67,665 0 $0 13 $164,769 17 $33,588 APPLICATIONS DENIED 7 $182,711 181 $143,601 600 $168,767 99 $56,979 0 $0 45 $125,021 24 $33,083 APPLICATIONS WITHDRAWN 6 $145,163 136 $185,991 508 $177,480 27 $40,222 0 $0 19 $164,893 3 $47,333 FILES CLOSED FOR INCOMPLETENESS 1 $152,000 18 $153,667 191 $186,254 3 $35,333 0 $0 4 $171,750 0 $0
Aggregated Statistics For Year 2003(Based on 12 full tracts) A) FHA, FSA/RHS & VA B) Conventional C) Refinancings D) Home Improvement Loans E) Loans on Dwellings For 5+ Families F) Non-occupant Loans on Number Average Value Number Average Value Number Average Value Number Average Value Number Average Value Number Average Value
LOANS ORIGINATED 185 $168,598 1,264 $166,863 4,730 $151,592 167 $35,239 3 $2,383,333 121 $152,296 APPLICATIONS APPROVED, NOT ACCEPTED 4 $143,750 138 $145,651 421 $155,217 29 $31,551 1 $600,000 25 $142,320 APPLICATIONS DENIED 10 $171,596 186 $122,763 786 $149,831 73 $24,109 1 $1,875,000 30 $155,865 APPLICATIONS WITHDRAWN 6 $145,333 126 $190,792 670 $156,222 18 $45,221 0 $0 15 $208,133 FILES CLOSED FOR INCOMPLETENESS 2 $182,500 27 $153,037 138 $158,918 2 $9,500 0 $0 4 $129,248
Aggregated Statistics For Year 2002(Based on 6 full tracts) A) FHA, FSA/RHS & VA B) Conventional C) Refinancings D) Home Improvement Loans E) Loans on Dwellings For 5+ Families F) Non-occupant Loans on Number Average Value Number Average Value Number Average Value Number Average Value Number Average Value Number Average Value
LOANS ORIGINATED 101 $150,541 511 $145,113 1,620 $138,948 79 $35,658 4 $1,856,592 64 $120,780 APPLICATIONS APPROVED, NOT ACCEPTED 1 $177,000 36 $134,108 178 $132,372 26 $32,729 0 $0 2 $96,495 APPLICATIONS DENIED 2 $109,495 46 $104,107 262 $123,355 36 $28,166 0 $0 16 $111,062 APPLICATIONS WITHDRAWN 4 $116,498 40 $142,272 277 $147,979 8 $48,125 0 $0 11 $134,997 FILES CLOSED FOR INCOMPLETENESS 4 $129,498 6 $89,662 113 $155,528 3 $21,667 0 $0 0 $0
Aggregated Statistics For Year 2001(Based on 6 full tracts) A) FHA, FSA/RHS & VA B) Conventional C) Refinancings D) Home Improvement Loans E) Loans on Dwellings For 5+ Families F) Non-occupant Loans on Number Average Value Number Average Value Number Average Value Number Average Value Number Average Value Number Average Value
LOANS ORIGINATED 142 $134,258 431 $137,076 1,415 $127,244 92 $24,923 1 $1,856,000 39 $118,383 APPLICATIONS APPROVED, NOT ACCEPTED 0 $0 17 $94,470 130 $109,844 19 $30,684 0 $0 3 $86,667 APPLICATIONS DENIED 7 $150,571 35 $72,771 253 $103,516 50 $23,119 0 $0 3 $91,997 APPLICATIONS WITHDRAWN 2 $140,000 30 $137,832 310 $148,791 25 $50,599 0 $0 7 $105,284 FILES CLOSED FOR INCOMPLETENESS 0 $0 7 $93,853 48 $125,185 8 $29,125 0 $0 0 $0
Aggregated Statistics For Year 2000(Based on 6 full tracts) A) FHA, FSA/RHS & VA B) Conventional C) Refinancings D) Home Improvement Loans E) Loans on Dwellings For 5+ Families F) Non-occupant Loans on Number Average Value Number Average Value Number Average Value Number Average Value Number Average Value Number Average Value
LOANS ORIGINATED 134 $129,580 455 $123,921 372 $90,891 117 $25,341 3 $313,000 31 $98,064 APPLICATIONS APPROVED, NOT ACCEPTED 0 $0 35 $95,114 58 $82,739 32 $20,499 0 $0 1 $58,000 APPLICATIONS DENIED 7 $144,426 65 $81,337 154 $74,615 59 $28,118 0 $0 5 $98,598 APPLICATIONS WITHDRAWN 3 $161,000 32 $114,215 152 $102,175 12 $47,750 0 $0 4 $138,500 FILES CLOSED FOR INCOMPLETENESS 2 $93,495 2 $114,000 58 $120,841 1 $20,000 0 $0 1 $80,000
Aggregated Statistics For Year 1999(Based on 9 full tracts) A) FHA, FSA/RHS & VA B) Conventional C) Refinancings D) Home Improvement Loans E) Loans on Dwellings For 5+ Families F) Non-occupant Loans on Number Average Value Number Average Value Number Average Value Number Average Value Number Average Value Number Average Value
LOANS ORIGINATED 332 $118,526 1,091 $114,903 1,146 $100,536 251 $19,684 4 $929,518 47 $88,836 APPLICATIONS APPROVED, NOT ACCEPTED 6 $127,492 81 $81,787 194 $83,554 51 $25,074 0 $0 8 $76,258 APPLICATIONS DENIED 14 $96,062 266 $64,507 387 $79,185 109 $17,376 1 $12,000 11 $91,770 APPLICATIONS WITHDRAWN 14 $97,543 71 $121,595 284 $103,638 42 $52,397 0 $0 7 $94,034 FILES CLOSED FOR INCOMPLETENESS 4 $111,520 36 $105,504 64 $101,262 2 $19,000 0 $0 1 $39,560
Detailed mortgage data for all 12 tracts in Burnsville, MN
Private Mortgage Insurance Companies Aggregated Statistics For Year 2009(Based on 12 full tracts) A) Conventional B) Refinancings C) Non-occupant Loans on Number Average Value Number Average Value Number Average Value
LOANS ORIGINATED 55 $209,925 24 $209,372 1 $160,000 APPLICATIONS APPROVED, NOT ACCEPTED 8 $200,248 15 $191,399 0 $0 APPLICATIONS DENIED 6 $262,000 5 $215,400 0 $0 APPLICATIONS WITHDRAWN 2 $188,500 2 $299,000 0 $0 FILES CLOSED FOR INCOMPLETENESS 2 $224,000 1 $55,000 0 $0
Aggregated Statistics For Year 2008(Based on 12 full tracts) A) Conventional B) Refinancings C) Non-occupant Loans on Number Average Value Number Average Value Number Average Value
LOANS ORIGINATED 142 $190,421 65 $215,121 8 $143,375 APPLICATIONS APPROVED, NOT ACCEPTED 36 $205,026 30 $229,430 3 $168,333 APPLICATIONS DENIED 16 $188,123 5 $207,800 5 $132,000 APPLICATIONS WITHDRAWN 13 $222,692 7 $193,283 0 $0 FILES CLOSED FOR INCOMPLETENESS 7 $229,429 1 $194,000 5 $225,400
Aggregated Statistics For Year 2007(Based on 12 full tracts) A) Conventional B) Refinancings C) Non-occupant Loans on Number Average Value Number Average Value Number Average Value
LOANS ORIGINATED 310 $197,940 94 $221,881 16 $234,125 APPLICATIONS APPROVED, NOT ACCEPTED 18 $207,553 14 $205,571 0 $0 APPLICATIONS DENIED 3 $184,667 5 $219,000 3 $183,333 APPLICATIONS WITHDRAWN 11 $203,271 10 $221,600 3 $260,667 FILES CLOSED FOR INCOMPLETENESS 3 $269,663 0 $0 0 $0
Aggregated Statistics For Year 2006(Based on 12 full tracts) A) Conventional B) Refinancings C) Non-occupant Loans on Number Average Value Number Average Value Number Average Value
LOANS ORIGINATED 134 $195,432 42 $207,259 4 $198,250 APPLICATIONS APPROVED, NOT ACCEPTED 13 $261,615 11 $228,907 0 $0 APPLICATIONS DENIED 0 $0 0 $0 0 $0 APPLICATIONS WITHDRAWN 6 $298,162 2 $243,000 0 $0 FILES CLOSED FOR INCOMPLETENESS 0 $0 0 $0 0 $0
Aggregated Statistics For Year 2005(Based on 12 full tracts) A) Conventional B) Refinancings C) Non-occupant Loans on Number Average Value Number Average Value Number Average Value
LOANS ORIGINATED 129 $207,782 86 $199,289 5 $186,400 APPLICATIONS APPROVED, NOT ACCEPTED 17 $220,291 14 $200,926 1 $115,000 APPLICATIONS DENIED 5 $223,000 2 $335,000 3 $303,667 APPLICATIONS WITHDRAWN 5 $165,400 6 $271,333 0 $0 FILES CLOSED FOR INCOMPLETENESS 0 $0 2 $199,500 0 $0
Aggregated Statistics For Year 2004(Based on 12 full tracts) A) Conventional B) Refinancings C) Non-occupant Loans on Number Average Value Number Average Value Number Average Value
LOANS ORIGINATED 219 $190,327 89 $199,481 16 $185,688 APPLICATIONS APPROVED, NOT ACCEPTED 37 $190,050 33 $200,969 5 $157,400 APPLICATIONS DENIED 3 $193,333 0 $0 1 $88,000 APPLICATIONS WITHDRAWN 9 $165,442 11 $189,362 2 $149,000 FILES CLOSED FOR INCOMPLETENESS 0 $0 2 $184,500 0 $0
Aggregated Statistics For Year 2003(Based on 12 full tracts) A) Conventional B) Refinancings C) Non-occupant Loans on Number Average Value Number Average Value Number Average Value
LOANS ORIGINATED 413 $187,642 318 $175,130 21 $185,759 APPLICATIONS APPROVED, NOT ACCEPTED 47 $198,572 80 $185,061 2 $149,000 APPLICATIONS DENIED 2 $143,485 5 $266,200 2 $171,500 APPLICATIONS WITHDRAWN 12 $180,165 23 $180,258 2 $159,500 FILES CLOSED FOR INCOMPLETENESS 1 $77,000 1 $188,000 0 $0
Aggregated Statistics For Year 2002(Based on 6 full tracts) A) Conventional B) Refinancings C) Non-occupant Loans on Number Average Value Number Average Value Number Average Value
LOANS ORIGINATED 172 $159,387 123 $171,622 11 $131,633 APPLICATIONS APPROVED, NOT ACCEPTED 18 $168,439 26 $168,919 5 $120,398 APPLICATIONS DENIED 2 $133,000 4 $134,498 1 $134,000 APPLICATIONS WITHDRAWN 10 $150,395 6 $165,665 1 $179,000 FILES CLOSED FOR INCOMPLETENESS 0 $0 0 $0 0 $0
Aggregated Statistics For Year 2001(Based on 6 full tracts) A) Conventional B) Refinancings C) Non-occupant Loans on Number Average Value Number Average Value Number Average Value
LOANS ORIGINATED 184 $151,595 136 $164,063 11 $126,180 APPLICATIONS APPROVED, NOT ACCEPTED 28 $137,535 15 $152,796 1 $160,980 APPLICATIONS DENIED 0 $0 3 $175,993 0 $0 APPLICATIONS WITHDRAWN 2 $130,500 3 $117,333 1 $61,000 FILES CLOSED FOR INCOMPLETENESS 3 $177,000 0 $0 0 $0
Aggregated Statistics For Year 2000(Based on 6 full tracts) A) Conventional B) Refinancings C) Non-occupant Loans on Number Average Value Number Average Value Number Average Value
LOANS ORIGINATED 175 $134,901 25 $139,276 8 $91,122 APPLICATIONS APPROVED, NOT ACCEPTED 16 $129,250 5 $131,600 0 $0 APPLICATIONS DENIED 5 $158,796 0 $0 0 $0 APPLICATIONS WITHDRAWN 1 $174,000 0 $0 0 $0 FILES CLOSED FOR INCOMPLETENESS 1 $100,990 0 $0 0 $0
Aggregated Statistics For Year 1999(Based on 9 full tracts) A) Conventional B) Refinancings C) Non-occupant Loans on Number Average Value Number Average Value Number Average Value
LOANS ORIGINATED 372 $131,145 163 $136,125 9 $108,062 APPLICATIONS APPROVED, NOT ACCEPTED 23 $130,418 23 $114,931 1 $112,000 APPLICATIONS DENIED 7 $134,897 10 $150,910 3 $154,207 APPLICATIONS WITHDRAWN 12 $121,595 5 $106,602 2 $113,000 FILES CLOSED FOR INCOMPLETENESS 1 $34,000 2 $133,150 0 $0
Fire-safe hotels and motels in Burnsville, Minnesota:
Select Inn, 250 N Riv Ridge Cir, Burnsville, Minnesota 55337 Phone: (952) 890-9550, Fax: (952) 890-5161
Best Western Premier Nicollet Inn, 14201 Nicollet Ave S, Burnsville, Minnesota 55337 Phone: (952) 435-2100, Fax: (952) 435-2483
Americas Best Value Inn, 1101 W Burnsville Pkwy, Burnsville, Minnesota 55337 Phone: (952) 894-3400, Fax: (952) 894-2771
Americinn by Wyndham, 14331 Nicollet Ct, Burnsville, Minnesota 55306 Phone: (952) 892-1900, Fax: (952) 892-7494
In Town Suites-Minneapolis South, 2705 W County Rd 42, Burnsville, Minnesota 55306 Phone: (952) 890-1575, Fax: (952) 890-1764
Livinn Hotels, 13080 Aldrich Ave S, Burnsville, Minnesota 55337 Phone: (952) 890-7999, Fax: (952) 277-5133
All 6 fire-safe hotels and motels in Burnsville, Minnesota
Most common first names in Burnsville, MN among deceased individuals Name Count Lived (average)
John 123 72.7 years Mary 97 77.3 years Robert 89 72.4 years William 74 71.3 years James 69 68.5 years Donald 68 73.5 years Helen 60 80.1 years Dorothy 59 83.3 years Ruth 53 84.4 years Richard 51 68.1 years
Most common last names in Burnsville, MN among deceased individuals Last name Count Lived (average)
Johnson 92 77.1 years Anderson 56 76.1 years Nelson 49 77.6 years Olson 47 80.7 years Peterson 38 77.6 years Miller 34 78.6 years Smith 28 78.6 years Larson 27 74.3 years Carlson 17 81.5 years Hanson 15 74.4 years
Burnsville compared to Minnesota state average:
Unemployed percentage significantly below state average. Black race population percentage above state average. Hispanic race population percentage above state average. Median age below state average. Foreign-born population percentage above state average. Length of stay since moving in significantly above state average. Burnsville on our top lists :
#12 on the list of "Top 101 cities with the largest temperature differences during a year (population 50,000+)"
#15 on the list of "Top 101 cities with the coldest winters (population 50,000+)"
#15 on the list of "Top 101 cities with the lowest daily low temperatures (population 50,000+)"
#27 on the list of "Top 101 cities with the lowest average temperatures (population 50,000+)"
#60 on the list of "Top 101 cities with largest percentage of females in industries: other services, except public administration (population 50,000+)"
#69 on the list of "Top 101 cities with largest percentage of males in industries: finance and insurance (population 50,000+)"
#74 on the list of "Top 101 cities with the most residents born in Other Eastern Africa (population 500+)"
#75 on the list of "Top 101 cities with the highest cost per building permit(population 50,000+)"
#82 on the list of "Top 101 cities with largest percentage of females in occupations: installation, maintenance, and repair occupations (population 50,000+)"
#84 on the list of "Top 101 cities with largest percentage of females in occupations: personal care and service occupations (population 50,000+)"
#88 on the list of "Top 101 cities with the lowest number of robberies per 100,000 residents (population 50,000+)"
#92 on the list of "Top 101 cities with fewest building permits per 10,000 residents (population 50,000+)"
#94 on the list of "Top 101 cities with largest percentage of males in occupations: business and financial operations occupations (population 50,000+)"
#96 on the list of "Top 101 cities with largest percentage of females in occupations: computer and mathematical occupations (population 50,000+)"
#100 on the list of "Top 101 cities with the lowest number of burglaries per 100,000 residents (population 50,000+)"
#1 on the list of "Top 101 counties with the highest percentage of residents that visited a dentist within the past year"
#8 on the list of "Top 101 counties with the highest percentage of residents that exercised in the past month"
#9 on the list of "Top 101 counties with the lowest number of infant deaths per 1000 residents 2007-2013 (pop. 50,000+)"
#9 on the list of "Top 101 counties with the largest decrease in the number of infant deaths per 1000 residents 2000-2006 to 2007-2013 (pop. 50,000+)"
#15 on the list of "Top 101 counties with the best general health status score of residents (1-5), 3 years of data"
Top Patent Applicants
Joseph C. Coffey (62)
Martin R. Willard (44)
Carter M. Silvernail (34)
Mario A. Perez (24)
Scott R. Culler (23)
Carter Silvernail (22)
Maroun Georges Khoury (19)
Peter Segar (19)
Peter J. Fernholz (17)
Ryan Kostecka (17)
Total of 1055 patent applications in 2008-2024.
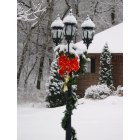

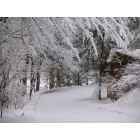
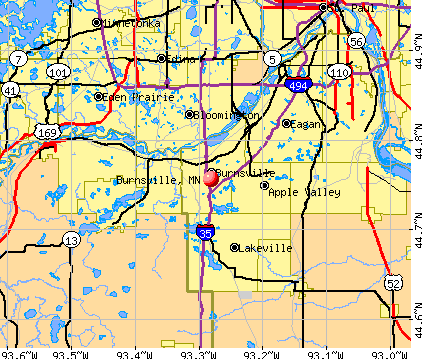


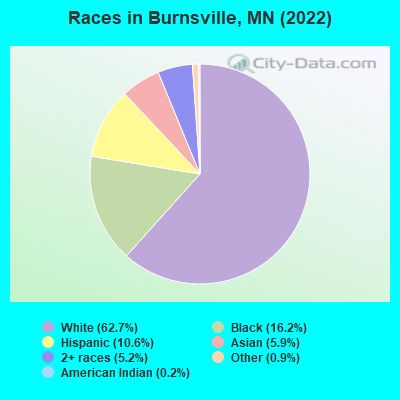
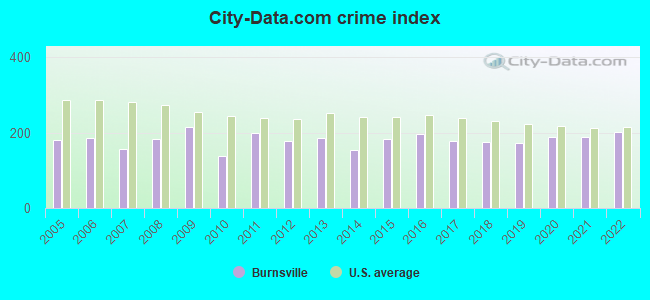
 Recent articles from our blog. Our writers, many of them Ph.D. graduates or candidates, create easy-to-read articles on a wide variety of topics.

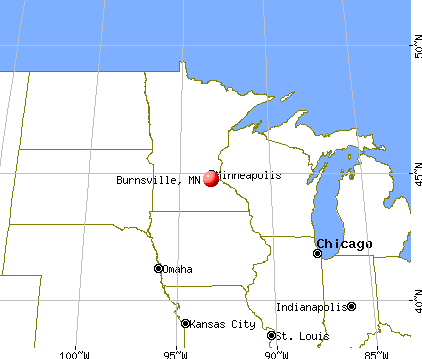
 (14.4 miles
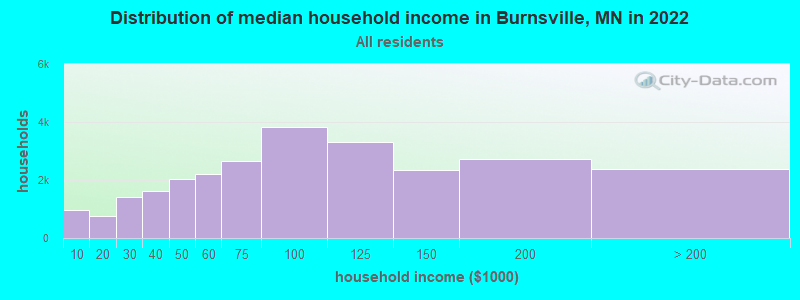
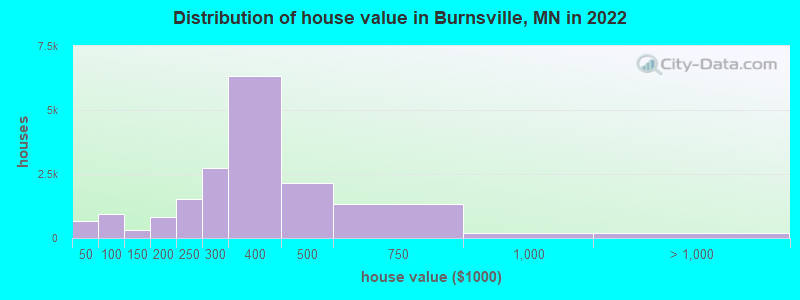
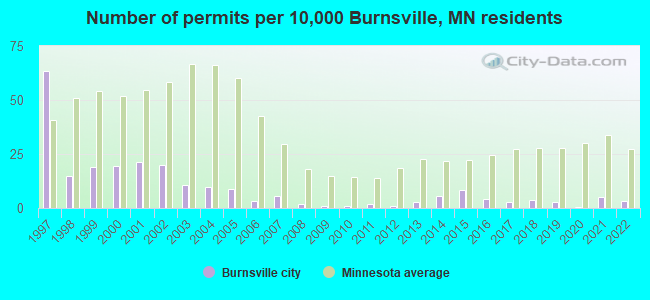
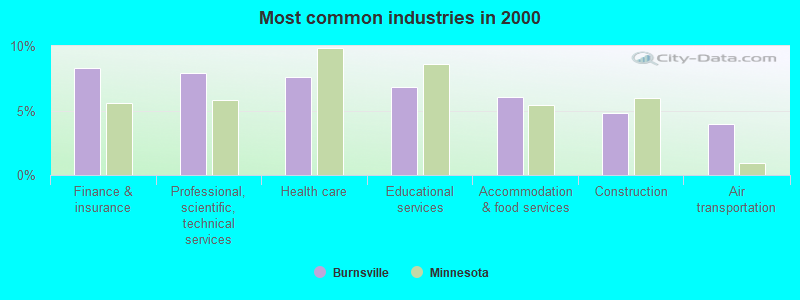
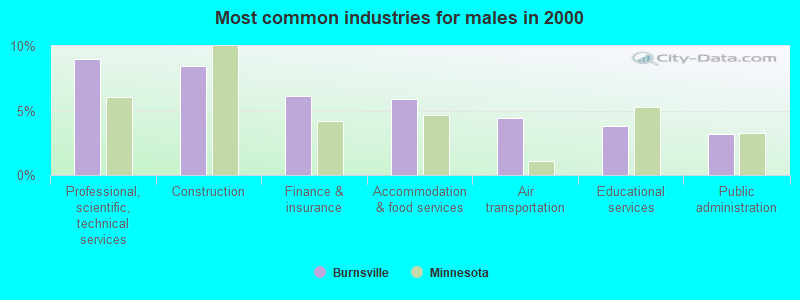
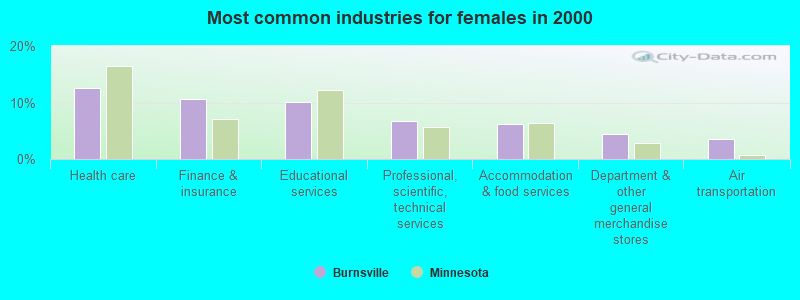
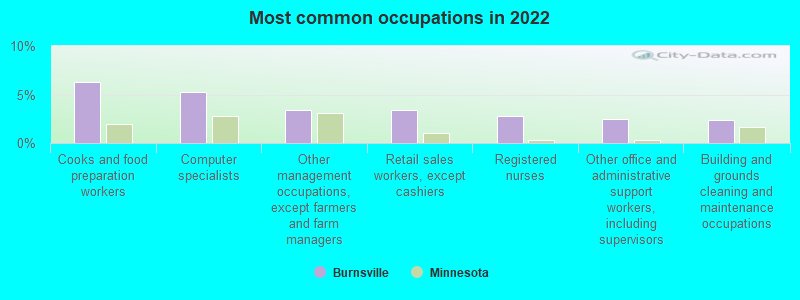
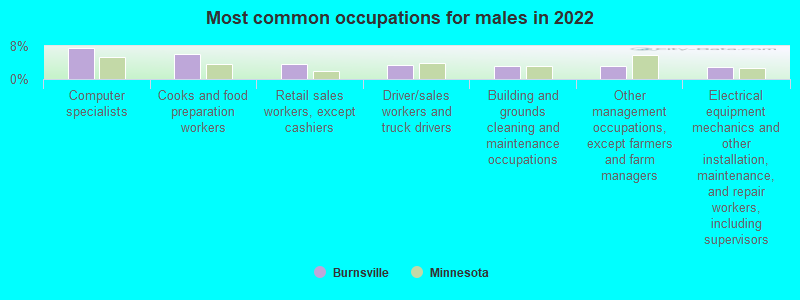
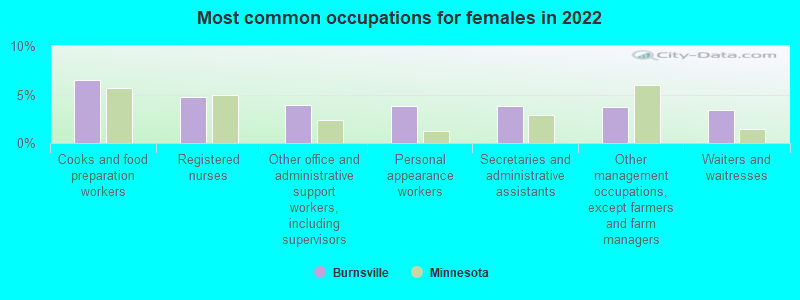

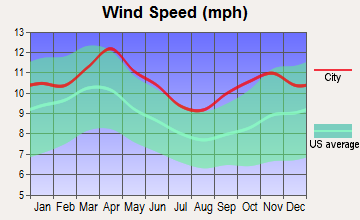
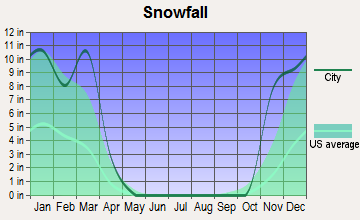

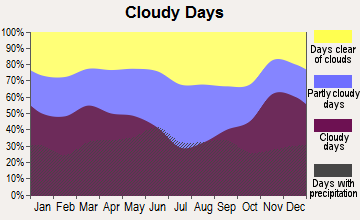


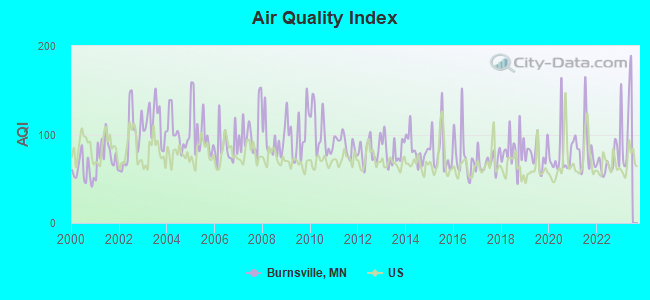
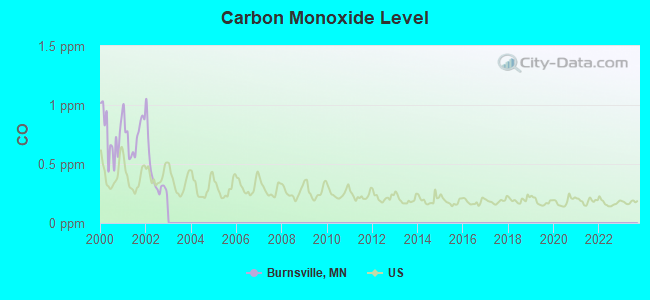
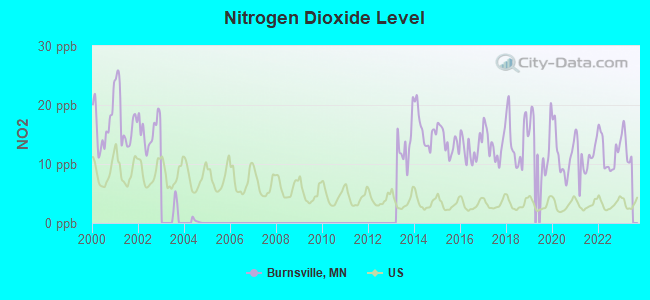
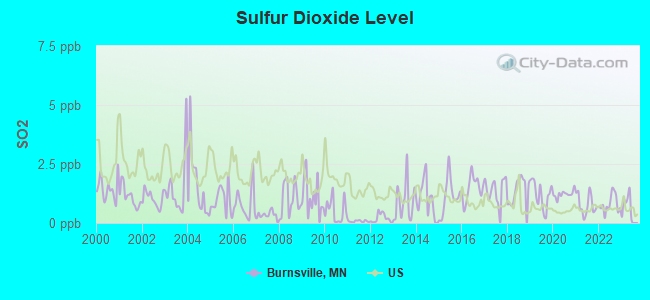
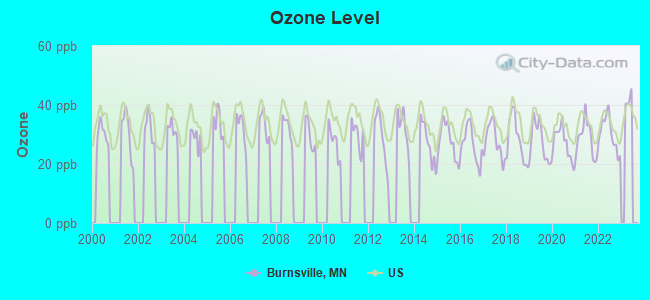
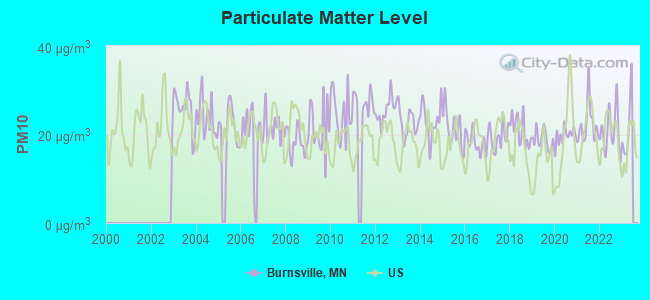
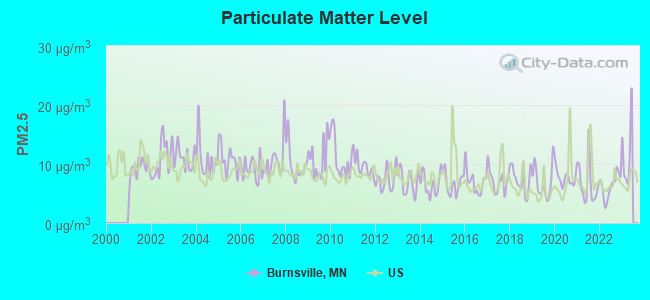
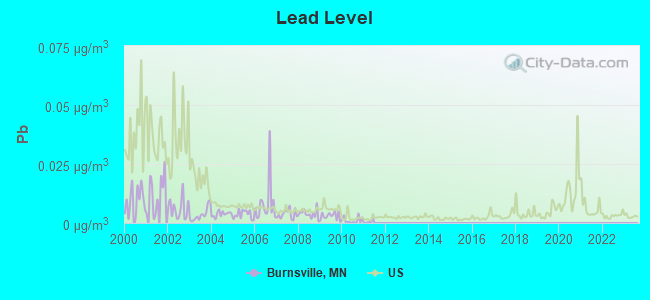

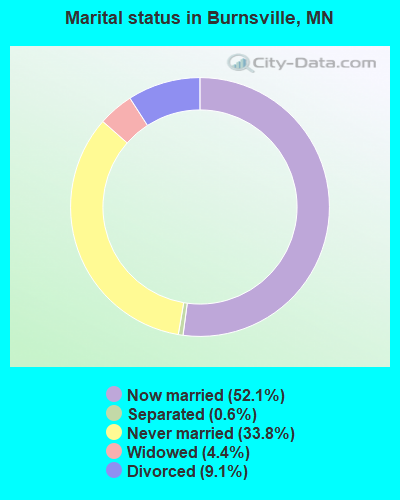
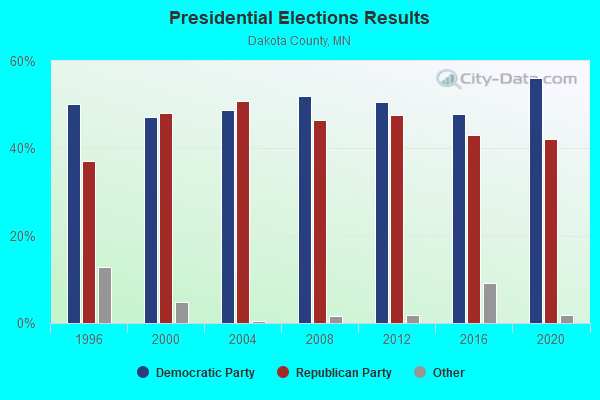
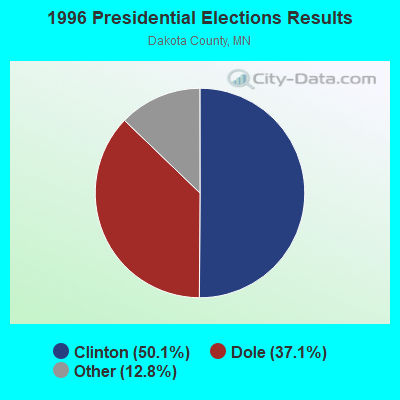
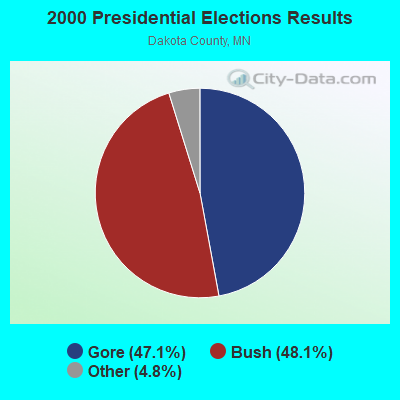
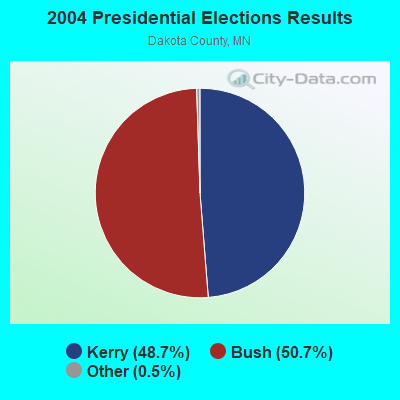
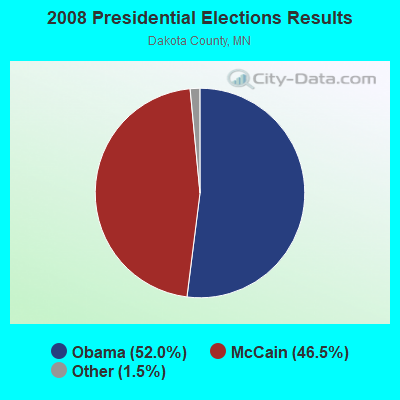
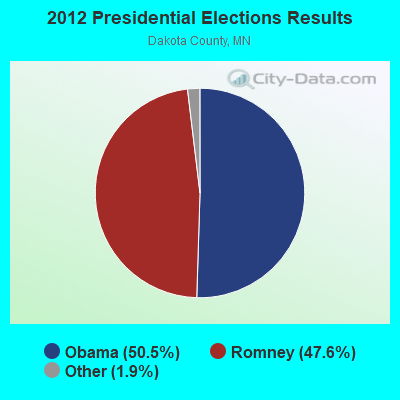
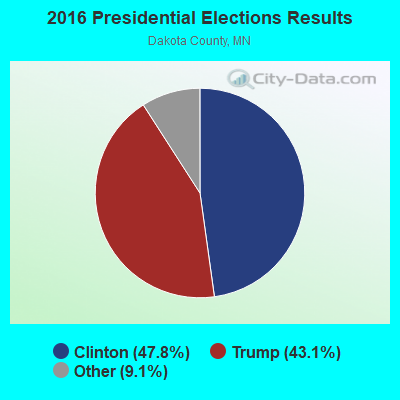
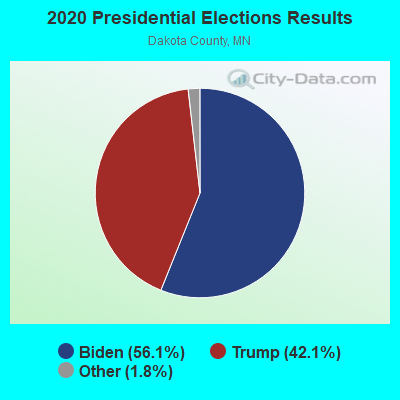
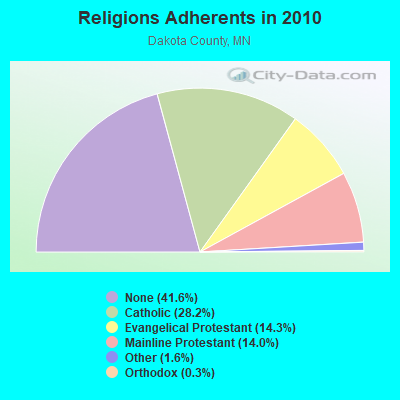
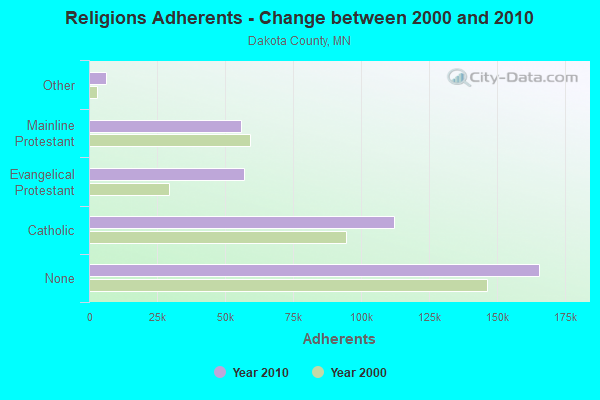
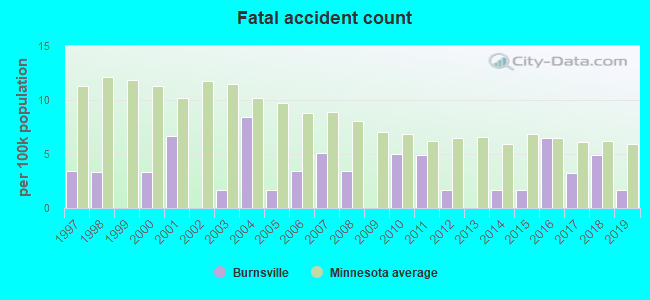
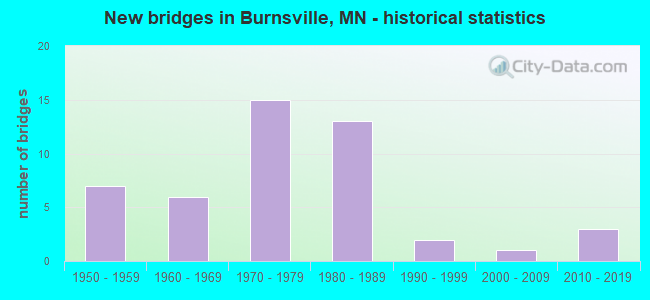
 According to the data from the years 2002 - 2018 the average number of fires per year is 148. The highest number of reported fire incidents - 199 took place in 2007, and the least - 104 in 2018. The data has a declining trend.
 When looking into fire subcategories, the most reports belonged to: Structure Fires (50.1%), and Outside Fires (26.7%).