Rosemount, Minnesota Submit your own pictures of this city and show them to the world
OSM Map
General Map
Google Map
MSN Map
OSM Map
General Map
Google Map
MSN Map
OSM Map
General Map
Google Map
MSN Map
OSM Map
General Map
Google Map
MSN Map
Please wait while loading the map...
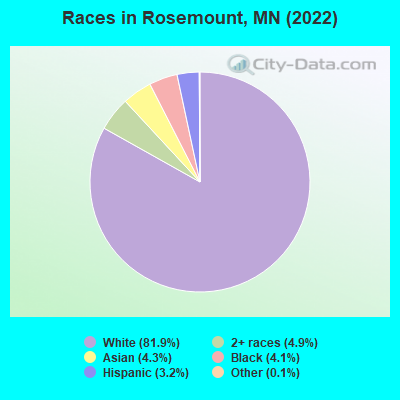
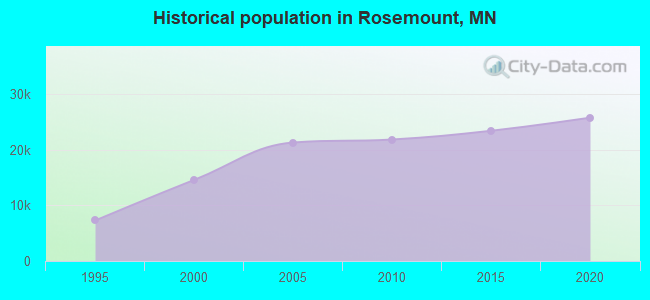
Population in 2022: 27,081 (98% urban, 2% rural). Population change since 2000: +85.2%Males: 13,716 Females: 13,365
March 2022 cost of living index in Rosemount: 113.7 (more than average, U.S. average is 100) Percentage of residents living in poverty in 2022: 1.9%for White Non-Hispanic residents , 1.7% for Black residents , 5.6% for Hispanic or Latino residents , 3.8% for two or more races residents )
Profiles of local businesses
Business Search - 14 Million verified businesses
Data:
Median household income ($)
Median household income (% change since 2000)
Household income diversity
Ratio of average income to average house value (%)
Ratio of average income to average rent
Median household income ($) - White
Median household income ($) - Black or African American
Median household income ($) - Asian
Median household income ($) - Hispanic or Latino
Median household income ($) - American Indian and Alaska Native
Median household income ($) - Multirace
Median household income ($) - Other Race
Median household income for houses/condos with a mortgage ($)
Median household income for apartments without a mortgage ($)
Races - White alone (%)
Races - White alone (% change since 2000)
Races - Black alone (%)
Races - Black alone (% change since 2000)
Races - American Indian alone (%)
Races - American Indian alone (% change since 2000)
Races - Asian alone (%)
Races - Asian alone (% change since 2000)
Races - Hispanic (%)
Races - Hispanic (% change since 2000)
Races - Native Hawaiian and Other Pacific Islander alone (%)
Races - Native Hawaiian and Other Pacific Islander alone (% change since 2000)
Races - Two or more races (%)
Races - Two or more races (% change since 2000)
Races - Other race alone (%)
Races - Other race alone (% change since 2000)
Racial diversity
Unemployment (%)
Unemployment (% change since 2000)
Unemployment (%) - White
Unemployment (%) - Black or African American
Unemployment (%) - Asian
Unemployment (%) - Hispanic or Latino
Unemployment (%) - American Indian and Alaska Native
Unemployment (%) - Multirace
Unemployment (%) - Other Race
Population density (people per square mile)
Population - Males (%)
Population - Females (%)
Population - Males (%) - White
Population - Males (%) - Black or African American
Population - Males (%) - Asian
Population - Males (%) - Hispanic or Latino
Population - Males (%) - American Indian and Alaska Native
Population - Males (%) - Multirace
Population - Males (%) - Other Race
Population - Females (%) - White
Population - Females (%) - Black or African American
Population - Females (%) - Asian
Population - Females (%) - Hispanic or Latino
Population - Females (%) - American Indian and Alaska Native
Population - Females (%) - Multirace
Population - Females (%) - Other Race
Coronavirus confirmed cases (Apr 27, 2024)
Deaths caused by coronavirus (Apr 27, 2024)
Coronavirus confirmed cases (per 100k population) (Apr 27, 2024)
Deaths caused by coronavirus (per 100k population) (Apr 27, 2024)
Daily increase in number of cases (Apr 27, 2024)
Weekly increase in number of cases (Apr 27, 2024)
Cases doubled (in days) (Apr 27, 2024)
Hospitalized patients (Apr 18, 2022)
Negative test results (Apr 18, 2022)
Total test results (Apr 18, 2022)
COVID Vaccine doses distributed (per 100k population) (Sep 19, 2023)
COVID Vaccine doses administered (per 100k population) (Sep 19, 2023)
COVID Vaccine doses distributed (Sep 19, 2023)
COVID Vaccine doses administered (Sep 19, 2023)
Likely homosexual households (%)
Likely homosexual households (% change since 2000)
Likely homosexual households - Lesbian couples (%)
Likely homosexual households - Lesbian couples (% change since 2000)
Likely homosexual households - Gay men (%)
Likely homosexual households - Gay men (% change since 2000)
Cost of living index
Median gross rent ($)
Median contract rent ($)
Median monthly housing costs ($)
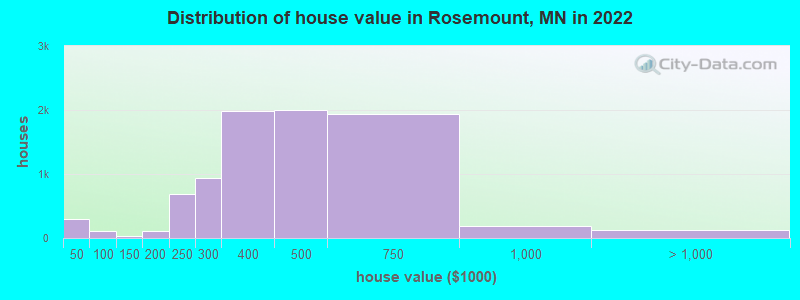
Median house or condo value ($)
Median house or condo value ($ change since 2000)
Mean house or condo value by units in structure - 1, detached ($)
Mean house or condo value by units in structure - 1, attached ($)
Mean house or condo value by units in structure - 2 ($)
Mean house or condo value by units in structure by units in structure - 3 or 4 ($)
Mean house or condo value by units in structure - 5 or more ($)
Mean house or condo value by units in structure - Boat, RV, van, etc. ($)
Mean house or condo value by units in structure - Mobile home ($)
Median house or condo value ($) - White
Median house or condo value ($) - Black or African American
Median house or condo value ($) - Asian
Median house or condo value ($) - Hispanic or Latino
Median house or condo value ($) - American Indian and Alaska Native
Median house or condo value ($) - Multirace
Median house or condo value ($) - Other Race
Median resident age
Resident age diversity
Median resident age - Males
Median resident age - Females
Median resident age - White
Median resident age - Black or African American
Median resident age - Asian
Median resident age - Hispanic or Latino
Median resident age - American Indian and Alaska Native
Median resident age - Multirace
Median resident age - Other Race
Median resident age - Males - White
Median resident age - Males - Black or African American
Median resident age - Males - Asian
Median resident age - Males - Hispanic or Latino
Median resident age - Males - American Indian and Alaska Native
Median resident age - Males - Multirace
Median resident age - Males - Other Race
Median resident age - Females - White
Median resident age - Females - Black or African American
Median resident age - Females - Asian
Median resident age - Females - Hispanic or Latino
Median resident age - Females - American Indian and Alaska Native
Median resident age - Females - Multirace
Median resident age - Females - Other Race
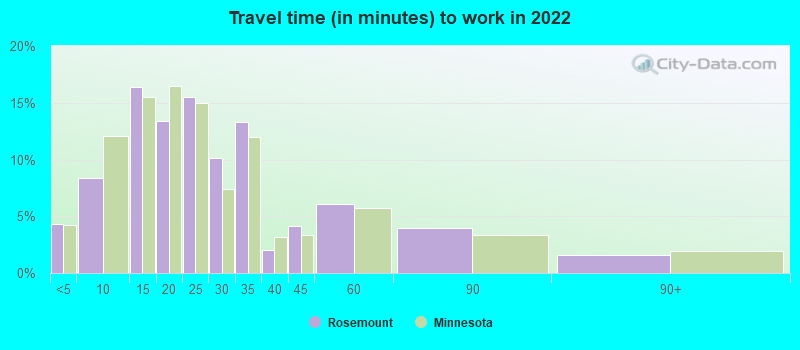
Commute - mean travel time to work (minutes)
Travel time to work - Less than 5 minutes (%)
Travel time to work - Less than 5 minutes (% change since 2000)
Travel time to work - 5 to 9 minutes (%)
Travel time to work - 5 to 9 minutes (% change since 2000)
Travel time to work - 10 to 19 minutes (%)
Travel time to work - 10 to 19 minutes (% change since 2000)
Travel time to work - 20 to 29 minutes (%)
Travel time to work - 20 to 29 minutes (% change since 2000)
Travel time to work - 30 to 39 minutes (%)
Travel time to work - 30 to 39 minutes (% change since 2000)
Travel time to work - 40 to 59 minutes (%)
Travel time to work - 40 to 59 minutes (% change since 2000)
Travel time to work - 60 to 89 minutes (%)
Travel time to work - 60 to 89 minutes (% change since 2000)
Travel time to work - 90 or more minutes (%)
Travel time to work - 90 or more minutes (% change since 2000)
Marital status - Never married (%)
Marital status - Now married (%)
Marital status - Separated (%)
Marital status - Widowed (%)
Marital status - Divorced (%)
Median family income ($)
Median family income (% change since 2000)
Median non-family income ($)
Median non-family income (% change since 2000)
Median per capita income ($)
Median per capita income (% change since 2000)
Median family income ($) - White
Median family income ($) - Black or African American
Median family income ($) - Asian
Median family income ($) - Hispanic or Latino
Median family income ($) - American Indian and Alaska Native
Median family income ($) - Multirace
Median family income ($) - Other Race
Median year house/condo built
Median year apartment built
Year house built - Built 2005 or later (%)
Year house built - Built 2000 to 2004 (%)
Year house built - Built 1990 to 1999 (%)
Year house built - Built 1980 to 1989 (%)
Year house built - Built 1970 to 1979 (%)
Year house built - Built 1960 to 1969 (%)
Year house built - Built 1950 to 1959 (%)
Year house built - Built 1940 to 1949 (%)
Year house built - Built 1939 or earlier (%)
Average household size
Household density (households per square mile)
Average household size - White
Average household size - Black or African American
Average household size - Asian
Average household size - Hispanic or Latino
Average household size - American Indian and Alaska Native
Average household size - Multirace
Average household size - Other Race
Occupied housing units (%)
Vacant housing units (%)
Owner occupied housing units (%)
Renter occupied housing units (%)
Vacancy status - For rent (%)
Vacancy status - For sale only (%)
Vacancy status - Rented or sold, not occupied (%)
Vacancy status - For seasonal, recreational, or occasional use (%)
Vacancy status - For migrant workers (%)
Vacancy status - Other vacant (%)
Residents with income below the poverty level (%)
Residents with income below 50% of the poverty level (%)
Children below poverty level (%)
Poor families by family type - Married-couple family (%)
Poor families by family type - Male, no wife present (%)
Poor families by family type - Female, no husband present (%)
Poverty status for native-born residents (%)
Poverty status for foreign-born residents (%)
Poverty among high school graduates not in families (%)
Poverty among people who did not graduate high school not in families (%)
Residents with income below the poverty level (%) - White
Residents with income below the poverty level (%) - Black or African American
Residents with income below the poverty level (%) - Asian
Residents with income below the poverty level (%) - Hispanic or Latino
Residents with income below the poverty level (%) - American Indian and Alaska Native
Residents with income below the poverty level (%) - Multirace
Residents with income below the poverty level (%) - Other Race
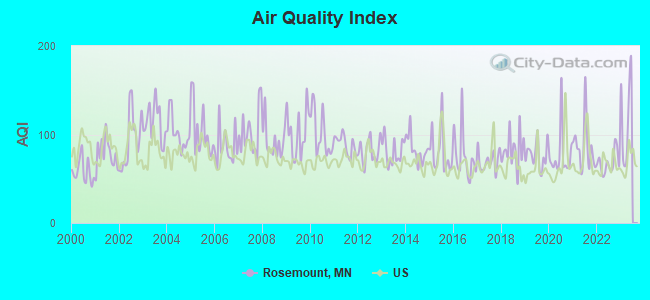
Air pollution - Air Quality Index (AQI)
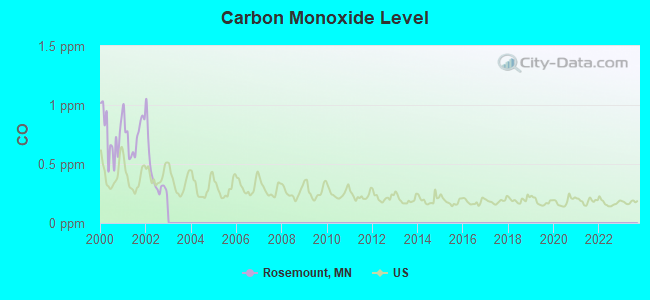
Air pollution - CO
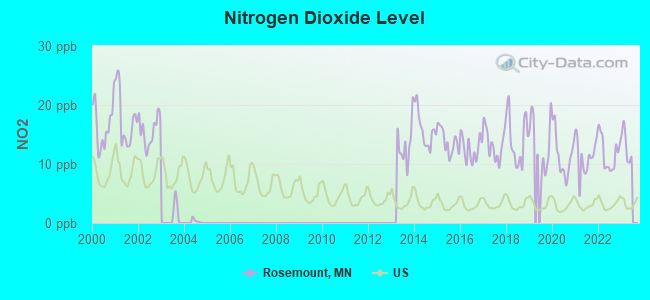
Air pollution - NO2
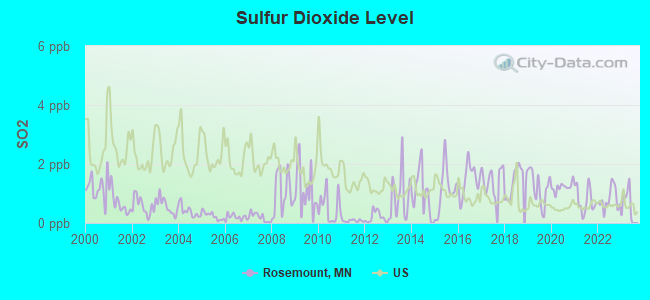
Air pollution - SO2
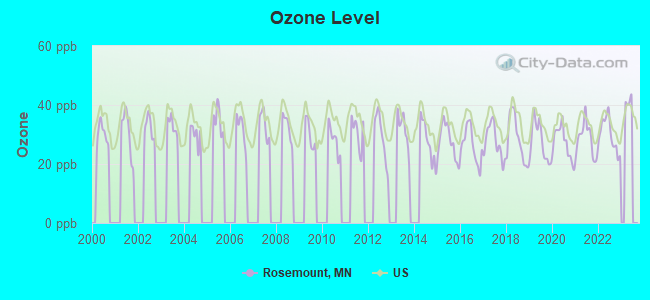
Air pollution - Ozone
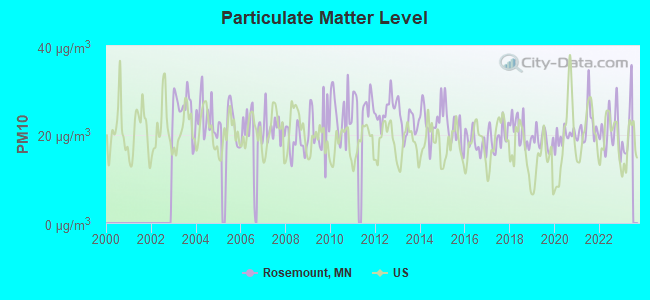
Air pollution - PM10
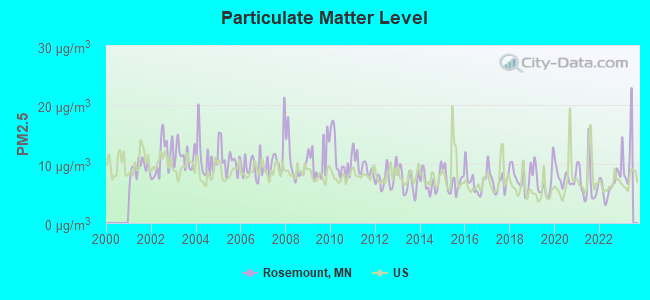
Air pollution - PM25
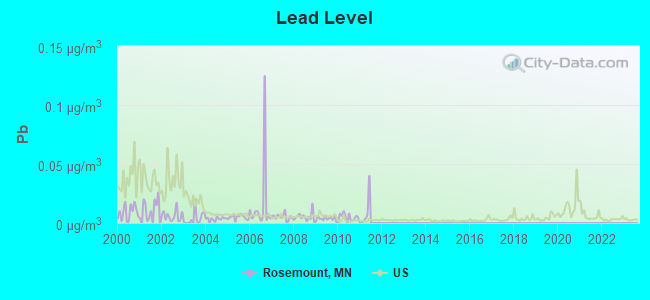
Air pollution - Pb
Crime - Murders per 100,000 population
Crime - Rapes per 100,000 population
Crime - Robberies per 100,000 population
Crime - Assaults per 100,000 population
Crime - Burglaries per 100,000 population
Crime - Thefts per 100,000 population
Crime - Auto thefts per 100,000 population
Crime - Arson per 100,000 population
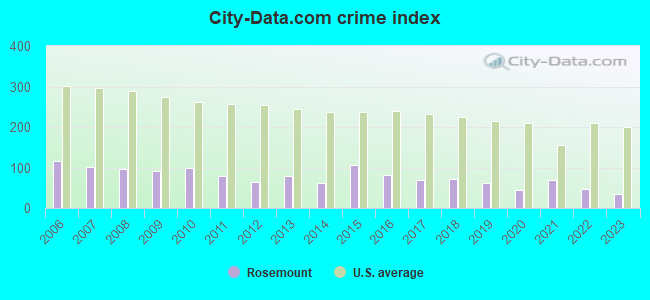
Crime - City-data.com crime index
Crime - Violent crime index
Crime - Property crime index
Crime - Murders per 100,000 population (5 year average)
Crime - Rapes per 100,000 population (5 year average)
Crime - Robberies per 100,000 population (5 year average)
Crime - Assaults per 100,000 population (5 year average)
Crime - Burglaries per 100,000 population (5 year average)
Crime - Thefts per 100,000 population (5 year average)
Crime - Auto thefts per 100,000 population (5 year average)
Crime - Arson per 100,000 population (5 year average)
Crime - City-data.com crime index (5 year average)
Crime - Violent crime index (5 year average)
Crime - Property crime index (5 year average)
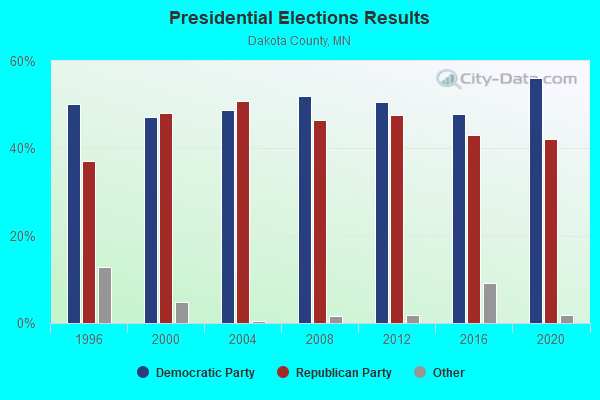
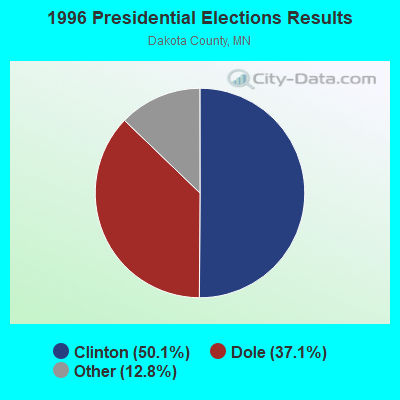
1996 Presidential Elections Results (%) - Democratic Party (Clinton)
1996 Presidential Elections Results (%) - Republican Party (Dole)
1996 Presidential Elections Results (%) - Other
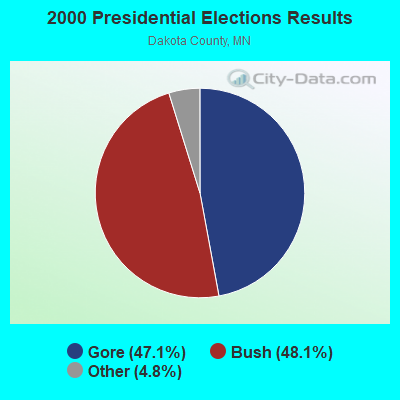
2000 Presidential Elections Results (%) - Democratic Party (Gore)
2000 Presidential Elections Results (%) - Republican Party (Bush)
2000 Presidential Elections Results (%) - Other
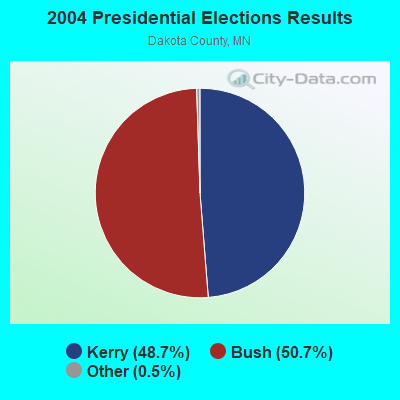
2004 Presidential Elections Results (%) - Democratic Party (Kerry)
2004 Presidential Elections Results (%) - Republican Party (Bush)
2004 Presidential Elections Results (%) - Other
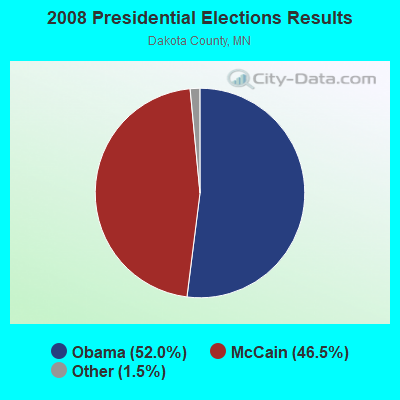
2008 Presidential Elections Results (%) - Democratic Party (Obama)
2008 Presidential Elections Results (%) - Republican Party (McCain)
2008 Presidential Elections Results (%) - Other
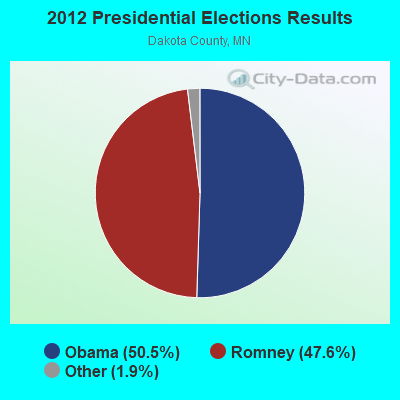
2012 Presidential Elections Results (%) - Democratic Party (Obama)
2012 Presidential Elections Results (%) - Republican Party (Romney)
2012 Presidential Elections Results (%) - Other
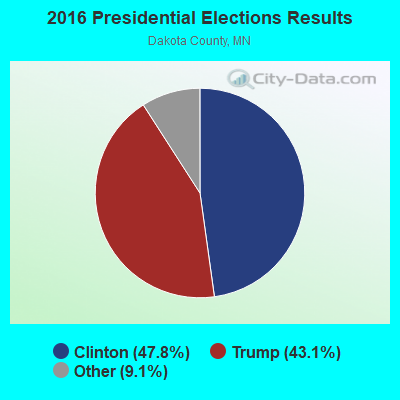
2016 Presidential Elections Results (%) - Democratic Party (Clinton)
2016 Presidential Elections Results (%) - Republican Party (Trump)
2016 Presidential Elections Results (%) - Other
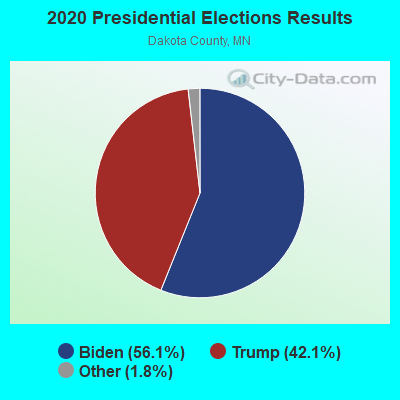
2020 Presidential Elections Results (%) - Democratic Party (Biden)
2020 Presidential Elections Results (%) - Republican Party (Trump)
2020 Presidential Elections Results (%) - Other
Ancestries Reported - Arab (%)
Ancestries Reported - Czech (%)
Ancestries Reported - Danish (%)
Ancestries Reported - Dutch (%)
Ancestries Reported - English (%)
Ancestries Reported - French (%)
Ancestries Reported - French Canadian (%)
Ancestries Reported - German (%)
Ancestries Reported - Greek (%)
Ancestries Reported - Hungarian (%)
Ancestries Reported - Irish (%)
Ancestries Reported - Italian (%)
Ancestries Reported - Lithuanian (%)
Ancestries Reported - Norwegian (%)
Ancestries Reported - Polish (%)
Ancestries Reported - Portuguese (%)
Ancestries Reported - Russian (%)
Ancestries Reported - Scotch-Irish (%)
Ancestries Reported - Scottish (%)
Ancestries Reported - Slovak (%)
Ancestries Reported - Subsaharan African (%)
Ancestries Reported - Swedish (%)
Ancestries Reported - Swiss (%)
Ancestries Reported - Ukrainian (%)
Ancestries Reported - United States (%)
Ancestries Reported - Welsh (%)
Ancestries Reported - West Indian (%)
Ancestries Reported - Other (%)
Educational Attainment - No schooling completed (%)
Educational Attainment - Less than high school (%)
Educational Attainment - High school or equivalent (%)
Educational Attainment - Less than 1 year of college (%)
Educational Attainment - 1 or more years of college (%)
Educational Attainment - Associate degree (%)
Educational Attainment - Bachelor's degree (%)
Educational Attainment - Master's degree (%)
Educational Attainment - Professional school degree (%)
Educational Attainment - Doctorate degree (%)
School Enrollment - Nursery, preschool (%)
School Enrollment - Kindergarten (%)
School Enrollment - Grade 1 to 4 (%)
School Enrollment - Grade 5 to 8 (%)
School Enrollment - Grade 9 to 12 (%)
School Enrollment - College undergrad (%)
School Enrollment - Graduate or professional (%)
School Enrollment - Not enrolled in school (%)
School enrollment - Public schools (%)
School enrollment - Private schools (%)
School enrollment - Not enrolled (%)
Median number of rooms in houses and condos
Median number of rooms in apartments
Housing units lacking complete plumbing facilities (%)
Housing units lacking complete kitchen facilities (%)
Density of houses
Urban houses (%)
Rural houses (%)
Households with people 60 years and over (%)
Households with people 65 years and over (%)
Households with people 75 years and over (%)
Households with one or more nonrelatives (%)
Households with no nonrelatives (%)
Population in households (%)
Family households (%)
Nonfamily households (%)
Population in families (%)
Family households with own children (%)
Median number of bedrooms in owner occupied houses
Mean number of bedrooms in owner occupied houses
Median number of bedrooms in renter occupied houses
Mean number of bedrooms in renter occupied houses
Median number of vehichles in owner occupied houses
Mean number of vehichles in owner occupied houses
Median number of vehichles in renter occupied houses
Mean number of vehichles in renter occupied houses
Mortgage status - with mortgage (%)
Mortgage status - with second mortgage (%)
Mortgage status - with home equity loan (%)
Mortgage status - with both second mortgage and home equity loan (%)
Mortgage status - without a mortgage (%)
Average family size
Average family size - White
Average family size - Black or African American
Average family size - Asian
Average family size - Hispanic or Latino
Average family size - American Indian and Alaska Native
Average family size - Multirace
Average family size - Other Race
Geographical mobility - Same house 1 year ago (%)
Geographical mobility - Moved within same county (%)
Geographical mobility - Moved from different county within same state (%)
Geographical mobility - Moved from different state (%)
Geographical mobility - Moved from abroad (%)
Place of birth - Born in state of residence (%)
Place of birth - Born in other state (%)
Place of birth - Native, outside of US (%)
Place of birth - Foreign born (%)
Housing units in structures - 1, detached (%)
Housing units in structures - 1, attached (%)
Housing units in structures - 2 (%)
Housing units in structures - 3 or 4 (%)
Housing units in structures - 5 to 9 (%)
Housing units in structures - 10 to 19 (%)
Housing units in structures - 20 to 49 (%)
Housing units in structures - 50 or more (%)
Housing units in structures - Mobile home (%)
Housing units in structures - Boat, RV, van, etc. (%)
House/condo owner moved in on average (years ago)
Renter moved in on average (years ago)
Year householder moved into unit - Moved in 1999 to March 2000 (%)
Year householder moved into unit - Moved in 1995 to 1998 (%)
Year householder moved into unit - Moved in 1990 to 1994 (%)
Year householder moved into unit - Moved in 1980 to 1989 (%)
Year householder moved into unit - Moved in 1970 to 1979 (%)
Year householder moved into unit - Moved in 1969 or earlier (%)
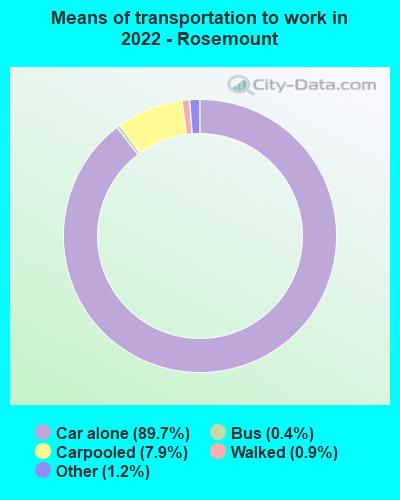
Means of transportation to work - Drove car alone (%)
Means of transportation to work - Carpooled (%)
Means of transportation to work - Public transportation (%)
Means of transportation to work - Bus or trolley bus (%)
Means of transportation to work - Streetcar or trolley car (%)
Means of transportation to work - Subway or elevated (%)
Means of transportation to work - Railroad (%)
Means of transportation to work - Ferryboat (%)
Means of transportation to work - Taxicab (%)
Means of transportation to work - Motorcycle (%)
Means of transportation to work - Bicycle (%)
Means of transportation to work - Walked (%)
Means of transportation to work - Other means (%)
Working at home (%)
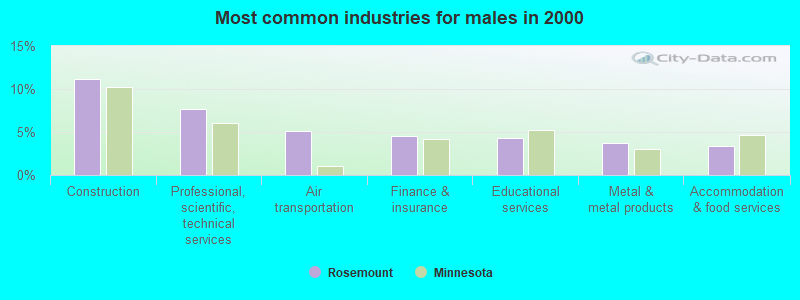
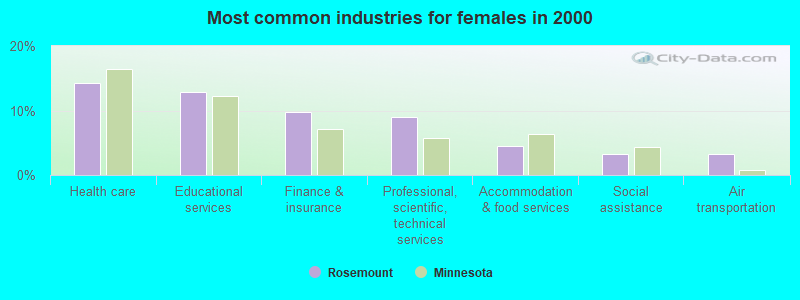
Industry diversity
Most Common Industries - Agriculture, forestry, fishing and hunting, and mining (%)
Most Common Industries - Agriculture, forestry, fishing and hunting (%)
Most Common Industries - Mining, quarrying, and oil and gas extraction (%)
Most Common Industries - Construction (%)
Most Common Industries - Manufacturing (%)
Most Common Industries - Wholesale trade (%)
Most Common Industries - Retail trade (%)
Most Common Industries - Transportation and warehousing, and utilities (%)
Most Common Industries - Transportation and warehousing (%)
Most Common Industries - Utilities (%)
Most Common Industries - Information (%)
Most Common Industries - Finance and insurance, and real estate and rental and leasing (%)
Most Common Industries - Finance and insurance (%)
Most Common Industries - Real estate and rental and leasing (%)
Most Common Industries - Professional, scientific, and management, and administrative and waste management services (%)
Most Common Industries - Professional, scientific, and technical services (%)
Most Common Industries - Management of companies and enterprises (%)
Most Common Industries - Administrative and support and waste management services (%)
Most Common Industries - Educational services, and health care and social assistance (%)
Most Common Industries - Educational services (%)
Most Common Industries - Health care and social assistance (%)
Most Common Industries - Arts, entertainment, and recreation, and accommodation and food services (%)
Most Common Industries - Arts, entertainment, and recreation (%)
Most Common Industries - Accommodation and food services (%)
Most Common Industries - Other services, except public administration (%)
Most Common Industries - Public administration (%)
Occupation diversity
Most Common Occupations - Management, business, science, and arts occupations (%)
Most Common Occupations - Management, business, and financial occupations (%)
Most Common Occupations - Management occupations (%)
Most Common Occupations - Business and financial operations occupations (%)
Most Common Occupations - Computer, engineering, and science occupations (%)
Most Common Occupations - Computer and mathematical occupations (%)
Most Common Occupations - Architecture and engineering occupations (%)
Most Common Occupations - Life, physical, and social science occupations (%)
Most Common Occupations - Education, legal, community service, arts, and media occupations (%)
Most Common Occupations - Community and social service occupations (%)
Most Common Occupations - Legal occupations (%)
Most Common Occupations - Education, training, and library occupations (%)
Most Common Occupations - Arts, design, entertainment, sports, and media occupations (%)
Most Common Occupations - Healthcare practitioners and technical occupations (%)
Most Common Occupations - Health diagnosing and treating practitioners and other technical occupations (%)
Most Common Occupations - Health technologists and technicians (%)
Most Common Occupations - Service occupations (%)
Most Common Occupations - Healthcare support occupations (%)
Most Common Occupations - Protective service occupations (%)
Most Common Occupations - Fire fighting and prevention, and other protective service workers including supervisors (%)
Most Common Occupations - Law enforcement workers including supervisors (%)
Most Common Occupations - Food preparation and serving related occupations (%)
Most Common Occupations - Building and grounds cleaning and maintenance occupations (%)
Most Common Occupations - Personal care and service occupations (%)
Most Common Occupations - Sales and office occupations (%)
Most Common Occupations - Sales and related occupations (%)
Most Common Occupations - Office and administrative support occupations (%)
Most Common Occupations - Natural resources, construction, and maintenance occupations (%)
Most Common Occupations - Farming, fishing, and forestry occupations (%)
Most Common Occupations - Construction and extraction occupations (%)
Most Common Occupations - Installation, maintenance, and repair occupations (%)
Most Common Occupations - Production, transportation, and material moving occupations (%)
Most Common Occupations - Production occupations (%)
Most Common Occupations - Transportation occupations (%)
Most Common Occupations - Material moving occupations (%)
People in Group quarters - Institutionalized population (%)
People in Group quarters - Correctional institutions (%)
People in Group quarters - Federal prisons and detention centers (%)
People in Group quarters - Halfway houses (%)
People in Group quarters - Local jails and other confinement facilities (including police lockups) (%)
People in Group quarters - Military disciplinary barracks (%)
People in Group quarters - State prisons (%)
People in Group quarters - Other types of correctional institutions (%)
People in Group quarters - Nursing homes (%)
People in Group quarters - Hospitals/wards, hospices, and schools for the handicapped (%)
People in Group quarters - Hospitals/wards and hospices for chronically ill (%)
People in Group quarters - Hospices or homes for chronically ill (%)
People in Group quarters - Military hospitals or wards for chronically ill (%)
People in Group quarters - Other hospitals or wards for chronically ill (%)
People in Group quarters - Hospitals or wards for drug/alcohol abuse (%)
People in Group quarters - Mental (Psychiatric) hospitals or wards (%)
People in Group quarters - Schools, hospitals, or wards for the mentally retarded (%)
People in Group quarters - Schools, hospitals, or wards for the physically handicapped (%)
People in Group quarters - Institutions for the deaf (%)
People in Group quarters - Institutions for the blind (%)
People in Group quarters - Orthopedic wards and institutions for the physically handicapped (%)
People in Group quarters - Wards in general hospitals for patients who have no usual home elsewhere (%)
People in Group quarters - Wards in military hospitals for patients who have no usual home elsewhere (%)
People in Group quarters - Juvenile institutions (%)
People in Group quarters - Long-term care (%)
People in Group quarters - Homes for abused, dependent, and neglected children (%)
People in Group quarters - Residential treatment centers for emotionally disturbed children (%)
People in Group quarters - Training schools for juvenile delinquents (%)
People in Group quarters - Short-term care, detention or diagnostic centers for delinquent children (%)
People in Group quarters - Type of juvenile institution unknown (%)
People in Group quarters - Noninstitutionalized population (%)
People in Group quarters - College dormitories (includes college quarters off campus) (%)
People in Group quarters - Military quarters (%)
People in Group quarters - On base (%)
People in Group quarters - Barracks, unaccompanied personnel housing (UPH), (Enlisted/Officer), ;and similar group living quarters for military personnel (%)
People in Group quarters - Transient quarters for temporary residents (%)
People in Group quarters - Military ships (%)
People in Group quarters - Group homes (%)
People in Group quarters - Homes or halfway houses for drug/alcohol abuse (%)
People in Group quarters - Homes for the mentally ill (%)
People in Group quarters - Homes for the mentally retarded (%)
People in Group quarters - Homes for the physically handicapped (%)
People in Group quarters - Other group homes (%)
People in Group quarters - Religious group quarters (%)
People in Group quarters - Dormitories (%)
People in Group quarters - Agriculture workers' dormitories on farms (%)
People in Group quarters - Job Corps and vocational training facilities (%)
People in Group quarters - Other workers' dormitories (%)
People in Group quarters - Crews of maritime vessels (%)
People in Group quarters - Other nonhousehold living situations (%)
People in Group quarters - Other noninstitutional group quarters (%)
Residents speaking English at home (%)
Residents speaking English at home - Born in the United States (%)
Residents speaking English at home - Native, born elsewhere (%)
Residents speaking English at home - Foreign born (%)
Residents speaking Spanish at home (%)
Residents speaking Spanish at home - Born in the United States (%)
Residents speaking Spanish at home - Native, born elsewhere (%)
Residents speaking Spanish at home - Foreign born (%)
Residents speaking other language at home (%)
Residents speaking other language at home - Born in the United States (%)
Residents speaking other language at home - Native, born elsewhere (%)
Residents speaking other language at home - Foreign born (%)
Class of Workers - Employee of private company (%)
Class of Workers - Self-employed in own incorporated business (%)
Class of Workers - Private not-for-profit wage and salary workers (%)
Class of Workers - Local government workers (%)
Class of Workers - State government workers (%)
Class of Workers - Federal government workers (%)
Class of Workers - Self-employed workers in own not incorporated business and Unpaid family workers (%)
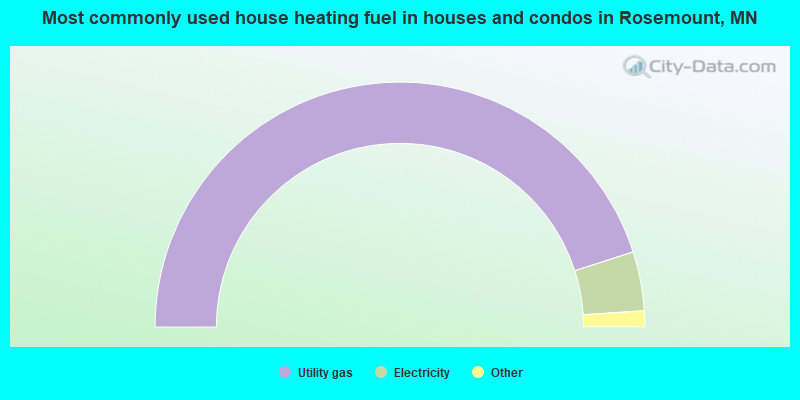
House heating fuel used in houses and condos - Utility gas (%)
House heating fuel used in houses and condos - Bottled, tank, or LP gas (%)
House heating fuel used in houses and condos - Electricity (%)
House heating fuel used in houses and condos - Fuel oil, kerosene, etc. (%)
House heating fuel used in houses and condos - Coal or coke (%)
House heating fuel used in houses and condos - Wood (%)
House heating fuel used in houses and condos - Solar energy (%)
House heating fuel used in houses and condos - Other fuel (%)
House heating fuel used in houses and condos - No fuel used (%)
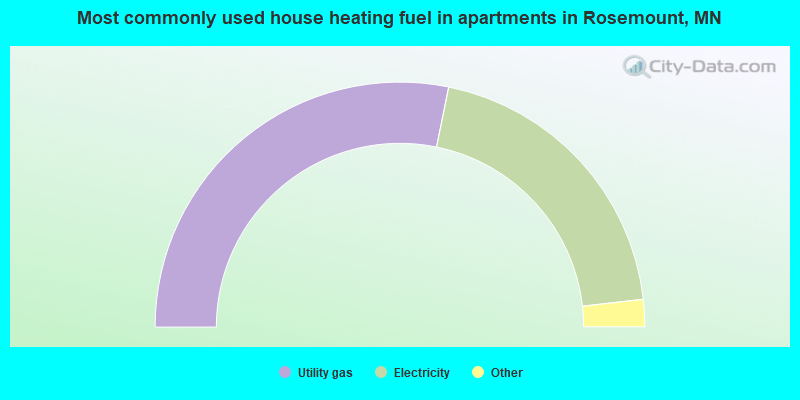
House heating fuel used in apartments - Utility gas (%)
House heating fuel used in apartments - Bottled, tank, or LP gas (%)
House heating fuel used in apartments - Electricity (%)
House heating fuel used in apartments - Fuel oil, kerosene, etc. (%)
House heating fuel used in apartments - Coal or coke (%)
House heating fuel used in apartments - Wood (%)
House heating fuel used in apartments - Solar energy (%)
House heating fuel used in apartments - Other fuel (%)
House heating fuel used in apartments - No fuel used (%)
Armed forces status - In Armed Forces (%)
Armed forces status - Civilian (%)
Armed forces status - Civilian - Veteran (%)
Armed forces status - Civilian - Nonveteran (%)
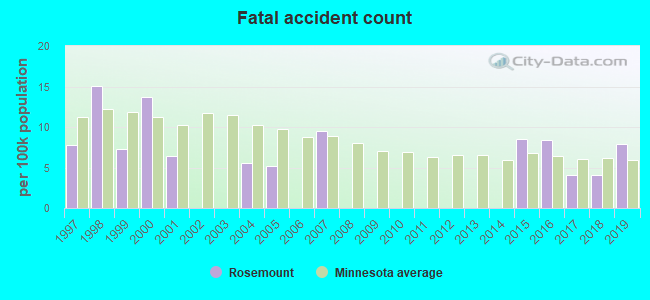
Fatal accidents locations in years 2005-2021
Fatal accidents locations in 2005
Fatal accidents locations in 2006
Fatal accidents locations in 2007
Fatal accidents locations in 2008
Fatal accidents locations in 2009
Fatal accidents locations in 2010
Fatal accidents locations in 2011
Fatal accidents locations in 2012
Fatal accidents locations in 2013
Fatal accidents locations in 2014
Fatal accidents locations in 2015
Fatal accidents locations in 2016
Fatal accidents locations in 2017
Fatal accidents locations in 2018
Fatal accidents locations in 2019
Fatal accidents locations in 2020
Fatal accidents locations in 2021
Alcohol use - People drinking some alcohol every month (%)
Alcohol use - People not drinking at all (%)
Alcohol use - Average days/month drinking alcohol
Alcohol use - Average drinks/week
Alcohol use - Average days/year people drink much
Audiometry - Average condition of hearing (%)
Audiometry - People that can hear a whisper from across a quiet room (%)
Audiometry - People that can hear normal voice from across a quiet room (%)
Audiometry - Ears ringing, roaring, buzzing (%)
Audiometry - Had a job exposure to loud noise (%)
Audiometry - Had off-work exposure to loud noise (%)
Blood Pressure & Cholesterol - Has high blood pressure (%)
Blood Pressure & Cholesterol - Checking blood pressure at home (%)
Blood Pressure & Cholesterol - Frequently checking blood cholesterol (%)
Blood Pressure & Cholesterol - Has high cholesterol level (%)
Consumer Behavior - Money monthly spent on food at supermarket/grocery store
Consumer Behavior - Money monthly spent on food at other stores
Consumer Behavior - Money monthly spent on eating out
Consumer Behavior - Money monthly spent on carryout/delivered foods
Consumer Behavior - Income spent on food at supermarket/grocery store (%)
Consumer Behavior - Income spent on food at other stores (%)
Consumer Behavior - Income spent on eating out (%)
Consumer Behavior - Income spent on carryout/delivered foods (%)
Current Health Status - General health condition (%)
Current Health Status - Blood donors (%)
Current Health Status - Has blood ever tested for HIV virus (%)
Current Health Status - Left-handed people (%)
Dermatology - People using sunscreen (%)
Diabetes - Diabetics (%)
Diabetes - Had a blood test for high blood sugar (%)
Diabetes - People taking insulin (%)
Diet Behavior & Nutrition - Diet health (%)
Diet Behavior & Nutrition - Milk product consumption (# of products/month)
Diet Behavior & Nutrition - Meals not home prepared (#/week)
Diet Behavior & Nutrition - Meals from fast food or pizza place (#/week)
Diet Behavior & Nutrition - Ready-to-eat foods (#/month)
Diet Behavior & Nutrition - Frozen meals/pizza (#/month)
Drug Use - People that ever used marijuana or hashish (%)
Drug Use - Ever used hard drugs (%)
Drug Use - Ever used any form of cocaine (%)
Drug Use - Ever used heroin (%)
Drug Use - Ever used methamphetamine (%)
Health Insurance - People covered by health insurance (%)
Kidney Conditions-Urology - Avg. # of times urinating at night
Medical Conditions - People with asthma (%)
Medical Conditions - People with anemia (%)
Medical Conditions - People with psoriasis (%)
Medical Conditions - People with overweight (%)
Medical Conditions - Elderly people having difficulties in thinking or remembering (%)
Medical Conditions - People who ever received blood transfusion (%)
Medical Conditions - People having trouble seeing even with glass/contacts (%)
Medical Conditions - People with arthritis (%)
Medical Conditions - People with gout (%)
Medical Conditions - People with congestive heart failure (%)
Medical Conditions - People with coronary heart disease (%)
Medical Conditions - People with angina pectoris (%)
Medical Conditions - People who ever had heart attack (%)
Medical Conditions - People who ever had stroke (%)
Medical Conditions - People with emphysema (%)
Medical Conditions - People with thyroid problem (%)
Medical Conditions - People with chronic bronchitis (%)
Medical Conditions - People with any liver condition (%)
Medical Conditions - People who ever had cancer or malignancy (%)
Mental Health - People who have little interest in doing things (%)
Mental Health - People feeling down, depressed, or hopeless (%)
Mental Health - People who have trouble sleeping or sleeping too much (%)
Mental Health - People feeling tired or having little energy (%)
Mental Health - People with poor appetite or overeating (%)
Mental Health - People feeling bad about themself (%)
Mental Health - People who have trouble concentrating on things (%)
Mental Health - People moving or speaking slowly or too fast (%)
Mental Health - People having thoughts they would be better off dead (%)
Oral Health - Average years since last visit a dentist
Oral Health - People embarrassed because of mouth (%)
Oral Health - People with gum disease (%)
Oral Health - General health of teeth and gums (%)
Oral Health - Average days a week using dental floss/device
Oral Health - Average days a week using mouthwash for dental problem
Oral Health - Average number of teeth
Pesticide Use - Households using pesticides to control insects (%)
Pesticide Use - Households using pesticides to kill weeds (%)
Physical Activity - People doing vigorous-intensity work activities (%)
Physical Activity - People doing moderate-intensity work activities (%)
Physical Activity - People walking or bicycling (%)
Physical Activity - People doing vigorous-intensity recreational activities (%)
Physical Activity - People doing moderate-intensity recreational activities (%)
Physical Activity - Average hours a day doing sedentary activities
Physical Activity - Average hours a day watching TV or videos
Physical Activity - Average hours a day using computer
Physical Functioning - People having limitations keeping them from working (%)
Physical Functioning - People limited in amount of work they can do (%)
Physical Functioning - People that need special equipment to walk (%)
Physical Functioning - People experiencing confusion/memory problems (%)
Physical Functioning - People requiring special healthcare equipment (%)
Prescription Medications - Average number of prescription medicines taking
Preventive Aspirin Use - Adults 40+ taking low-dose aspirin (%)
Reproductive Health - Vaginal deliveries (%)
Reproductive Health - Cesarean deliveries (%)
Reproductive Health - Deliveries resulted in a live birth (%)
Reproductive Health - Pregnancies resulted in a delivery (%)
Reproductive Health - Women breastfeeding newborns (%)
Reproductive Health - Women that had a hysterectomy (%)
Reproductive Health - Women that had both ovaries removed (%)
Reproductive Health - Women that have ever taken birth control pills (%)
Reproductive Health - Women taking birth control pills (%)
Reproductive Health - Women that have ever used Depo-Provera or injectables (%)
Reproductive Health - Women that have ever used female hormones (%)
Sexual Behavior - People 18+ that ever had sex (vaginal, anal, or oral) (%)
Sexual Behavior - Males 18+ that ever had vaginal sex with a woman (%)
Sexual Behavior - Males 18+ that ever performed oral sex on a woman (%)
Sexual Behavior - Males 18+ that ever had anal sex with a woman (%)
Sexual Behavior - Males 18+ that ever had any sex with a man (%)
Sexual Behavior - Females 18+ that ever had vaginal sex with a man (%)
Sexual Behavior - Females 18+ that ever performed oral sex on a man (%)
Sexual Behavior - Females 18+ that ever had anal sex with a man (%)
Sexual Behavior - Females 18+ that ever had any kind of sex with a woman (%)
Sexual Behavior - Average age people first had sex
Sexual Behavior - Average number of female sex partners in lifetime (males 18+)
Sexual Behavior - Average number of female vaginal sex partners in lifetime (males 18+)
Sexual Behavior - Average age people first performed oral sex on a woman (18+)
Sexual Behavior - Average number of woman performed oral sex on in lifetime (18+)
Sexual Behavior - Average number of male sex partners in lifetime (males 18+)
Sexual Behavior - Average number of male anal sex partners in lifetime (males 18+)
Sexual Behavior - Average age people first performed oral sex on a man (18+)
Sexual Behavior - Average number of male oral sex partners in lifetime (18+)
Sexual Behavior - People using protection when performing oral sex (%)
Sexual Behavior - Average number of times people have vaginal or anal sex a year
Sexual Behavior - People having sex without condom (%)
Sexual Behavior - Average number of male sex partners in lifetime (females 18+)
Sexual Behavior - Average number of male vaginal sex partners in lifetime (females 18+)
Sexual Behavior - Average number of female sex partners in lifetime (females 18+)
Sexual Behavior - Circumcised males 18+ (%)
Sleep Disorders - Average hours sleeping at night
Sleep Disorders - People that has trouble sleeping (%)
Smoking-Cigarette Use - People smoking cigarettes (%)
Taste & Smell - People 40+ having problems with smell (%)
Taste & Smell - People 40+ having problems with taste (%)
Taste & Smell - People 40+ that ever had wisdom teeth removed (%)
Taste & Smell - People 40+ that ever had tonsils teeth removed (%)
Taste & Smell - People 40+ that ever had a loss of consciousness because of a head injury (%)
Taste & Smell - People 40+ that ever had a broken nose or other serious injury to face or skull (%)
Taste & Smell - People 40+ that ever had two or more sinus infections (%)
Weight - Average height (inches)
Weight - Average weight (pounds)
Weight - Average BMI
Weight - People that are obese (%)
Weight - People that ever were obese (%)
Weight - People trying to lose weight (%)
Officers per 1,000 residents here:
1.11Minnesota average:
1.76
Latest news from Rosemount, MN collected exclusively by city-data.com from local newspapers, TV, and radio stations
Rosemount, MN City Guides: Ancestries: German (25.7%), American (7.4%), Norwegian (6.6%), European (6.0%), Irish (5.2%), Swedish (3.6%).
Current Local Time:
Land area: 33.7 square miles.
Population density: 804 people per square mile (low).
1,569 residents are foreign born (2.7% Asia , 1.3% Latin America , 1.2% Africa ).
This city:
6.0%Minnesota:
8.5%
Median real estate property taxes paid for housing units with mortgages in 2022: $3,932 (1.0%)Median real estate property taxes paid for housing units with no mortgage in 2022: $3,717 (1.0%)
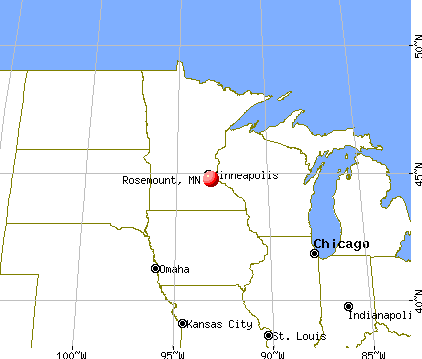
Nearest city with pop. 50,000+: Eagan, MN
Nearest city with pop. 200,000+: St. Paul, MN
Nearest city with pop. 1,000,000+: Chicago, IL
Nearest cities:
Coates, MN (2.1 miles),
Pine Bend, MN (2.2 miles),
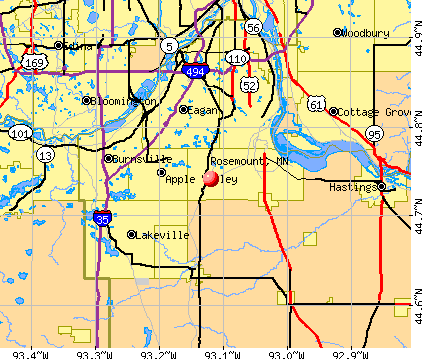
Latitude: 44.74 N, Longitude: 93.12 W
Daytime population change due to commuting: -3,581 (-13.6%)Workers who live and work in this city: 4,633 (32.2%)
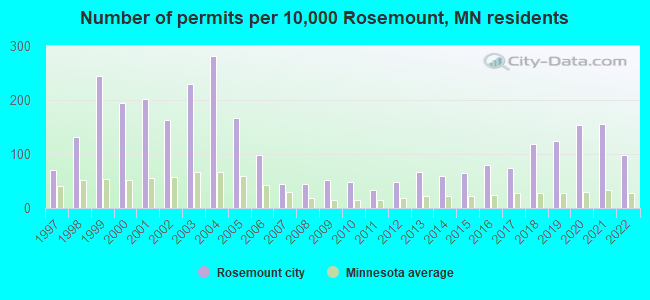
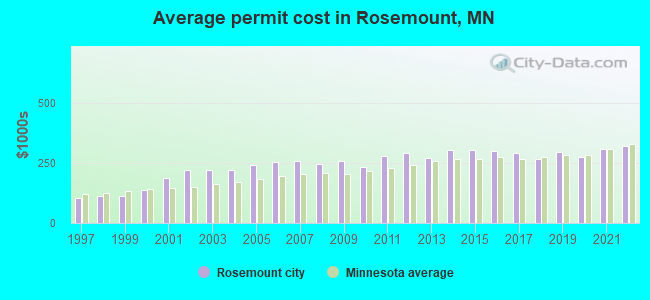
Single-family new house construction building permits:
2022: 144 buildings , average cost: $323,4002021: 226 buildings , average cost: $311,0002020: 223 buildings , average cost: $277,6002019: 181 buildings , average cost: $298,3002018: 174 buildings , average cost: $269,1002017: 110 buildings , average cost: $293,7002016: 115 buildings , average cost: $300,2002015: 93 buildings , average cost: $306,0002014: 86 buildings , average cost: $305,7002013: 96 buildings , average cost: $272,3002012: 72 buildings , average cost: $294,1002011: 49 buildings , average cost: $278,6002010: 72 buildings , average cost: $235,2002009: 74 buildings , average cost: $259,3002008: 64 buildings , average cost: $247,1002007: 66 buildings , average cost: $257,5002006: 145 buildings , average cost: $255,8002005: 244 buildings , average cost: $243,1002004: 411 buildings , average cost: $221,8002003: 335 buildings , average cost: $220,5002002: 238 buildings , average cost: $222,9002001: 295 buildings , average cost: $188,5002000: 285 buildings , average cost: $137,1001999: 357 buildings , average cost: $114,2001998: 191 buildings , average cost: $114,3001997: 102 buildings , average cost: $103,000Unemployment in December 2023:
Population change in the 1990s: +5,937 (+68.4%).
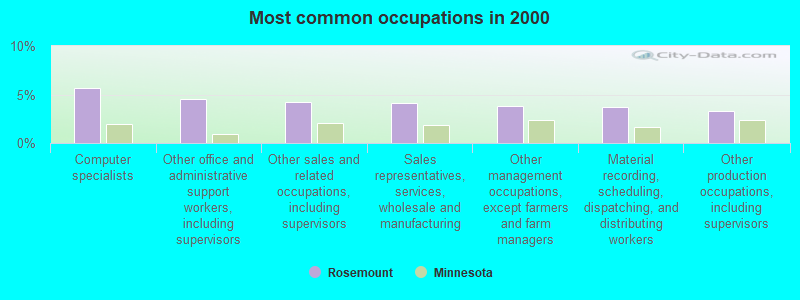
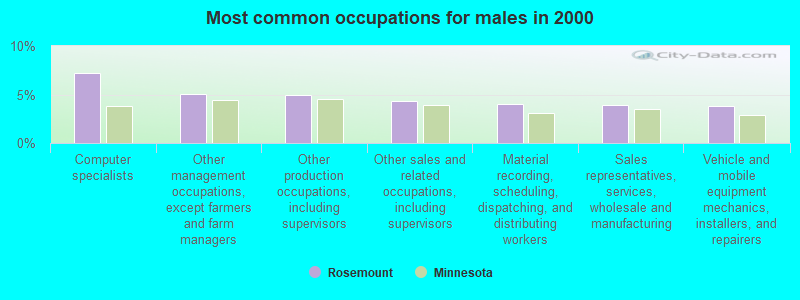
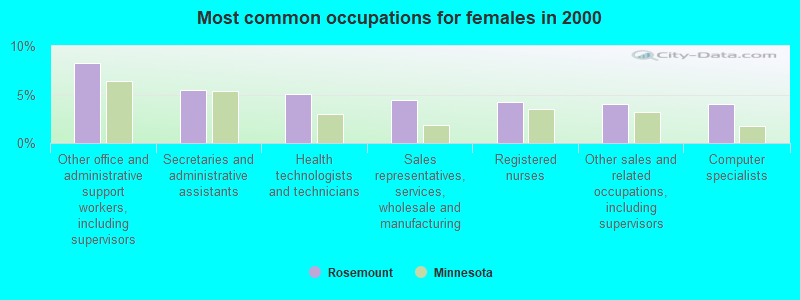
Most common occupations in Rosemount, MN (%)
Both Males Females
Computer specialists (5.7%)
Other office and administrative support workers, including supervisors (4.6%)
Other sales and related occupations, including supervisors (4.2%)
Sales representatives, services, wholesale and manufacturing (4.2%)
Other management occupations, except farmers and farm managers (3.8%)
Material recording, scheduling, dispatching, and distributing workers (3.7%)
Other production occupations, including supervisors (3.3%)
Computer specialists (7.2%)
Other management occupations, except farmers and farm managers (5.0%)
Other production occupations, including supervisors (5.0%)
Other sales and related occupations, including supervisors (4.3%)
Material recording, scheduling, dispatching, and distributing workers (4.1%)
Sales representatives, services, wholesale and manufacturing (3.9%)
Vehicle and mobile equipment mechanics, installers, and repairers (3.8%)
Other office and administrative support workers, including supervisors (8.3%)
Secretaries and administrative assistants (5.4%)
Health technologists and technicians (5.0%)
Sales representatives, services, wholesale and manufacturing (4.4%)
Registered nurses (4.2%)
Other sales and related occupations, including supervisors (4.1%)
Computer specialists (4.0%)
Tornado activity:
Rosemount-area historical tornado activity is slightly above Minnesota state average. It is 33% greater than the overall U.S. average.
On 5/6/1965, a category F4 (max. wind speeds 207-260 mph) tornado 20.9 miles away from the Rosemount city center killed 6 people and injured 158 people and caused between $5,000,000 and $50,000,000 in damages.
On 5/6/1965, a category F4 tornado 21.5 miles away from the city center killed 3 people and injured 175 people and caused between $5,000,000 and $50,000,000 in damages.
Earthquake activity:
Rosemount-area historical earthquake activity is significantly above Minnesota state average. It is 57% smaller than the overall U.S. average. On 7/9/1975 at 14:54:15, a magnitude 4.6 (4.6 MB, Class: Light, Intensity: IV - V) earthquake occurred 156.2 miles away from Rosemount center On 6/5/1993 at 01:24:53, a magnitude 4.1 (4.1 LG, Depth: 6.2 mi) earthquake occurred 167.6 miles away from the city center On 3/4/1983 at 06:32:18, a magnitude 4.6 (4.4 MB, 4.6 LG, 4.4 ML) earthquake occurred 312.5 miles away from the city center On 10/20/1995 at 15:57:18, a magnitude 3.7 (3.7 LG, Depth: 3.1 mi, Class: Light, Intensity: II - III) earthquake occurred 196.1 miles away from the city center On 2/9/1994 at 08:45:35, a magnitude 3.1 (3.1 LG, Depth: 3.1 mi) earthquake occurred 93.9 miles away from the city center On 11/3/2002 at 20:41:56, a magnitude 4.3 (4.3 MB, Depth: 3.1 mi) earthquake occurred 319.1 miles away from the city center Magnitude types: regional Lg-wave magnitude (LG), body-wave magnitude (MB), local magnitude (ML) Natural disasters: The number of natural disasters in Dakota County (15) is near the US average (15).Major Disasters (Presidential) Declared: 11Emergencies Declared: 3Floods: 11, Storms: 7, Tornadoes: 5, Drought: 1, Hurricane: 1, Wind: 1, Other: 1 (Note: some incidents may be assigned to more than one category). Hospitals and medical centers near Rosemount: APPLE VALLEY HEALTH CARE CENTER (Nursing Home, about 5 miles away; APPLE VALLEY, MN)
AUGUSTANA HCC OF APPLE VALLEY (Nursing Home, about 5 miles away; APPLE VALLEY, MN)
ALLIANCE HEALTH SERVICES INC (Home Health Center, about 7 miles away; EAGAN, MN)
DCI KENNELLY (Hospital, about 7 miles away; BURNSVILLE, MN)
TRINITY HOSPITAL (Hospital, about 7 miles away; FARMINGTON, MN)
TRINITY CARE CENTER (Nursing Home, about 7 miles away; FARMINGTON, MN)
BURNSVILLE DIALYSIS OF DAVITA (Dialysis Facility, about 8 miles away; BURNSVILLE, MN)
Amtrak station near Rosemount: 16 miles: ST. PAUL/MINNEAPOLIS (ST. PAUL, 730 TRANSFER RD.) Services: ticket office, fully wheelchair accessible, enclosed waiting area, public restrooms, public payphones, vending machines, free short-term parking, free long-term parking, call for car rental service, taxi stand.
College/University in Rosemount: Dakota County Technical College Full-time enrollment: 2,478; Location: 1300 145th Street East; Public; Website: www.dctc.edu/)
Other colleges/universities with over 2000 students near Rosemount:
Inver Hills Community College (about 7 miles; Inver Grove Heights, MN ; Full-time enrollment: 4,049)
Normandale Community College (about 13 miles; Bloomington, MN ; FT enrollment: 7,048)
St Catherine University (about 14 miles; Saint Paul, MN ; FT enrollment: 3,771)
Macalester College (about 14 miles; Saint Paul, MN ; FT enrollment: 2,174)
University of St Thomas (about 15 miles; Saint Paul, MN ; FT enrollment: 8,762)
Saint Paul College (about 15 miles; Saint Paul, MN ; FT enrollment: 4,778)
Concordia University-Saint Paul (about 15 miles; Saint Paul, MN ; FT enrollment: 2,501)
Public high schools in Rosemount:
Public elementary/middle schools in Rosemount:
Private elementary/middle schools in Rosemount:
See full list of schools located in Rosemount
Notable locations in Rosemount: (A) , Rich Valley Golf Course (B) , Rosemount Fire Department Station 2 (C) , Rosemount Fire Department Station 1 Headquarters (D) . Display/hide their locations on the map
Shopping Centers: (1) , Rosemount Market Square Shopping Center (2) . Display/hide their locations on the map
Church in Rosemount: (A) . Display/hide its location on the map
Cemeteries: (1) , Saint Johns Cemetery (2) , Saint Joseph Cemetery (3) . Display/hide their locations on the map
Lake: (A) . Display/hide its location on the map
Parks in Rosemount include: (1) , Bloomfield Park (2) , Birch Park (3) , Kerrow Kell Hill Park (4) , Innistree Park (5) , Winds Park (6) , Claret Park (7) , Jaycee Park (8) , Lions Park (9) . Display/hide their locations on the map
Hotel: (1) . Display/hide its approximate location on the map
Birthplace of: Tim Conboy - Ice hockey player, Tom Preissing - NHL player (San Jose Sharks, born : Dec 3, 1978), Tom Compton - College Football player.
Dakota County has a predicted average indoor radon screening level greater than 4 pCi/L (pico curies per liter) - Highest Potential Average household size: This city:
2.9 peopleMinnesota:
2.5 people
Percentage of family households: This city:
78.0%Whole state:
64.6%
Percentage of households with unmarried partners: This city:
5.7%Whole state:
6.9%
Likely homosexual households (counted as self-reported same-sex unmarried-partner households)
Lesbian couples: 0.2% of all households Gay men: 0.2% of all households
18 people in group homes intended for adults in 2010people in nursing facilities/skilled-nursing facilities in 2010people in homes for the mentally retarded in 2000people in religious group quarters in 2000
Banks with branches in Rosemount (2011 data):
Merchants Bank, National Association: Rosemount National Bank Branch at 15055 Chippendale Avenue South, branch established on 1982/10/01. Info updated 2012/01/06: Bank assets: $1,241.1 mil, Deposits: $1,007.4 mil, headquarters in Winona, MN, positive income , Commercial Lending Specialization, 19 total offices , Holding Company: Merchants Financial Group, Inc.
Vermillion State Bank: Rosemount Branch at 15040 Canada Avenue West, branch established on 1994/11/01. Info updated 2011/04/20: Bank assets: $489.0 mil, Deposits: $421.7 mil, headquarters in Vermillion, MN, positive income , Commercial Lending Specialization, 5 total offices , Holding Company: Vermillion Bancshares, Inc.
TCF National Bank: Tcf Rosemount Cub at 3784 150th Street West, branch established on 2001/08/24. Info updated 2009/11/23: Bank assets: $19,007.0 mil, Deposits: $12,377.0 mil, headquarters in Sioux Falls, SD, positive income , Commercial Lending Specialization, 441 total offices , Holding Company: Tcf Financial Corporation
The First State Bank of Rosemount: The First State Bank Of Rosemount at 3025 145th Street West, branch established on 1909/01/01. Info updated 2006/11/03: Bank assets: $64.0 mil, Deposits: $58.0 mil, local headquarters , positive income , 1 total offices , Holding Company: Higgins Bancorporation, Inc.
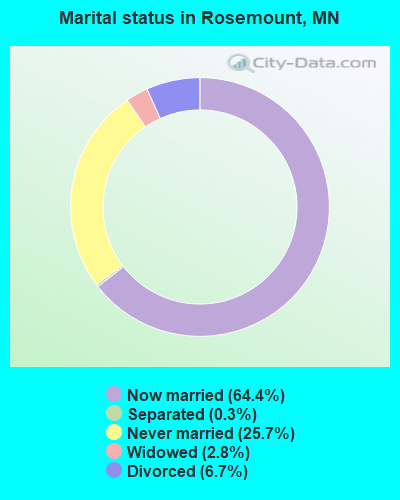
For population 15 years and over in Rosemount:
Never married: 25.7%Now married: 64.4%Separated: 0.3%Widowed: 2.8%Divorced: 6.7% For population 25 years and over in Rosemount:
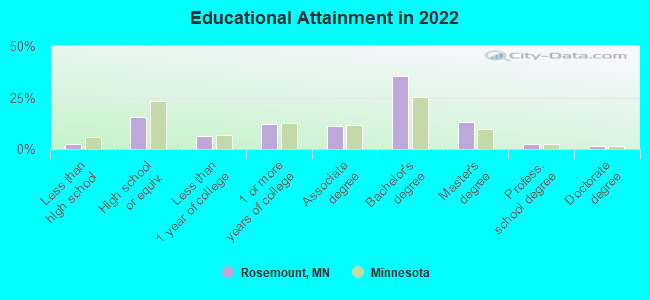
High school or higher: 97.7%Bachelor's degree or higher: 50.7%Graduate or professional degree: 16.0%Unemployed: 2.3%Mean travel time to work (commute): 20.9 minutes
Education Gini index (Inequality in education) Here:
8.7Minnesota average:
10.9
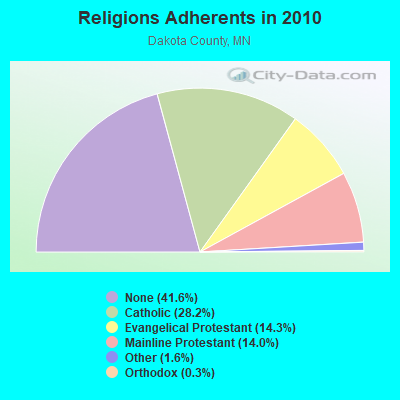
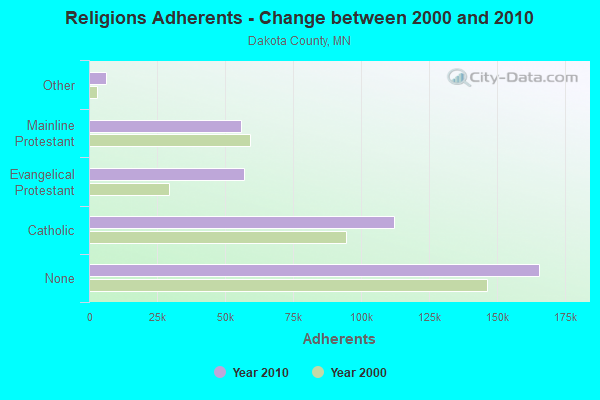
Religion statistics for Rosemount, MN (based on Dakota County data)
Religion Adherents Congregations Catholic 112,264 18 Evangelical Protestant 57,007 111 Mainline Protestant 55,850 56 Other 6,321 27 Orthodox 1,173 5 Black Protestant 313 2 None 165,624 -
Source: Clifford Grammich, Kirk Hadaway, Richard Houseal, Dale E.Jones, Alexei Krindatch, Richie Stanley and Richard H.Taylor. 2012. 2010 U.S.Religion Census: Religious Congregations & Membership Study. Association of Statisticians of American Religious Bodies. Jones, Dale E., et al. 2002. Congregations and Membership in the United States 2000. Nashville, TN: Glenmary Research Center. Graphs represent county-level data
Food Environment Statistics: Number of grocery stores : 35Dakota County :
0.90 / 10,000 pop.Minnesota :
1.83 / 10,000 pop.
Number of supercenters and club stores : 5This county :
0.13 / 10,000 pop.Minnesota :
0.13 / 10,000 pop.
Number of convenience stores (no gas) : 6Dakota County :
0.15 / 10,000 pop.Minnesota :
0.49 / 10,000 pop.
Number of convenience stores (with gas) : 118Dakota County :
3.03 / 10,000 pop.Minnesota :
3.90 / 10,000 pop.
Number of full-service restaurants : 196Dakota County :
5.03 / 10,000 pop.Minnesota :
6.98 / 10,000 pop.
Adult diabetes rate : Dakota County :
6.1%Minnesota :
6.5%
Adult obesity rate : Dakota County :
25.6%Minnesota :
25.9%
Low-income preschool obesity rate : Here :
12.6%Minnesota :
13.0%
Health and Nutrition: Healthy diet rate : Rosemount:
49.9%Minnesota:
50.6%
Average overall health of teeth and gums : Average BMI : Rosemount:
28.6Minnesota:
28.5
People feeling badly about themselves : This city:
21.4%State:
21.0%
People not drinking alcohol at all : Rosemount:
9.4%Minnesota:
9.8%
Average hours sleeping at night : Rosemount:
6.8Minnesota:
6.8
Overweight people : Here:
34.2%Minnesota:
33.5%
General health condition : Rosemount:
58.1%Minnesota:
57.7%
Average condition of hearing : Rosemount:
80.8%State:
79.3%
More about Health and Nutrition of Rosemount, MN Residents
Local government employment and payroll (March 2022)
Function
Full-time employees
Monthly full-time payroll
Average yearly full-time wage
Part-time employees
Monthly part-time payroll
Police Protection - Officers
22 $209,260 $114,142 0 $0 Streets and Highways
21 $180,826 $103,329 4 $8,719 Parks and Recreation
10 $79,270 $95,124 20 $21,587 Financial Administration
7 $59,576 $102,130 1 $6,083 Housing and Community Development (Local)
5 $48,226 $115,742 0 $0 Other and Unallocable
5 $40,859 $98,062 0 $0 Other Government Administration
4 $46,763 $140,289 6 $2,099 Police - Other
3 $21,248 $84,992 4 $4,686 Firefighters
0 $0 1 $111
Totals for Government
77 $686,028 $106,913 36 $43,285
Rosemount government finances - Expenditure in 2018 (per resident):
Construction - Regular Highways: $2,777,000 ($102.54)
Current Operations - Police Protection: $4,465,000 ($164.88)
Regular Highways: $3,512,000 ($129.69)General - Other: $3,389,000 ($125.14)Sewerage: $2,842,000 ($104.94)Parks and Recreation: $2,756,000 ($101.77)Water Utilities: $2,171,000 ($80.17)Financial Administration: $1,143,000 ($42.21)Local Fire Protection: $504,000 ($18.61)Central Staff Services: $212,000 ($7.83)General - Interest on Debt: $388,000 ($14.33)
Other Capital Outlay - General - Other: $1,309,000 ($48.34)
Parks and Recreation: $816,000 ($30.13)Regular Highways: $582,000 ($21.49)Local Fire Protection: $272,000 ($10.04)Police Protection: $155,000 ($5.72)Water Utilities: $97,000 ($3.58)Sewerage: $67,000 ($2.47)Water Utilities - Interest on Debt: $36,000 ($1.33)
Rosemount government finances - Revenue in 2018 (per resident):
Charges - Other: $2,621,000 ($96.78)
Regular Highways: $1,917,000 ($70.79)Sewerage: $1,233,000 ($45.53)Parks and Recreation: $1,210,000 ($44.68)Solid Waste Management: $4,000 ($0.15)Federal Intergovernmental - Other: $6,000 ($0.22)
Local Intergovernmental - Other: $99,000 ($3.66)
Miscellaneous - General Revenue - Other: $1,159,000 ($42.80)
Special Assessments: $718,000 ($26.51)Interest Earnings: $284,000 ($10.49)Fines and Forfeits: $130,000 ($4.80)Revenue - Water Utilities: $3,455,000 ($127.58)
State Intergovernmental - Highways: $835,000 ($30.83)
Other: $417,000 ($15.40)Water Utilities: $84,000 ($3.10)General Local Government Support: $5,000 ($0.18)Tax - Property: $11,220,000 ($414.31)
Other License: $741,000 ($27.36)Public Utilities Sales: $258,000 ($9.53)Severance: $108,000 ($3.99)
Rosemount government finances - Debt in 2018 (per resident):
Long Term Debt - Beginning Outstanding - Unspecified Public Purpose: $17,250,000 ($636.98)
Outstanding Unspecified Public Purpose: $12,345,000 ($455.85)Beginning Outstanding - Public Debt for Private Purpose: $8,575,000 ($316.64)Outstanding Nonguaranteed - Industrial Revenue: $7,860,000 ($290.24)Retired Unspecified Public Purpose: $5,960,000 ($220.08)Issue, Unspecified Public Purpose: $1,055,000 ($38.96)Retired Nonguaranteed - Public Debt for Private Purpose: $715,000 ($26.40)
Rosemount government finances - Cash and Securities in 2018 (per resident):
Other Funds - Cash and Securities: $23,521,000 ($868.54)
Sinking Funds - Cash and Securities: $7,860,000 ($290.24)
8.01% of this county's 2020 resident taxpayers moved to other counties in 2021 ($77,850 average adjusted gross income )
Here:
8.01%Minnesota average:
7.79%
0.01% of residents moved to foreign countries ($89 average AGI )Dakota County:
0.01%Minnesota average:
0.00%
Top counties to which taxpayers relocated from this county between 2020 and 2021:
Businesses in Rosemount, MN
Name Count Name Count
ALDI 1 KFC 1 AMF Bowling 1 Little Caesars Pizza 1 Ace Hardware 1 McDonald's 1 Applebee's 1 Pizza Hut 1 Blockbuster 1 Sears 1 Caribou Coffee 1 Starbucks 1 Curves 1 UPS 1 Dairy Queen 1 Walgreens 1 FedEx 1 Wendy's 1 H&R Block 1
Strongest AM radio stations in Rosemount:
WCTS (1030 AM; 50 kW; MAPLEWOOD, MN; Owner: CNTL. BAPT. THEO/AL SEMI MINNEAPOLIS)
KFAN (1130 AM; 50 kW; MINNEAPOLIS, MN; Owner: AMFM RADIO LICENSES, L.L.C.)
KKMS (980 AM; 5 kW; RICHFIELD, MN)
KSTP (1500 AM; 50 kW; ST. PAUL, MN; Owner: KSTP-AM, LLC (DELAWARE))
KTIS (900 AM; 25 kW; MINNEAPOLIS, MN; Owner: NORTHWESTERN COLLEGE)
WMNN (1330 AM; 10 kW; MINNEAPOLIS, MN; Owner: MINNESOTA PUBLIC RADIO.)
WCCO (830 AM; 50 kW; MINNEAPOLIS, MN; Owner: INFINITY MEDIA CORPORATION)
KUOM (770 AM; daytime; 5 kW; MINNEAPOLIS, MN)
WDGY (630 AM; 8 kW; HUDSON, WI; Owner: 630 RADIO, INCORPORATED)
KSMM (1530 AM; 9 kW; SHAKOPEE, MN; Owner: STARBOARD BROADCASTING, INC.)
WWTC (1280 AM; 5 kW; MINNEAPOLIS, MN; Owner: SCA LICENSE CORPORATION)
KDIZ (1440 AM; 5 kW; GOLDEN VALLEY, MN; Owner: KQRS, INC.)
KYCR (1570 AM; 4 kW; GOLDEN VALLEY, MN; Owner: COMMON GROUND BROADCASTING COMPANY,)
Strongest FM radio stations in Rosemount:
WCAL (89.3 FM; NORTHFIELD, MN; Owner: ST. OLAF COLLEGE)
WGVX (105.1 FM; LAKEVILLE, MN; Owner: KQRS, INC.)
KNOW-FM (91.1 FM; MINNEAPOLIS-ST. PAUL, MN; Owner: MINNESOTA PUBLIC RADIO)
WLTE (102.9 FM; MINNEAPOLIS, MN; Owner: INFINITY MEDIA CORPORATION)
KSTP-FM (94.5 FM; ST. PAUL, MN; Owner: KSTP-FM, LLC, A DELAWARE LLC)
KEEY-FM (102.1 FM; ST. PAUL, MN; Owner: AMFM RADIO LICENSES, L.L.C.)
KTIS-FM (98.5 FM; MINNEAPOLIS, MN; Owner: NORTHWESTERN COLLEGE)
KDWB-FM (101.3 FM; RICHFIELD, MN; Owner: AMFM RADIO LICENSES, L.L.C.)
KQRS-FM (92.5 FM; GOLDEN VALLEY, MN; Owner: KQRS, Inc.)
KSJN (99.5 FM; MINNEAPOLIS, MN; Owner: MINNESOTA PUBLIC RADIO)
KXXR (93.7 FM; MINNEAPOLIS, MN; Owner: KQRS, INC.)
KTCZ-FM (97.1 FM; MINNEAPOLIS, MN; Owner: AMFM RADIO LICENSES, L.L.C.)
K294AM (106.7 FM; WEST ST. PAUL, MN; Owner: FRESH AIR, INCORPORATED)
K214DF (90.7 FM; GOLDEN VALLEY, MN; Owner: EDUCATIONAL MEDIA FOUNDATION)
WXPT (104.1 FM; ST. LOUIS PARK, MN; Owner: THE AUDIO HOUSE, INC.)
KBEM-FM (88.5 FM; MINNEAPOLIS, MN; Owner: BD. OF EDUCATION, S.S.D. NO. 1)
KFAI (90.3 FM; MINNEAPOLIS, MN; Owner: FRESH AIR, INC.)
KQQL (107.9 FM; ANOKA, MN; Owner: AMFM RADIO LICENSES, L.L.C.)
KNOF (95.3 FM; ST. PAUL, MN; Owner: SELBY GOSPEL BROADCASTING CORPORATION)
KQCL (95.9 FM; FARIBAULT, MN; Owner: CUMULUS LICENSING CORP.)
TV broadcast stations around Rosemount:
KMSP-TV (Channel 9; MINNEAPOLIS, MN; Owner: FOX TELEVISION STATIONS, INC.)
KARE (Channel 11; MINNEAPOLIS, MN; Owner: MULTIMEDIA HOLDINGS CORPORATION)
KSTP-TV (Channel 5; ST. PAUL, MN; Owner: HUBBARD BROADCASTING, INC.)
KTCA-TV (Channel 2; ST. PAUL, MN; Owner: TWIN CITIES PUBLIC TELEVISION, INC.)
K07UI (Channel 7; MINNEAPOLIS, ETC., MN; Owner: WORD OF GOD FELLOWSHIP, INC.)
WCCO-TV (Channel 4; MINNEAPOLIS, MN; Owner: CBS BROADCASTING INC.)
KTCI-TV (Channel 17; ST. PAUL, MN; Owner: TWIN CITIES PUBLIC TELEVISION, INC.)
KSTC-TV (Channel 45; MINNEAPOLIS, MN; Owner: HUBBARD BROADCASTING, INC.)
KMWB (Channel 23; MINNEAPOLIS, MN; Owner: KLGT LICENSEE, LLC)
WFTC (Channel 29; MINNEAPOLIS, MN; Owner: FOX TELEVISION STATIONS, INC.)
K58BS (Channel 58; MINNEAPOLIS, MN; Owner: TRINITY BROADCASTING NETWORK)
K67HG (Channel 67; MINNEAPOLIS, MN; Owner: VENTANA TELEVISION, INC.)
K14KH (Channel 14; MINNEAPOLIS, MN; Owner: THREE ANGELS BROADCASTING NETWORK)
K19ER (Channel 19; ST. PAUL, MN; Owner: CATHOLIC VIEWS BROADCASTS, INC.)
W62BD (Channel 62; MINNEAPOLIS, MN; Owner: WORD OF GOD FELLOWSHIP, INC.)
WBWX-CA (Channel 13; MINNEAPOLIS, MN; Owner: THE BOX WORLDWIDE LLC)
KPXM (Channel 41; ST. CLOUD, MN; Owner: PAXSON MINNEAPOLIS LICENSE, INC.)
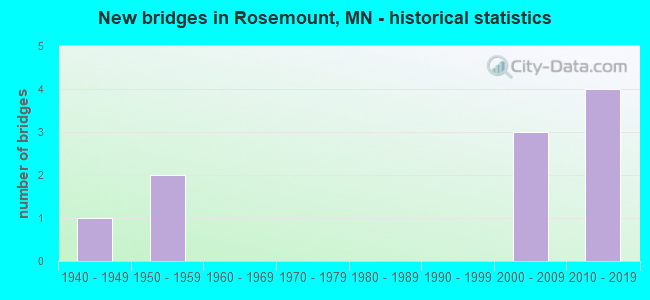
National Bridge Inventory (NBI) Statistics 10 Number of bridges131ft / 40.3m Total length $1,000 Total costs121,758 Total average daily traffic9,973 Total average daily truck traffic
New bridges - historical statistics
1 1940-1949 2 1950-1959 3 2000-2009 4 2010-2019
See full National Bridge Inventory statistics for Rosemount, MN
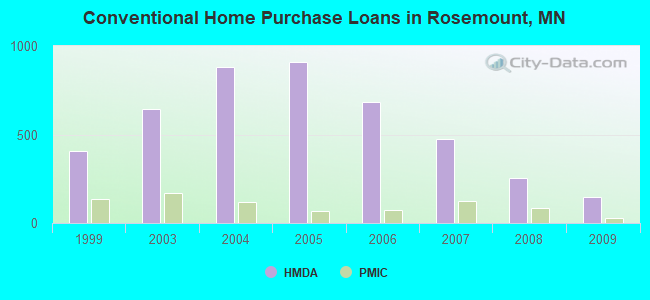
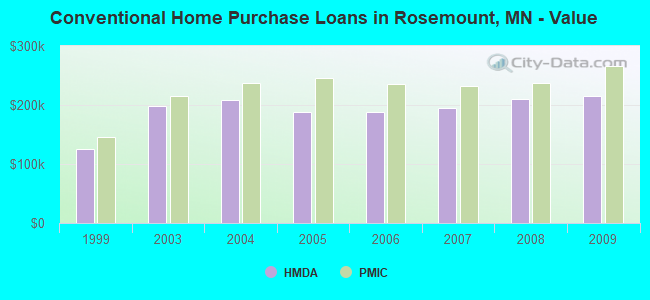
Home Mortgage Disclosure Act Aggregated Statistics For Year 2009(Based on 5 full tracts) A) FHA, FSA/RHS & VA B) Conventional C) Refinancings D) Home Improvement Loans F) Non-occupant Loans on G) Loans On Manufactured Number Average Value Number Average Value Number Average Value Number Average Value Number Average Value Number Average Value
LOANS ORIGINATED 192 $203,250 148 $215,919 883 $221,610 28 $95,071 16 $127,438 1 $12,000 APPLICATIONS APPROVED, NOT ACCEPTED 7 $192,429 14 $144,571 82 $239,049 3 $25,333 2 $163,000 2 $24,500 APPLICATIONS DENIED 12 $190,000 19 $197,474 189 $235,571 14 $45,429 7 $113,571 5 $26,600 APPLICATIONS WITHDRAWN 13 $217,077 8 $218,750 163 $236,982 5 $90,800 5 $167,000 1 $120,000 FILES CLOSED FOR INCOMPLETENESS 1 $157,000 0 $0 59 $232,034 2 $87,000 0 $0 0 $0
Aggregated Statistics For Year 2008(Based on 5 full tracts) A) FHA, FSA/RHS & VA B) Conventional C) Refinancings D) Home Improvement Loans E) Loans on Dwellings For 5+ Families F) Non-occupant Loans on G) Loans On Manufactured Number Average Value Number Average Value Number Average Value Number Average Value Number Average Value Number Average Value Number Average Value
LOANS ORIGINATED 133 $205,947 257 $209,646 284 $219,102 53 $73,377 2 $450,000 27 $179,407 14 $43,143 APPLICATIONS APPROVED, NOT ACCEPTED 7 $215,286 30 $235,633 55 $210,018 8 $54,500 0 $0 1 $176,000 2 $82,000 APPLICATIONS DENIED 15 $191,933 31 $197,548 157 $221,108 33 $34,636 0 $0 3 $227,667 10 $52,300 APPLICATIONS WITHDRAWN 9 $202,667 26 $166,077 110 $228,136 8 $78,500 0 $0 7 $138,714 0 $0 FILES CLOSED FOR INCOMPLETENESS 1 $161,000 2 $143,000 20 $235,750 6 $68,000 0 $0 1 $14,000 0 $0
Aggregated Statistics For Year 2007(Based on 5 full tracts) A) FHA, FSA/RHS & VA B) Conventional C) Refinancings D) Home Improvement Loans E) Loans on Dwellings For 5+ Families F) Non-occupant Loans on G) Loans On Manufactured Number Average Value Number Average Value Number Average Value Number Average Value Number Average Value Number Average Value Number Average Value
LOANS ORIGINATED 36 $205,722 473 $195,573 403 $180,395 88 $72,989 1 $1,408,000 47 $144,277 11 $41,364 APPLICATIONS APPROVED, NOT ACCEPTED 0 $0 48 $132,583 86 $197,547 18 $60,556 0 $0 6 $188,833 3 $33,000 APPLICATIONS DENIED 2 $187,500 52 $178,615 245 $241,653 34 $108,412 0 $0 19 $447,211 7 $52,429 APPLICATIONS WITHDRAWN 1 $163,000 37 $202,730 137 $246,182 6 $89,500 0 $0 12 $174,333 1 $85,000 FILES CLOSED FOR INCOMPLETENESS 0 $0 8 $156,125 51 $242,176 2 $90,000 0 $0 0 $0 0 $0
Aggregated Statistics For Year 2006(Based on 5 full tracts) A) FHA, FSA/RHS & VA B) Conventional C) Refinancings D) Home Improvement Loans F) Non-occupant Loans on G) Loans On Manufactured Number Average Value Number Average Value Number Average Value Number Average Value Number Average Value Number Average Value
LOANS ORIGINATED 39 $221,231 686 $188,092 530 $166,151 83 $63,060 56 $189,429 3 $33,333 APPLICATIONS APPROVED, NOT ACCEPTED 1 $228,000 84 $164,500 94 $180,936 26 $91,615 3 $80,333 0 $0 APPLICATIONS DENIED 8 $219,625 77 $165,455 257 $186,677 35 $99,829 14 $159,500 8 $22,125 APPLICATIONS WITHDRAWN 4 $237,500 68 $177,676 205 $203,298 15 $123,933 10 $196,000 0 $0 FILES CLOSED FOR INCOMPLETENESS 1 $160,000 21 $185,286 48 $209,188 6 $28,000 2 $180,500 0 $0
Aggregated Statistics For Year 2005(Based on 5 full tracts) A) FHA, FSA/RHS & VA B) Conventional C) Refinancings D) Home Improvement Loans E) Loans on Dwellings For 5+ Families F) Non-occupant Loans on G) Loans On Manufactured Number Average Value Number Average Value Number Average Value Number Average Value Number Average Value Number Average Value Number Average Value
LOANS ORIGINATED 68 $202,529 910 $187,981 681 $193,181 103 $60,204 1 $538,000 60 $160,100 11 $45,818 APPLICATIONS APPROVED, NOT ACCEPTED 8 $204,750 88 $173,614 104 $180,481 9 $26,111 0 $0 5 $181,000 1 $35,000 APPLICATIONS DENIED 2 $207,000 109 $173,606 286 $203,427 42 $54,190 0 $0 11 $130,273 12 $20,333 APPLICATIONS WITHDRAWN 3 $200,667 105 $208,238 283 $219,113 30 $142,233 0 $0 8 $183,250 2 $8,500 FILES CLOSED FOR INCOMPLETENESS 2 $187,500 27 $178,926 69 $225,739 7 $90,143 0 $0 3 $202,333 1 $27,000
Aggregated Statistics For Year 2004(Based on 5 full tracts) A) FHA, FSA/RHS & VA B) Conventional C) Refinancings D) Home Improvement Loans F) Non-occupant Loans on G) Loans On Manufactured Number Average Value Number Average Value Number Average Value Number Average Value Number Average Value Number Average Value
LOANS ORIGINATED 65 $190,138 879 $208,555 674 $189,715 93 $59,000 59 $174,153 4 $46,000 APPLICATIONS APPROVED, NOT ACCEPTED 1 $217,000 82 $202,439 96 $186,823 12 $87,417 6 $185,000 7 $36,143 APPLICATIONS DENIED 5 $196,000 80 $155,212 204 $191,613 39 $45,564 17 $176,471 7 $25,286 APPLICATIONS WITHDRAWN 2 $166,500 61 $208,180 197 $205,076 17 $68,882 4 $200,000 0 $0 FILES CLOSED FOR INCOMPLETENESS 1 $185,000 15 $152,000 75 $217,853 7 $56,857 4 $144,500 0 $0
Aggregated Statistics For Year 2003(Based on 5 full tracts) A) FHA, FSA/RHS & VA B) Conventional C) Refinancings D) Home Improvement Loans F) Non-occupant Loans on Number Average Value Number Average Value Number Average Value Number Average Value Number Average Value
LOANS ORIGINATED 68 $186,103 645 $198,975 1,781 $170,110 67 $33,522 26 $148,462 APPLICATIONS APPROVED, NOT ACCEPTED 3 $206,667 67 $197,075 151 $165,060 10 $68,100 1 $263,000 APPLICATIONS DENIED 4 $191,250 39 $127,179 281 $170,416 34 $27,676 6 $144,333 APPLICATIONS WITHDRAWN 6 $169,667 40 $196,500 257 $165,556 3 $88,333 7 $173,000 FILES CLOSED FOR INCOMPLETENESS 1 $111,000 17 $172,118 48 $223,479 2 $12,500 3 $142,667
Aggregated Statistics For Year 1999(Based on 1 full tract) A) FHA, FSA/RHS & VA B) Conventional C) Refinancings D) Home Improvement Loans E) Loans on Dwellings For 5+ Families F) Non-occupant Loans on Number Average Value Number Average Value Number Average Value Number Average Value Number Average Value Number Average Value
LOANS ORIGINATED 130 $137,114 405 $125,020 320 $100,360 65 $15,818 1 $17,920 10 $108,886 APPLICATIONS APPROVED, NOT ACCEPTED 0 $0 27 $109,630 44 $79,873 9 $26,873 0 $0 4 $64,942 APPLICATIONS DENIED 8 $142,825 62 $68,403 116 $86,934 27 $16,994 0 $0 0 $0 APPLICATIONS WITHDRAWN 3 $141,333 34 $137,908 71 $104,450 10 $39,016 0 $0 0 $0 FILES CLOSED FOR INCOMPLETENESS 1 $157,260 3 $112,470 23 $112,339 1 $17,920 0 $0 0 $0
Detailed HMDA statistics for the following Tracts:
0610.03
, 0610.04 , 0610.05 , 0610.06 , 0610.07
Private Mortgage Insurance Companies Aggregated Statistics For Year 2009(Based on 5 full tracts) A) Conventional B) Refinancings C) Non-occupant Loans on Number Average Value Number Average Value Number Average Value
LOANS ORIGINATED 30 $265,767 17 $265,176 1 $217,000 APPLICATIONS APPROVED, NOT ACCEPTED 18 $287,500 5 $256,800 1 $217,000 APPLICATIONS DENIED 4 $198,750 3 $267,667 0 $0 APPLICATIONS WITHDRAWN 1 $251,000 2 $330,000 0 $0 FILES CLOSED FOR INCOMPLETENESS 1 $178,000 0 $0 0 $0
Aggregated Statistics For Year 2008(Based on 5 full tracts) A) Conventional B) Refinancings C) Non-occupant Loans on Number Average Value Number Average Value Number Average Value
LOANS ORIGINATED 86 $236,605 37 $263,378 4 $183,250 APPLICATIONS APPROVED, NOT ACCEPTED 22 $247,136 21 $256,524 3 $212,667 APPLICATIONS DENIED 2 $160,500 2 $333,000 0 $0 APPLICATIONS WITHDRAWN 4 $285,250 2 $184,500 0 $0 FILES CLOSED FOR INCOMPLETENESS 0 $0 1 $230,000 1 $230,000
Aggregated Statistics For Year 2007(Based on 5 full tracts) A) Conventional B) Refinancings C) Non-occupant Loans on Number Average Value Number Average Value Number Average Value
LOANS ORIGINATED 124 $231,758 43 $235,977 7 $232,429 APPLICATIONS APPROVED, NOT ACCEPTED 15 $254,267 7 $281,286 1 $149,000 APPLICATIONS DENIED 2 $140,500 2 $318,000 2 $211,000 APPLICATIONS WITHDRAWN 6 $208,000 1 $385,000 1 $99,000 FILES CLOSED FOR INCOMPLETENESS 0 $0 0 $0 0 $0
Aggregated Statistics For Year 2006(Based on 5 full tracts) A) Conventional B) Refinancings C) Non-occupant Loans on Number Average Value Number Average Value Number Average Value
LOANS ORIGINATED 74 $234,932 21 $250,714 4 $202,250 APPLICATIONS APPROVED, NOT ACCEPTED 7 $238,714 2 $237,000 0 $0 APPLICATIONS DENIED 0 $0 0 $0 0 $0 APPLICATIONS WITHDRAWN 1 $324,000 2 $233,000 0 $0 FILES CLOSED FOR INCOMPLETENESS 1 $224,000 0 $0 0 $0
Aggregated Statistics For Year 2005(Based on 5 full tracts) A) Conventional B) Refinancings C) Non-occupant Loans on Number Average Value Number Average Value Number Average Value
LOANS ORIGINATED 67 $245,806 39 $228,974 10 $211,300 APPLICATIONS APPROVED, NOT ACCEPTED 7 $273,429 5 $208,800 0 $0 APPLICATIONS DENIED 2 $232,000 1 $328,000 2 $246,000 APPLICATIONS WITHDRAWN 1 $325,000 0 $0 0 $0 FILES CLOSED FOR INCOMPLETENESS 0 $0 3 $266,000 1 $328,000
Aggregated Statistics For Year 2004(Based on 5 full tracts) A) Conventional B) Refinancings C) Non-occupant Loans on D) Loans On Manufactured Number Average Value Number Average Value Number Average Value Number Average Value
LOANS ORIGINATED 116 $236,991 51 $215,510 7 $180,286 1 $246,000 APPLICATIONS APPROVED, NOT ACCEPTED 13 $257,308 21 $200,333 0 $0 0 $0 APPLICATIONS DENIED 1 $190,000 1 $310,000 1 $190,000 0 $0 APPLICATIONS WITHDRAWN 14 $245,000 7 $223,429 4 $212,500 0 $0 FILES CLOSED FOR INCOMPLETENESS 0 $0 3 $229,000 1 $315,000 0 $0
Aggregated Statistics For Year 2003(Based on 5 full tracts) A) Conventional B) Refinancings C) Non-occupant Loans on Number Average Value Number Average Value Number Average Value
LOANS ORIGINATED 167 $214,437 152 $186,289 8 $165,750 APPLICATIONS APPROVED, NOT ACCEPTED 21 $221,286 32 $191,500 0 $0 APPLICATIONS DENIED 3 $171,333 2 $217,500 0 $0 APPLICATIONS WITHDRAWN 9 $217,556 10 $190,200 0 $0 FILES CLOSED FOR INCOMPLETENESS 0 $0 0 $0 0 $0
Aggregated Statistics For Year 1999(Based on 1 full tract) A) Conventional B) Refinancings C) Non-occupant Loans on Number Average Value Number Average Value Number Average Value
LOANS ORIGINATED 133 $145,142 59 $125,290 1 $107,490 APPLICATIONS APPROVED, NOT ACCEPTED 6 $128,892 11 $120,884 0 $0 APPLICATIONS DENIED 1 $136,360 3 $159,247 0 $0 APPLICATIONS WITHDRAWN 2 $138,345 1 $145,310 0 $0 FILES CLOSED FOR INCOMPLETENESS 0 $0 3 $88,583 0 $0
Detailed PMIC statistics for the following Tracts:
0610.03
, 0610.04 , 0610.05 , 0610.06 , 0610.07
Most common first names in Rosemount, MN among deceased individuals Name Count Lived (average)
Robert 31 68.3 years John 30 68.0 years James 26 65.0 years Mary 25 77.6 years William 21 75.6 years Helen 20 83.9 years Richard 19 69.3 years Margaret 18 82.6 years Ruth 17 81.8 years Thomas 17 69.3 years
Most common last names in Rosemount, MN among deceased individuals Last name Count Lived (average)
Johnson 24 73.4 years Nelson 11 78.7 years Anderson 11 77.3 years Mccarthy 10 80.2 years Strese 8 74.6 years Peterson 8 68.5 years Mcdonough 7 72.1 years Volkert 7 86.1 years Ratzlaff 7 84.6 years Smith 7 74.3 years
Rosemount compared to Minnesota state average:
Unemployed percentage significantly below state average. Median age significantly below state average. Renting percentage below state average. Length of stay since moving in above state average. House age significantly below state average. Percentage of population with a bachelor's degree or higher above state average.
#5 on the list of "Top 101 cities with the most local government spending on highway construction per resident (population 10,000+)"
#1 on the list of "Top 101 counties with the highest percentage of residents that visited a dentist within the past year"
#8 on the list of "Top 101 counties with the highest percentage of residents that exercised in the past month"
#9 on the list of "Top 101 counties with the lowest number of infant deaths per 1000 residents 2007-2013 (pop. 50,000+)"
#9 on the list of "Top 101 counties with the largest decrease in the number of infant deaths per 1000 residents 2000-2006 to 2007-2013 (pop. 50,000+)"
#15 on the list of "Top 101 counties with the best general health status score of residents (1-5), 3 years of data"
Top Patent Applicants
Yong Lu (28)
Lan H. Liu (17)
Ryan E. Marx (15)
Jaime L. Harris (10)
Susan Maloney Viall (9)
Thomas Sauro (8)
Steven Paul Vanderwiel (7)
Khalid Al-Kofahi (7)
Daniel Bennett (7)
Joe Funk (6)
Total of 365 patent applications in 2008-2024.


 Recent articles from our blog. Our writers, many of them Ph.D. graduates or candidates, create easy-to-read articles on a wide variety of topics.

 (5.6 miles
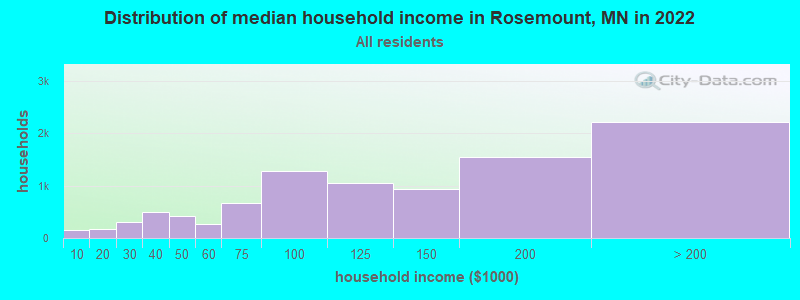


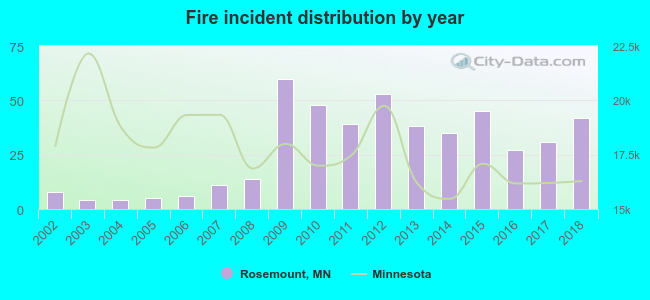 According to the data from the years 2002 - 2018 the average number of fire incidents per year is 28. The highest number of fire incidents - 60 took place in 2009, and the least - 4 in 2003. The data has an increasing trend.
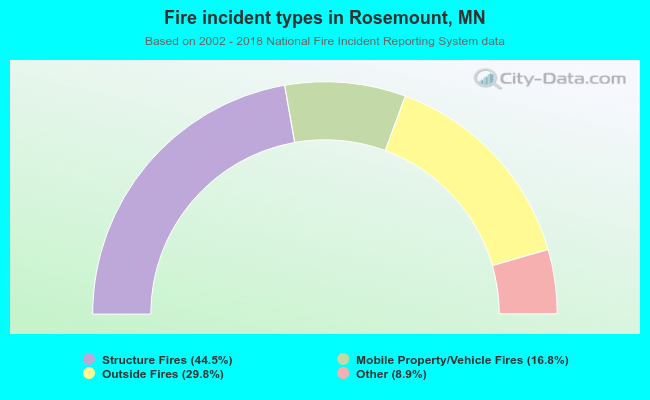 When looking into fire subcategories, the most incidents belonged to: Structure Fires (44.5%), and Outside Fires (29.8%).