Savage, Minnesota Submit your own pictures of this city and show them to the world
OSM Map
General Map
Google Map
MSN Map
OSM Map
General Map
Google Map
MSN Map
OSM Map
General Map
Google Map
MSN Map
OSM Map
General Map
Google Map
MSN Map
Please wait while loading the map...
Population in 2022: 32,893 (99% urban, 1% rural). Population change since 2000: +55.8%Males: 16,925 Females: 15,968
March 2022 cost of living index in Savage: 114.3 (more than average, U.S. average is 100) Percentage of residents living in poverty in 2022: 6.0%for White Non-Hispanic residents , 36.6% for Black residents , 18.9% for Hispanic or Latino residents , 46.3% for American Indian residents , 24.1% for other race residents , 2.7% for two or more races residents )
Profiles of local businesses
Business Search - 14 Million verified businesses
Data:
Median household income ($)
Median household income (% change since 2000)
Household income diversity
Ratio of average income to average house value (%)
Ratio of average income to average rent
Median household income ($) - White
Median household income ($) - Black or African American
Median household income ($) - Asian
Median household income ($) - Hispanic or Latino
Median household income ($) - American Indian and Alaska Native
Median household income ($) - Multirace
Median household income ($) - Other Race
Median household income for houses/condos with a mortgage ($)
Median household income for apartments without a mortgage ($)
Races - White alone (%)
Races - White alone (% change since 2000)
Races - Black alone (%)
Races - Black alone (% change since 2000)
Races - American Indian alone (%)
Races - American Indian alone (% change since 2000)
Races - Asian alone (%)
Races - Asian alone (% change since 2000)
Races - Hispanic (%)
Races - Hispanic (% change since 2000)
Races - Native Hawaiian and Other Pacific Islander alone (%)
Races - Native Hawaiian and Other Pacific Islander alone (% change since 2000)
Races - Two or more races (%)
Races - Two or more races (% change since 2000)
Races - Other race alone (%)
Races - Other race alone (% change since 2000)
Racial diversity
Unemployment (%)
Unemployment (% change since 2000)
Unemployment (%) - White
Unemployment (%) - Black or African American
Unemployment (%) - Asian
Unemployment (%) - Hispanic or Latino
Unemployment (%) - American Indian and Alaska Native
Unemployment (%) - Multirace
Unemployment (%) - Other Race
Population density (people per square mile)
Population - Males (%)
Population - Females (%)
Population - Males (%) - White
Population - Males (%) - Black or African American
Population - Males (%) - Asian
Population - Males (%) - Hispanic or Latino
Population - Males (%) - American Indian and Alaska Native
Population - Males (%) - Multirace
Population - Males (%) - Other Race
Population - Females (%) - White
Population - Females (%) - Black or African American
Population - Females (%) - Asian
Population - Females (%) - Hispanic or Latino
Population - Females (%) - American Indian and Alaska Native
Population - Females (%) - Multirace
Population - Females (%) - Other Race
Coronavirus confirmed cases (Apr 26, 2024)
Deaths caused by coronavirus (Apr 26, 2024)
Coronavirus confirmed cases (per 100k population) (Apr 26, 2024)
Deaths caused by coronavirus (per 100k population) (Apr 26, 2024)
Daily increase in number of cases (Apr 26, 2024)
Weekly increase in number of cases (Apr 26, 2024)
Cases doubled (in days) (Apr 26, 2024)
Hospitalized patients (Apr 18, 2022)
Negative test results (Apr 18, 2022)
Total test results (Apr 18, 2022)
COVID Vaccine doses distributed (per 100k population) (Sep 19, 2023)
COVID Vaccine doses administered (per 100k population) (Sep 19, 2023)
COVID Vaccine doses distributed (Sep 19, 2023)
COVID Vaccine doses administered (Sep 19, 2023)
Likely homosexual households (%)
Likely homosexual households (% change since 2000)
Likely homosexual households - Lesbian couples (%)
Likely homosexual households - Lesbian couples (% change since 2000)
Likely homosexual households - Gay men (%)
Likely homosexual households - Gay men (% change since 2000)
Cost of living index
Median gross rent ($)
Median contract rent ($)
Median monthly housing costs ($)
Median house or condo value ($)
Median house or condo value ($ change since 2000)
Mean house or condo value by units in structure - 1, detached ($)
Mean house or condo value by units in structure - 1, attached ($)
Mean house or condo value by units in structure - 2 ($)
Mean house or condo value by units in structure by units in structure - 3 or 4 ($)
Mean house or condo value by units in structure - 5 or more ($)
Mean house or condo value by units in structure - Boat, RV, van, etc. ($)
Mean house or condo value by units in structure - Mobile home ($)
Median house or condo value ($) - White
Median house or condo value ($) - Black or African American
Median house or condo value ($) - Asian
Median house or condo value ($) - Hispanic or Latino
Median house or condo value ($) - American Indian and Alaska Native
Median house or condo value ($) - Multirace
Median house or condo value ($) - Other Race
Median resident age
Resident age diversity
Median resident age - Males
Median resident age - Females
Median resident age - White
Median resident age - Black or African American
Median resident age - Asian
Median resident age - Hispanic or Latino
Median resident age - American Indian and Alaska Native
Median resident age - Multirace
Median resident age - Other Race
Median resident age - Males - White
Median resident age - Males - Black or African American
Median resident age - Males - Asian
Median resident age - Males - Hispanic or Latino
Median resident age - Males - American Indian and Alaska Native
Median resident age - Males - Multirace
Median resident age - Males - Other Race
Median resident age - Females - White
Median resident age - Females - Black or African American
Median resident age - Females - Asian
Median resident age - Females - Hispanic or Latino
Median resident age - Females - American Indian and Alaska Native
Median resident age - Females - Multirace
Median resident age - Females - Other Race
Commute - mean travel time to work (minutes)
Travel time to work - Less than 5 minutes (%)
Travel time to work - Less than 5 minutes (% change since 2000)
Travel time to work - 5 to 9 minutes (%)
Travel time to work - 5 to 9 minutes (% change since 2000)
Travel time to work - 10 to 19 minutes (%)
Travel time to work - 10 to 19 minutes (% change since 2000)
Travel time to work - 20 to 29 minutes (%)
Travel time to work - 20 to 29 minutes (% change since 2000)
Travel time to work - 30 to 39 minutes (%)
Travel time to work - 30 to 39 minutes (% change since 2000)
Travel time to work - 40 to 59 minutes (%)
Travel time to work - 40 to 59 minutes (% change since 2000)
Travel time to work - 60 to 89 minutes (%)
Travel time to work - 60 to 89 minutes (% change since 2000)
Travel time to work - 90 or more minutes (%)
Travel time to work - 90 or more minutes (% change since 2000)
Marital status - Never married (%)
Marital status - Now married (%)
Marital status - Separated (%)
Marital status - Widowed (%)
Marital status - Divorced (%)
Median family income ($)
Median family income (% change since 2000)
Median non-family income ($)
Median non-family income (% change since 2000)
Median per capita income ($)
Median per capita income (% change since 2000)
Median family income ($) - White
Median family income ($) - Black or African American
Median family income ($) - Asian
Median family income ($) - Hispanic or Latino
Median family income ($) - American Indian and Alaska Native
Median family income ($) - Multirace
Median family income ($) - Other Race
Median year house/condo built
Median year apartment built
Year house built - Built 2005 or later (%)
Year house built - Built 2000 to 2004 (%)
Year house built - Built 1990 to 1999 (%)
Year house built - Built 1980 to 1989 (%)
Year house built - Built 1970 to 1979 (%)
Year house built - Built 1960 to 1969 (%)
Year house built - Built 1950 to 1959 (%)
Year house built - Built 1940 to 1949 (%)
Year house built - Built 1939 or earlier (%)
Average household size
Household density (households per square mile)
Average household size - White
Average household size - Black or African American
Average household size - Asian
Average household size - Hispanic or Latino
Average household size - American Indian and Alaska Native
Average household size - Multirace
Average household size - Other Race
Occupied housing units (%)
Vacant housing units (%)
Owner occupied housing units (%)
Renter occupied housing units (%)
Vacancy status - For rent (%)
Vacancy status - For sale only (%)
Vacancy status - Rented or sold, not occupied (%)
Vacancy status - For seasonal, recreational, or occasional use (%)
Vacancy status - For migrant workers (%)
Vacancy status - Other vacant (%)
Residents with income below the poverty level (%)
Residents with income below 50% of the poverty level (%)
Children below poverty level (%)
Poor families by family type - Married-couple family (%)
Poor families by family type - Male, no wife present (%)
Poor families by family type - Female, no husband present (%)
Poverty status for native-born residents (%)
Poverty status for foreign-born residents (%)
Poverty among high school graduates not in families (%)
Poverty among people who did not graduate high school not in families (%)
Residents with income below the poverty level (%) - White
Residents with income below the poverty level (%) - Black or African American
Residents with income below the poverty level (%) - Asian
Residents with income below the poverty level (%) - Hispanic or Latino
Residents with income below the poverty level (%) - American Indian and Alaska Native
Residents with income below the poverty level (%) - Multirace
Residents with income below the poverty level (%) - Other Race
Air pollution - Air Quality Index (AQI)
Air pollution - CO
Air pollution - NO2
Air pollution - SO2
Air pollution - Ozone
Air pollution - PM10
Air pollution - PM25
Air pollution - Pb
Crime - Murders per 100,000 population
Crime - Rapes per 100,000 population
Crime - Robberies per 100,000 population
Crime - Assaults per 100,000 population
Crime - Burglaries per 100,000 population
Crime - Thefts per 100,000 population
Crime - Auto thefts per 100,000 population
Crime - Arson per 100,000 population
Crime - City-data.com crime index
Crime - Violent crime index
Crime - Property crime index
Crime - Murders per 100,000 population (5 year average)
Crime - Rapes per 100,000 population (5 year average)
Crime - Robberies per 100,000 population (5 year average)
Crime - Assaults per 100,000 population (5 year average)
Crime - Burglaries per 100,000 population (5 year average)
Crime - Thefts per 100,000 population (5 year average)
Crime - Auto thefts per 100,000 population (5 year average)
Crime - Arson per 100,000 population (5 year average)
Crime - City-data.com crime index (5 year average)
Crime - Violent crime index (5 year average)
Crime - Property crime index (5 year average)
1996 Presidential Elections Results (%) - Democratic Party (Clinton)
1996 Presidential Elections Results (%) - Republican Party (Dole)
1996 Presidential Elections Results (%) - Other
2000 Presidential Elections Results (%) - Democratic Party (Gore)
2000 Presidential Elections Results (%) - Republican Party (Bush)
2000 Presidential Elections Results (%) - Other
2004 Presidential Elections Results (%) - Democratic Party (Kerry)
2004 Presidential Elections Results (%) - Republican Party (Bush)
2004 Presidential Elections Results (%) - Other
2008 Presidential Elections Results (%) - Democratic Party (Obama)
2008 Presidential Elections Results (%) - Republican Party (McCain)
2008 Presidential Elections Results (%) - Other
2012 Presidential Elections Results (%) - Democratic Party (Obama)
2012 Presidential Elections Results (%) - Republican Party (Romney)
2012 Presidential Elections Results (%) - Other
2016 Presidential Elections Results (%) - Democratic Party (Clinton)
2016 Presidential Elections Results (%) - Republican Party (Trump)
2016 Presidential Elections Results (%) - Other
2020 Presidential Elections Results (%) - Democratic Party (Biden)
2020 Presidential Elections Results (%) - Republican Party (Trump)
2020 Presidential Elections Results (%) - Other
Ancestries Reported - Arab (%)
Ancestries Reported - Czech (%)
Ancestries Reported - Danish (%)
Ancestries Reported - Dutch (%)
Ancestries Reported - English (%)
Ancestries Reported - French (%)
Ancestries Reported - French Canadian (%)
Ancestries Reported - German (%)
Ancestries Reported - Greek (%)
Ancestries Reported - Hungarian (%)
Ancestries Reported - Irish (%)
Ancestries Reported - Italian (%)
Ancestries Reported - Lithuanian (%)
Ancestries Reported - Norwegian (%)
Ancestries Reported - Polish (%)
Ancestries Reported - Portuguese (%)
Ancestries Reported - Russian (%)
Ancestries Reported - Scotch-Irish (%)
Ancestries Reported - Scottish (%)
Ancestries Reported - Slovak (%)
Ancestries Reported - Subsaharan African (%)
Ancestries Reported - Swedish (%)
Ancestries Reported - Swiss (%)
Ancestries Reported - Ukrainian (%)
Ancestries Reported - United States (%)
Ancestries Reported - Welsh (%)
Ancestries Reported - West Indian (%)
Ancestries Reported - Other (%)
Educational Attainment - No schooling completed (%)
Educational Attainment - Less than high school (%)
Educational Attainment - High school or equivalent (%)
Educational Attainment - Less than 1 year of college (%)
Educational Attainment - 1 or more years of college (%)
Educational Attainment - Associate degree (%)
Educational Attainment - Bachelor's degree (%)
Educational Attainment - Master's degree (%)
Educational Attainment - Professional school degree (%)
Educational Attainment - Doctorate degree (%)
School Enrollment - Nursery, preschool (%)
School Enrollment - Kindergarten (%)
School Enrollment - Grade 1 to 4 (%)
School Enrollment - Grade 5 to 8 (%)
School Enrollment - Grade 9 to 12 (%)
School Enrollment - College undergrad (%)
School Enrollment - Graduate or professional (%)
School Enrollment - Not enrolled in school (%)
School enrollment - Public schools (%)
School enrollment - Private schools (%)
School enrollment - Not enrolled (%)
Median number of rooms in houses and condos
Median number of rooms in apartments
Housing units lacking complete plumbing facilities (%)
Housing units lacking complete kitchen facilities (%)
Density of houses
Urban houses (%)
Rural houses (%)
Households with people 60 years and over (%)
Households with people 65 years and over (%)
Households with people 75 years and over (%)
Households with one or more nonrelatives (%)
Households with no nonrelatives (%)
Population in households (%)
Family households (%)
Nonfamily households (%)
Population in families (%)
Family households with own children (%)
Median number of bedrooms in owner occupied houses
Mean number of bedrooms in owner occupied houses
Median number of bedrooms in renter occupied houses
Mean number of bedrooms in renter occupied houses
Median number of vehichles in owner occupied houses
Mean number of vehichles in owner occupied houses
Median number of vehichles in renter occupied houses
Mean number of vehichles in renter occupied houses
Mortgage status - with mortgage (%)
Mortgage status - with second mortgage (%)
Mortgage status - with home equity loan (%)
Mortgage status - with both second mortgage and home equity loan (%)
Mortgage status - without a mortgage (%)
Average family size
Average family size - White
Average family size - Black or African American
Average family size - Asian
Average family size - Hispanic or Latino
Average family size - American Indian and Alaska Native
Average family size - Multirace
Average family size - Other Race
Geographical mobility - Same house 1 year ago (%)
Geographical mobility - Moved within same county (%)
Geographical mobility - Moved from different county within same state (%)
Geographical mobility - Moved from different state (%)
Geographical mobility - Moved from abroad (%)
Place of birth - Born in state of residence (%)
Place of birth - Born in other state (%)
Place of birth - Native, outside of US (%)
Place of birth - Foreign born (%)
Housing units in structures - 1, detached (%)
Housing units in structures - 1, attached (%)
Housing units in structures - 2 (%)
Housing units in structures - 3 or 4 (%)
Housing units in structures - 5 to 9 (%)
Housing units in structures - 10 to 19 (%)
Housing units in structures - 20 to 49 (%)
Housing units in structures - 50 or more (%)
Housing units in structures - Mobile home (%)
Housing units in structures - Boat, RV, van, etc. (%)
House/condo owner moved in on average (years ago)
Renter moved in on average (years ago)
Year householder moved into unit - Moved in 1999 to March 2000 (%)
Year householder moved into unit - Moved in 1995 to 1998 (%)
Year householder moved into unit - Moved in 1990 to 1994 (%)
Year householder moved into unit - Moved in 1980 to 1989 (%)
Year householder moved into unit - Moved in 1970 to 1979 (%)
Year householder moved into unit - Moved in 1969 or earlier (%)
Means of transportation to work - Drove car alone (%)
Means of transportation to work - Carpooled (%)
Means of transportation to work - Public transportation (%)
Means of transportation to work - Bus or trolley bus (%)
Means of transportation to work - Streetcar or trolley car (%)
Means of transportation to work - Subway or elevated (%)
Means of transportation to work - Railroad (%)
Means of transportation to work - Ferryboat (%)
Means of transportation to work - Taxicab (%)
Means of transportation to work - Motorcycle (%)
Means of transportation to work - Bicycle (%)
Means of transportation to work - Walked (%)
Means of transportation to work - Other means (%)
Working at home (%)
Industry diversity
Most Common Industries - Agriculture, forestry, fishing and hunting, and mining (%)
Most Common Industries - Agriculture, forestry, fishing and hunting (%)
Most Common Industries - Mining, quarrying, and oil and gas extraction (%)
Most Common Industries - Construction (%)
Most Common Industries - Manufacturing (%)
Most Common Industries - Wholesale trade (%)
Most Common Industries - Retail trade (%)
Most Common Industries - Transportation and warehousing, and utilities (%)
Most Common Industries - Transportation and warehousing (%)
Most Common Industries - Utilities (%)
Most Common Industries - Information (%)
Most Common Industries - Finance and insurance, and real estate and rental and leasing (%)
Most Common Industries - Finance and insurance (%)
Most Common Industries - Real estate and rental and leasing (%)
Most Common Industries - Professional, scientific, and management, and administrative and waste management services (%)
Most Common Industries - Professional, scientific, and technical services (%)
Most Common Industries - Management of companies and enterprises (%)
Most Common Industries - Administrative and support and waste management services (%)
Most Common Industries - Educational services, and health care and social assistance (%)
Most Common Industries - Educational services (%)
Most Common Industries - Health care and social assistance (%)
Most Common Industries - Arts, entertainment, and recreation, and accommodation and food services (%)
Most Common Industries - Arts, entertainment, and recreation (%)
Most Common Industries - Accommodation and food services (%)
Most Common Industries - Other services, except public administration (%)
Most Common Industries - Public administration (%)
Occupation diversity
Most Common Occupations - Management, business, science, and arts occupations (%)
Most Common Occupations - Management, business, and financial occupations (%)
Most Common Occupations - Management occupations (%)
Most Common Occupations - Business and financial operations occupations (%)
Most Common Occupations - Computer, engineering, and science occupations (%)
Most Common Occupations - Computer and mathematical occupations (%)
Most Common Occupations - Architecture and engineering occupations (%)
Most Common Occupations - Life, physical, and social science occupations (%)
Most Common Occupations - Education, legal, community service, arts, and media occupations (%)
Most Common Occupations - Community and social service occupations (%)
Most Common Occupations - Legal occupations (%)
Most Common Occupations - Education, training, and library occupations (%)
Most Common Occupations - Arts, design, entertainment, sports, and media occupations (%)
Most Common Occupations - Healthcare practitioners and technical occupations (%)
Most Common Occupations - Health diagnosing and treating practitioners and other technical occupations (%)
Most Common Occupations - Health technologists and technicians (%)
Most Common Occupations - Service occupations (%)
Most Common Occupations - Healthcare support occupations (%)
Most Common Occupations - Protective service occupations (%)
Most Common Occupations - Fire fighting and prevention, and other protective service workers including supervisors (%)
Most Common Occupations - Law enforcement workers including supervisors (%)
Most Common Occupations - Food preparation and serving related occupations (%)
Most Common Occupations - Building and grounds cleaning and maintenance occupations (%)
Most Common Occupations - Personal care and service occupations (%)
Most Common Occupations - Sales and office occupations (%)
Most Common Occupations - Sales and related occupations (%)
Most Common Occupations - Office and administrative support occupations (%)
Most Common Occupations - Natural resources, construction, and maintenance occupations (%)
Most Common Occupations - Farming, fishing, and forestry occupations (%)
Most Common Occupations - Construction and extraction occupations (%)
Most Common Occupations - Installation, maintenance, and repair occupations (%)
Most Common Occupations - Production, transportation, and material moving occupations (%)
Most Common Occupations - Production occupations (%)
Most Common Occupations - Transportation occupations (%)
Most Common Occupations - Material moving occupations (%)
People in Group quarters - Institutionalized population (%)
People in Group quarters - Correctional institutions (%)
People in Group quarters - Federal prisons and detention centers (%)
People in Group quarters - Halfway houses (%)
People in Group quarters - Local jails and other confinement facilities (including police lockups) (%)
People in Group quarters - Military disciplinary barracks (%)
People in Group quarters - State prisons (%)
People in Group quarters - Other types of correctional institutions (%)
People in Group quarters - Nursing homes (%)
People in Group quarters - Hospitals/wards, hospices, and schools for the handicapped (%)
People in Group quarters - Hospitals/wards and hospices for chronically ill (%)
People in Group quarters - Hospices or homes for chronically ill (%)
People in Group quarters - Military hospitals or wards for chronically ill (%)
People in Group quarters - Other hospitals or wards for chronically ill (%)
People in Group quarters - Hospitals or wards for drug/alcohol abuse (%)
People in Group quarters - Mental (Psychiatric) hospitals or wards (%)
People in Group quarters - Schools, hospitals, or wards for the mentally retarded (%)
People in Group quarters - Schools, hospitals, or wards for the physically handicapped (%)
People in Group quarters - Institutions for the deaf (%)
People in Group quarters - Institutions for the blind (%)
People in Group quarters - Orthopedic wards and institutions for the physically handicapped (%)
People in Group quarters - Wards in general hospitals for patients who have no usual home elsewhere (%)
People in Group quarters - Wards in military hospitals for patients who have no usual home elsewhere (%)
People in Group quarters - Juvenile institutions (%)
People in Group quarters - Long-term care (%)
People in Group quarters - Homes for abused, dependent, and neglected children (%)
People in Group quarters - Residential treatment centers for emotionally disturbed children (%)
People in Group quarters - Training schools for juvenile delinquents (%)
People in Group quarters - Short-term care, detention or diagnostic centers for delinquent children (%)
People in Group quarters - Type of juvenile institution unknown (%)
People in Group quarters - Noninstitutionalized population (%)
People in Group quarters - College dormitories (includes college quarters off campus) (%)
People in Group quarters - Military quarters (%)
People in Group quarters - On base (%)
People in Group quarters - Barracks, unaccompanied personnel housing (UPH), (Enlisted/Officer), ;and similar group living quarters for military personnel (%)
People in Group quarters - Transient quarters for temporary residents (%)
People in Group quarters - Military ships (%)
People in Group quarters - Group homes (%)
People in Group quarters - Homes or halfway houses for drug/alcohol abuse (%)
People in Group quarters - Homes for the mentally ill (%)
People in Group quarters - Homes for the mentally retarded (%)
People in Group quarters - Homes for the physically handicapped (%)
People in Group quarters - Other group homes (%)
People in Group quarters - Religious group quarters (%)
People in Group quarters - Dormitories (%)
People in Group quarters - Agriculture workers' dormitories on farms (%)
People in Group quarters - Job Corps and vocational training facilities (%)
People in Group quarters - Other workers' dormitories (%)
People in Group quarters - Crews of maritime vessels (%)
People in Group quarters - Other nonhousehold living situations (%)
People in Group quarters - Other noninstitutional group quarters (%)
Residents speaking English at home (%)
Residents speaking English at home - Born in the United States (%)
Residents speaking English at home - Native, born elsewhere (%)
Residents speaking English at home - Foreign born (%)
Residents speaking Spanish at home (%)
Residents speaking Spanish at home - Born in the United States (%)
Residents speaking Spanish at home - Native, born elsewhere (%)
Residents speaking Spanish at home - Foreign born (%)
Residents speaking other language at home (%)
Residents speaking other language at home - Born in the United States (%)
Residents speaking other language at home - Native, born elsewhere (%)
Residents speaking other language at home - Foreign born (%)
Class of Workers - Employee of private company (%)
Class of Workers - Self-employed in own incorporated business (%)
Class of Workers - Private not-for-profit wage and salary workers (%)
Class of Workers - Local government workers (%)
Class of Workers - State government workers (%)
Class of Workers - Federal government workers (%)
Class of Workers - Self-employed workers in own not incorporated business and Unpaid family workers (%)
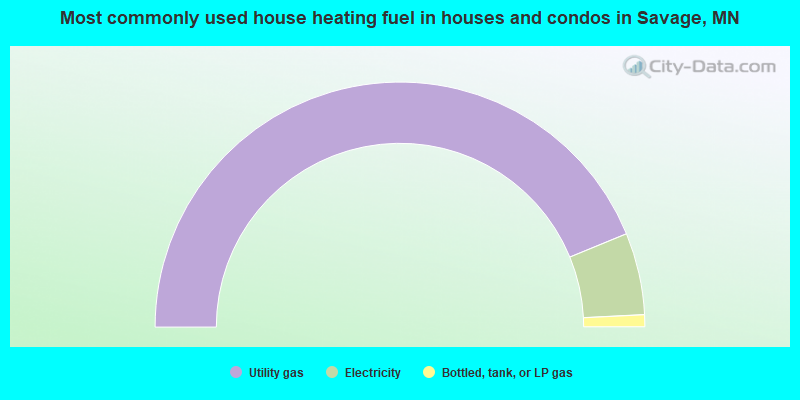
House heating fuel used in houses and condos - Utility gas (%)
House heating fuel used in houses and condos - Bottled, tank, or LP gas (%)
House heating fuel used in houses and condos - Electricity (%)
House heating fuel used in houses and condos - Fuel oil, kerosene, etc. (%)
House heating fuel used in houses and condos - Coal or coke (%)
House heating fuel used in houses and condos - Wood (%)
House heating fuel used in houses and condos - Solar energy (%)
House heating fuel used in houses and condos - Other fuel (%)
House heating fuel used in houses and condos - No fuel used (%)
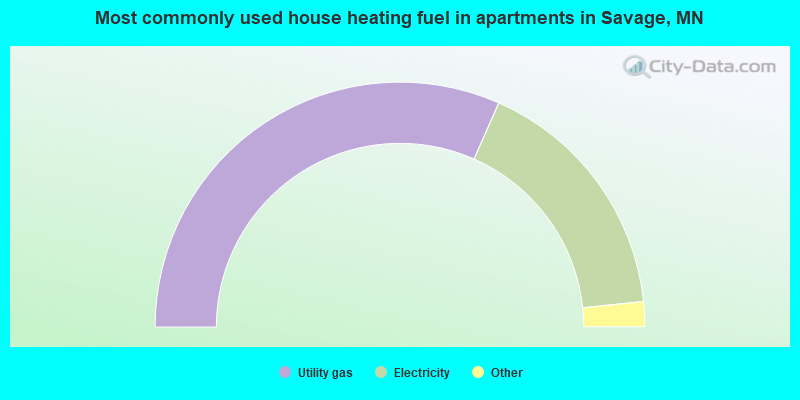
House heating fuel used in apartments - Utility gas (%)
House heating fuel used in apartments - Bottled, tank, or LP gas (%)
House heating fuel used in apartments - Electricity (%)
House heating fuel used in apartments - Fuel oil, kerosene, etc. (%)
House heating fuel used in apartments - Coal or coke (%)
House heating fuel used in apartments - Wood (%)
House heating fuel used in apartments - Solar energy (%)
House heating fuel used in apartments - Other fuel (%)
House heating fuel used in apartments - No fuel used (%)
Armed forces status - In Armed Forces (%)
Armed forces status - Civilian (%)
Armed forces status - Civilian - Veteran (%)
Armed forces status - Civilian - Nonveteran (%)
Fatal accidents locations in years 2005-2021
Fatal accidents locations in 2005
Fatal accidents locations in 2006
Fatal accidents locations in 2007
Fatal accidents locations in 2008
Fatal accidents locations in 2009
Fatal accidents locations in 2010
Fatal accidents locations in 2011
Fatal accidents locations in 2012
Fatal accidents locations in 2013
Fatal accidents locations in 2014
Fatal accidents locations in 2015
Fatal accidents locations in 2016
Fatal accidents locations in 2017
Fatal accidents locations in 2018
Fatal accidents locations in 2019
Fatal accidents locations in 2020
Fatal accidents locations in 2021
Alcohol use - People drinking some alcohol every month (%)
Alcohol use - People not drinking at all (%)
Alcohol use - Average days/month drinking alcohol
Alcohol use - Average drinks/week
Alcohol use - Average days/year people drink much
Audiometry - Average condition of hearing (%)
Audiometry - People that can hear a whisper from across a quiet room (%)
Audiometry - People that can hear normal voice from across a quiet room (%)
Audiometry - Ears ringing, roaring, buzzing (%)
Audiometry - Had a job exposure to loud noise (%)
Audiometry - Had off-work exposure to loud noise (%)
Blood Pressure & Cholesterol - Has high blood pressure (%)
Blood Pressure & Cholesterol - Checking blood pressure at home (%)
Blood Pressure & Cholesterol - Frequently checking blood cholesterol (%)
Blood Pressure & Cholesterol - Has high cholesterol level (%)
Consumer Behavior - Money monthly spent on food at supermarket/grocery store
Consumer Behavior - Money monthly spent on food at other stores
Consumer Behavior - Money monthly spent on eating out
Consumer Behavior - Money monthly spent on carryout/delivered foods
Consumer Behavior - Income spent on food at supermarket/grocery store (%)
Consumer Behavior - Income spent on food at other stores (%)
Consumer Behavior - Income spent on eating out (%)
Consumer Behavior - Income spent on carryout/delivered foods (%)
Current Health Status - General health condition (%)
Current Health Status - Blood donors (%)
Current Health Status - Has blood ever tested for HIV virus (%)
Current Health Status - Left-handed people (%)
Dermatology - People using sunscreen (%)
Diabetes - Diabetics (%)
Diabetes - Had a blood test for high blood sugar (%)
Diabetes - People taking insulin (%)
Diet Behavior & Nutrition - Diet health (%)
Diet Behavior & Nutrition - Milk product consumption (# of products/month)
Diet Behavior & Nutrition - Meals not home prepared (#/week)
Diet Behavior & Nutrition - Meals from fast food or pizza place (#/week)
Diet Behavior & Nutrition - Ready-to-eat foods (#/month)
Diet Behavior & Nutrition - Frozen meals/pizza (#/month)
Drug Use - People that ever used marijuana or hashish (%)
Drug Use - Ever used hard drugs (%)
Drug Use - Ever used any form of cocaine (%)
Drug Use - Ever used heroin (%)
Drug Use - Ever used methamphetamine (%)
Health Insurance - People covered by health insurance (%)
Kidney Conditions-Urology - Avg. # of times urinating at night
Medical Conditions - People with asthma (%)
Medical Conditions - People with anemia (%)
Medical Conditions - People with psoriasis (%)
Medical Conditions - People with overweight (%)
Medical Conditions - Elderly people having difficulties in thinking or remembering (%)
Medical Conditions - People who ever received blood transfusion (%)
Medical Conditions - People having trouble seeing even with glass/contacts (%)
Medical Conditions - People with arthritis (%)
Medical Conditions - People with gout (%)
Medical Conditions - People with congestive heart failure (%)
Medical Conditions - People with coronary heart disease (%)
Medical Conditions - People with angina pectoris (%)
Medical Conditions - People who ever had heart attack (%)
Medical Conditions - People who ever had stroke (%)
Medical Conditions - People with emphysema (%)
Medical Conditions - People with thyroid problem (%)
Medical Conditions - People with chronic bronchitis (%)
Medical Conditions - People with any liver condition (%)
Medical Conditions - People who ever had cancer or malignancy (%)
Mental Health - People who have little interest in doing things (%)
Mental Health - People feeling down, depressed, or hopeless (%)
Mental Health - People who have trouble sleeping or sleeping too much (%)
Mental Health - People feeling tired or having little energy (%)
Mental Health - People with poor appetite or overeating (%)
Mental Health - People feeling bad about themself (%)
Mental Health - People who have trouble concentrating on things (%)
Mental Health - People moving or speaking slowly or too fast (%)
Mental Health - People having thoughts they would be better off dead (%)
Oral Health - Average years since last visit a dentist
Oral Health - People embarrassed because of mouth (%)
Oral Health - People with gum disease (%)
Oral Health - General health of teeth and gums (%)
Oral Health - Average days a week using dental floss/device
Oral Health - Average days a week using mouthwash for dental problem
Oral Health - Average number of teeth
Pesticide Use - Households using pesticides to control insects (%)
Pesticide Use - Households using pesticides to kill weeds (%)
Physical Activity - People doing vigorous-intensity work activities (%)
Physical Activity - People doing moderate-intensity work activities (%)
Physical Activity - People walking or bicycling (%)
Physical Activity - People doing vigorous-intensity recreational activities (%)
Physical Activity - People doing moderate-intensity recreational activities (%)
Physical Activity - Average hours a day doing sedentary activities
Physical Activity - Average hours a day watching TV or videos
Physical Activity - Average hours a day using computer
Physical Functioning - People having limitations keeping them from working (%)
Physical Functioning - People limited in amount of work they can do (%)
Physical Functioning - People that need special equipment to walk (%)
Physical Functioning - People experiencing confusion/memory problems (%)
Physical Functioning - People requiring special healthcare equipment (%)
Prescription Medications - Average number of prescription medicines taking
Preventive Aspirin Use - Adults 40+ taking low-dose aspirin (%)
Reproductive Health - Vaginal deliveries (%)
Reproductive Health - Cesarean deliveries (%)
Reproductive Health - Deliveries resulted in a live birth (%)
Reproductive Health - Pregnancies resulted in a delivery (%)
Reproductive Health - Women breastfeeding newborns (%)
Reproductive Health - Women that had a hysterectomy (%)
Reproductive Health - Women that had both ovaries removed (%)
Reproductive Health - Women that have ever taken birth control pills (%)
Reproductive Health - Women taking birth control pills (%)
Reproductive Health - Women that have ever used Depo-Provera or injectables (%)
Reproductive Health - Women that have ever used female hormones (%)
Sexual Behavior - People 18+ that ever had sex (vaginal, anal, or oral) (%)
Sexual Behavior - Males 18+ that ever had vaginal sex with a woman (%)
Sexual Behavior - Males 18+ that ever performed oral sex on a woman (%)
Sexual Behavior - Males 18+ that ever had anal sex with a woman (%)
Sexual Behavior - Males 18+ that ever had any sex with a man (%)
Sexual Behavior - Females 18+ that ever had vaginal sex with a man (%)
Sexual Behavior - Females 18+ that ever performed oral sex on a man (%)
Sexual Behavior - Females 18+ that ever had anal sex with a man (%)
Sexual Behavior - Females 18+ that ever had any kind of sex with a woman (%)
Sexual Behavior - Average age people first had sex
Sexual Behavior - Average number of female sex partners in lifetime (males 18+)
Sexual Behavior - Average number of female vaginal sex partners in lifetime (males 18+)
Sexual Behavior - Average age people first performed oral sex on a woman (18+)
Sexual Behavior - Average number of woman performed oral sex on in lifetime (18+)
Sexual Behavior - Average number of male sex partners in lifetime (males 18+)
Sexual Behavior - Average number of male anal sex partners in lifetime (males 18+)
Sexual Behavior - Average age people first performed oral sex on a man (18+)
Sexual Behavior - Average number of male oral sex partners in lifetime (18+)
Sexual Behavior - People using protection when performing oral sex (%)
Sexual Behavior - Average number of times people have vaginal or anal sex a year
Sexual Behavior - People having sex without condom (%)
Sexual Behavior - Average number of male sex partners in lifetime (females 18+)
Sexual Behavior - Average number of male vaginal sex partners in lifetime (females 18+)
Sexual Behavior - Average number of female sex partners in lifetime (females 18+)
Sexual Behavior - Circumcised males 18+ (%)
Sleep Disorders - Average hours sleeping at night
Sleep Disorders - People that has trouble sleeping (%)
Smoking-Cigarette Use - People smoking cigarettes (%)
Taste & Smell - People 40+ having problems with smell (%)
Taste & Smell - People 40+ having problems with taste (%)
Taste & Smell - People 40+ that ever had wisdom teeth removed (%)
Taste & Smell - People 40+ that ever had tonsils teeth removed (%)
Taste & Smell - People 40+ that ever had a loss of consciousness because of a head injury (%)
Taste & Smell - People 40+ that ever had a broken nose or other serious injury to face or skull (%)
Taste & Smell - People 40+ that ever had two or more sinus infections (%)
Weight - Average height (inches)
Weight - Average weight (pounds)
Weight - Average BMI
Weight - People that are obese (%)
Weight - People that ever were obese (%)
Weight - People trying to lose weight (%)
According to our research of Minnesota and other state lists, there was 1 registered sex offender living in Savage, Minnesota as of April 26, 2024 . The ratio of all residents to sex offenders in Savage is 29,771 to 1.The ratio of registered sex offenders to all residents in this city is much lower than the state average.
Officers per 1,000 residents here:
0.98Minnesota average:
1.76
Latest news from Savage, MN collected exclusively by city-data.com from local newspapers, TV, and radio stations
Ancestries: German (19.7%), Somali (8.5%), Norwegian (8.5%), Irish (4.2%), American (3.8%), Ghanaian (3.3%).
Current Local Time:
Land area: 15.9 square miles.
Population density: 2,067 people per square mile (low).
3,736 residents are foreign born (4.4% Asia , 3.6% Africa , 1.8% Latin America ).
This city:
11.3%Minnesota:
8.5%
Median real estate property taxes paid for housing units with mortgages in 2022: $4,057 (1.0%)Median real estate property taxes paid for housing units with no mortgage in 2022: $3,908 (1.0%)
Nearest city with pop. 50,000+: Burnsville, MN
Nearest city with pop. 200,000+: Minneapolis, MN
Nearest city with pop. 1,000,000+: Chicago, IL
Nearest cities:
Latitude: 44.76 N, Longitude: 93.36 W
Daytime population change due to commuting: -7,162 (-21.6%)Workers who live and work in this city: 6,124 (33.7%)
Area code commonly used in this area: 952
Single-family new house construction building permits:
2022: 35 buildings , average cost: $363,3002021: 69 buildings , average cost: $345,7002020: 86 buildings , average cost: $337,4002019: 172 buildings , average cost: $301,9002018: 230 buildings , average cost: $309,6002017: 204 buildings , average cost: $318,1002016: 151 buildings , average cost: $332,6002015: 85 buildings , average cost: $342,9002014: 82 buildings , average cost: $317,3002013: 140 buildings , average cost: $289,5002012: 129 buildings , average cost: $295,7002011: 103 buildings , average cost: $265,5002010: 85 buildings , average cost: $186,7002009: 61 buildings , average cost: $166,8002008: 42 buildings , average cost: $177,7002007: 81 buildings , average cost: $177,8002006: 87 buildings , average cost: $191,6002005: 178 buildings , average cost: $167,2002004: 299 buildings , average cost: $156,8002003: 195 buildings , average cost: $172,7002002: 176 buildings , average cost: $180,3002001: 329 buildings , average cost: $175,5002000: 506 buildings , average cost: $162,2001999: 521 buildings , average cost: $142,4001998: 499 buildings , average cost: $142,9001997: 299 buildings , average cost: $143,600Unemployment in December 2023:
Population change in the 1990s: +11,143 (+111.7%).
Most common occupations in Savage, MN (%)
Both Males Females
Computer specialists (5.8%)
Other management occupations, except farmers and farm managers (5.4%)
Sales representatives, services, wholesale and manufacturing (5.3%)
Other sales and related occupations, including supervisors (3.8%)
Other office and administrative support workers, including supervisors (3.5%)
Accountants and auditors (3.2%)
Retail sales workers, except cashiers (2.8%)
Computer specialists (7.6%)
Other management occupations, except farmers and farm managers (6.4%)
Sales representatives, services, wholesale and manufacturing (6.4%)
Other sales and related occupations, including supervisors (5.0%)
Top executives (3.8%)
Engineers (3.7%)
Operations specialties managers, except financial managers (3.5%)
Other office and administrative support workers, including supervisors (6.5%)
Preschool, kindergarten, elementary, and middle school teachers (4.6%)
Secretaries and administrative assistants (4.4%)
Other management occupations, except farmers and farm managers (4.2%)
Sales representatives, services, wholesale and manufacturing (3.9%)
Accountants and auditors (3.8%)
Information and record clerks, except customer service representatives (3.7%)
Tornado activity:
Savage-area historical tornado activity is slightly above Minnesota state average. It is 34% greater than the overall U.S. average.
On 5/6/1965, a category F4 (max. wind speeds 207-260 mph) tornado 10.7 miles away from the Savage city center caused between $5,000,000 and $50,000,000 in damages.
On 5/6/1965, a category F4 tornado 15.5 miles away from the city center killed 6 people and injured 158 people and caused between $5,000,000 and $50,000,000 in damages.
Earthquake activity:
Savage-area historical earthquake activity is significantly above Minnesota state average. It is 55% smaller than the overall U.S. average. On 7/9/1975 at 14:54:15, a magnitude 4.6 (4.6 MB, Class: Light, Intensity: IV - V) earthquake occurred 145.3 miles away from the city center On 6/5/1993 at 01:24:53, a magnitude 4.1 (4.1 LG, Depth: 6.2 mi) earthquake occurred 156.6 miles away from Savage center On 3/4/1983 at 06:32:18, a magnitude 4.6 (4.4 MB, 4.6 LG, 4.4 ML) earthquake occurred 301.0 miles away from Savage center On 10/20/1995 at 15:57:18, a magnitude 3.7 (3.7 LG, Depth: 3.1 mi, Class: Light, Intensity: II - III) earthquake occurred 185.1 miles away from the city center On 2/9/1994 at 08:45:35, a magnitude 3.1 (3.1 LG, Depth: 3.1 mi) earthquake occurred 82.4 miles away from the city center On 11/3/2002 at 20:41:56, a magnitude 4.3 (4.3 MB, Depth: 3.1 mi) earthquake occurred 309.0 miles away from the city center Magnitude types: regional Lg-wave magnitude (LG), body-wave magnitude (MB), local magnitude (ML) Natural disasters: The number of natural disasters in Scott County (15) is near the US average (15).Major Disasters (Presidential) Declared: 10Emergencies Declared: 3Floods: 11, Storms: 6, Tornadoes: 3, Winds: 3, Drought: 1, Hurricane: 1, Landslide: 1, Mudslide: 1, Winter Storm: 1, Other: 1 (Note: some incidents may be assigned to more than one category). Hospitals and medical centers in Savage: SCOTT COUNTY DIALYSIS OF DAVITA (7456 SOUTH PARK DR)
Other hospitals and medical centers near Savage: MINNESOTA MASONIC HOME (Nursing Home, about 3 miles away; BLOOMINGTON, MN)
MINNESOTA MASONIC HOME CARE CENTER (Nursing Home, about 3 miles away; BLOOMINGTON, MN)
ST FRANCIS REGIONAL MEDICAL CENTER (about 4 miles away; SHAKOPEE, MN)
FAIRVIEW RIDGES HOSPITAL (about 4 miles away; BURNSVILLE, MN)
EBENEZER RIDGES GERIATRIC CARE CENTER (Nursing Home, about 5 miles away; BURNSVILLE, MN)
BURNSVILLE DIALYSIS OF DAVITA (Dialysis Facility, about 5 miles away; BURNSVILLE, MN)
COMMUNITY HOME HEALTH INC (Home Health Center, about 5 miles away; PRIOR LAKE, MN)
Amtrak station near Savage: 17 miles: ST. PAUL/MINNEAPOLIS (ST. PAUL, 730 TRANSFER RD.) Services: ticket office, fully wheelchair accessible, enclosed waiting area, public restrooms, public payphones, vending machines, free short-term parking, free long-term parking, call for car rental service, taxi stand.
Colleges/universities with over 2000 students nearest to Savage:
Normandale Community College (about 6 miles; Bloomington, MN ; Full-time enrollment: 7,048)
Dakota County Technical College (about 14 miles; Rosemount, MN ; FT enrollment: 2,478)
St Catherine University (about 15 miles; Saint Paul, MN ; FT enrollment: 3,771)
University of St Thomas (about 16 miles; Saint Paul, MN ; FT enrollment: 8,762)
Minneapolis Community and Technical College (about 16 miles; Minneapolis, MN ; FT enrollment: 6,726)
Macalester College (about 16 miles; Saint Paul, MN ; FT enrollment: 2,174)
Augsburg College (about 16 miles; Minneapolis, MN ; FT enrollment: 2,954)
Public high schools in Savage:
Public elementary/middle schools in Savage:
Private elementary/middle school in Savage:
See full list of schools located in Savage Library in Savage: SCOTT COUNTY LIBRARY Operating income: $3,255,590; Location: 13090 ALABAMA AV S; 236,813 books ; 15,223 e-books ; 11,884 audio materials ; 8,227 video materials ; 20 local licensed databases ; 14 state licensed databases ; 12 other licensed databases ; 362 print serial subscriptions )
Notable locations in Savage: (A) , Savage (B) , Savage Library (C) , Savage City Hall (D) , Savage Police Department (E) , Savage Fire Department Station 2 (F) , Savage Fire Department Station 1 (G) . Display/hide their locations on the map
Shopping Center: (1) . Display/hide its location on the map
Churches in Savage include: (A) , New Spirit United Church of Christ (B) , Saint Mary Magdalene Lutheran Church (C) , Bridgewood Church (D) , Saint John the Baptist Catholic Church (E) , Unity of the Valley Church (F) , Eden Baptist Church (G) , Glendale United Methodist Church (H) . Display/hide their locations on the map
Cemetery: (1) . Display/hide its location on the map
Lakes: (A) , Rice Lake (B) , Hanrahan Lake (C) . Display/hide their locations on the map
Rivers and creeks: (A) , Eagle Creek (B) . Display/hide their locations on the map
Parks in Savage include: (1) , Hollywood Park (2) , Canterbury Park Recreation Area (3) , Warren Buffet Park (4) . Display/hide their locations on the map
Tourist attraction:
Hotels:
Birthplace of: A. J. Thelen - Ice hockey player, Matt Summers - Ice Hockey player.
Scott County has a predicted average indoor radon screening level greater than 4 pCi/L (pico curies per liter) - Highest Potential Average household size: This city:
3.0 peopleMinnesota:
2.5 people
Percentage of family households: This city:
79.2%Whole state:
64.6%
Percentage of households with unmarried partners: This city:
5.9%Whole state:
6.9%
Likely homosexual households (counted as self-reported same-sex unmarried-partner households)
Lesbian couples: 0.2% of all households Gay men: 0.3% of all households
4 people in group homes for juveniles (non-correctional) in 2010people in group homes intended for adults in 2010people in religious group quarters in 2000
Banks with branches in Savage (2011 data):
Wells Fargo Bank, National Association: Savage Branch at 14100 South Highway 13, branch established on 1998/11/06. Info updated 2011/04/05: Bank assets: $1,161,490.0 mil, Deposits: $905,653.0 mil, headquarters in Sioux Falls, SD, positive income , 6395 total offices , Holding Company: Wells Fargo & Company
TCF National Bank: Savage Cub #9127 at 14075 Highway 13, branch established on 2003/11/07. Info updated 2009/11/23: Bank assets: $19,007.0 mil, Deposits: $12,377.0 mil, headquarters in Sioux Falls, SD, positive income , Commercial Lending Specialization, 441 total offices , Holding Company: Tcf Financial Corporation
Associated Bank, National Association: Savage Branch at 12302 Princeton Avenue South, branch established on 1960/08/29. Info updated 2008/09/12: Bank assets: $21,715.0 mil, Deposits: $15,244.4 mil, headquarters in Green Bay, WI, positive income , Commercial Lending Specialization, 282 total offices , Holding Company: Associated Banc-Corp
First Resource Bank: at 4022 County Road 42 West, branch established on 2005/06/27. Info updated 2012/03/08: Bank assets: $14.2 mil, Deposits: $4.6 mil, local headquarters , negative income in the last year , Commercial Lending Specialization, 4 total offices
KleinBank: Savage Branch at 14141 Glendale Road, branch established on 1906/09/04. Info updated 2010/11/22: Bank assets: $1,504.4 mil, Deposits: $1,255.9 mil, headquarters in Big Lake, MN, positive income , Commercial Lending Specialization, 22 total offices , Holding Company: Klein Financial, Inc.
Guaranty Bank: Savage Mn Branch at 14100 S Hwy 13, branch established on 2005/12/15. Info updated 2011/07/21: Bank assets: $1,179.1 mil, Deposits: $1,102.7 mil, headquarters in Milwaukee, WI, negative income in the last year , Mortgage Lending Specialization, 166 total offices
Sterling State Bank: Savage Branch at 14185 Highway 13 South, branch established on 2005/02/21. Info updated 2006/11/03: Bank assets: $308.5 mil, Deposits: $267.4 mil, headquarters in Austin, MN, positive income , Commercial Lending Specialization, 12 total offices , Holding Company: Sterling Financial Group, Inc.
For population 15 years and over in Savage:
Never married: 30.0%Now married: 58.8%Separated: 0.1%Widowed: 3.2%Divorced: 7.9% For population 25 years and over in Savage:
High school or higher: 96.4%Bachelor's degree or higher: 52.2%Graduate or professional degree: 15.5%Unemployed: 2.3%Mean travel time to work (commute): 19.0 minutes
Education Gini index (Inequality in education) Here:
9.6Minnesota average:
10.9
Religion statistics for Savage, MN (based on Scott County data)
Religion Adherents Congregations Catholic 39,912 12 Mainline Protestant 14,379 22 Evangelical Protestant 11,761 39 Other 8 2 None 63,868 -
Source: Clifford Grammich, Kirk Hadaway, Richard Houseal, Dale E.Jones, Alexei Krindatch, Richie Stanley and Richard H.Taylor. 2012. 2010 U.S.Religion Census: Religious Congregations & Membership Study. Association of Statisticians of American Religious Bodies. Jones, Dale E., et al. 2002. Congregations and Membership in the United States 2000. Nashville, TN: Glenmary Research Center. Graphs represent county-level data
Food Environment Statistics: Number of grocery stores : 16Scott County :
1.27 / 10,000 pop.Minnesota :
1.83 / 10,000 pop.
Number of supercenters and club stores : 1This county :
0.08 / 10,000 pop.State :
0.13 / 10,000 pop.
Number of convenience stores (no gas) : 4Scott County :
0.32 / 10,000 pop.Minnesota :
0.49 / 10,000 pop.
Number of convenience stores (with gas) : 40Scott County :
3.18 / 10,000 pop.Minnesota :
3.90 / 10,000 pop.
Number of full-service restaurants : 53This county :
4.21 / 10,000 pop.State :
6.98 / 10,000 pop.
Adult diabetes rate : Scott County :
5.0%Minnesota :
6.5%
Adult obesity rate : Scott County :
27.9%Minnesota :
25.9%
Low-income preschool obesity rate : This county :
13.3%Minnesota :
13.0%
Health and Nutrition:
Average overall health of teeth and gums : Savage:
51.4%Minnesota:
48.4%
Average BMI : Savage:
27.8Minnesota:
28.5
People feeling badly about themselves : This city:
20.7%Minnesota:
21.0%
People not drinking alcohol at all : Savage:
8.3%Minnesota:
9.8%
Average hours sleeping at night : Overweight people : Savage:
29.7%Minnesota:
33.5%
General health condition : This city:
61.2%Minnesota:
57.7%
Average condition of hearing : Savage:
83.4%Minnesota:
79.3%
More about Health and Nutrition of Savage, MN Residents
Local government employment and payroll (March 2022)
Function
Full-time employees
Monthly full-time payroll
Average yearly full-time wage
Part-time employees
Monthly part-time payroll
Police Protection - Officers
36 $306,674 $102,225 0 $0 Streets and Highways
20 $151,228 $90,737 1 $2,589 Other and Unallocable
14 $85,379 $73,182 15 $23,751 Water Supply
11 $73,692 $80,391 0 $0 Other Government Administration
11 $84,248 $91,907 7 $4,702 Parks and Recreation
11 $72,362 $78,940 11 $18,322 Police - Other
8 $46,476 $69,714 0 $0 Financial Administration
6 $44,441 $88,882 0 $0 Firefighters
6 $48,632 $97,264 33 $35,972 Housing and Community Development (Local)
2 $17,092 $102,552 1 $1,332
Totals for Government
125 $930,224 $89,302 68 $86,668
Savage government finances - Expenditure in 2021 (per resident):
Construction - Regular Highways: $4,596,000 ($139.73)
Current Operations - Water Utilities: $9,925,000 ($301.74)
Police Protection: $6,924,000 ($210.50)Liquor Stores: $6,529,000 ($198.49)Regular Highways: $3,751,000 ($114.04)General - Other: $2,360,000 ($71.75)Financial Administration: $2,190,000 ($66.58)Parks and Recreation: $2,120,000 ($64.45)Local Fire Protection: $1,706,000 ($51.87)Libraries: $153,000 ($4.65)Natural Resources - Other: $118,000 ($3.59)Central Staff Services: $110,000 ($3.34)General - Interest on Debt: $1,366,000 ($41.53)
Other Capital Outlay - Local Fire Protection: $1,110,000 ($33.75)
Regular Highways: $934,000 ($28.40)Parks and Recreation: $921,000 ($28.00)General - Other: $683,000 ($20.76)Police Protection: $193,000 ($5.87)Water Utilities - Interest on Debt: $175,000 ($5.32)
Savage government finances - Revenue in 2021 (per resident):
Charges - Regular Highways: $2,062,000 ($62.69)
Other: $1,197,000 ($36.39)Parks and Recreation: $382,000 ($11.61)Solid Waste Management: $1,000 ($0.03)Federal Intergovernmental - Health and Hospitals: $2,366,000 ($71.93)
Highways: $33,000 ($1.00)Other: $16,000 ($0.49)Local Intergovernmental - Other: $20,000 ($0.61)
Miscellaneous - Special Assessments: $1,096,000 ($33.32)
Interest Earnings: $600,000 ($18.24)General Revenue - Other: $190,000 ($5.78)Fines and Forfeits: $40,000 ($1.22)Revenue - Water Utilities: $10,457,000 ($317.91)
Liquor Stores: $8,249,000 ($250.78)State Intergovernmental - Highways: $1,510,000 ($45.91)
Other: $623,000 ($18.94)Tax - Property: $18,683,000 ($567.99)
Other License: $912,000 ($27.73)Public Utilities Sales: $187,000 ($5.69)Severance: $21,000 ($0.64)
Savage government finances - Debt in 2021 (per resident):
Long Term Debt - Beginning Outstanding - Unspecified Public Purpose: $48,065,000 ($1461.25)
Outstanding Unspecified Public Purpose: $47,920,000 ($1456.84)Retired Unspecified Public Purpose: $8,195,000 ($249.14)Issue, Unspecified Public Purpose: $8,050,000 ($244.73)
Savage government finances - Cash and Securities in 2021 (per resident):
Other Funds - Cash and Securities: $15,808,000 ($480.59)
Businesses in Savage, MN
Name Count Name Count
ALDI 1 OfficeMax 1 AT&T 1 Papa John's Pizza 1 Advance Auto Parts 1 Quality 1 Applebee's 1 RadioShack 1 Arby's 1 SONIC Drive-In 1 AutoZone 1 Sprint Nextel 1 Blockbuster 1 Starbucks 2 Buffalo Wild Wings 1 Subway 2 Caribou Coffee 1 T-Mobile 1 Dairy Queen 1 Taco Bell 1 FedEx 2 Target 1 GameStop 1 UPS 1 KFC 1 Walgreens 2 McDonald's 1 Wendy's 1
Strongest AM radio stations in Savage:
WMNN (1330 AM; 10 kW; MINNEAPOLIS, MN; Owner: MINNESOTA PUBLIC RADIO.)
KFAN (1130 AM; 50 kW; MINNEAPOLIS, MN; Owner: AMFM RADIO LICENSES, L.L.C.)
KKMS (980 AM; 5 kW; RICHFIELD, MN)
WCTS (1030 AM; 50 kW; MAPLEWOOD, MN; Owner: CNTL. BAPT. THEO/AL SEMI MINNEAPOLIS)
WCCO (830 AM; 50 kW; MINNEAPOLIS, MN; Owner: INFINITY MEDIA CORPORATION)
KSTP (1500 AM; 50 kW; ST. PAUL, MN; Owner: KSTP-AM, LLC (DELAWARE))
KSMM (1530 AM; 9 kW; SHAKOPEE, MN; Owner: STARBOARD BROADCASTING, INC.)
KTIS (900 AM; 25 kW; MINNEAPOLIS, MN; Owner: NORTHWESTERN COLLEGE)
WWTC (1280 AM; 5 kW; MINNEAPOLIS, MN; Owner: SCA LICENSE CORPORATION)
KUOM (770 AM; daytime; 5 kW; MINNEAPOLIS, MN)
KCCO (950 AM; 1 kW; ST. LOUIS PARK, MN; Owner: THE AUDIO HOUSE, INC.)
KDIZ (1440 AM; 5 kW; GOLDEN VALLEY, MN; Owner: KQRS, INC.)
KYCR (1570 AM; 4 kW; GOLDEN VALLEY, MN; Owner: COMMON GROUND BROADCASTING COMPANY,)
Strongest FM radio stations in Savage:
WCAL (89.3 FM; NORTHFIELD, MN; Owner: ST. OLAF COLLEGE)
KTCZ-FM (97.1 FM; MINNEAPOLIS, MN; Owner: AMFM RADIO LICENSES, L.L.C.)
WGVX (105.1 FM; LAKEVILLE, MN; Owner: KQRS, INC.)
KNOW-FM (91.1 FM; MINNEAPOLIS-ST. PAUL, MN; Owner: MINNESOTA PUBLIC RADIO)
WLTE (102.9 FM; MINNEAPOLIS, MN; Owner: INFINITY MEDIA CORPORATION)
KSTP-FM (94.5 FM; ST. PAUL, MN; Owner: KSTP-FM, LLC, A DELAWARE LLC)
KEEY-FM (102.1 FM; ST. PAUL, MN; Owner: AMFM RADIO LICENSES, L.L.C.)
KTIS-FM (98.5 FM; MINNEAPOLIS, MN; Owner: NORTHWESTERN COLLEGE)
KDWB-FM (101.3 FM; RICHFIELD, MN; Owner: AMFM RADIO LICENSES, L.L.C.)
KQRS-FM (92.5 FM; GOLDEN VALLEY, MN; Owner: KQRS, Inc.)
KSJN (99.5 FM; MINNEAPOLIS, MN; Owner: MINNESOTA PUBLIC RADIO)
KXXR (93.7 FM; MINNEAPOLIS, MN; Owner: KQRS, INC.)
K214DF (90.7 FM; GOLDEN VALLEY, MN; Owner: EDUCATIONAL MEDIA FOUNDATION)
WGVZ (105.7 FM; EDEN PRAIRIE, MN; Owner: KQRS, INC.)
KFAI (90.3 FM; MINNEAPOLIS, MN; Owner: FRESH AIR, INC.)
KQQL (107.9 FM; ANOKA, MN; Owner: AMFM RADIO LICENSES, L.L.C.)
KBEM-FM (88.5 FM; MINNEAPOLIS, MN; Owner: BD. OF EDUCATION, S.S.D. NO. 1)
WXPT (104.1 FM; ST. LOUIS PARK, MN; Owner: THE AUDIO HOUSE, INC.)
KNOF (95.3 FM; ST. PAUL, MN; Owner: SELBY GOSPEL BROADCASTING CORPORATION)
K294AM (106.7 FM; WEST ST. PAUL, MN; Owner: FRESH AIR, INCORPORATED)
TV broadcast stations around Savage:
KMSP-TV (Channel 9; MINNEAPOLIS, MN; Owner: FOX TELEVISION STATIONS, INC.)
KARE (Channel 11; MINNEAPOLIS, MN; Owner: MULTIMEDIA HOLDINGS CORPORATION)
KSTP-TV (Channel 5; ST. PAUL, MN; Owner: HUBBARD BROADCASTING, INC.)
K07UI (Channel 7; MINNEAPOLIS, ETC., MN; Owner: WORD OF GOD FELLOWSHIP, INC.)
KTCA-TV (Channel 2; ST. PAUL, MN; Owner: TWIN CITIES PUBLIC TELEVISION, INC.)
K58BS (Channel 58; MINNEAPOLIS, MN; Owner: TRINITY BROADCASTING NETWORK)
K67HG (Channel 67; MINNEAPOLIS, MN; Owner: VENTANA TELEVISION, INC.)
K14KH (Channel 14; MINNEAPOLIS, MN; Owner: THREE ANGELS BROADCASTING NETWORK)
WCCO-TV (Channel 4; MINNEAPOLIS, MN; Owner: CBS BROADCASTING INC.)
K19ER (Channel 19; ST. PAUL, MN; Owner: CATHOLIC VIEWS BROADCASTS, INC.)
W62BD (Channel 62; MINNEAPOLIS, MN; Owner: WORD OF GOD FELLOWSHIP, INC.)
KTCI-TV (Channel 17; ST. PAUL, MN; Owner: TWIN CITIES PUBLIC TELEVISION, INC.)
KSTC-TV (Channel 45; MINNEAPOLIS, MN; Owner: HUBBARD BROADCASTING, INC.)
KMWB (Channel 23; MINNEAPOLIS, MN; Owner: KLGT LICENSEE, LLC)
WFTC (Channel 29; MINNEAPOLIS, MN; Owner: FOX TELEVISION STATIONS, INC.)
WBWX-CA (Channel 13; MINNEAPOLIS, MN; Owner: THE BOX WORLDWIDE LLC)
KPXM (Channel 41; ST. CLOUD, MN; Owner: PAXSON MINNEAPOLIS LICENSE, INC.)
National Bridge Inventory (NBI) Statistics 21 Number of bridges207ft / 63.4m Total length $1,109,999,000 Total costs297,117 Total average daily traffic18,525 Total average daily truck traffic
New bridges - historical statistics
4 1930-1939 1 1970-1979 2 1980-1989 7 1990-1999 2 2000-2009 5 2010-2019
See full National Bridge Inventory statistics for Savage, MN
Home Mortgage Disclosure Act Aggregated Statistics For Year 2009(Based on 6 full tracts) A) FHA, FSA/RHS & VA B) Conventional C) Refinancings D) Home Improvement Loans E) Loans on Dwellings For 5+ Families F) Non-occupant Loans on G) Loans On Manufactured Number Average Value Number Average Value Number Average Value Number Average Value Number Average Value Number Average Value Number Average Value
LOANS ORIGINATED 234 $194,258 170 $207,890 1,056 $209,996 26 $136,723 1 $405,000 20 $177,362 0 $0 APPLICATIONS APPROVED, NOT ACCEPTED 11 $168,322 9 $186,263 58 $214,043 3 $21,327 0 $0 2 $126,435 0 $0 APPLICATIONS DENIED 18 $167,731 19 $184,351 220 $226,593 19 $46,248 0 $0 10 $135,749 1 $186,000 APPLICATIONS WITHDRAWN 13 $199,982 14 $192,915 189 $220,658 10 $89,878 0 $0 2 $184,000 0 $0 FILES CLOSED FOR INCOMPLETENESS 4 $168,250 5 $167,538 48 $212,284 2 $134,910 0 $0 0 $0 0 $0
Aggregated Statistics For Year 2008(Based on 6 full tracts) A) FHA, FSA/RHS & VA B) Conventional C) Refinancings D) Home Improvement Loans F) Non-occupant Loans on G) Loans On Manufactured Number Average Value Number Average Value Number Average Value Number Average Value Number Average Value Number Average Value
LOANS ORIGINATED 133 $203,811 244 $215,166 408 $211,375 57 $70,285 42 $189,502 0 $0 APPLICATIONS APPROVED, NOT ACCEPTED 10 $225,471 34 $191,148 66 $219,973 15 $85,899 0 $0 1 $38,000 APPLICATIONS DENIED 13 $197,348 27 $231,577 221 $228,924 25 $52,502 5 $157,128 1 $25,000 APPLICATIONS WITHDRAWN 7 $201,526 21 $233,366 104 $222,760 14 $110,735 5 $274,966 0 $0 FILES CLOSED FOR INCOMPLETENESS 3 $213,593 3 $415,400 22 $285,279 4 $59,742 0 $0 0 $0
Aggregated Statistics For Year 2007(Based on 6 full tracts) A) FHA, FSA/RHS & VA B) Conventional C) Refinancings D) Home Improvement Loans E) Loans on Dwellings For 5+ Families F) Non-occupant Loans on Number Average Value Number Average Value Number Average Value Number Average Value Number Average Value Number Average Value
LOANS ORIGINATED 20 $219,217 455 $199,329 533 $180,211 62 $74,279 1 $50,000 47 $196,411 APPLICATIONS APPROVED, NOT ACCEPTED 0 $0 44 $202,041 125 $197,571 20 $66,480 0 $0 10 $182,471 APPLICATIONS DENIED 2 $151,000 86 $177,680 303 $201,189 27 $66,903 0 $0 24 $175,508 APPLICATIONS WITHDRAWN 3 $204,943 49 $204,143 131 $206,197 7 $119,569 0 $0 18 $221,139 FILES CLOSED FOR INCOMPLETENESS 0 $0 16 $237,488 53 $217,912 7 $55,141 0 $0 1 $225,000
Aggregated Statistics For Year 2006(Based on 6 full tracts) A) FHA, FSA/RHS & VA B) Conventional C) Refinancings D) Home Improvement Loans E) Loans on Dwellings For 5+ Families F) Non-occupant Loans on G) Loans On Manufactured Number Average Value Number Average Value Number Average Value Number Average Value Number Average Value Number Average Value Number Average Value
LOANS ORIGINATED 26 $215,276 728 $178,270 741 $182,772 113 $56,870 0 $0 134 $187,246 0 $0 APPLICATIONS APPROVED, NOT ACCEPTED 2 $193,500 83 $161,953 142 $179,709 14 $116,455 0 $0 17 $188,634 1 $35,000 APPLICATIONS DENIED 0 $0 120 $183,535 332 $206,293 51 $91,943 1 $203,000 35 $206,390 3 $65,667 APPLICATIONS WITHDRAWN 2 $232,500 66 $188,267 251 $203,623 17 $97,957 0 $0 13 $186,946 0 $0 FILES CLOSED FOR INCOMPLETENESS 0 $0 22 $196,530 59 $231,096 4 $50,250 0 $0 3 $96,333 0 $0
Aggregated Statistics For Year 2005(Based on 6 full tracts) A) FHA, FSA/RHS & VA B) Conventional C) Refinancings D) Home Improvement Loans F) Non-occupant Loans on G) Loans On Manufactured Number Average Value Number Average Value Number Average Value Number Average Value Number Average Value Number Average Value
LOANS ORIGINATED 22 $206,574 866 $178,576 860 $196,462 99 $86,570 72 $168,270 1 $46,960 APPLICATIONS APPROVED, NOT ACCEPTED 1 $232,000 93 $164,922 112 $186,830 23 $104,509 5 $142,154 0 $0 APPLICATIONS DENIED 0 $0 112 $156,236 323 $216,351 44 $60,930 22 $172,245 3 $88,647 APPLICATIONS WITHDRAWN 2 $148,500 102 $167,774 279 $213,143 30 $174,194 15 $209,214 1 $185,000 FILES CLOSED FOR INCOMPLETENESS 0 $0 22 $165,363 105 $231,323 4 $81,738 4 $148,958 0 $0
Aggregated Statistics For Year 2004(Based on 6 full tracts) A) FHA, FSA/RHS & VA B) Conventional C) Refinancings D) Home Improvement Loans E) Loans on Dwellings For 5+ Families F) Non-occupant Loans on G) Loans On Manufactured Number Average Value Number Average Value Number Average Value Number Average Value Number Average Value Number Average Value Number Average Value
LOANS ORIGINATED 60 $190,923 877 $196,386 1,034 $186,149 85 $58,918 3 $803,000 55 $166,256 1 $85,000 APPLICATIONS APPROVED, NOT ACCEPTED 0 $0 81 $193,622 128 $189,009 25 $45,316 0 $0 7 $245,921 0 $0 APPLICATIONS DENIED 3 $190,950 90 $206,914 286 $189,214 45 $84,062 0 $0 12 $195,750 2 $48,980 APPLICATIONS WITHDRAWN 3 $197,620 90 $227,704 238 $188,112 16 $86,972 0 $0 9 $182,871 0 $0 FILES CLOSED FOR INCOMPLETENESS 2 $230,910 11 $152,788 111 $231,758 5 $53,782 0 $0 0 $0 0 $0
Aggregated Statistics For Year 2003(Based on 6 full tracts) A) FHA, FSA/RHS & VA B) Conventional C) Refinancings D) Home Improvement Loans F) Non-occupant Loans on Number Average Value Number Average Value Number Average Value Number Average Value Number Average Value
LOANS ORIGINATED 55 $193,015 708 $200,267 2,956 $177,614 77 $34,161 48 $144,398 APPLICATIONS APPROVED, NOT ACCEPTED 2 $162,500 56 $210,179 242 $173,369 12 $28,583 9 $142,990 APPLICATIONS DENIED 5 $172,800 60 $148,319 440 $162,987 40 $36,136 8 $123,422 APPLICATIONS WITHDRAWN 2 $221,410 68 $211,921 328 $172,425 11 $29,624 5 $240,800 FILES CLOSED FOR INCOMPLETENESS 0 $0 21 $193,636 86 $183,719 4 $31,242 1 $168,000
Aggregated Statistics For Year 2002(Based on 1 full tract) A) FHA, FSA/RHS & VA B) Conventional C) Refinancings D) Home Improvement Loans E) Loans on Dwellings For 5+ Families F) Non-occupant Loans on Number Average Value Number Average Value Number Average Value Number Average Value Number Average Value Number Average Value
LOANS ORIGINATED 5 $153,400 20 $148,300 101 $134,406 1 $23,000 1 $1,035,000 5 $164,800 APPLICATIONS APPROVED, NOT ACCEPTED 0 $0 0 $0 20 $118,750 3 $10,333 0 $0 0 $0 APPLICATIONS DENIED 0 $0 0 $0 18 $129,167 4 $9,500 0 $0 1 $113,000 APPLICATIONS WITHDRAWN 0 $0 1 $125,000 29 $148,345 1 $35,000 0 $0 1 $95,000 FILES CLOSED FOR INCOMPLETENESS 0 $0 0 $0 13 $156,231 0 $0 0 $0 1 $100,000
Aggregated Statistics For Year 2001(Based on 1 full tract) A) FHA, FSA/RHS & VA B) Conventional C) Refinancings D) Home Improvement Loans F) Non-occupant Loans on Number Average Value Number Average Value Number Average Value Number Average Value Number Average Value
LOANS ORIGINATED 7 $145,143 28 $132,286 81 $119,840 3 $34,000 4 $92,250 APPLICATIONS APPROVED, NOT ACCEPTED 0 $0 2 $26,500 2 $97,500 0 $0 0 $0 APPLICATIONS DENIED 1 $120,000 3 $86,333 30 $90,633 5 $23,200 0 $0 APPLICATIONS WITHDRAWN 0 $0 2 $119,500 28 $100,714 1 $35,000 0 $0 FILES CLOSED FOR INCOMPLETENESS 0 $0 0 $0 7 $113,857 0 $0 1 $229,000
Aggregated Statistics For Year 2000(Based on 1 full tract) A) FHA, FSA/RHS & VA B) Conventional C) Refinancings D) Home Improvement Loans F) Non-occupant Loans on Number Average Value Number Average Value Number Average Value Number Average Value Number Average Value
LOANS ORIGINATED 10 $133,200 27 $141,963 25 $94,720 7 $23,000 2 $95,000 APPLICATIONS APPROVED, NOT ACCEPTED 0 $0 4 $78,500 9 $69,000 3 $20,000 0 $0 APPLICATIONS DENIED 0 $0 9 $59,667 11 $66,364 6 $21,500 0 $0 APPLICATIONS WITHDRAWN 0 $0 4 $132,500 21 $75,667 1 $52,000 0 $0 FILES CLOSED FOR INCOMPLETENESS 1 $161,000 1 $56,000 2 $87,500 0 $0 0 $0
Aggregated Statistics For Year 1999(Based on 2 full tracts) A) FHA, FSA/RHS & VA B) Conventional C) Refinancings D) Home Improvement Loans E) Loans on Dwellings For 5+ Families F) Non-occupant Loans on Number Average Value Number Average Value Number Average Value Number Average Value Number Average Value Number Average Value
LOANS ORIGINATED 102 $138,093 770 $151,599 588 $109,329 106 $19,861 1 $8,293,470 14 $113,592 APPLICATIONS APPROVED, NOT ACCEPTED 4 $124,980 53 $157,986 84 $100,150 20 $21,224 0 $0 3 $71,620 APPLICATIONS DENIED 3 $107,957 61 $94,747 170 $96,316 44 $26,991 0 $0 3 $140,077 APPLICATIONS WITHDRAWN 4 $131,445 43 $138,241 155 $108,232 11 $41,682 0 $0 2 $105,555 FILES CLOSED FOR INCOMPLETENESS 0 $0 12 $216,254 44 $125,069 1 $29,870 0 $0 0 $0
Detailed HMDA statistics for the following Tracts:
0801.00
, 0802.01 , 0802.02 , 0802.03 , 0802.04 , 0802.05
Private Mortgage Insurance Companies Aggregated Statistics For Year 2009(Based on 6 full tracts) A) Conventional B) Refinancings C) Non-occupant Loans on Number Average Value Number Average Value Number Average Value
LOANS ORIGINATED 44 $234,251 21 $263,339 1 $144,000 APPLICATIONS APPROVED, NOT ACCEPTED 3 $255,937 11 $273,486 0 $0 APPLICATIONS DENIED 9 $222,191 3 $234,203 0 $0 APPLICATIONS WITHDRAWN 2 $177,000 4 $292,698 0 $0 FILES CLOSED FOR INCOMPLETENESS 2 $233,815 2 $236,500 0 $0
Aggregated Statistics For Year 2008(Based on 6 full tracts) A) Conventional B) Refinancings C) Non-occupant Loans on Number Average Value Number Average Value Number Average Value
LOANS ORIGINATED 86 $220,570 36 $248,534 7 $184,379 APPLICATIONS APPROVED, NOT ACCEPTED 24 $210,475 20 $265,152 3 $106,667 APPLICATIONS DENIED 7 $223,809 5 $273,200 2 $282,000 APPLICATIONS WITHDRAWN 2 $307,500 3 $277,000 0 $0 FILES CLOSED FOR INCOMPLETENESS 1 $260,000 1 $344,000 1 $260,000
Aggregated Statistics For Year 2007(Based on 6 full tracts) A) Conventional B) Refinancings C) Non-occupant Loans on Number Average Value Number Average Value Number Average Value
LOANS ORIGINATED 133 $226,149 44 $257,182 7 $286,649 APPLICATIONS APPROVED, NOT ACCEPTED 10 $196,460 11 $265,909 1 $231,000 APPLICATIONS DENIED 0 $0 0 $0 0 $0 APPLICATIONS WITHDRAWN 6 $203,127 4 $250,250 0 $0 FILES CLOSED FOR INCOMPLETENESS 0 $0 0 $0 0 $0
Aggregated Statistics For Year 2006(Based on 6 full tracts) A) Conventional B) Refinancings C) Non-occupant Loans on Number Average Value Number Average Value Number Average Value
LOANS ORIGINATED 53 $242,970 22 $253,945 4 $253,375 APPLICATIONS APPROVED, NOT ACCEPTED 4 $264,500 6 $299,288 0 $0 APPLICATIONS DENIED 1 $248,800 1 $253,000 0 $0 APPLICATIONS WITHDRAWN 4 $249,670 2 $237,310 0 $0 FILES CLOSED FOR INCOMPLETENESS 1 $224,000 0 $0 0 $0
Aggregated Statistics For Year 2005(Based on 6 full tracts) A) Conventional B) Refinancings C) Non-occupant Loans on Number Average Value Number Average Value Number Average Value
LOANS ORIGINATED 74 $224,728 34 $228,962 5 $202,566 APPLICATIONS APPROVED, NOT ACCEPTED 11 $255,495 4 $209,948 1 $141,000 APPLICATIONS DENIED 1 $250,000 2 $131,500 0 $0 APPLICATIONS WITHDRAWN 6 $198,833 2 $261,880 0 $0 FILES CLOSED FOR INCOMPLETENESS 0 $0 1 $230,000 0 $0
Aggregated Statistics For Year 2004(Based on 6 full tracts) A) Conventional B) Refinancings C) Non-occupant Loans on Number Average Value Number Average Value Number Average Value
LOANS ORIGINATED 102 $226,937 48 $218,949 5 $182,600 APPLICATIONS APPROVED, NOT ACCEPTED 22 $243,734 26 $236,453 1 $233,810 APPLICATIONS DENIED 4 $194,668 2 $130,000 0 $0 APPLICATIONS WITHDRAWN 6 $234,805 14 $203,881 1 $189,000 FILES CLOSED FOR INCOMPLETENESS 3 $200,270 0 $0 0 $0
Aggregated Statistics For Year 2003(Based on 6 full tracts) A) Conventional B) Refinancings C) Non-occupant Loans on Number Average Value Number Average Value Number Average Value
LOANS ORIGINATED 161 $212,556 197 $203,559 2 $188,920 APPLICATIONS APPROVED, NOT ACCEPTED 20 $208,070 48 $241,562 2 $160,930 APPLICATIONS DENIED 1 $168,000 3 $215,667 1 $204,000 APPLICATIONS WITHDRAWN 4 $222,445 13 $212,822 0 $0 FILES CLOSED FOR INCOMPLETENESS 0 $0 3 $233,000 0 $0
Aggregated Statistics For Year 2002(Based on 1 full tract) A) Conventional B) Refinancings Number Average Value Number Average Value
LOANS ORIGINATED 7 $171,000 8 $150,625 APPLICATIONS APPROVED, NOT ACCEPTED 1 $117,000 1 $168,000 APPLICATIONS DENIED 0 $0 0 $0 APPLICATIONS WITHDRAWN 0 $0 0 $0 FILES CLOSED FOR INCOMPLETENESS 0 $0 1 $138,000
Aggregated Statistics For Year 2001(Based on 1 full tract) A) Conventional B) Refinancings C) Non-occupant Loans on Number Average Value Number Average Value Number Average Value
LOANS ORIGINATED 12 $135,333 9 $149,000 1 $120,000 APPLICATIONS APPROVED, NOT ACCEPTED 2 $173,500 1 $253,000 0 $0 APPLICATIONS DENIED 0 $0 0 $0 0 $0 APPLICATIONS WITHDRAWN 1 $117,000 0 $0 0 $0 FILES CLOSED FOR INCOMPLETENESS 0 $0 0 $0 0 $0
Aggregated Statistics For Year 2000(Based on 1 full tract) A) Conventional B) Refinancings C) Non-occupant Loans on Number Average Value Number Average Value Number Average Value
LOANS ORIGINATED 14 $132,643 5 $131,200 1 $108,000 APPLICATIONS APPROVED, NOT ACCEPTED 2 $129,500 0 $0 0 $0 APPLICATIONS DENIED 0 $0 0 $0 0 $0 APPLICATIONS WITHDRAWN 0 $0 0 $0 0 $0 FILES CLOSED FOR INCOMPLETENESS 0 $0 0 $0 0 $0
Aggregated Statistics For Year 1999(Based on 2 full tracts) A) Conventional B) Refinancings C) Non-occupant Loans on Number Average Value Number Average Value Number Average Value
LOANS ORIGINATED 314 $170,317 96 $143,968 2 $96,595 APPLICATIONS APPROVED, NOT ACCEPTED 30 $151,793 17 $150,249 0 $0 APPLICATIONS DENIED 7 $177,013 0 $0 2 $166,300 APPLICATIONS WITHDRAWN 7 $144,876 2 $123,480 1 $74,090 FILES CLOSED FOR INCOMPLETENESS 2 $144,890 0 $0 0 $0
Detailed PMIC statistics for the following Tracts:
0801.00
, 0802.01 , 0802.02 , 0802.03 , 0802.04 , 0802.05
Most common first names in Savage, MN among deceased individuals Name Count Lived (average)
John 31 69.5 years Mary 17 75.7 years Robert 16 73.4 years William 15 81.2 years Helen 12 78.8 years Dorothy 11 75.5 years Margaret 11 80.4 years James 10 65.4 years George 10 76.1 years Arthur 10 78.5 years
Most common last names in Savage, MN among deceased individuals Last name Count Lived (average)
Anderson 17 78.5 years Johnson 13 80.9 years Smith 10 78.2 years Carlson 7 68.3 years Allen 7 76.5 years Nelson 7 69.6 years Peterson 7 78.8 years Egan 6 72.7 years Larson 5 71.0 years Evans 5 77.3 years
Savage compared to Minnesota state average:
Unemployed percentage significantly below state average. Black race population percentage above state average. Median age significantly below state average. Foreign-born population percentage above state average. Renting percentage below state average. Length of stay since moving in significantly above state average. House age significantly below state average. Percentage of population with a bachelor's degree or higher above state average.
#90 on the list of "Top 100 cities with highest median household income and median resident age less than 35 (pop. 5,000+)"
#95 on the list of "Top 101 cities with the smallest household incomes disparities (population 5,000+)"
#99 on the list of "Top 101 cities with largest percentage of females in occupations: business and financial operations occupations (population 5,000+)"
#100 (55378) on the list of "Top 101 zip codes with the largest percentage of Norwegian first ancestries (pop 5,000+)"
#18 on the list of "Top 101 counties with the lowest percentage of residents relocating to foreign countries in 2011"
#45 on the list of "Top 101 counties with the lowest number of deaths per 1000 residents 2007-2013"
#55 on the list of "Top 101 counties with the largest number of children under 18 without health insurance coverage in 2000"
Top Patent Applicants
Scott C. Kowalczyk (54)
Erik C. Olson (43)
Ponharith Nhep (38)
James Gary Wessel (31)
Steven R. Wedan (26)
Philip M. Wala (25)
Zheng Gao (24)
Robert D. Horning (23)
Hong Cao (23)
Jonathan Walter Coan (22)
Total of 1030 patent applications in 2008-2024.

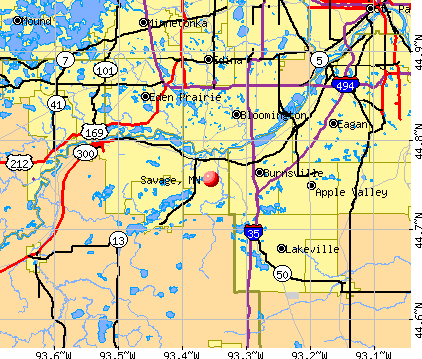


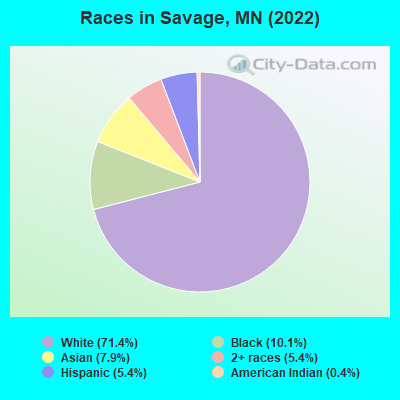
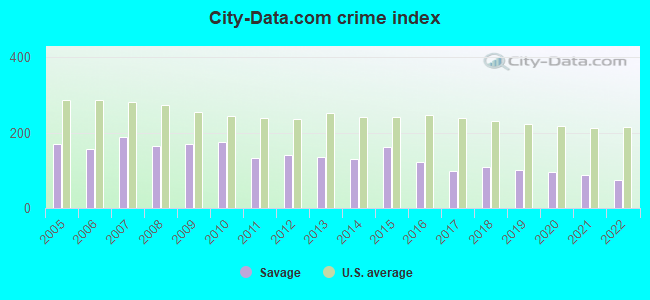
 Recent articles from our blog. Our writers, many of them Ph.D. graduates or candidates, create easy-to-read articles on a wide variety of topics.

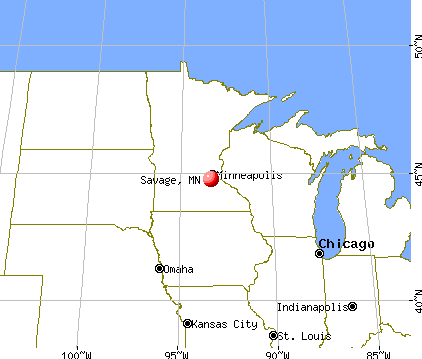
 (3.6 miles
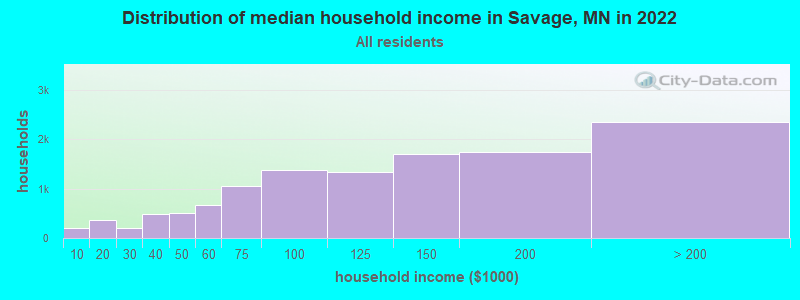
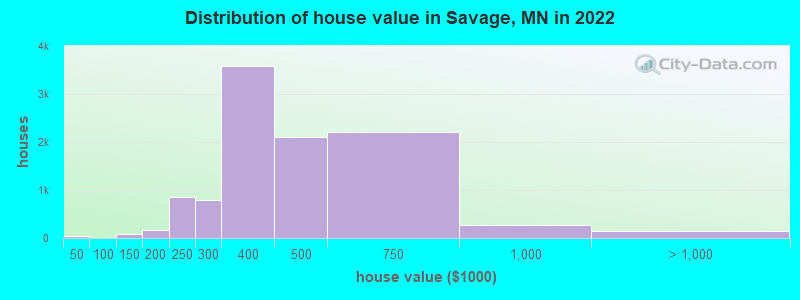
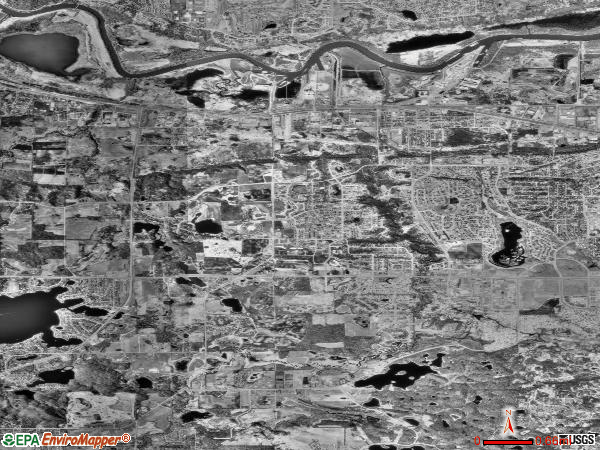
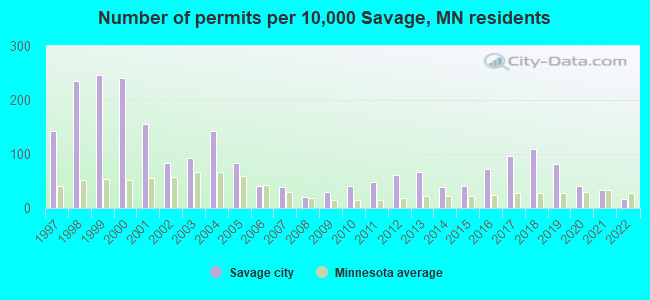
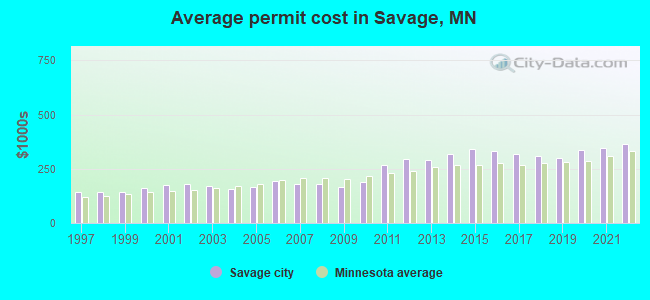
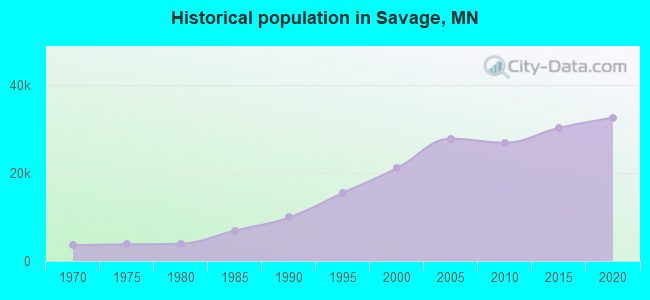
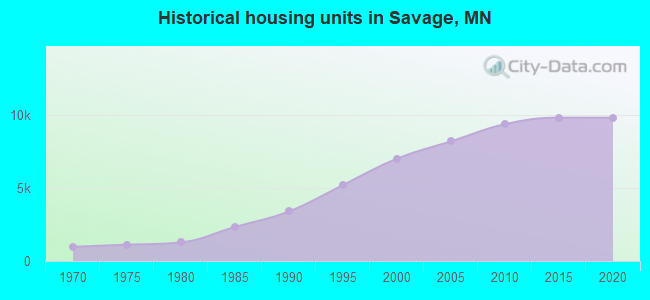
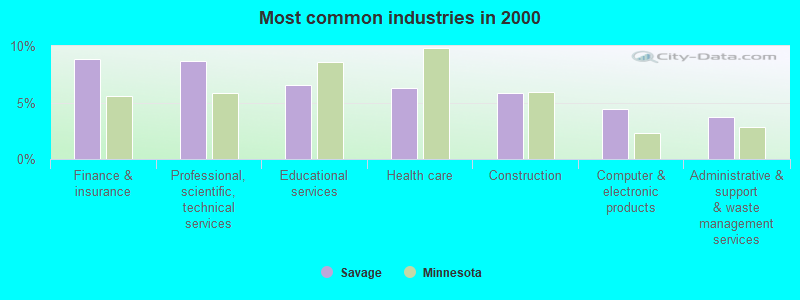
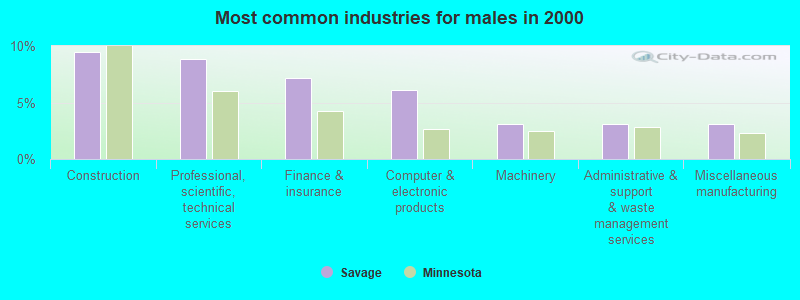
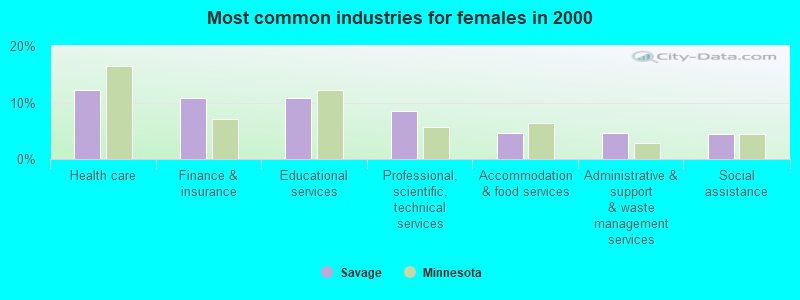
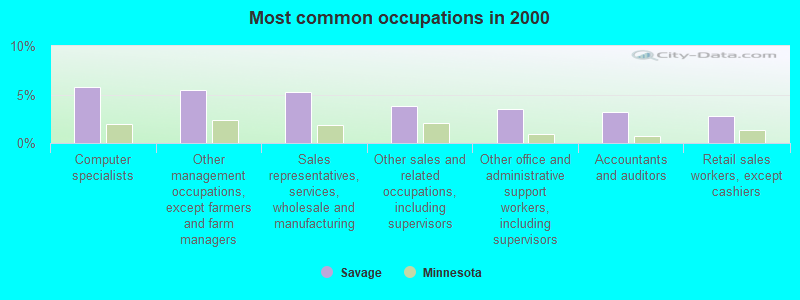
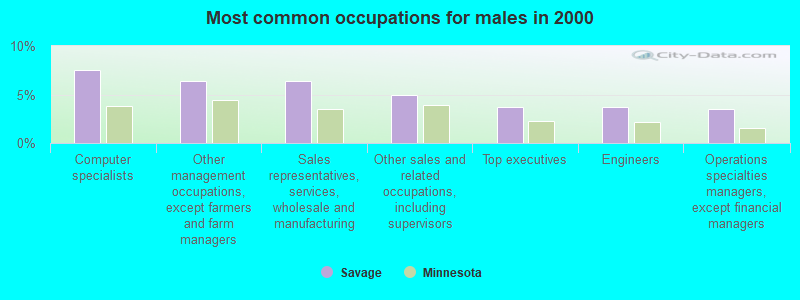
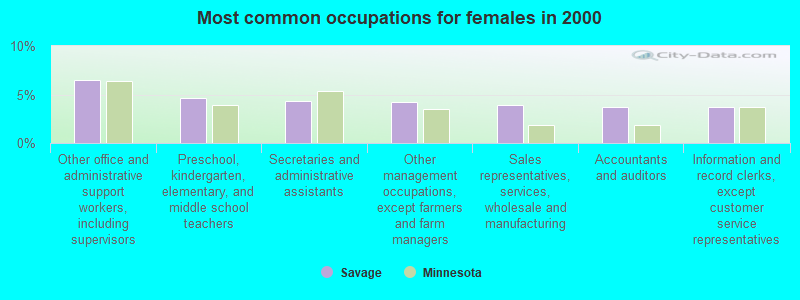
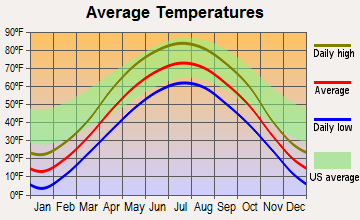
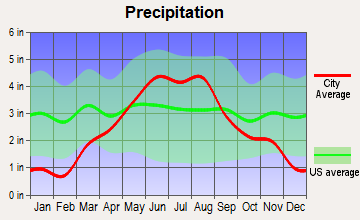
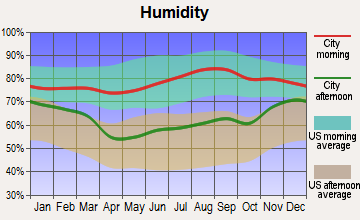
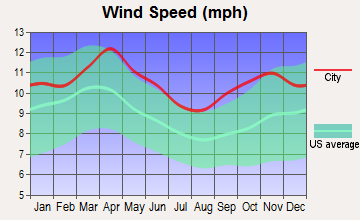
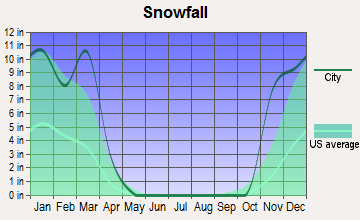
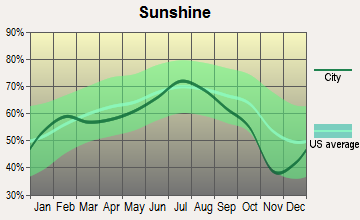
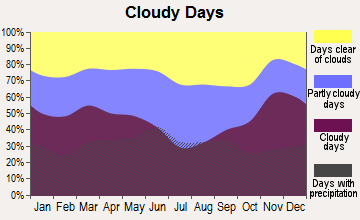


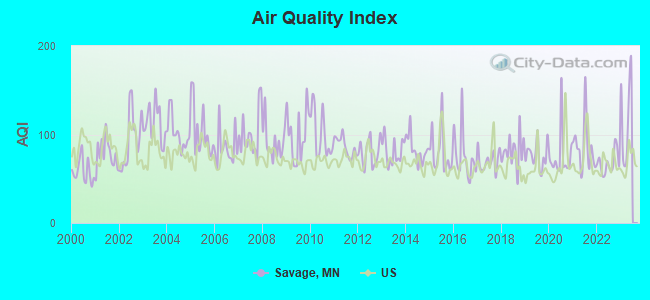
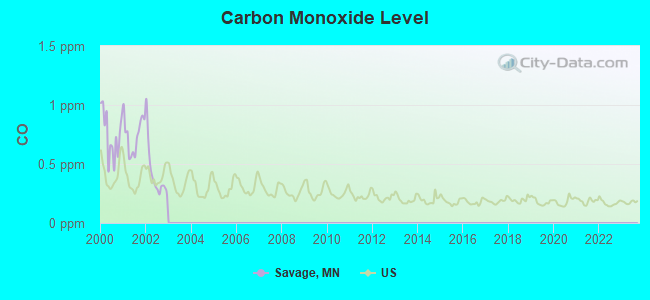
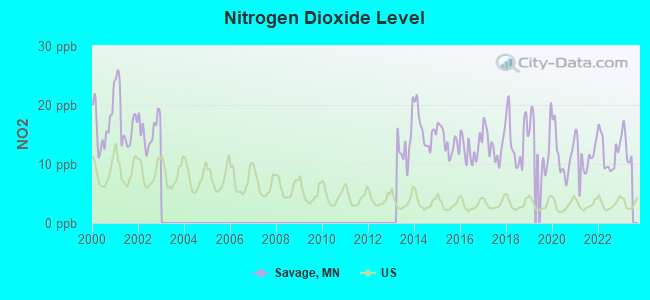
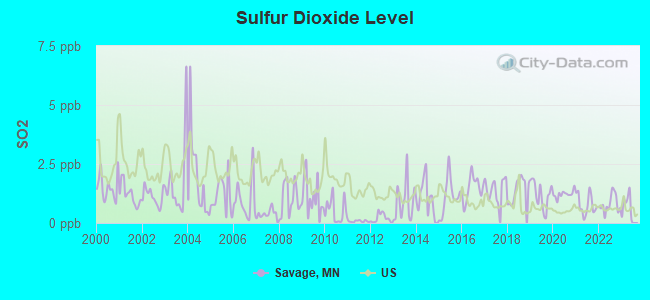
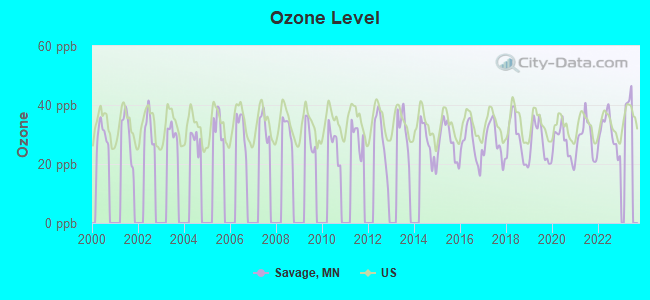
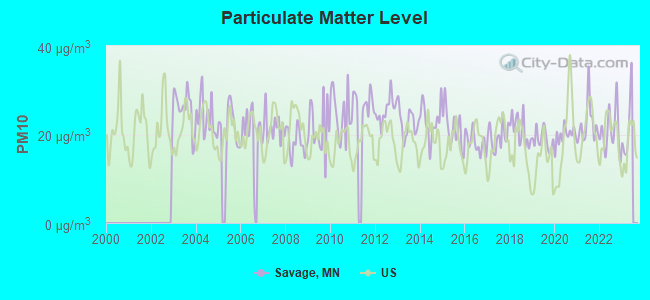
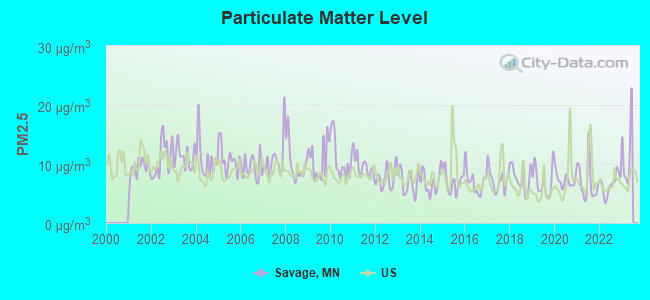
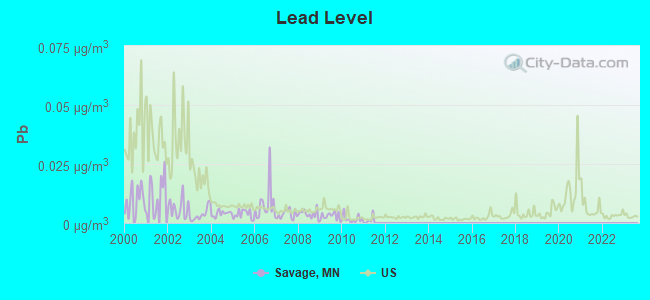

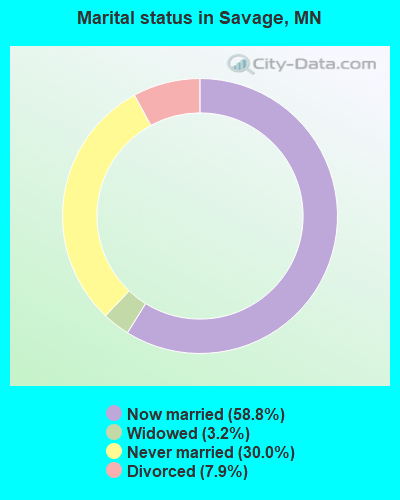
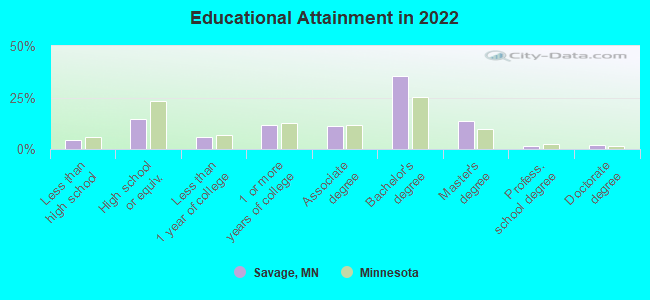
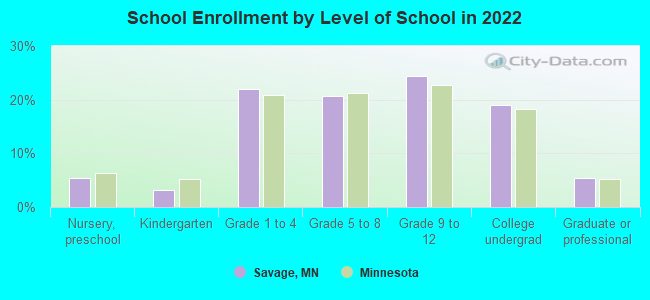
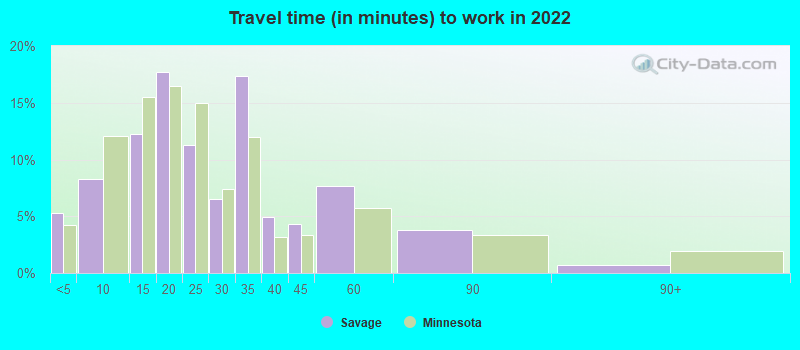
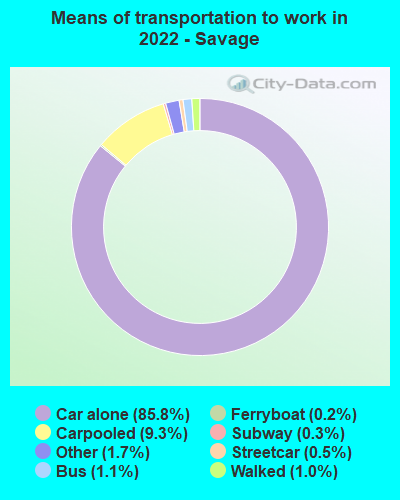
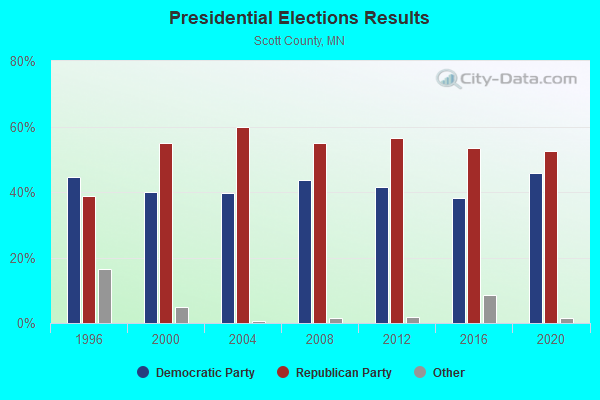
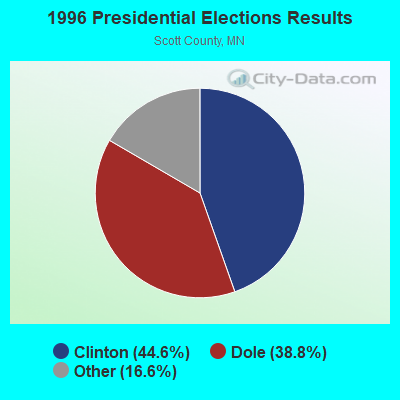
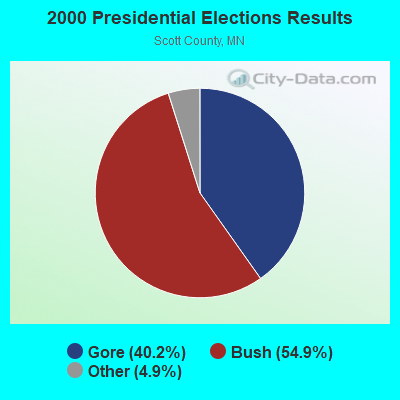
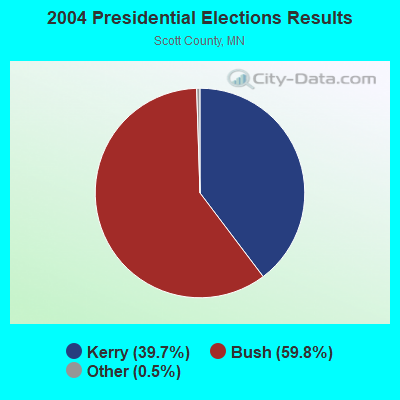
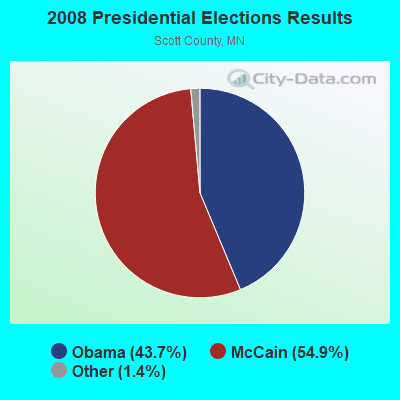
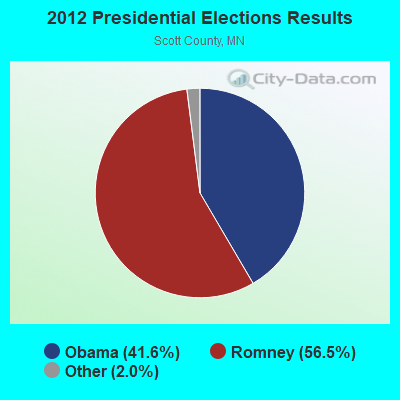
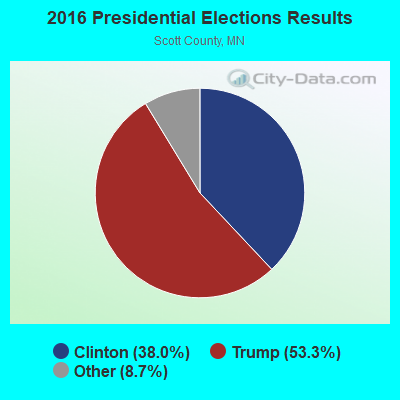
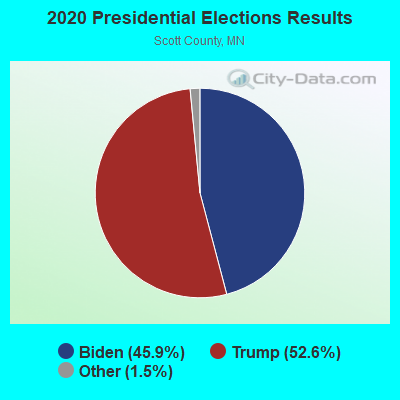
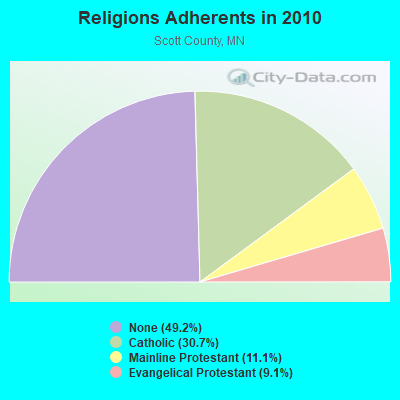
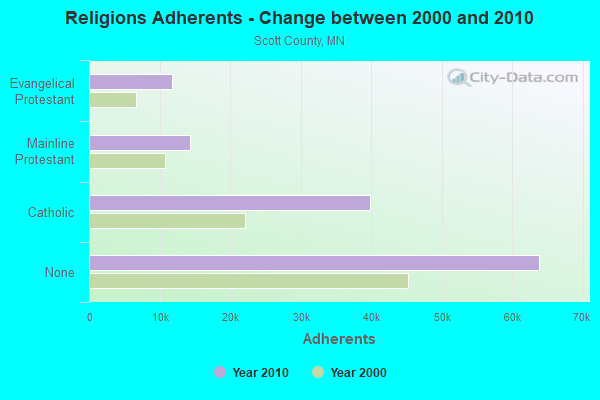
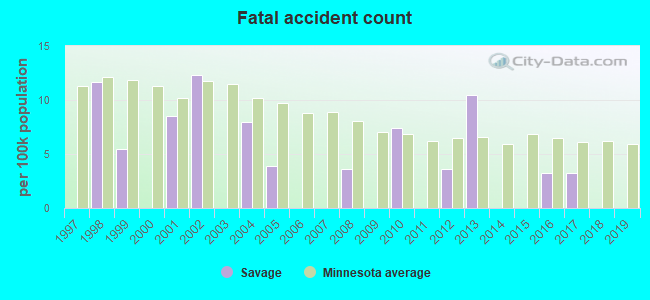
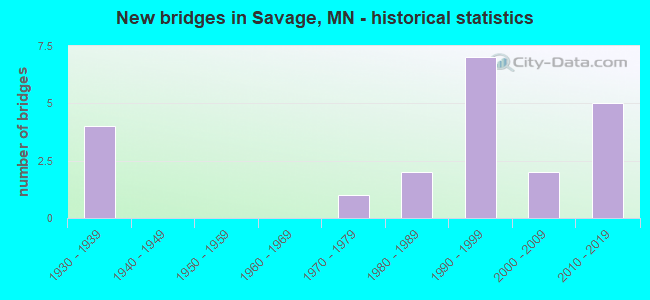
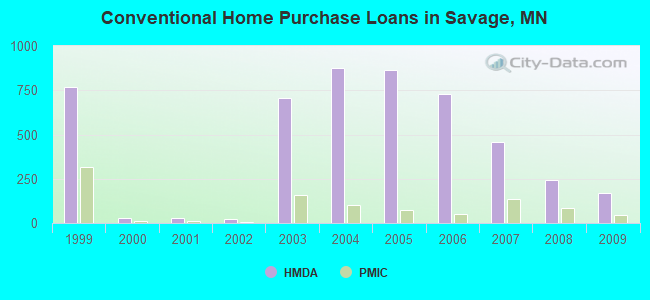
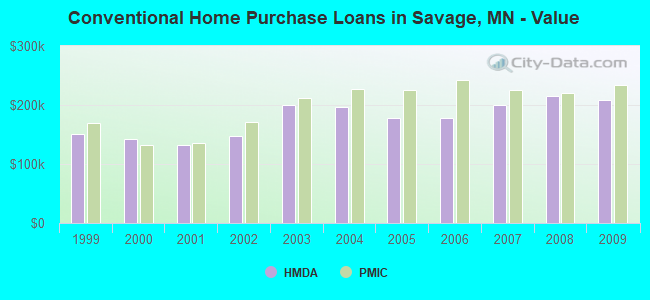
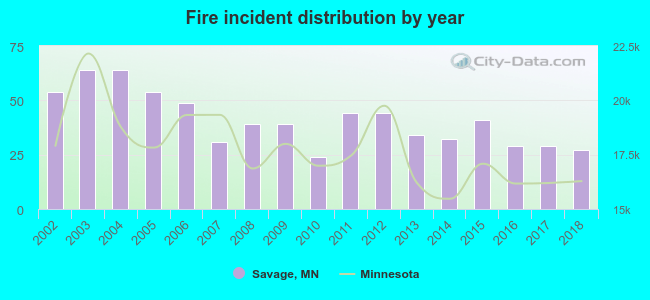 Based on the data from the years 2002 - 2018 the average number of fire incidents per year is 41. The highest number of fires - 64 took place in 2003, and the least - 24 in 2010. The data has a decreasing trend.
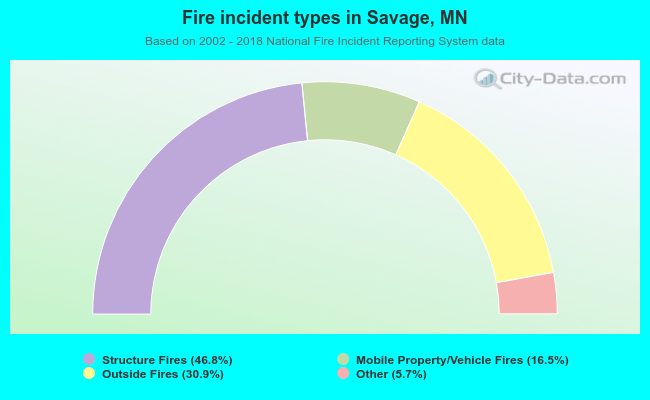 When looking into fire subcategories, the most incidents belonged to: Structure Fires (46.8%), and Outside Fires (30.9%).