Hinsdale, Illinois Submit your own pictures of this village and show them to the world
OSM Map
General Map
Google Map
MSN Map
OSM Map
General Map
Google Map
MSN Map
OSM Map
General Map
Google Map
MSN Map
OSM Map
General Map
Google Map
MSN Map
Please wait while loading the map...
Population in 2022: 17,235 (100% urban, 0% rural). Population change since 2000: -0.7%Males: 8,671 Females: 8,564
March 2022 cost of living index in Hinsdale: 103.3 (near average, U.S. average is 100) Percentage of residents living in poverty in 2022: 1.4%for White Non-Hispanic residents , 3.5% for Hispanic or Latino residents , 5.0% for other race residents , 0.1% for two or more races residents )
Profiles of local businesses
Business Search - 14 Million verified businesses
Data:
Median household income ($)
Median household income (% change since 2000)
Household income diversity
Ratio of average income to average house value (%)
Ratio of average income to average rent
Median household income ($) - White
Median household income ($) - Black or African American
Median household income ($) - Asian
Median household income ($) - Hispanic or Latino
Median household income ($) - American Indian and Alaska Native
Median household income ($) - Multirace
Median household income ($) - Other Race
Median household income for houses/condos with a mortgage ($)
Median household income for apartments without a mortgage ($)
Races - White alone (%)
Races - White alone (% change since 2000)
Races - Black alone (%)
Races - Black alone (% change since 2000)
Races - American Indian alone (%)
Races - American Indian alone (% change since 2000)
Races - Asian alone (%)
Races - Asian alone (% change since 2000)
Races - Hispanic (%)
Races - Hispanic (% change since 2000)
Races - Native Hawaiian and Other Pacific Islander alone (%)
Races - Native Hawaiian and Other Pacific Islander alone (% change since 2000)
Races - Two or more races (%)
Races - Two or more races (% change since 2000)
Races - Other race alone (%)
Races - Other race alone (% change since 2000)
Racial diversity
Unemployment (%)
Unemployment (% change since 2000)
Unemployment (%) - White
Unemployment (%) - Black or African American
Unemployment (%) - Asian
Unemployment (%) - Hispanic or Latino
Unemployment (%) - American Indian and Alaska Native
Unemployment (%) - Multirace
Unemployment (%) - Other Race
Population density (people per square mile)
Population - Males (%)
Population - Females (%)
Population - Males (%) - White
Population - Males (%) - Black or African American
Population - Males (%) - Asian
Population - Males (%) - Hispanic or Latino
Population - Males (%) - American Indian and Alaska Native
Population - Males (%) - Multirace
Population - Males (%) - Other Race
Population - Females (%) - White
Population - Females (%) - Black or African American
Population - Females (%) - Asian
Population - Females (%) - Hispanic or Latino
Population - Females (%) - American Indian and Alaska Native
Population - Females (%) - Multirace
Population - Females (%) - Other Race
Coronavirus confirmed cases (Apr 27, 2024)
Deaths caused by coronavirus (Apr 27, 2024)
Coronavirus confirmed cases (per 100k population) (Apr 27, 2024)
Deaths caused by coronavirus (per 100k population) (Apr 27, 2024)
Daily increase in number of cases (Apr 27, 2024)
Weekly increase in number of cases (Apr 27, 2024)
Cases doubled (in days) (Apr 27, 2024)
Hospitalized patients (Apr 18, 2022)
Negative test results (Apr 18, 2022)
Total test results (Apr 18, 2022)
COVID Vaccine doses distributed (per 100k population) (Sep 19, 2023)
COVID Vaccine doses administered (per 100k population) (Sep 19, 2023)
COVID Vaccine doses distributed (Sep 19, 2023)
COVID Vaccine doses administered (Sep 19, 2023)
Likely homosexual households (%)
Likely homosexual households (% change since 2000)
Likely homosexual households - Lesbian couples (%)
Likely homosexual households - Lesbian couples (% change since 2000)
Likely homosexual households - Gay men (%)
Likely homosexual households - Gay men (% change since 2000)
Cost of living index
Median gross rent ($)
Median contract rent ($)
Median monthly housing costs ($)
Median house or condo value ($)
Median house or condo value ($ change since 2000)
Mean house or condo value by units in structure - 1, detached ($)
Mean house or condo value by units in structure - 1, attached ($)
Mean house or condo value by units in structure - 2 ($)
Mean house or condo value by units in structure by units in structure - 3 or 4 ($)
Mean house or condo value by units in structure - 5 or more ($)
Mean house or condo value by units in structure - Boat, RV, van, etc. ($)
Mean house or condo value by units in structure - Mobile home ($)
Median house or condo value ($) - White
Median house or condo value ($) - Black or African American
Median house or condo value ($) - Asian
Median house or condo value ($) - Hispanic or Latino
Median house or condo value ($) - American Indian and Alaska Native
Median house or condo value ($) - Multirace
Median house or condo value ($) - Other Race
Median resident age
Resident age diversity
Median resident age - Males
Median resident age - Females
Median resident age - White
Median resident age - Black or African American
Median resident age - Asian
Median resident age - Hispanic or Latino
Median resident age - American Indian and Alaska Native
Median resident age - Multirace
Median resident age - Other Race
Median resident age - Males - White
Median resident age - Males - Black or African American
Median resident age - Males - Asian
Median resident age - Males - Hispanic or Latino
Median resident age - Males - American Indian and Alaska Native
Median resident age - Males - Multirace
Median resident age - Males - Other Race
Median resident age - Females - White
Median resident age - Females - Black or African American
Median resident age - Females - Asian
Median resident age - Females - Hispanic or Latino
Median resident age - Females - American Indian and Alaska Native
Median resident age - Females - Multirace
Median resident age - Females - Other Race
Commute - mean travel time to work (minutes)
Travel time to work - Less than 5 minutes (%)
Travel time to work - Less than 5 minutes (% change since 2000)
Travel time to work - 5 to 9 minutes (%)
Travel time to work - 5 to 9 minutes (% change since 2000)
Travel time to work - 10 to 19 minutes (%)
Travel time to work - 10 to 19 minutes (% change since 2000)
Travel time to work - 20 to 29 minutes (%)
Travel time to work - 20 to 29 minutes (% change since 2000)
Travel time to work - 30 to 39 minutes (%)
Travel time to work - 30 to 39 minutes (% change since 2000)
Travel time to work - 40 to 59 minutes (%)
Travel time to work - 40 to 59 minutes (% change since 2000)
Travel time to work - 60 to 89 minutes (%)
Travel time to work - 60 to 89 minutes (% change since 2000)
Travel time to work - 90 or more minutes (%)
Travel time to work - 90 or more minutes (% change since 2000)
Marital status - Never married (%)
Marital status - Now married (%)
Marital status - Separated (%)
Marital status - Widowed (%)
Marital status - Divorced (%)
Median family income ($)
Median family income (% change since 2000)
Median non-family income ($)
Median non-family income (% change since 2000)
Median per capita income ($)
Median per capita income (% change since 2000)
Median family income ($) - White
Median family income ($) - Black or African American
Median family income ($) - Asian
Median family income ($) - Hispanic or Latino
Median family income ($) - American Indian and Alaska Native
Median family income ($) - Multirace
Median family income ($) - Other Race
Median year house/condo built
Median year apartment built
Year house built - Built 2005 or later (%)
Year house built - Built 2000 to 2004 (%)
Year house built - Built 1990 to 1999 (%)
Year house built - Built 1980 to 1989 (%)
Year house built - Built 1970 to 1979 (%)
Year house built - Built 1960 to 1969 (%)
Year house built - Built 1950 to 1959 (%)
Year house built - Built 1940 to 1949 (%)
Year house built - Built 1939 or earlier (%)
Average household size
Household density (households per square mile)
Average household size - White
Average household size - Black or African American
Average household size - Asian
Average household size - Hispanic or Latino
Average household size - American Indian and Alaska Native
Average household size - Multirace
Average household size - Other Race
Occupied housing units (%)
Vacant housing units (%)
Owner occupied housing units (%)
Renter occupied housing units (%)
Vacancy status - For rent (%)
Vacancy status - For sale only (%)
Vacancy status - Rented or sold, not occupied (%)
Vacancy status - For seasonal, recreational, or occasional use (%)
Vacancy status - For migrant workers (%)
Vacancy status - Other vacant (%)
Residents with income below the poverty level (%)
Residents with income below 50% of the poverty level (%)
Children below poverty level (%)
Poor families by family type - Married-couple family (%)
Poor families by family type - Male, no wife present (%)
Poor families by family type - Female, no husband present (%)
Poverty status for native-born residents (%)
Poverty status for foreign-born residents (%)
Poverty among high school graduates not in families (%)
Poverty among people who did not graduate high school not in families (%)
Residents with income below the poverty level (%) - White
Residents with income below the poverty level (%) - Black or African American
Residents with income below the poverty level (%) - Asian
Residents with income below the poverty level (%) - Hispanic or Latino
Residents with income below the poverty level (%) - American Indian and Alaska Native
Residents with income below the poverty level (%) - Multirace
Residents with income below the poverty level (%) - Other Race
Air pollution - Air Quality Index (AQI)
Air pollution - CO
Air pollution - NO2
Air pollution - SO2
Air pollution - Ozone
Air pollution - PM10
Air pollution - PM25
Air pollution - Pb
Crime - Murders per 100,000 population
Crime - Rapes per 100,000 population
Crime - Robberies per 100,000 population
Crime - Assaults per 100,000 population
Crime - Burglaries per 100,000 population
Crime - Thefts per 100,000 population
Crime - Auto thefts per 100,000 population
Crime - Arson per 100,000 population
Crime - City-data.com crime index
Crime - Violent crime index
Crime - Property crime index
Crime - Murders per 100,000 population (5 year average)
Crime - Rapes per 100,000 population (5 year average)
Crime - Robberies per 100,000 population (5 year average)
Crime - Assaults per 100,000 population (5 year average)
Crime - Burglaries per 100,000 population (5 year average)
Crime - Thefts per 100,000 population (5 year average)
Crime - Auto thefts per 100,000 population (5 year average)
Crime - Arson per 100,000 population (5 year average)
Crime - City-data.com crime index (5 year average)
Crime - Violent crime index (5 year average)
Crime - Property crime index (5 year average)
1996 Presidential Elections Results (%) - Democratic Party (Clinton)
1996 Presidential Elections Results (%) - Republican Party (Dole)
1996 Presidential Elections Results (%) - Other
2000 Presidential Elections Results (%) - Democratic Party (Gore)
2000 Presidential Elections Results (%) - Republican Party (Bush)
2000 Presidential Elections Results (%) - Other
2004 Presidential Elections Results (%) - Democratic Party (Kerry)
2004 Presidential Elections Results (%) - Republican Party (Bush)
2004 Presidential Elections Results (%) - Other
2008 Presidential Elections Results (%) - Democratic Party (Obama)
2008 Presidential Elections Results (%) - Republican Party (McCain)
2008 Presidential Elections Results (%) - Other
2012 Presidential Elections Results (%) - Democratic Party (Obama)
2012 Presidential Elections Results (%) - Republican Party (Romney)
2012 Presidential Elections Results (%) - Other
2016 Presidential Elections Results (%) - Democratic Party (Clinton)
2016 Presidential Elections Results (%) - Republican Party (Trump)
2016 Presidential Elections Results (%) - Other
2020 Presidential Elections Results (%) - Democratic Party (Biden)
2020 Presidential Elections Results (%) - Republican Party (Trump)
2020 Presidential Elections Results (%) - Other
Ancestries Reported - Arab (%)
Ancestries Reported - Czech (%)
Ancestries Reported - Danish (%)
Ancestries Reported - Dutch (%)
Ancestries Reported - English (%)
Ancestries Reported - French (%)
Ancestries Reported - French Canadian (%)
Ancestries Reported - German (%)
Ancestries Reported - Greek (%)
Ancestries Reported - Hungarian (%)
Ancestries Reported - Irish (%)
Ancestries Reported - Italian (%)
Ancestries Reported - Lithuanian (%)
Ancestries Reported - Norwegian (%)
Ancestries Reported - Polish (%)
Ancestries Reported - Portuguese (%)
Ancestries Reported - Russian (%)
Ancestries Reported - Scotch-Irish (%)
Ancestries Reported - Scottish (%)
Ancestries Reported - Slovak (%)
Ancestries Reported - Subsaharan African (%)
Ancestries Reported - Swedish (%)
Ancestries Reported - Swiss (%)
Ancestries Reported - Ukrainian (%)
Ancestries Reported - United States (%)
Ancestries Reported - Welsh (%)
Ancestries Reported - West Indian (%)
Ancestries Reported - Other (%)
Educational Attainment - No schooling completed (%)
Educational Attainment - Less than high school (%)
Educational Attainment - High school or equivalent (%)
Educational Attainment - Less than 1 year of college (%)
Educational Attainment - 1 or more years of college (%)
Educational Attainment - Associate degree (%)
Educational Attainment - Bachelor's degree (%)
Educational Attainment - Master's degree (%)
Educational Attainment - Professional school degree (%)
Educational Attainment - Doctorate degree (%)
School Enrollment - Nursery, preschool (%)
School Enrollment - Kindergarten (%)
School Enrollment - Grade 1 to 4 (%)
School Enrollment - Grade 5 to 8 (%)
School Enrollment - Grade 9 to 12 (%)
School Enrollment - College undergrad (%)
School Enrollment - Graduate or professional (%)
School Enrollment - Not enrolled in school (%)
School enrollment - Public schools (%)
School enrollment - Private schools (%)
School enrollment - Not enrolled (%)
Median number of rooms in houses and condos
Median number of rooms in apartments
Housing units lacking complete plumbing facilities (%)
Housing units lacking complete kitchen facilities (%)
Density of houses
Urban houses (%)
Rural houses (%)
Households with people 60 years and over (%)
Households with people 65 years and over (%)
Households with people 75 years and over (%)
Households with one or more nonrelatives (%)
Households with no nonrelatives (%)
Population in households (%)
Family households (%)
Nonfamily households (%)
Population in families (%)
Family households with own children (%)
Median number of bedrooms in owner occupied houses
Mean number of bedrooms in owner occupied houses
Median number of bedrooms in renter occupied houses
Mean number of bedrooms in renter occupied houses
Median number of vehichles in owner occupied houses
Mean number of vehichles in owner occupied houses
Median number of vehichles in renter occupied houses
Mean number of vehichles in renter occupied houses
Mortgage status - with mortgage (%)
Mortgage status - with second mortgage (%)
Mortgage status - with home equity loan (%)
Mortgage status - with both second mortgage and home equity loan (%)
Mortgage status - without a mortgage (%)
Average family size
Average family size - White
Average family size - Black or African American
Average family size - Asian
Average family size - Hispanic or Latino
Average family size - American Indian and Alaska Native
Average family size - Multirace
Average family size - Other Race
Geographical mobility - Same house 1 year ago (%)
Geographical mobility - Moved within same county (%)
Geographical mobility - Moved from different county within same state (%)
Geographical mobility - Moved from different state (%)
Geographical mobility - Moved from abroad (%)
Place of birth - Born in state of residence (%)
Place of birth - Born in other state (%)
Place of birth - Native, outside of US (%)
Place of birth - Foreign born (%)
Housing units in structures - 1, detached (%)
Housing units in structures - 1, attached (%)
Housing units in structures - 2 (%)
Housing units in structures - 3 or 4 (%)
Housing units in structures - 5 to 9 (%)
Housing units in structures - 10 to 19 (%)
Housing units in structures - 20 to 49 (%)
Housing units in structures - 50 or more (%)
Housing units in structures - Mobile home (%)
Housing units in structures - Boat, RV, van, etc. (%)
House/condo owner moved in on average (years ago)
Renter moved in on average (years ago)
Year householder moved into unit - Moved in 1999 to March 2000 (%)
Year householder moved into unit - Moved in 1995 to 1998 (%)
Year householder moved into unit - Moved in 1990 to 1994 (%)
Year householder moved into unit - Moved in 1980 to 1989 (%)
Year householder moved into unit - Moved in 1970 to 1979 (%)
Year householder moved into unit - Moved in 1969 or earlier (%)
Means of transportation to work - Drove car alone (%)
Means of transportation to work - Carpooled (%)
Means of transportation to work - Public transportation (%)
Means of transportation to work - Bus or trolley bus (%)
Means of transportation to work - Streetcar or trolley car (%)
Means of transportation to work - Subway or elevated (%)
Means of transportation to work - Railroad (%)
Means of transportation to work - Ferryboat (%)
Means of transportation to work - Taxicab (%)
Means of transportation to work - Motorcycle (%)
Means of transportation to work - Bicycle (%)
Means of transportation to work - Walked (%)
Means of transportation to work - Other means (%)
Working at home (%)
Industry diversity
Most Common Industries - Agriculture, forestry, fishing and hunting, and mining (%)
Most Common Industries - Agriculture, forestry, fishing and hunting (%)
Most Common Industries - Mining, quarrying, and oil and gas extraction (%)
Most Common Industries - Construction (%)
Most Common Industries - Manufacturing (%)
Most Common Industries - Wholesale trade (%)
Most Common Industries - Retail trade (%)
Most Common Industries - Transportation and warehousing, and utilities (%)
Most Common Industries - Transportation and warehousing (%)
Most Common Industries - Utilities (%)
Most Common Industries - Information (%)
Most Common Industries - Finance and insurance, and real estate and rental and leasing (%)
Most Common Industries - Finance and insurance (%)
Most Common Industries - Real estate and rental and leasing (%)
Most Common Industries - Professional, scientific, and management, and administrative and waste management services (%)
Most Common Industries - Professional, scientific, and technical services (%)
Most Common Industries - Management of companies and enterprises (%)
Most Common Industries - Administrative and support and waste management services (%)
Most Common Industries - Educational services, and health care and social assistance (%)
Most Common Industries - Educational services (%)
Most Common Industries - Health care and social assistance (%)
Most Common Industries - Arts, entertainment, and recreation, and accommodation and food services (%)
Most Common Industries - Arts, entertainment, and recreation (%)
Most Common Industries - Accommodation and food services (%)
Most Common Industries - Other services, except public administration (%)
Most Common Industries - Public administration (%)
Occupation diversity
Most Common Occupations - Management, business, science, and arts occupations (%)
Most Common Occupations - Management, business, and financial occupations (%)
Most Common Occupations - Management occupations (%)
Most Common Occupations - Business and financial operations occupations (%)
Most Common Occupations - Computer, engineering, and science occupations (%)
Most Common Occupations - Computer and mathematical occupations (%)
Most Common Occupations - Architecture and engineering occupations (%)
Most Common Occupations - Life, physical, and social science occupations (%)
Most Common Occupations - Education, legal, community service, arts, and media occupations (%)
Most Common Occupations - Community and social service occupations (%)
Most Common Occupations - Legal occupations (%)
Most Common Occupations - Education, training, and library occupations (%)
Most Common Occupations - Arts, design, entertainment, sports, and media occupations (%)
Most Common Occupations - Healthcare practitioners and technical occupations (%)
Most Common Occupations - Health diagnosing and treating practitioners and other technical occupations (%)
Most Common Occupations - Health technologists and technicians (%)
Most Common Occupations - Service occupations (%)
Most Common Occupations - Healthcare support occupations (%)
Most Common Occupations - Protective service occupations (%)
Most Common Occupations - Fire fighting and prevention, and other protective service workers including supervisors (%)
Most Common Occupations - Law enforcement workers including supervisors (%)
Most Common Occupations - Food preparation and serving related occupations (%)
Most Common Occupations - Building and grounds cleaning and maintenance occupations (%)
Most Common Occupations - Personal care and service occupations (%)
Most Common Occupations - Sales and office occupations (%)
Most Common Occupations - Sales and related occupations (%)
Most Common Occupations - Office and administrative support occupations (%)
Most Common Occupations - Natural resources, construction, and maintenance occupations (%)
Most Common Occupations - Farming, fishing, and forestry occupations (%)
Most Common Occupations - Construction and extraction occupations (%)
Most Common Occupations - Installation, maintenance, and repair occupations (%)
Most Common Occupations - Production, transportation, and material moving occupations (%)
Most Common Occupations - Production occupations (%)
Most Common Occupations - Transportation occupations (%)
Most Common Occupations - Material moving occupations (%)
People in Group quarters - Institutionalized population (%)
People in Group quarters - Correctional institutions (%)
People in Group quarters - Federal prisons and detention centers (%)
People in Group quarters - Halfway houses (%)
People in Group quarters - Local jails and other confinement facilities (including police lockups) (%)
People in Group quarters - Military disciplinary barracks (%)
People in Group quarters - State prisons (%)
People in Group quarters - Other types of correctional institutions (%)
People in Group quarters - Nursing homes (%)
People in Group quarters - Hospitals/wards, hospices, and schools for the handicapped (%)
People in Group quarters - Hospitals/wards and hospices for chronically ill (%)
People in Group quarters - Hospices or homes for chronically ill (%)
People in Group quarters - Military hospitals or wards for chronically ill (%)
People in Group quarters - Other hospitals or wards for chronically ill (%)
People in Group quarters - Hospitals or wards for drug/alcohol abuse (%)
People in Group quarters - Mental (Psychiatric) hospitals or wards (%)
People in Group quarters - Schools, hospitals, or wards for the mentally retarded (%)
People in Group quarters - Schools, hospitals, or wards for the physically handicapped (%)
People in Group quarters - Institutions for the deaf (%)
People in Group quarters - Institutions for the blind (%)
People in Group quarters - Orthopedic wards and institutions for the physically handicapped (%)
People in Group quarters - Wards in general hospitals for patients who have no usual home elsewhere (%)
People in Group quarters - Wards in military hospitals for patients who have no usual home elsewhere (%)
People in Group quarters - Juvenile institutions (%)
People in Group quarters - Long-term care (%)
People in Group quarters - Homes for abused, dependent, and neglected children (%)
People in Group quarters - Residential treatment centers for emotionally disturbed children (%)
People in Group quarters - Training schools for juvenile delinquents (%)
People in Group quarters - Short-term care, detention or diagnostic centers for delinquent children (%)
People in Group quarters - Type of juvenile institution unknown (%)
People in Group quarters - Noninstitutionalized population (%)
People in Group quarters - College dormitories (includes college quarters off campus) (%)
People in Group quarters - Military quarters (%)
People in Group quarters - On base (%)
People in Group quarters - Barracks, unaccompanied personnel housing (UPH), (Enlisted/Officer), ;and similar group living quarters for military personnel (%)
People in Group quarters - Transient quarters for temporary residents (%)
People in Group quarters - Military ships (%)
People in Group quarters - Group homes (%)
People in Group quarters - Homes or halfway houses for drug/alcohol abuse (%)
People in Group quarters - Homes for the mentally ill (%)
People in Group quarters - Homes for the mentally retarded (%)
People in Group quarters - Homes for the physically handicapped (%)
People in Group quarters - Other group homes (%)
People in Group quarters - Religious group quarters (%)
People in Group quarters - Dormitories (%)
People in Group quarters - Agriculture workers' dormitories on farms (%)
People in Group quarters - Job Corps and vocational training facilities (%)
People in Group quarters - Other workers' dormitories (%)
People in Group quarters - Crews of maritime vessels (%)
People in Group quarters - Other nonhousehold living situations (%)
People in Group quarters - Other noninstitutional group quarters (%)
Residents speaking English at home (%)
Residents speaking English at home - Born in the United States (%)
Residents speaking English at home - Native, born elsewhere (%)
Residents speaking English at home - Foreign born (%)
Residents speaking Spanish at home (%)
Residents speaking Spanish at home - Born in the United States (%)
Residents speaking Spanish at home - Native, born elsewhere (%)
Residents speaking Spanish at home - Foreign born (%)
Residents speaking other language at home (%)
Residents speaking other language at home - Born in the United States (%)
Residents speaking other language at home - Native, born elsewhere (%)
Residents speaking other language at home - Foreign born (%)
Class of Workers - Employee of private company (%)
Class of Workers - Self-employed in own incorporated business (%)
Class of Workers - Private not-for-profit wage and salary workers (%)
Class of Workers - Local government workers (%)
Class of Workers - State government workers (%)
Class of Workers - Federal government workers (%)
Class of Workers - Self-employed workers in own not incorporated business and Unpaid family workers (%)
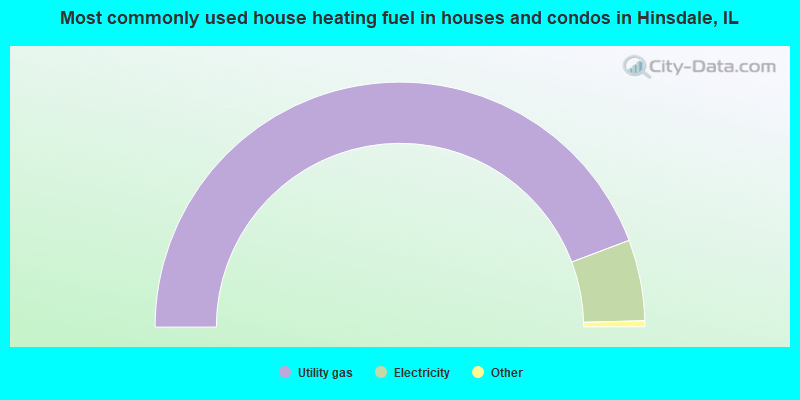
House heating fuel used in houses and condos - Utility gas (%)
House heating fuel used in houses and condos - Bottled, tank, or LP gas (%)
House heating fuel used in houses and condos - Electricity (%)
House heating fuel used in houses and condos - Fuel oil, kerosene, etc. (%)
House heating fuel used in houses and condos - Coal or coke (%)
House heating fuel used in houses and condos - Wood (%)
House heating fuel used in houses and condos - Solar energy (%)
House heating fuel used in houses and condos - Other fuel (%)
House heating fuel used in houses and condos - No fuel used (%)
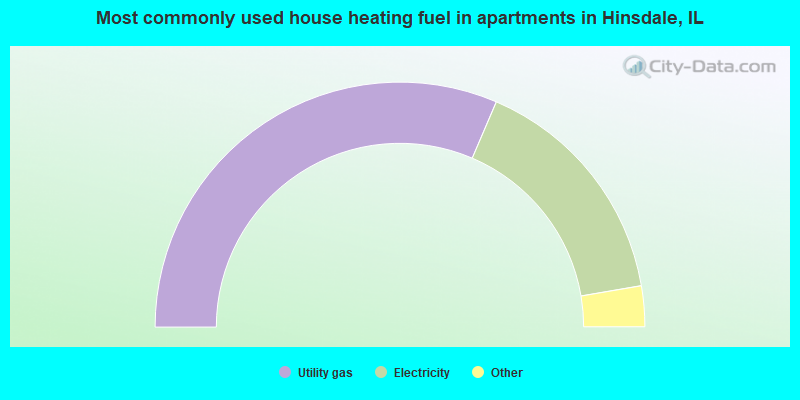
House heating fuel used in apartments - Utility gas (%)
House heating fuel used in apartments - Bottled, tank, or LP gas (%)
House heating fuel used in apartments - Electricity (%)
House heating fuel used in apartments - Fuel oil, kerosene, etc. (%)
House heating fuel used in apartments - Coal or coke (%)
House heating fuel used in apartments - Wood (%)
House heating fuel used in apartments - Solar energy (%)
House heating fuel used in apartments - Other fuel (%)
House heating fuel used in apartments - No fuel used (%)
Armed forces status - In Armed Forces (%)
Armed forces status - Civilian (%)
Armed forces status - Civilian - Veteran (%)
Armed forces status - Civilian - Nonveteran (%)
Fatal accidents locations in years 2005-2021
Fatal accidents locations in 2005
Fatal accidents locations in 2006
Fatal accidents locations in 2007
Fatal accidents locations in 2008
Fatal accidents locations in 2009
Fatal accidents locations in 2010
Fatal accidents locations in 2011
Fatal accidents locations in 2012
Fatal accidents locations in 2013
Fatal accidents locations in 2014
Fatal accidents locations in 2015
Fatal accidents locations in 2016
Fatal accidents locations in 2017
Fatal accidents locations in 2018
Fatal accidents locations in 2019
Fatal accidents locations in 2020
Fatal accidents locations in 2021
Alcohol use - People drinking some alcohol every month (%)
Alcohol use - People not drinking at all (%)
Alcohol use - Average days/month drinking alcohol
Alcohol use - Average drinks/week
Alcohol use - Average days/year people drink much
Audiometry - Average condition of hearing (%)
Audiometry - People that can hear a whisper from across a quiet room (%)
Audiometry - People that can hear normal voice from across a quiet room (%)
Audiometry - Ears ringing, roaring, buzzing (%)
Audiometry - Had a job exposure to loud noise (%)
Audiometry - Had off-work exposure to loud noise (%)
Blood Pressure & Cholesterol - Has high blood pressure (%)
Blood Pressure & Cholesterol - Checking blood pressure at home (%)
Blood Pressure & Cholesterol - Frequently checking blood cholesterol (%)
Blood Pressure & Cholesterol - Has high cholesterol level (%)
Consumer Behavior - Money monthly spent on food at supermarket/grocery store
Consumer Behavior - Money monthly spent on food at other stores
Consumer Behavior - Money monthly spent on eating out
Consumer Behavior - Money monthly spent on carryout/delivered foods
Consumer Behavior - Income spent on food at supermarket/grocery store (%)
Consumer Behavior - Income spent on food at other stores (%)
Consumer Behavior - Income spent on eating out (%)
Consumer Behavior - Income spent on carryout/delivered foods (%)
Current Health Status - General health condition (%)
Current Health Status - Blood donors (%)
Current Health Status - Has blood ever tested for HIV virus (%)
Current Health Status - Left-handed people (%)
Dermatology - People using sunscreen (%)
Diabetes - Diabetics (%)
Diabetes - Had a blood test for high blood sugar (%)
Diabetes - People taking insulin (%)
Diet Behavior & Nutrition - Diet health (%)
Diet Behavior & Nutrition - Milk product consumption (# of products/month)
Diet Behavior & Nutrition - Meals not home prepared (#/week)
Diet Behavior & Nutrition - Meals from fast food or pizza place (#/week)
Diet Behavior & Nutrition - Ready-to-eat foods (#/month)
Diet Behavior & Nutrition - Frozen meals/pizza (#/month)
Drug Use - People that ever used marijuana or hashish (%)
Drug Use - Ever used hard drugs (%)
Drug Use - Ever used any form of cocaine (%)
Drug Use - Ever used heroin (%)
Drug Use - Ever used methamphetamine (%)
Health Insurance - People covered by health insurance (%)
Kidney Conditions-Urology - Avg. # of times urinating at night
Medical Conditions - People with asthma (%)
Medical Conditions - People with anemia (%)
Medical Conditions - People with psoriasis (%)
Medical Conditions - People with overweight (%)
Medical Conditions - Elderly people having difficulties in thinking or remembering (%)
Medical Conditions - People who ever received blood transfusion (%)
Medical Conditions - People having trouble seeing even with glass/contacts (%)
Medical Conditions - People with arthritis (%)
Medical Conditions - People with gout (%)
Medical Conditions - People with congestive heart failure (%)
Medical Conditions - People with coronary heart disease (%)
Medical Conditions - People with angina pectoris (%)
Medical Conditions - People who ever had heart attack (%)
Medical Conditions - People who ever had stroke (%)
Medical Conditions - People with emphysema (%)
Medical Conditions - People with thyroid problem (%)
Medical Conditions - People with chronic bronchitis (%)
Medical Conditions - People with any liver condition (%)
Medical Conditions - People who ever had cancer or malignancy (%)
Mental Health - People who have little interest in doing things (%)
Mental Health - People feeling down, depressed, or hopeless (%)
Mental Health - People who have trouble sleeping or sleeping too much (%)
Mental Health - People feeling tired or having little energy (%)
Mental Health - People with poor appetite or overeating (%)
Mental Health - People feeling bad about themself (%)
Mental Health - People who have trouble concentrating on things (%)
Mental Health - People moving or speaking slowly or too fast (%)
Mental Health - People having thoughts they would be better off dead (%)
Oral Health - Average years since last visit a dentist
Oral Health - People embarrassed because of mouth (%)
Oral Health - People with gum disease (%)
Oral Health - General health of teeth and gums (%)
Oral Health - Average days a week using dental floss/device
Oral Health - Average days a week using mouthwash for dental problem
Oral Health - Average number of teeth
Pesticide Use - Households using pesticides to control insects (%)
Pesticide Use - Households using pesticides to kill weeds (%)
Physical Activity - People doing vigorous-intensity work activities (%)
Physical Activity - People doing moderate-intensity work activities (%)
Physical Activity - People walking or bicycling (%)
Physical Activity - People doing vigorous-intensity recreational activities (%)
Physical Activity - People doing moderate-intensity recreational activities (%)
Physical Activity - Average hours a day doing sedentary activities
Physical Activity - Average hours a day watching TV or videos
Physical Activity - Average hours a day using computer
Physical Functioning - People having limitations keeping them from working (%)
Physical Functioning - People limited in amount of work they can do (%)
Physical Functioning - People that need special equipment to walk (%)
Physical Functioning - People experiencing confusion/memory problems (%)
Physical Functioning - People requiring special healthcare equipment (%)
Prescription Medications - Average number of prescription medicines taking
Preventive Aspirin Use - Adults 40+ taking low-dose aspirin (%)
Reproductive Health - Vaginal deliveries (%)
Reproductive Health - Cesarean deliveries (%)
Reproductive Health - Deliveries resulted in a live birth (%)
Reproductive Health - Pregnancies resulted in a delivery (%)
Reproductive Health - Women breastfeeding newborns (%)
Reproductive Health - Women that had a hysterectomy (%)
Reproductive Health - Women that had both ovaries removed (%)
Reproductive Health - Women that have ever taken birth control pills (%)
Reproductive Health - Women taking birth control pills (%)
Reproductive Health - Women that have ever used Depo-Provera or injectables (%)
Reproductive Health - Women that have ever used female hormones (%)
Sexual Behavior - People 18+ that ever had sex (vaginal, anal, or oral) (%)
Sexual Behavior - Males 18+ that ever had vaginal sex with a woman (%)
Sexual Behavior - Males 18+ that ever performed oral sex on a woman (%)
Sexual Behavior - Males 18+ that ever had anal sex with a woman (%)
Sexual Behavior - Males 18+ that ever had any sex with a man (%)
Sexual Behavior - Females 18+ that ever had vaginal sex with a man (%)
Sexual Behavior - Females 18+ that ever performed oral sex on a man (%)
Sexual Behavior - Females 18+ that ever had anal sex with a man (%)
Sexual Behavior - Females 18+ that ever had any kind of sex with a woman (%)
Sexual Behavior - Average age people first had sex
Sexual Behavior - Average number of female sex partners in lifetime (males 18+)
Sexual Behavior - Average number of female vaginal sex partners in lifetime (males 18+)
Sexual Behavior - Average age people first performed oral sex on a woman (18+)
Sexual Behavior - Average number of woman performed oral sex on in lifetime (18+)
Sexual Behavior - Average number of male sex partners in lifetime (males 18+)
Sexual Behavior - Average number of male anal sex partners in lifetime (males 18+)
Sexual Behavior - Average age people first performed oral sex on a man (18+)
Sexual Behavior - Average number of male oral sex partners in lifetime (18+)
Sexual Behavior - People using protection when performing oral sex (%)
Sexual Behavior - Average number of times people have vaginal or anal sex a year
Sexual Behavior - People having sex without condom (%)
Sexual Behavior - Average number of male sex partners in lifetime (females 18+)
Sexual Behavior - Average number of male vaginal sex partners in lifetime (females 18+)
Sexual Behavior - Average number of female sex partners in lifetime (females 18+)
Sexual Behavior - Circumcised males 18+ (%)
Sleep Disorders - Average hours sleeping at night
Sleep Disorders - People that has trouble sleeping (%)
Smoking-Cigarette Use - People smoking cigarettes (%)
Taste & Smell - People 40+ having problems with smell (%)
Taste & Smell - People 40+ having problems with taste (%)
Taste & Smell - People 40+ that ever had wisdom teeth removed (%)
Taste & Smell - People 40+ that ever had tonsils teeth removed (%)
Taste & Smell - People 40+ that ever had a loss of consciousness because of a head injury (%)
Taste & Smell - People 40+ that ever had a broken nose or other serious injury to face or skull (%)
Taste & Smell - People 40+ that ever had two or more sinus infections (%)
Weight - Average height (inches)
Weight - Average weight (pounds)
Weight - Average BMI
Weight - People that are obese (%)
Weight - People that ever were obese (%)
Weight - People trying to lose weight (%)
Officers per 1,000 residents here:
1.18Illinois average:
3.21
Latest news from Hinsdale, IL collected exclusively by city-data.com from local newspapers, TV, and radio stations
Ancestries: Irish (9.3%), German (9.0%), Italian (5.3%), European (5.3%), Polish (4.8%), English (4.7%).
Current Local Time:
Incorporated on 09/23/1901
Land area: 4.64 square miles.
Population density: 3,718 people per square mile (average).
2,523 residents are foreign born (7.5% Asia , 4.1% Europe ).
This village:
14.8%Illinois:
14.1%
Median real estate property taxes paid for housing units with mortgages in 2022: $9,464 (1.0%)Median real estate property taxes paid for housing units with no mortgage in 2022: $9,604 (1.0%)
Nearest city with pop. 50,000+: Berwyn, IL
Nearest city with pop. 200,000+: Chicago, IL
Nearest cities:
Latitude: 41.80 N, Longitude: 87.93 W
Daytime population change due to commuting: +3,378 (+19.9%)Workers who live and work in this village: 3,064 (41.2%)
Area codes: 630, 708, 312, 847
Single-family new house construction building permits:
2022: 46 buildings , average cost: $801,3002021: 49 buildings , average cost: $716,3002020: 32 buildings , average cost: $826,0002019: 40 buildings , average cost: $880,0002018: 48 buildings , average cost: $589,5002017: 27 buildings , average cost: $722,0002016: 31 buildings , average cost: $835,2002015: 56 buildings , average cost: $713,8002014: 67 buildings , average cost: $697,6002013: 55 buildings , average cost: $667,6002012: 39 buildings , average cost: $752,4002011: 35 buildings , average cost: $809,4002010: 33 buildings , average cost: $874,6002009: 18 buildings , average cost: $814,2002008: 21 buildings , average cost: $907,2002007: 43 buildings , average cost: $771,9002006: 80 buildings , average cost: $815,8002005: 116 buildings , average cost: $669,9002004: 109 buildings , average cost: $563,8002003: 90 buildings , average cost: $575,2002002: 107 buildings , average cost: $530,2002001: 105 buildings , average cost: $492,4002000: 95 buildings , average cost: $419,6001999: 113 buildings , average cost: $379,5001998: 118 buildings , average cost: $370,2001997: 73 buildings , average cost: $343,100Unemployment in December 2023:
Population change in the 1990s: +1,253 (+7.8%).
Most common industries in Hinsdale, IL (%)
Both Males Females
Finance & insurance (15.6%)
Professional, scientific, technical services (15.2%)
Health care (12.9%)
Educational services (6.6%)
Real estate & rental & leasing (4.0%)
Construction (3.8%)
Accommodation & food services (2.7%)
Finance & insurance (18.9%)
Professional, scientific, technical services (17.4%)
Health care (9.5%)
Construction (5.2%)
Real estate & rental & leasing (3.8%)
Administrative & support & waste management services (2.4%)
Educational services (2.3%)
Health care (17.9%)
Educational services (13.0%)
Professional, scientific, technical services (11.9%)
Finance & insurance (10.8%)
Real estate & rental & leasing (4.4%)
Religious, grantmaking, civic, professional, similar organizations (3.8%)
Accommodation & food services (3.5%)
Most common occupations in Hinsdale, IL (%)
Both Males Females
Sales representatives, services, wholesale and manufacturing (10.0%)
Other management occupations, except farmers and farm managers (8.4%)
Top executives (7.5%)
Lawyers (5.0%)
Other sales and related occupations, including supervisors (4.8%)
Physicians and surgeons (4.1%)
Financial managers (3.6%)
Sales representatives, services, wholesale and manufacturing (13.9%)
Top executives (11.0%)
Other management occupations, except farmers and farm managers (10.8%)
Lawyers (6.4%)
Physicians and surgeons (4.7%)
Financial managers (4.3%)
Other sales and related occupations, including supervisors (4.3%)
Preschool, kindergarten, elementary, and middle school teachers (6.3%)
Other office and administrative support workers, including supervisors (5.7%)
Secretaries and administrative assistants (5.5%)
Other sales and related occupations, including supervisors (5.4%)
Registered nurses (5.1%)
Other management occupations, except farmers and farm managers (4.8%)
Sales representatives, services, wholesale and manufacturing (4.3%)
Tornado activity:
Hinsdale-area historical tornado activity is slightly below Illinois state average. It is 50% greater than the overall U.S. average.
On 8/28/1990, a category F5 (max. wind speeds 261-318 mph) tornado 21.3 miles away from the Hinsdale village center killed 29 people and injured 350 people and caused between $50,000 and $500,000 in damages.
On 6/13/1976, a category F4 (max. wind speeds 207-260 mph) tornado 4.9 miles away from the village center killed 2 people and injured 23 people and caused between $500,000 and $5,000,000 in damages.
Earthquake activity:
Hinsdale-area historical earthquake activity is significantly above Illinois state average. It is 44% greater than the overall U.S. average. On 4/18/2008 at 09:36:59, a magnitude 5.4 (5.1 MB, 4.8 MS, 5.4 MW, 5.2 MW, Class: Moderate, Intensity: VI - VII) earthquake occurred 231.6 miles away from the city center On 6/10/1987 at 23:48:54, a magnitude 5.1 (4.9 MB, 4.4 MS, 4.6 MS, 5.1 LG) earthquake occurred 206.1 miles away from Hinsdale center On 4/18/2008 at 09:36:59, a magnitude 5.2 (5.2 MW, Depth: 8.9 mi) earthquake occurred 231.7 miles away from the city center On 6/28/2004 at 06:10:52, a magnitude 4.2 (4.2 MW, Depth: 6.2 mi, Class: Light, Intensity: IV - V) earthquake occurred 55.5 miles away from the city center On 6/18/2002 at 17:37:15, a magnitude 5.0 (4.3 MB, 4.6 MW, 5.0 LG) earthquake occurred 263.9 miles away from Hinsdale center On 4/18/2008 at 15:14:16, a magnitude 4.8 (4.5 MB, 4.8 MW, 4.6 MW) earthquake occurred 230.0 miles away from Hinsdale center Magnitude types: regional Lg-wave magnitude (LG), body-wave magnitude (MB), surface-wave magnitude (MS), moment magnitude (MW) Natural disasters: The number of natural disasters in DuPage County (15) is near the US average (15).Major Disasters (Presidential) Declared: 10Emergencies Declared: 4Floods: 8, Storms: 8, Snowstorms: 2, Tornadoes: 2, Winter Storms: 2, Blizzard: 1, Hurricane: 1, Snow: 1, Wind: 1, Other: 1 (Note: some incidents may be assigned to more than one category). Hospitals and medical centers in Hinsdale: HINSDALE HOSPITAL (Voluntary non-profit - Church, provides emergency services, 120 NORTH OAK ST) RM HEALTH PROVIDERS LIMITED PARTNERSHP (5601 S COUNTY LINE RD) RML SPECIALTY HOSPITAL (5601 S COUNTY LINE RD) ALPHA HOME HEALTH CARE, INC (930 N YORK ROAD, STE 8)
HOME HEALTH ONE, LTD (119 E OGDEN AVENUE, STE 22LL)
MANORCARE OF HINSDALE (600 WEST OGDEN AVENUE)
Heliports located in Hinsdale: Amtrak stations near Hinsdale: 4 miles: LA GRANGE ROAD (LA GRANGE, 25 W. BURLINGTON AVE.) Services: enclosed waiting area, public payphones, taxi stand, public transit connection.
6 miles: SUMMIT (ARCHER & CENTER AVE.) Services: public payphones, free short-term parking, free long-term parking, call for taxi service, public transit connection.
12 miles: NAPERVILLE (E. 4TH & ELLSWORTH AVE.) Services: ticket office, partially wheelchair accessible, enclosed waiting area, public restrooms, public payphones, free short-term parking, free long-term parking, call for taxi service, public transit connection.
Colleges/universities with over 2000 students nearest to Hinsdale:
Elmhurst College (about 7 miles; Elmhurst, IL ; Full-time enrollment: 3,364)
College of DuPage (about 8 miles; Glen Ellyn, IL ; FT enrollment: 18,910)
Morton College (about 9 miles; Cicero, IL ; FT enrollment: 3,236)
Moraine Valley Community College (about 9 miles; Palos Hills, IL ; FT enrollment: 12,008)
Benedictine University (about 9 miles; Lisle, IL ; FT enrollment: 5,694)
Dominican University (about 9 miles; River Forest, IL ; FT enrollment: 2,971)
Concordia University-Chicago (about 10 miles; River Forest, IL ; FT enrollment: 3,944)
Public high school in Hinsdale:
Private high school in Hinsdale: HINSDALE ADVENTIST ACADEMY Students: 264, Location: 631 E HICKORY ST, Grades: PK-12)
Public elementary/middle schools in Hinsdale: HINSDALE MIDDLE SCHOOL Students: 586, Location: 100 S GARFIELD ST, Grades: 6-8)THE LANE ELEM SCHOOL Students: 390, Location: 500 N ELM ST, Grades: KG-5)OAK ELEM SCHOOL Students: 321, Location: 950 S OAK ST, Grades: KG-5)MADISON ELEM SCHOOL Location: 611 S MADISON ST, Grades: KG-5)
MONROE ELEM SCHOOL Location: 210 N MADISON ST, Grades: PK-5)
Private elementary/middle school in Hinsdale: ST ISAAC JOGUES ELEMENTARY SCHOOL Students: 525, Location: 421 S CLAY ST, Grades: KG-8)
See full list of schools located in Hinsdale Library in Hinsdale: HINSDALE PUBLIC LIBRARY Operating income: $2,298,407; Location: 20 EAST MAPLE STREET; 114,367 books ; 7,259 audio materials ; 4,236 video materials ; 10 local licensed databases ; 2 state licensed databases ; 1 other licensed databases ; 340 print serial subscriptions )
Notable locations in Hinsdale: (A) , Hinsdale Fire Department (B) . Display/hide their locations on the map
Churches in Hinsdale include: (A) , First Church of Christ Scientist (B) , Grace Episcopal Church (C) , Hinsdale Baptist Church (D) , Hinsdale United Methodist Church (E) , Redeemer Lutheran Church (F) , Saint Isaac Jogues Roman Catholic Church (G) , Seventh Day Adventist Church (H) , Union Church of Hinsdale (I) . Display/hide their locations on the map
Cemetery: (1) . Display/hide its location on the map
Parks in Hinsdale include: (1) , Stough Park (2) , Robbins Park (3) , Merlin Park (4) , Brook Park (5) , Peirce Park (6) , Burns Field Park (7) , Burnside Park (8) . Display/hide their locations on the map
Tourist attraction:
Hotels:
Birthplace of: Pat Quinn (politician) - Illinois politician, Peter Roskam - Politician, Todd Martin - Tennis player, Dizzy Reed - Heavy metal keyboardist, Heather Tom - Actress, James W. Robinson, Jr. - Army Medal of Honor recipient, John Lynch - 2005 NFL player (Denver Broncos, born : Sep 25, 1971), John Lynch (American football) - Football player, Kevin Kasper - 2005 NFL player (Houston Texans, born : Dec 23, 1977), Nicholle Tom - Television actor.
DuPage County has a predicted average indoor radon screening level between 2 and 4 pCi/L (pico curies per liter) - Moderate Potential Drinking water stations with addresses in Hinsdale and their reported violations in the past:
KNOLLS WATER COOPERATIVE (Serves WI, Population served: 400, Groundwater):
Past monitoring violations:
Lead Consumer Notice - In JAN-01-2013, Contaminant: Lead and Copper Rule. Follow-up actions: St Other (JAN-01-2013), St Compliance achieved (JUL-12-2013)
Lead Consumer Notice - In JAN-01-2012, Contaminant: Lead and Copper Rule. Follow-up actions: St Other (FEB-15-2012)
One routine major monitoring violation
Population served: 50, Groundwater):
Past monitoring violations:
Monitoring and Reporting (DBP) - Between JUL-2013 and SEP-2013, Contaminant: Chlorine. Follow-up actions: St Compliance achieved (SEP-12-2013), St Public Notif requested (SEP-18-2013), St Violation/Reminder Notice (SEP-18-2013)
Monitoring, Repeat Major (TCR) - In JUN-2013, Contaminant: Coliform (TCR). Follow-up actions: St Compliance achieved (JUN-26-2013), St Public Notif requested (JUL-17-2013), St Violation/Reminder Notice (JUL-17-2013), St Formal NOV issued (AUG-02-2013), St Civil Case under development (OCT-29-2013)
Monitoring, Repeat Major (TCR) - In OCT-2010, Contaminant: Coliform (TCR). Follow-up actions: St Public Notif requested (NOV-16-2010), St Violation/Reminder Notice (NOV-16-2010), St Compliance achieved (NOV-17-2010), St Public Notif received (DEC-21-2011)
Monitoring and Reporting (DBP) - Between APR-2007 and JUN-2007, Contaminant: Chlorine. Follow-up actions: St Civil Case under development (FEB-23-2006), St Civil Case referred to AG (OCT-06-2006), St Formal NOV issued (DEC-14-2006), St Civil Case under development (MAR-02-2007), St Civil Case referred to AG (MAY-09-2007), St Violation/Reminder Notice (JUL-18-2007), St Public Notif requested (JUL-18-2007), St Compliance achieved (JUL-30-2007), St Public Notif received (NOV-20-2007)
Monitoring and Reporting (DBP) - Between OCT-2006 and DEC-2006, Contaminant: Chlorine. Follow-up actions: St Civil Case under development (FEB-23-2006), St Civil Case referred to AG (OCT-06-2006), St Formal NOV issued (DEC-14-2006), St Violation/Reminder Notice (DEC-14-2006), St Public Notif requested (DEC-14-2006), St Compliance achieved (DEC-20-2006), St Civil Case under development (MAR-02-2007), St Civil Case referred to AG (MAY-09-2007), St Public Notif received (NOV-20-2007)
7 routine major monitoring violations
One regular monitoring violation
6 other older monitoring violations
Population served: 25, Groundwater):
Past health violations:
MCL, Monthly (TCR) - Between JAN-2006 and DEC-2006, Contaminant: Coliform. Follow-up actions: St Formal NOV issued (OCT-05-2006), St Public Notif requested (OCT-05-2006)
Average household size: This village:
3.0 peopleIllinois:
2.6 people
Percentage of family households: This village:
82.0%Whole state:
65.8%
Percentage of households with unmarried partners: This village:
1.6%Whole state:
6.3%
Likely homosexual households (counted as self-reported same-sex unmarried-partner households)
Lesbian couples: 0.1% of all households Gay men: 0.1% of all households
People in group quarters in Hinsdale in 2010:
76 people in college/university student housing
67 people in hospitals with patients who have no usual home elsewhere
62 people in nursing facilities/skilled-nursing facilities
people in nursing homes in 2000people in other group homes in 2000Banks with most branches in Hinsdale (2011 data):
Hinsdale Bank & Trust Company: Thecdbank.Com Branch, at 25 East First Street, West Chestnut Drive-Up. Info updated 2007/03/15: Bank assets: $1,517.9 mil, Deposits: $1,159.0 mil, local headquarters , positive income , Commercial Lending Specialization, 12 total offices , Holding Company: Wintrust Financial Corporation
RBS Citizens, National Association: Hinsdale Drive Thru Branch at 1 Grant Square, branch established on 2005/06/23; Hinsdale Branch at 1 Grant Square, branch established on 1934/04/01. Info updated 2007/09/19: Bank assets: $106,940.6 mil, Deposits: $75,690.2 mil, headquarters in Providence, RI, positive income , 1135 total offices , Holding Company: Uk Financial Investments Limited
BMO Harris Bank National Association: Harris Bk Hinsdale Na Branch at 50 South Lincoln Street, branch established on 1922/07/01; Hinsdale Il Facility at 50 South Lincoln Street, branch established on 2010/03/29. Info updated 2011/07/14: Bank assets: $97,264.0 mil, Deposits: $75,624.6 mil, headquarters in Chicago, IL, positive income , 717 total offices , Holding Company: Bank Of Montreal
The Northern Trust Company: Hinsdale Financial Center at 4 North Washington Street, branch established on 1999/04/26. Info updated 2011/10/07: Bank assets: $99,831.2 mil, Deposits: $84,041.7 mil, headquarters in Chicago, IL, positive income , International Specialization, 91 total offices , Holding Company: Northern Trust Corporation
JPMorgan Chase Bank, National Association: Hinsdale/Ogden Branch at 400 East Ogden Avenue, branch established on 1967/11/17. Info updated 2011/11/10: Bank assets: $1,811,678.0 mil, Deposits: $1,190,738.0 mil, headquarters in Columbus, OH, positive income , International Specialization, 5577 total offices , Holding Company: Jpmorgan Chase & Co.
Bank of America, National Association: Hinsdale Banking Center Branch at 118 West 1st Street, branch established on 2003/12/17. Info updated 2009/11/18: Bank assets: $1,451,969.3 mil, Deposits: $1,077,176.8 mil, headquarters in Charlotte, NC, positive income , 5782 total offices , Holding Company: Bank Of America Corporation
Firstmerit Bank, National Association: Hinsdale Branch at 500 W Chestnut Street, branch established on 1991/05/28. Info updated 2010/05/17: Bank assets: $14,420.6 mil, Deposits: $11,497.6 mil, headquarters in Akron, OH, positive income , Commercial Lending Specialization, 213 total offices , Holding Company: Firstmerit Corporation
PNC Bank, National Association: Hinsdale Branch at 920 North York Road, branch established on 2010/06/14. Info updated 2012/03/20: Bank assets: $263,309.6 mil, Deposits: $197,343.0 mil, headquarters in Wilmington, DE, positive income , Commercial Lending Specialization, 3085 total offices , Holding Company: Pnc Financial Services Group, Inc., The
U.S. Bank National Association: Hinsdale Branch at 21 W 2nd St, branch established on 2003/11/01. Info updated 2012/01/30: Bank assets: $330,470.8 mil, Deposits: $236,091.5 mil, headquarters in Cincinnati, OH, positive income , 3121 total offices , Holding Company: U.S. Bancorp
For population 15 years and over in Hinsdale:
Never married: 18.1%Now married: 70.6%Separated: 0.4%Widowed: 5.7%Divorced: 5.2% For population 25 years and over in Hinsdale:
High school or higher: 97.8%Bachelor's degree or higher: 80.8%Graduate or professional degree: 45.8%Unemployed: 2.6%Mean travel time to work (commute): 21.9 minutes
Education Gini index (Inequality in education) Here:
8.8Illinois average:
12.5
Religion statistics for Hinsdale, IL (based on DuPage County data)
Religion Adherents Congregations Catholic 373,823 54 Evangelical Protestant 120,953 247 Other 77,889 80 Mainline Protestant 71,909 126 Orthodox 8,460 10 Black Protestant 3,014 5 None 260,876 -
Source: Clifford Grammich, Kirk Hadaway, Richard Houseal, Dale E.Jones, Alexei Krindatch, Richie Stanley and Richard H.Taylor. 2012. 2010 U.S.Religion Census: Religious Congregations & Membership Study. Association of Statisticians of American Religious Bodies. Jones, Dale E., et al. 2002. Congregations and Membership in the United States 2000. Nashville, TN: Glenmary Research Center. Graphs represent county-level data
Food Environment Statistics: Number of grocery stores : 175DuPage County :
1.89 / 10,000 pop.Illinois :
2.24 / 10,000 pop.
Number of supercenters and club stores : 8DuPage County :
0.09 / 10,000 pop.Illinois :
0.08 / 10,000 pop.
Number of convenience stores (no gas) : 97DuPage County :
1.05 / 10,000 pop.State :
0.75 / 10,000 pop.
Number of convenience stores (with gas) : 200DuPage County :
2.16 / 10,000 pop.Illinois :
2.61 / 10,000 pop.
Number of full-service restaurants : 671Here :
7.24 / 10,000 pop.Illinois :
6.86 / 10,000 pop.
Adult diabetes rate : This county :
7.1%Illinois :
8.3%
Adult obesity rate : DuPage County :
24.0%Illinois :
25.2%
Low-income preschool obesity rate : DuPage County :
13.2%State :
14.5%
Health and Nutrition: Healthy diet rate : Hinsdale:
57.9%Illinois:
49.5%
Average overall health of teeth and gums : This city:
58.1%Illinois:
47.2%
Average BMI : This city:
27.7Illinois:
28.6
People feeling badly about themselves : This city:
18.9%State:
20.5%
People not drinking alcohol at all : Hinsdale:
8.1%Illinois:
10.8%
Average hours sleeping at night : Overweight people : This city:
34.0%Illinois:
33.4%
General health condition : This city:
63.3%Illinois:
56.4%
Average condition of hearing : This city:
80.9%Illinois:
79.9%
More about Health and Nutrition of Hinsdale, IL Residents
Local government employment and payroll (March 2022)
Function
Full-time employees
Monthly full-time payroll
Average yearly full-time wage
Part-time employees
Monthly part-time payroll
Local Libraries
28 $164,162 $70,355 56 $71,019 Police Protection - Officers
21 $240,903 $137,659 0 $0 Firefighters
20 $223,585 $134,151 0 $0 Housing and Community Development (Local)
8 $70,955 $106,433 2 $8,775 Water Supply
7 $62,961 $107,933 0 $0 Financial Administration
7 $56,201 $96,345 1 $3,011 Natural Resources
6 $43,794 $87,588 0 $0 Parks and Recreation
6 $33,192 $66,384 6 $7,779 Other and Unallocable
4 $36,671 $110,013 0 $0 Police - Other
4 $30,353 $91,059 4 $7,637 Streets and Highways
4 $22,446 $67,338 0 $0 Fire - Other
3 $30,194 $120,776 2 $5,401 Other Government Administration
3 $36,509 $146,036 2 $2,108
Totals for Government
121 $1,051,927 $104,323 73 $105,731
Hinsdale government finances - Expenditure in 2017 (per resident):
Construction - Regular Highways: $3,786,000 ($219.67)
Current Operations - Water Utilities: $7,042,000 ($408.59)
Police Protection: $4,797,000 ($278.33)Local Fire Protection: $4,425,000 ($256.74)Regular Highways: $3,700,000 ($214.68)Libraries: $2,366,000 ($137.28)Financial Administration: $1,677,000 ($97.30)Parks and Recreation: $1,407,000 ($81.64)General - Other: $13,000 ($0.75)General - Interest on Debt: $854,000 ($49.55)
Intergovernmental to Local - Other - Libraries: $217,000 ($12.59)
Other Capital Outlay - Water Utilities: $3,382,000 ($196.23)
Regular Highways: $419,000 ($24.31)Parks and Recreation: $334,000 ($19.38)Police Protection: $174,000 ($10.10)Central Staff Services: $110,000 ($6.38)Libraries: $63,000 ($3.66)Local Fire Protection: $31,000 ($1.80)Total Salaries and Wages: $11,014,000 ($639.05)
Hinsdale government finances - Revenue in 2017 (per resident):
Charges - Other: $805,000 ($46.71)
Sewerage: $795,000 ($46.13)Parking Facilities: $766,000 ($44.44)Parks and Recreation: $753,000 ($43.69)Federal Intergovernmental - Highways: $951,000 ($55.18)
Local Intergovernmental - Other: $329,000 ($19.09)
Miscellaneous - General Revenue - Other: $1,376,000 ($79.84)
Fines and Forfeits: $499,000 ($28.95)Interest Earnings: $56,000 ($3.25)Revenue - Water Utilities: $7,467,000 ($433.25)
State Intergovernmental - General Local Government Support: $6,552,000 ($380.16)
Highways: $485,000 ($28.14)Public Welfare: $136,000 ($7.89)Other: $13,000 ($0.75)Tax - Property: $9,751,000 ($565.77)
Public Utilities Sales: $2,511,000 ($145.69)Other License: $2,077,000 ($120.51)Other Selective Sales: $24,000 ($1.39)
Hinsdale government finances - Debt in 2017 (per resident):
Long Term Debt - Beginning Outstanding - Unspecified Public Purpose: $21,987,000 ($1275.72)
Outstanding Unspecified Public Purpose: $20,296,000 ($1177.60)Retired Unspecified Public Purpose: $1,710,000 ($99.22)Issue, Unspecified Public Purpose: $19,000 ($1.10)
Hinsdale government finances - Cash and Securities in 2017 (per resident):
Other Funds - Cash and Securities: $10,595,000 ($614.74)
7.06% of this county's 2021 resident taxpayers lived in other counties in 2020 ($90,805 average adjusted gross income )
Here:
7.06%Illinois average:
5.09%
0.01% of residents moved from foreign countries ($57 average AGI )DuPage County:
0.01%Illinois average:
0.01%
Top counties from which taxpayers relocated into this county between 2020 and 2021:
8.01% of this county's 2020 resident taxpayers moved to other counties in 2021 ($102,485 average adjusted gross income )
Here:
8.01%Illinois average:
6.10%
0.01% of residents moved to foreign countries ($42 average AGI )DuPage County:
0.01%Illinois average:
0.01%
Top counties to which taxpayers relocated from this county between 2020 and 2021:
Businesses in Hinsdale, IL
Name Count Name Count
Ace Hardware 1 MasterBrand Cabinets 6 Blockbuster 1 McDonald's 2 Cold Stone Creamery 1 Nike 4 DHL 1 Panda Express 1 Decora Cabinetry 2 Starbucks 3 Dunkin Donuts 1 Subway 1 FedEx 8 UPS 6 Firestone Complete Auto Care 1 Walgreens 1 Gap 2 Whole Foods Market 1
Strongest AM radio stations in Hinsdale:
WMVP (1000 AM; 50 kW; CHICAGO, IL; Owner: ABC, INC.)
WSCR (670 AM; 50 kW; CHICAGO, IL; Owner: INFINITY BROADCASTING OPERATIONS, INC.)
WBBM (780 AM; 50 kW; CHICAGO, IL; Owner: INFINITY BROADCASTING OPERATIONS, INC.)
WGN (720 AM; 50 kW; CHICAGO, IL; Owner: WGN CONTINENTAL BROADCASTING CO.)
WLS (890 AM; 50 kW; CHICAGO, IL; Owner: WLS, INC.)
WYLL (1160 AM; 50 kW; CHICAGO, IL; Owner: SCA LICENSE CORPORATION)
WJJG (1530 AM; daytime; 2 kW; ELMHURST, IL; Owner: JOSEPH J. GENTILE, INC.)
WVIV (1200 AM; 20 kW; CHICAGO, IL; Owner: WLXX-AM LICENSE CORP.)
WMBI (1110 AM; daytime; 5 kW; CHICAGO, IL; Owner: THE MOODY BIBLE INSTITUTE OF CHICAGO)
WCSN (820 AM; 5 kW; CHICAGO, IL; Owner: WYPA, INC.)
WRDZ (1300 AM; 4 kW; LA GRANGE, IL; Owner: ABC, INC.)
WGCI (1390 AM; 5 kW; CHICAGO, IL; Owner: AMFM RADIO LICENSES, L.L.C.)
WTMJ (620 AM; 50 kW; MILWAUKEE, WI; Owner: JOURNAL BROADCAST CORPORATION)
Strongest FM radio stations in Hinsdale:
WHSD (88.5 FM; HINSDALE, IL; Owner: HINSDALE TWSP. HIGH SCH. DIST. #86)
WLEY-FM (107.9 FM; AURORA, IL; Owner: WLEY LICENSING, INC.)
WCKG (105.9 FM; ELMWOOD PARK, IL; Owner: INFINITY HOLDINGS CORPORATION OF ORLANDO)
WLIT-FM (93.9 FM; CHICAGO, IL; Owner: AMFM RADIO LICENSES, L.L.C.)
WJMK (104.3 FM; CHICAGO, IL; Owner: INFINITY BROADCASTING CORP. OF ILLINOIS)
WNUA (95.5 FM; CHICAGO, IL; Owner: AMFM RADIO LICENSES, L.L.C.)
WLTL (88.1 FM; LA GRANGE, IL; Owner: LYONS TOWNSHIP HIGH SCHOOL)
WTMX (101.9 FM; SKOKIE, IL; Owner: BONNEVILLE HOLDING COMPANY)
WBBM-FM (96.3 FM; CHICAGO, IL; Owner: INFINITY BROADCASTING OPERATIONS, INC.)
WGCI-FM (107.5 FM; CHICAGO, IL; Owner: AMFM RADIO LICENSES, L.L.C.)
WKSC-FM (103.5 FM; CHICAGO, IL; Owner: AMFM RADIO LICENSES, L.L.C.)
WFMT (98.7 FM; CHICAGO, IL; Owner: WINDOW TO THE WORLD COMMUNICATIONS)
WZZN (94.7 FM; CHICAGO, IL; Owner: ABC CHICAGO FM RADIO,INC.)
WBEZ (91.5 FM; CHICAGO, IL; Owner: THE WBEZ ALLIANCE, INC.)
WKQX (101.1 FM; CHICAGO, IL; Owner: EMMIS RADIO LICENSE CORPORATION)
WLUP-FM (97.9 FM; CHICAGO, IL; Owner: BONNEVILLE HOLDING COMPANY)
WNND (100.3 FM; CHICAGO, IL; Owner: BONNEVILLE HOLDING COMPANY)
WOJO (105.1 FM; EVANSTON, IL; Owner: TICHENOR LICENSE CORPORATION ("TLC"))
WUSN (99.5 FM; CHICAGO, IL; Owner: INFINITY BROADCASTING CORPORATION OF CHICAGO)
WVAZ (102.7 FM; OAK PARK, IL; Owner: AMFM RADIO LICENSES, L.L.C.)
TV broadcast stations around Hinsdale:
WLS-TV (Channel 7; CHICAGO, IL; Owner: WLS TELEVISION, INC.)
WMAQ-TV (Channel 5; CHICAGO, IL; Owner: NBC SUBSIDIARY (WMAQ-TV), INC.)
WTTW (Channel 11; CHICAGO, IL; Owner: WINDOW TO THE WORLD COMMUNICATIONS, INC.)
WGN-TV (Channel 9; CHICAGO, IL; Owner: WGN CONTINENTAL BROADCASTING COMPANY)
WGBO-TV (Channel 66; JOLIET, IL; Owner: WGBO LICENSE PARTNERSHIP, G.P.)
WBBM-TV (Channel 2; CHICAGO, IL; Owner: CBS BROADCASTING INC.)
WPWR-TV (Channel 50; GARY, IN; Owner: FOX TELEVISION STATIONS, INC.)
WXFT (Channel 60; AURORA, IL; Owner: TELEFUTURA CHICAGO LLC)
WCIU-TV (Channel 26; CHICAGO, IL; Owner: WCIU-TV LIMITED PARTNERSHIP)
WCPX (Channel 38; CHICAGO, IL; Owner: PAXSON CHICAGO LICENSE, INC.)
WFLD (Channel 32; CHICAGO, IL; Owner: FOX TELEVISION STATIONS, INC.)
W68DO (Channel 68; PALATINE, IL; Owner: TRINITY BROADCASTING NETWORK)
WFBT-CA (Channel 23; CHICAGO, IL; Owner: CHANNEL 23 LIMITED PARTNERSHIP)
WJYS (Channel 62; HAMMOND, IN; Owner: JOVON BROADCASTING CORPORATION)
WSNS-TV (Channel 44; CHICAGO, IL; Owner: TELEMUNDO OF CHICAGO, INC.)
WOCH-LP (Channel 28; CHICAGO, IL; Owner: KM LPTV OF CHICAGO-28, L.L.C.)
WYCC (Channel 20; CHICAGO, IL; Owner: COLLEGE DIST. #508, COUNTY OF COOK)
WOCK-CA (Channel 13; CHICAGO, IL; Owner: KM LPTV OF CHICAGO-13, L.L.C.)
W34CK (Channel 34; ARLINGTON HEIGHTS, IL; Owner: FIRST UNITED, INC.)
WYIN (Channel 56; GARY, IN; Owner: NORTHWEST INDIANA PUBLIC BROADCASTING, INC.)
W64CQ (Channel 64; ARLINGTON HEIGHTS, IL; Owner: TRINITY BROADCASTING NETWORK)
W24AJ (Channel 24; AURORA, IL; Owner: NELSON TV, INC.)
W57DN (Channel 57; ELGIN, IL; Owner: TRINITY BROADCASTING NETWORK)
W54AP (Channel 54; BLUE ISLAND, IL; Owner: CATHOLIC VIEWS BROADCASTS, INC.)
Medal of Honor Recipients
Medal of Honor Recipient born in Hinsdale: James W., Jr. Robinson.
National Bridge Inventory (NBI) Statistics 31 Number of bridges295ft / 90.0m Total length $1,853,000 Total costs2,092,050 Total average daily traffic340,330 Total average daily truck traffic
New bridges - historical statistics
1 1920-1929 16 1950-1959 2 1960-1969 1 1970-1979 4 1980-1989 5 1990-1999 2 2010-2019
See full National Bridge Inventory statistics for Hinsdale, IL
Home Mortgage Disclosure Act Aggregated Statistics For Year 2009(Based on 3 full and 2 partial tracts) A) FHA, FSA/RHS & VA B) Conventional C) Refinancings D) Home Improvement Loans E) Loans on Dwellings For 5+ Families F) Non-occupant Loans on Number Average Value Number Average Value Number Average Value Number Average Value Number Average Value Number Average Value
LOANS ORIGINATED 13 $350,544 167 $568,813 664 $483,182 12 $268,201 1 $2,207,600 19 $340,092 APPLICATIONS APPROVED, NOT ACCEPTED 1 $93,270 21 $772,372 40 $582,792 0 $0 0 $0 2 $418,510 APPLICATIONS DENIED 2 $226,830 22 $721,719 122 $677,650 3 $149,663 0 $0 4 $511,618 APPLICATIONS WITHDRAWN 5 $266,092 15 $484,439 75 $487,103 1 $68,530 0 $0 4 $281,592 FILES CLOSED FOR INCOMPLETENESS 0 $0 5 $1,589,340 18 $520,585 1 $157,250 0 $0 1 $196,560
Aggregated Statistics For Year 2008(Based on 3 full and 2 partial tracts) A) FHA, FSA/RHS & VA B) Conventional C) Refinancings D) Home Improvement Loans F) Non-occupant Loans on Number Average Value Number Average Value Number Average Value Number Average Value Number Average Value
LOANS ORIGINATED 2 $346,550 139 $687,004 320 $592,928 14 $343,429 26 $458,642 APPLICATIONS APPROVED, NOT ACCEPTED 0 $0 22 $778,030 41 $741,141 5 $1,075,852 1 $373,990 APPLICATIONS DENIED 2 $190,325 23 $809,922 76 $776,376 9 $349,883 3 $484,730 APPLICATIONS WITHDRAWN 1 $137,420 19 $576,518 46 $567,259 1 $421,110 3 $568,883 FILES CLOSED FOR INCOMPLETENESS 0 $0 4 $802,182 10 $433,370 0 $0 1 $257,220
Aggregated Statistics For Year 2007(Based on 3 full and 2 partial tracts) A) FHA, FSA/RHS & VA B) Conventional C) Refinancings D) Home Improvement Loans F) Non-occupant Loans on Number Average Value Number Average Value Number Average Value Number Average Value Number Average Value
LOANS ORIGINATED 1 $176,060 197 $777,648 334 $626,959 30 $329,952 31 $477,706 APPLICATIONS APPROVED, NOT ACCEPTED 0 $0 36 $777,288 48 $651,612 3 $77,347 6 $616,437 APPLICATIONS DENIED 0 $0 50 $701,358 110 $605,534 7 $60,191 15 $387,660 APPLICATIONS WITHDRAWN 0 $0 16 $561,473 43 $680,670 0 $0 2 $311,655 FILES CLOSED FOR INCOMPLETENESS 0 $0 10 $657,314 12 $758,374 0 $0 2 $308,265
Aggregated Statistics For Year 2006(Based on 3 full and 2 partial tracts) A) FHA, FSA/RHS & VA B) Conventional C) Refinancings D) Home Improvement Loans F) Non-occupant Loans on Number Average Value Number Average Value Number Average Value Number Average Value Number Average Value
LOANS ORIGINATED 1 $112,000 276 $653,847 360 $560,043 32 $403,102 44 $473,685 APPLICATIONS APPROVED, NOT ACCEPTED 0 $0 38 $599,345 39 $555,787 8 $204,498 3 $584,303 APPLICATIONS DENIED 0 $0 48 $570,385 89 $466,982 7 $268,843 11 $386,314 APPLICATIONS WITHDRAWN 0 $0 29 $688,761 55 $532,762 5 $597,068 2 $334,625 FILES CLOSED FOR INCOMPLETENESS 0 $0 4 $469,842 10 $589,651 2 $879,210 0 $0
Aggregated Statistics For Year 2005(Based on 3 full and 2 partial tracts) A) FHA, FSA/RHS & VA B) Conventional C) Refinancings D) Home Improvement Loans F) Non-occupant Loans on G) Loans On Manufactured Number Average Value Number Average Value Number Average Value Number Average Value Number Average Value Number Average Value
LOANS ORIGINATED 1 $269,020 386 $642,438 429 $587,629 18 $426,009 59 $427,252 0 $0 APPLICATIONS APPROVED, NOT ACCEPTED 0 $0 49 $535,380 37 $660,941 5 $309,610 3 $258,250 0 $0 APPLICATIONS DENIED 0 $0 52 $371,334 90 $492,128 6 $263,612 8 $461,072 1 $64,020 APPLICATIONS WITHDRAWN 0 $0 51 $516,642 67 $490,556 5 $431,640 9 $322,833 0 $0 FILES CLOSED FOR INCOMPLETENESS 0 $0 6 $653,918 17 $516,322 3 $175,303 1 $324,610 0 $0
Aggregated Statistics For Year 2004(Based on 3 full and 2 partial tracts) A) FHA, FSA/RHS & VA B) Conventional C) Refinancings D) Home Improvement Loans F) Non-occupant Loans on Number Average Value Number Average Value Number Average Value Number Average Value Number Average Value
LOANS ORIGINATED 1 $99,000 324 $595,044 598 $506,457 29 $304,481 41 $330,039 APPLICATIONS APPROVED, NOT ACCEPTED 0 $0 49 $526,670 53 $447,949 6 $94,540 7 $315,344 APPLICATIONS DENIED 0 $0 43 $490,217 101 $448,448 12 $551,312 4 $324,680 APPLICATIONS WITHDRAWN 0 $0 42 $523,213 75 $429,680 7 $402,140 4 $225,735 FILES CLOSED FOR INCOMPLETENESS 0 $0 9 $573,943 26 $516,609 1 $656,360 1 $186,730
Aggregated Statistics For Year 2003(Based on 3 full and 2 partial tracts) A) FHA, FSA/RHS & VA B) Conventional C) Refinancings D) Home Improvement Loans F) Non-occupant Loans on Number Average Value Number Average Value Number Average Value Number Average Value Number Average Value
LOANS ORIGINATED 0 $0 331 $502,798 1,621 $422,944 24 $263,381 56 $231,866 APPLICATIONS APPROVED, NOT ACCEPTED 0 $0 18 $527,292 129 $381,780 3 $54,263 3 $161,290 APPLICATIONS DENIED 0 $0 22 $723,541 139 $423,151 3 $56,877 11 $207,122 APPLICATIONS WITHDRAWN 1 $217,000 31 $457,645 131 $413,892 5 $577,164 3 $208,137 FILES CLOSED FOR INCOMPLETENESS 0 $0 7 $544,954 50 $497,421 1 $117,780 1 $198,540
Aggregated Statistics For Year 2002(Based on 1 full tract) B) Conventional C) Refinancings D) Home Improvement Loans F) Non-occupant Loans on Number Average Value Number Average Value Number Average Value Number Average Value
LOANS ORIGINATED 52 $436,139 178 $545,617 2 $297,810 9 $177,914 APPLICATIONS APPROVED, NOT ACCEPTED 5 $591,450 18 $376,288 1 $99,270 0 $0 APPLICATIONS DENIED 5 $650,218 5 $435,200 0 $0 2 $135,005 APPLICATIONS WITHDRAWN 8 $460,240 8 $486,051 1 $496,350 0 $0 FILES CLOSED FOR INCOMPLETENESS 0 $0 6 $494,033 0 $0 0 $0
Aggregated Statistics For Year 2001(Based on 1 full tract) B) Conventional C) Refinancings D) Home Improvement Loans F) Non-occupant Loans on Number Average Value Number Average Value Number Average Value Number Average Value
LOANS ORIGINATED 47 $359,505 120 $426,646 6 $158,005 11 $239,873 APPLICATIONS APPROVED, NOT ACCEPTED 6 $450,520 15 $585,362 2 $74,950 2 $158,830 APPLICATIONS DENIED 4 $482,700 9 $273,654 1 $7,940 0 $0 APPLICATIONS WITHDRAWN 1 $420,900 11 $457,995 0 $0 0 $0 FILES CLOSED FOR INCOMPLETENESS 1 $148,910 2 $409,490 0 $0 0 $0
Aggregated Statistics For Year 2000(Based on 1 full tract) A) FHA, FSA/RHS & VA B) Conventional C) Refinancings D) Home Improvement Loans F) Non-occupant Loans on Number Average Value Number Average Value Number Average Value Number Average Value Number Average Value
LOANS ORIGINATED 1 $236,260 42 $414,429 27 $352,556 6 $70,813 3 $268,360 APPLICATIONS APPROVED, NOT ACCEPTED 0 $0 2 $273,490 4 $284,905 1 $99,270 0 $0 APPLICATIONS DENIED 1 $122,100 3 $117,800 2 $112,175 2 $34,745 0 $0 APPLICATIONS WITHDRAWN 0 $0 5 $378,418 3 $230,637 1 $264,060 0 $0 FILES CLOSED FOR INCOMPLETENESS 0 $0 2 $129,050 3 $413,957 0 $0 0 $0
Aggregated Statistics For Year 1999(Based on 1 full tract) A) FHA, FSA/RHS & VA B) Conventional C) Refinancings D) Home Improvement Loans F) Non-occupant Loans on Number Average Value Number Average Value Number Average Value Number Average Value Number Average Value
LOANS ORIGINATED 0 $0 42 $458,431 67 $372,551 4 $56,328 5 $271,754 APPLICATIONS APPROVED, NOT ACCEPTED 0 $0 2 $980,295 3 $203,570 2 $28,165 1 $303,380 APPLICATIONS DENIED 1 $173,920 3 $603,790 2 $182,815 1 $9,880 1 $9,880 APPLICATIONS WITHDRAWN 0 $0 1 $59,290 9 $238,376 4 $97,090 0 $0 FILES CLOSED FOR INCOMPLETENESS 0 $0 0 $0 1 $79,060 0 $0 0 $0
Detailed HMDA statistics for the following Tracts:
8200.00
, 8447.02 , 8452.00 , 8453.00 , 8454.00
Private Mortgage Insurance Companies Aggregated Statistics For Year 2009(Based on 3 full and 2 partial tracts) A) Conventional B) Refinancings Number Average Value Number Average Value
LOANS ORIGINATED 8 $266,811 2 $302,110 APPLICATIONS APPROVED, NOT ACCEPTED 1 $334,540 2 $167,805 APPLICATIONS DENIED 1 $463,730 0 $0 APPLICATIONS WITHDRAWN 1 $86,000 0 $0 FILES CLOSED FOR INCOMPLETENESS 1 $409,830 0 $0
Aggregated Statistics For Year 2008(Based on 2 full and 2 partial tracts) A) Conventional B) Refinancings C) Non-occupant Loans on Number Average Value Number Average Value Number Average Value
LOANS ORIGINATED 5 $326,302 3 $244,970 1 $155,080 APPLICATIONS APPROVED, NOT ACCEPTED 0 $0 1 $211,380 1 $211,380 APPLICATIONS DENIED 0 $0 1 $172,740 0 $0 APPLICATIONS WITHDRAWN 0 $0 0 $0 0 $0 FILES CLOSED FOR INCOMPLETENESS 0 $0 0 $0 0 $0
Aggregated Statistics For Year 2007(Based on 2 full and 2 partial tracts) A) Conventional B) Refinancings Number Average Value Number Average Value
LOANS ORIGINATED 3 $273,343 1 $304,540 APPLICATIONS APPROVED, NOT ACCEPTED 0 $0 0 $0 APPLICATIONS DENIED 2 $1,290,670 0 $0 APPLICATIONS WITHDRAWN 0 $0 1 $1,395,580 FILES CLOSED FOR INCOMPLETENESS 0 $0 0 $0
Aggregated Statistics For Year 2006(Based on 3 full and 2 partial tracts) A) Conventional B) Refinancings C) Non-occupant Loans on Number Average Value Number Average Value Number Average Value
LOANS ORIGINATED 11 $437,571 2 $425,310 6 $485,715 APPLICATIONS APPROVED, NOT ACCEPTED 3 $429,793 0 $0 3 $403,697 APPLICATIONS DENIED 2 $626,365 1 $396,090 2 $410,480 APPLICATIONS WITHDRAWN 1 $424,880 0 $0 1 $424,880 FILES CLOSED FOR INCOMPLETENESS 0 $0 0 $0 0 $0
Aggregated Statistics For Year 2005(Based on 2 full and 2 partial tracts) A) Conventional B) Refinancings C) Non-occupant Loans on Number Average Value Number Average Value Number Average Value
LOANS ORIGINATED 10 $416,928 2 $396,140 0 $0 APPLICATIONS APPROVED, NOT ACCEPTED 2 $456,265 1 $220,830 0 $0 APPLICATIONS DENIED 1 $367,570 0 $0 1 $367,570 APPLICATIONS WITHDRAWN 2 $653,560 1 $352,660 2 $653,560 FILES CLOSED FOR INCOMPLETENESS 0 $0 0 $0 0 $0
Aggregated Statistics For Year 2004(Based on 1 full and 2 partial tracts) A) Conventional B) Refinancings C) Non-occupant Loans on Number Average Value Number Average Value Number Average Value
LOANS ORIGINATED 13 $274,552 4 $270,285 0 $0 APPLICATIONS APPROVED, NOT ACCEPTED 4 $151,898 1 $203,570 0 $0 APPLICATIONS DENIED 4 $796,068 0 $0 1 $611,300 APPLICATIONS WITHDRAWN 0 $0 0 $0 0 $0 FILES CLOSED FOR INCOMPLETENESS 0 $0 0 $0 0 $0
Aggregated Statistics For Year 2003(Based on 2 full and 2 partial tracts) A) Conventional B) Refinancings C) Non-occupant Loans on Number Average Value Number Average Value Number Average Value
LOANS ORIGINATED 27 $265,414 10 $214,950 3 $289,293 APPLICATIONS APPROVED, NOT ACCEPTED 3 $112,120 1 $499,970 0 $0 APPLICATIONS DENIED 1 $252,580 0 $0 0 $0 APPLICATIONS WITHDRAWN 1 $44,700 0 $0 0 $0 FILES CLOSED FOR INCOMPLETENESS 1 $75,680 0 $0 0 $0
Aggregated Statistics For Year 2002(Based on 1 full tract) A) Conventional C) Non-occupant Loans on Number Average Value Number Average Value
LOANS ORIGINATED 5 $389,138 1 $268,030 APPLICATIONS APPROVED, NOT ACCEPTED 1 $246,190 0 $0 APPLICATIONS DENIED 0 $0 0 $0 APPLICATIONS WITHDRAWN 0 $0 0 $0 FILES CLOSED FOR INCOMPLETENESS 0 $0 0 $0
Aggregated Statistics For Year 2001(Based on 1 full tract) A) Conventional B) Refinancings Number Average Value Number Average Value
LOANS ORIGINATED 3 $239,570 0 $0 APPLICATIONS APPROVED, NOT ACCEPTED 0 $0 1 $270,010 APPLICATIONS DENIED 0 $0 1 $270,010 APPLICATIONS WITHDRAWN 0 $0 0 $0 FILES CLOSED FOR INCOMPLETENESS 0 $0 0 $0
Aggregated Statistics For Year 2000(Based on 1 full tract) A) Conventional B) Refinancings Number Average Value Number Average Value
LOANS ORIGINATED 2 $217,900 0 $0 APPLICATIONS APPROVED, NOT ACCEPTED 0 $0 0 $0 APPLICATIONS DENIED 0 $0 0 $0 APPLICATIONS WITHDRAWN 0 $0 0 $0 FILES CLOSED FOR INCOMPLETENESS 0 $0 1 $150,890
Aggregated Statistics For Year 1999(Based on 1 full tract) A) Conventional B) Refinancings Number Average Value Number Average Value
LOANS ORIGINATED 2 $308,320 0 $0 APPLICATIONS APPROVED, NOT ACCEPTED 0 $0 1 $166,020 APPLICATIONS DENIED 0 $0 0 $0 APPLICATIONS WITHDRAWN 0 $0 0 $0 FILES CLOSED FOR INCOMPLETENESS 0 $0 0 $0
Detailed PMIC statistics for the following Tracts:
8200.00
, 8447.02 , 8452.00 , 8453.00 , 8454.00
Most common first names in Hinsdale, IL among deceased individuals Name Count Lived (average)
John 352 76.5 years Mary 298 82.6 years William 207 75.6 years Robert 201 74.7 years Helen 179 82.7 years Joseph 167 79.1 years James 167 73.8 years Margaret 165 83.8 years George 149 77.4 years Anna 142 85.5 years
Most common last names in Hinsdale, IL among deceased individuals Last name Count Lived (average)
Anderson 59 78.9 years Johnson 53 81.7 years Miller 43 77.9 years Smith 37 79.1 years Brown 26 81.5 years Walsh 25 79.6 years Olson 25 79.8 years Murphy 25 77.4 years Nelson 23 73.1 years Carlson 22 82.5 years
Hinsdale compared to Illinois state average:
Median household income significantly above state average. Median house value significantly above state average. Unemployed percentage significantly below state average. Black race population percentage significantly below state average. Hispanic race population percentage significantly below state average. Renting percentage significantly below state average. Number of rooms per house significantly above state average. Number of college students below state average. Percentage of population with a bachelor's degree or higher significantly above state average.
#19 on the list of "Top 100 cities with biggest houses"
#24 on the list of "Top 101 cities with largest percentage of males in occupations: legal occupations (population 5,000+)"
#27 on the list of "Top 101 cities with the most local government spending on current operations of libraries per resident (population 10,000+)"
#29 on the list of "Top 101 cities with the most full-time local library workers per 1000 residents (population 5,000+)"
#34 on the list of "Top 101 cities with largest percentage of females in occupations: management occupations (population 5,000+)"
#42 on the list of "Top 101 cities with largest percentage of males in industries: professional, scientific, and technical services (population 5,000+)"
#56 on the list of "Top 100 cities with highest median household income (pop. 5,000+)"
#63 on the list of "Top 100 best educated cities (highest percentage of bachelor degree holding residents) (pop. 5,000+)"
#69 on the list of "Top 101 cities with the smallest percentage of likely homosexual households (counted as self-reported same-sex unmarried-partner households) (population 5,000+)"
#73 on the list of "Top 101 cities with the highest cost per building permit(population 5,000+)"
#73 on the list of "Top 101 cities with largest percentage of males in industries: finance and insurance (population 5,000+)"
#77 on the list of "Top 101 cities with largest percentage of males in occupations: health diagnosing and treating practitioners and other technical occupations (population 5,000+)"
#100 on the list of "Top 101 cities with largest percentage of males in occupations: business and financial operations occupations (population 5,000+)"
#75 (60558) on the list of "Top 101 zip codes with the largest percentage of taxpayers using charity contributions deductions in 2012 (pop 5,000+)"
#14 on the list of "Top 101 counties with the largest number of people without health insurance coverage in 2000 (pop. 50,000+)"
#19 on the list of "Top 101 counties with the highest percentage of residents that visited a dentist within the past year"
#23 on the list of "Top 101 counties with the most Catholic adherents"
#25 on the list of "Top 101 counties with the best general health status score of residents (1-5), 3 years of data"
#26 on the list of "Top 101 counties with the largest number of children under 18 without health insurance coverage in 2000 (pop. 50,000+)"
Top Patent Applicants
Mark G. Riley (45)
Jack E. Caveney (34)
David F. Macneil (27)
Matthew R. Cook (21)
William H. Eichhorn (20)
Brett Lane (12)
Biao Zhang (11)
Sarah S. Bacus (11)
Sarah Bacus (10)
Anthony J. Schaeffer (9)
Total of 528 patent applications in 2008-2024.

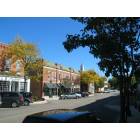

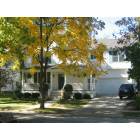
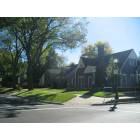
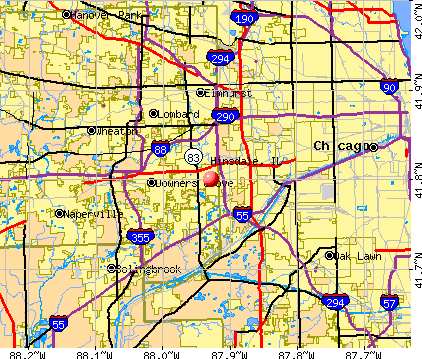


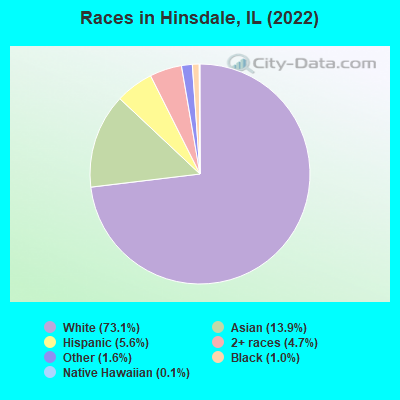
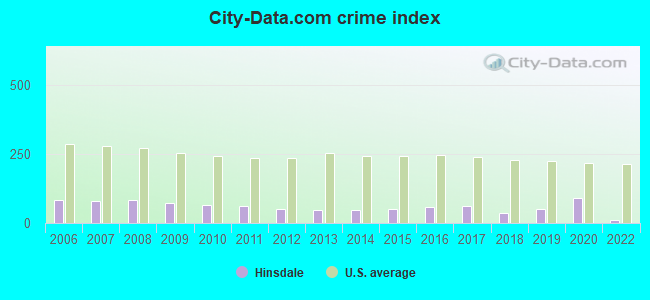
 Recent articles from our blog. Our writers, many of them Ph.D. graduates or candidates, create easy-to-read articles on a wide variety of topics.

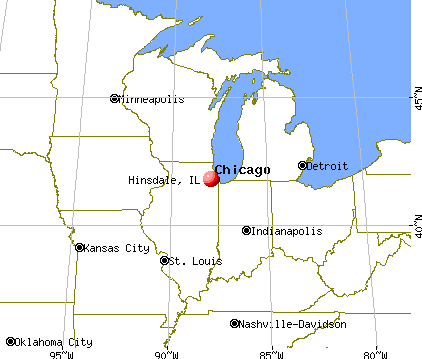
 (7.7 miles
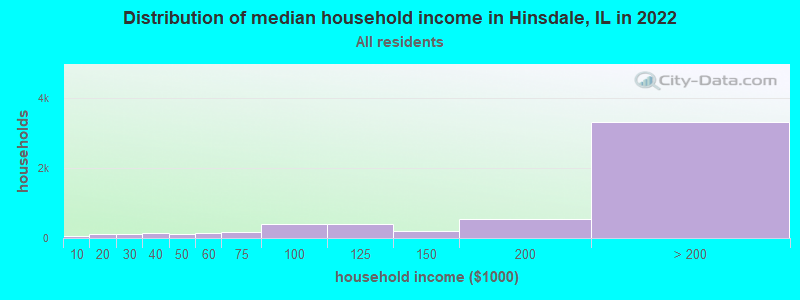
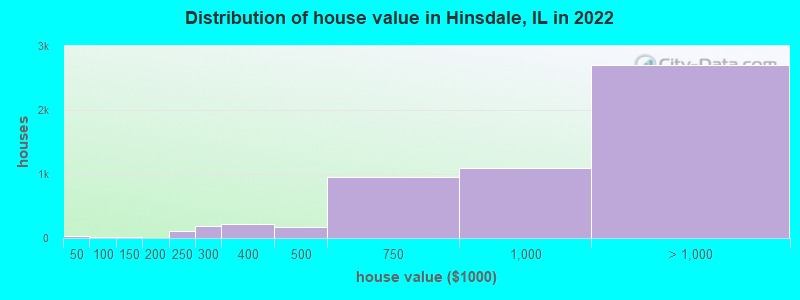
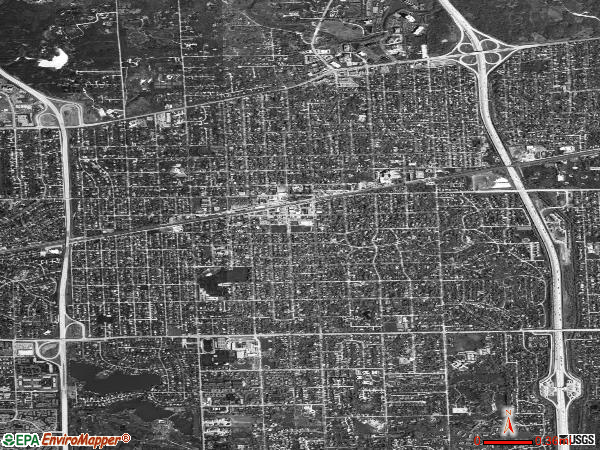
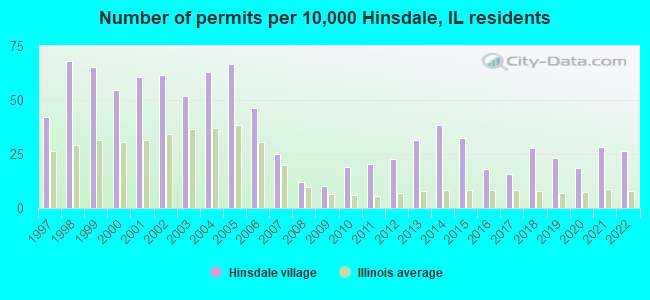
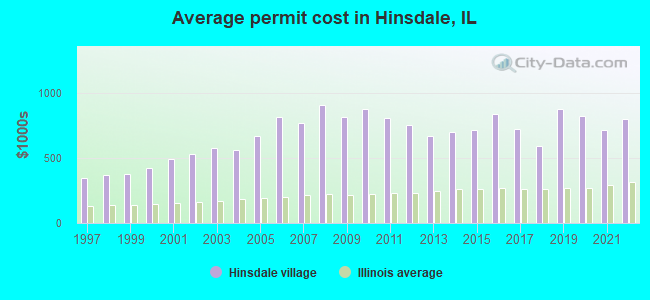
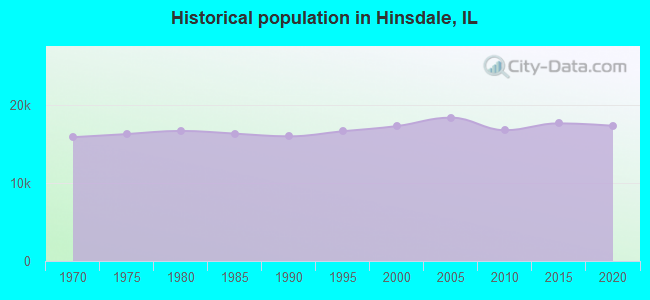
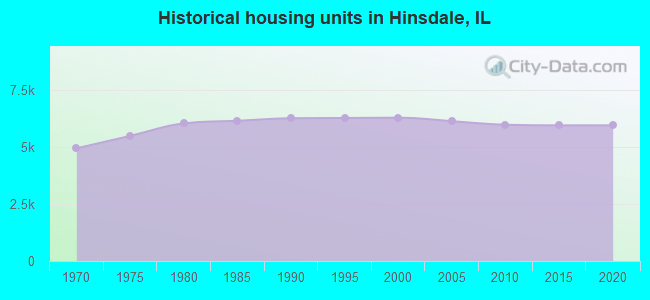
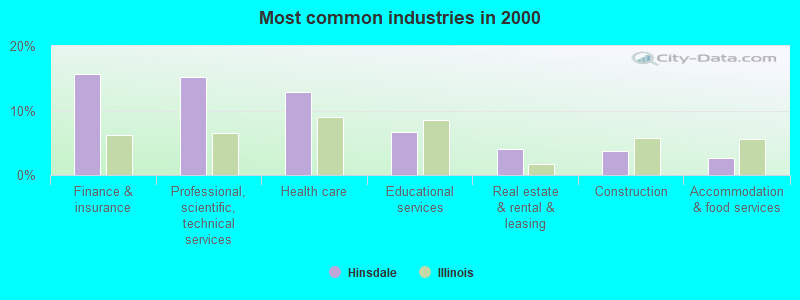
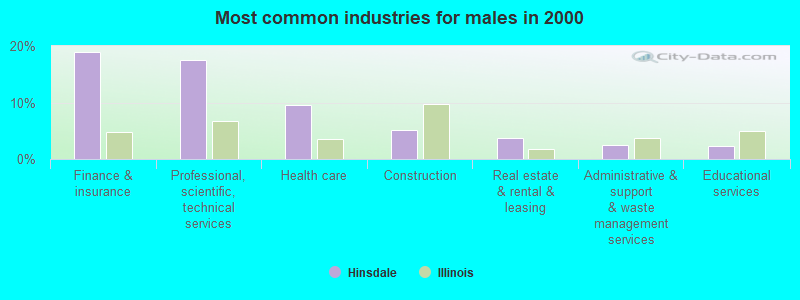
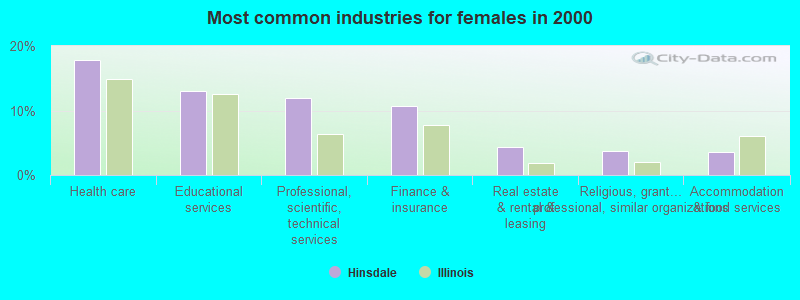
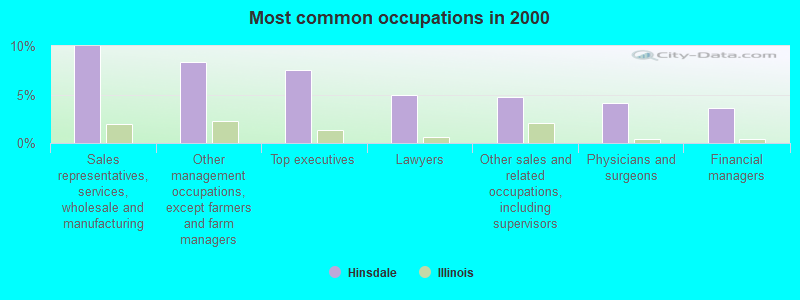
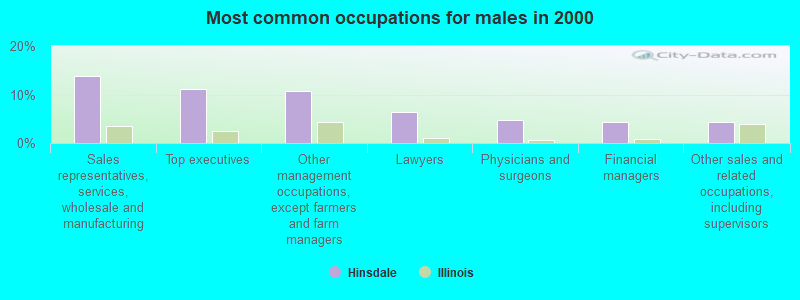
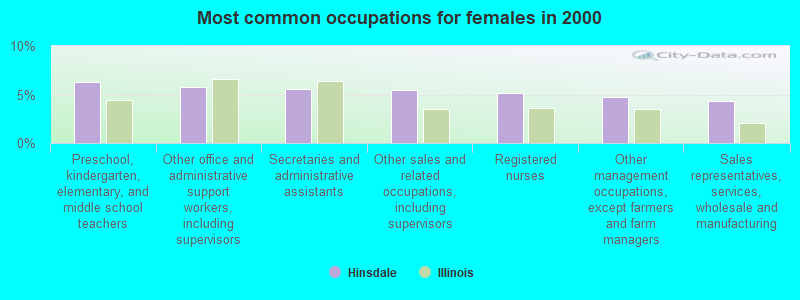
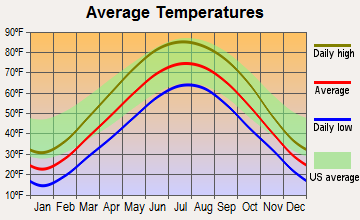
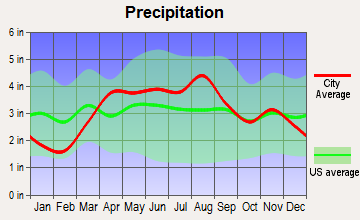
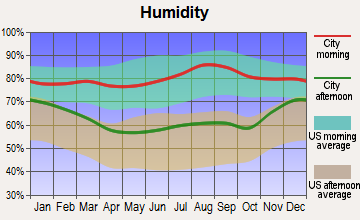
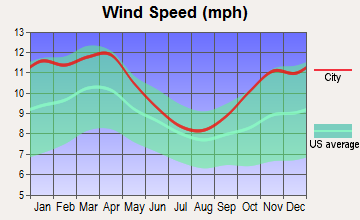
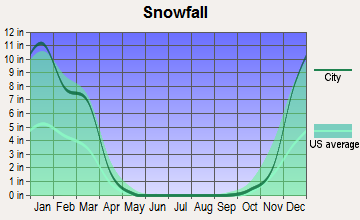
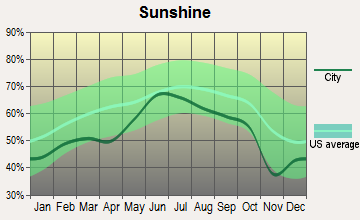
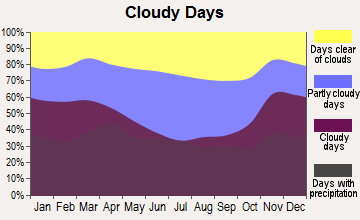


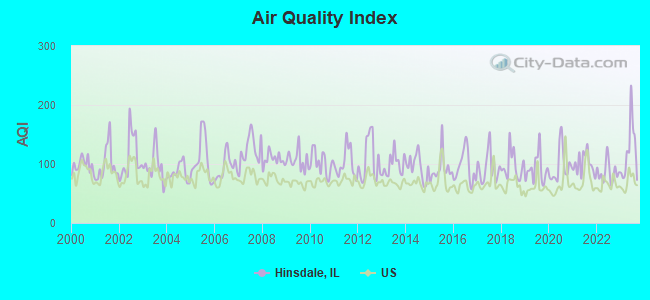
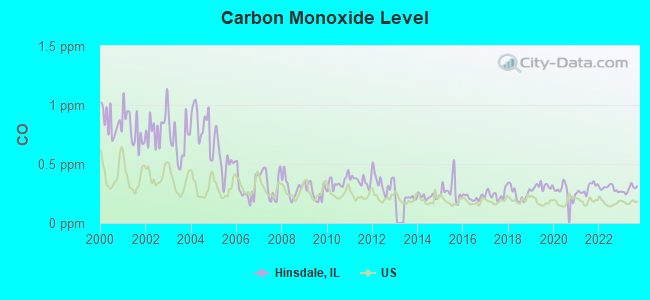
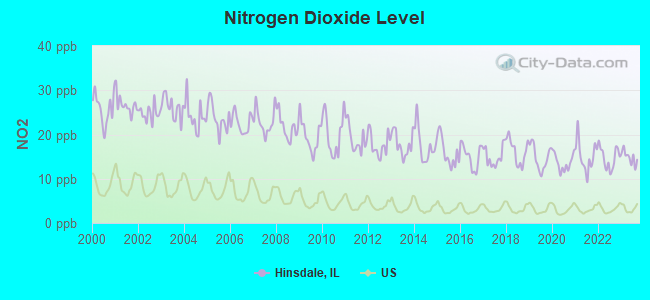
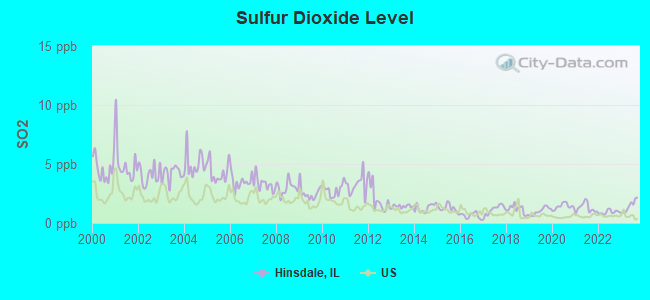
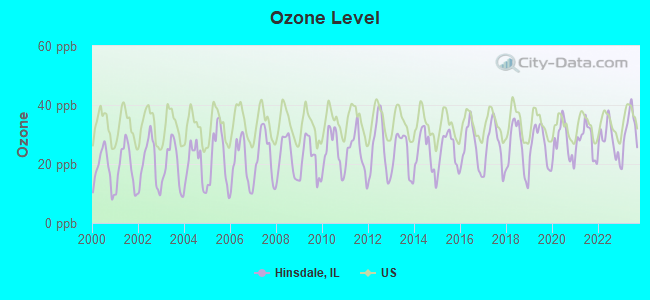
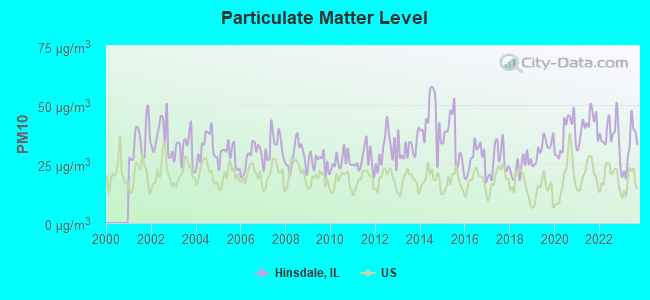

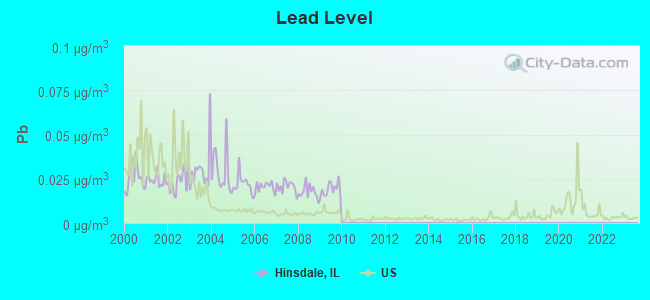

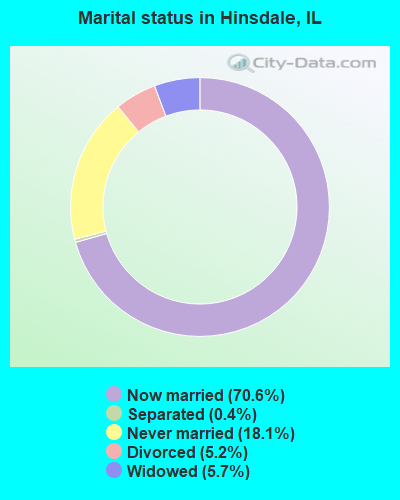
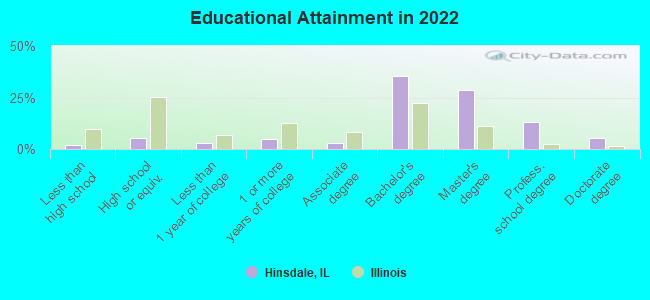
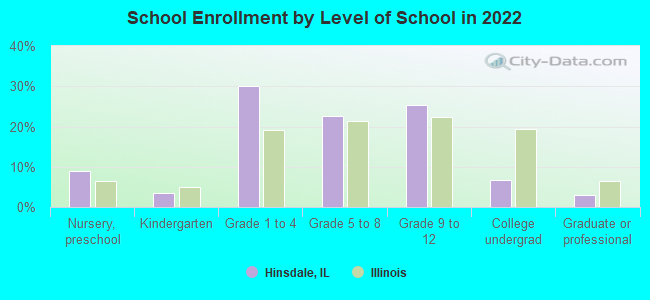
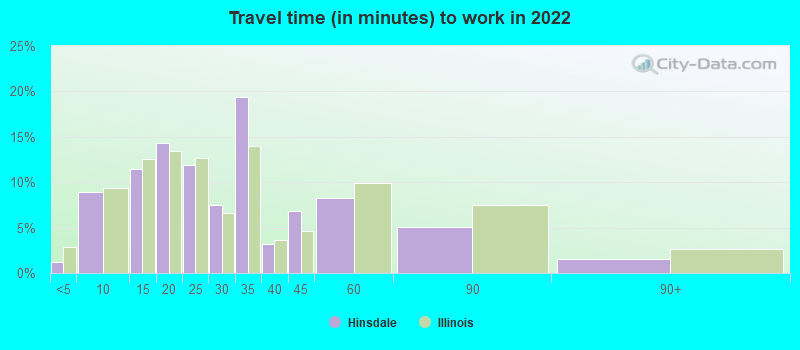
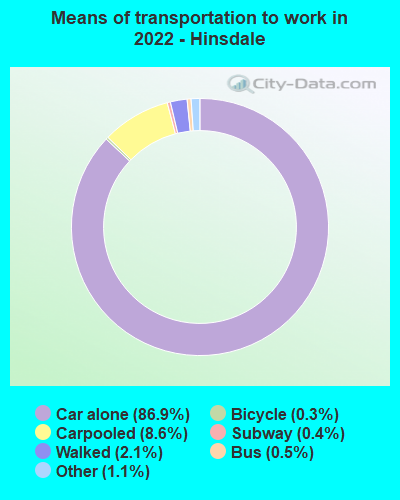
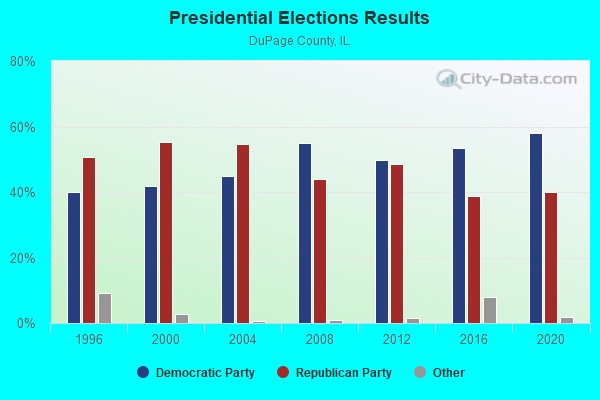
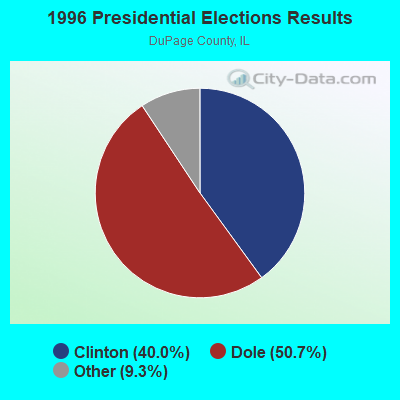
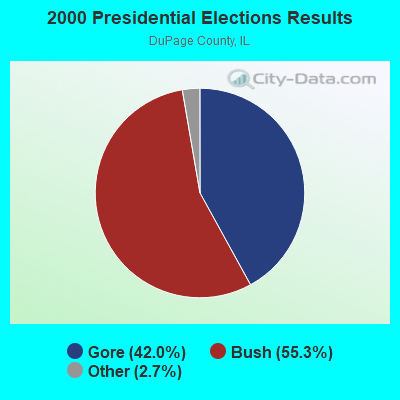
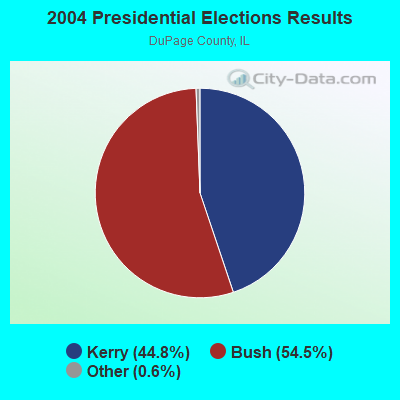
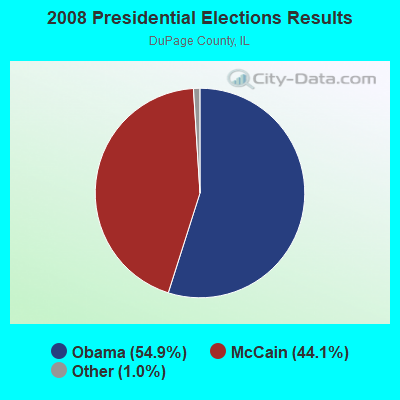
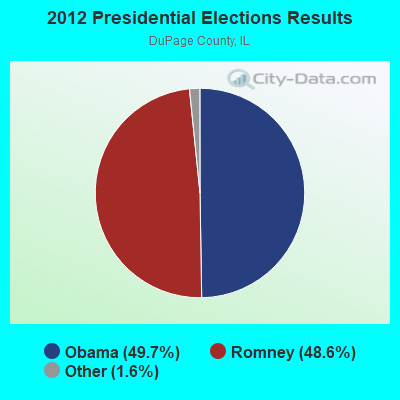
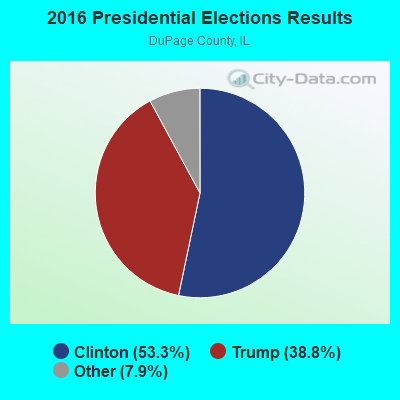
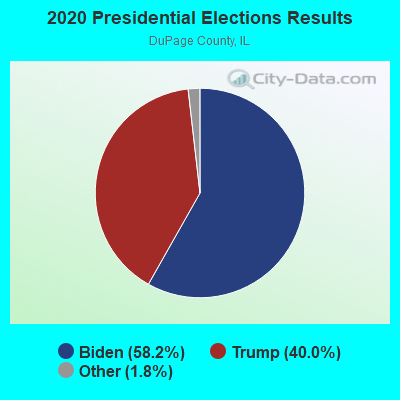
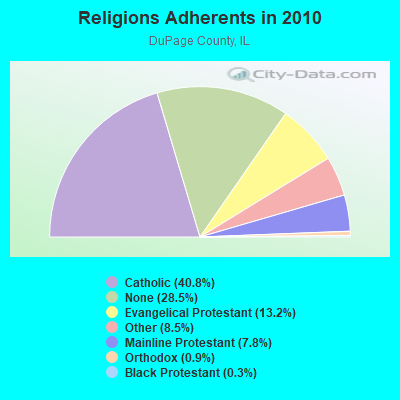
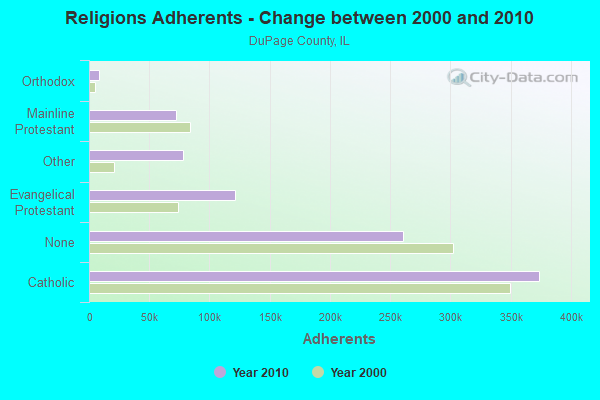
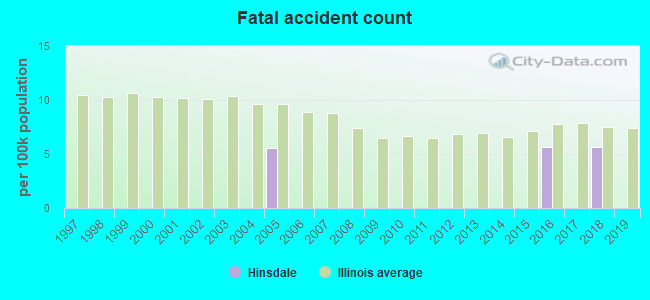
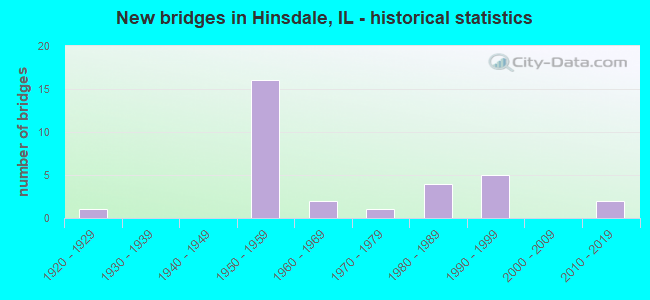
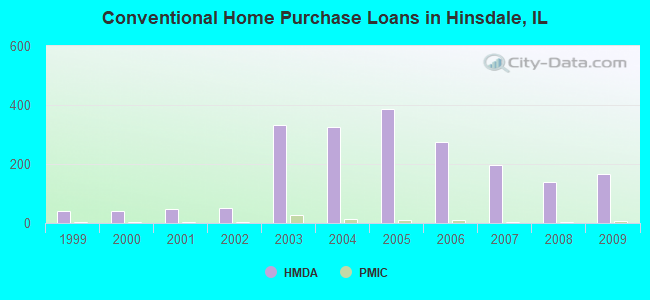
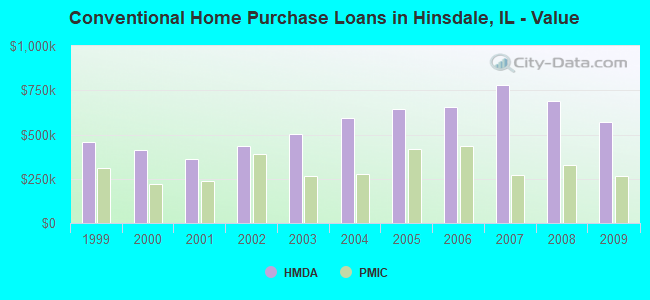
 Based on the data from the years 2002 - 2018 the average number of fires per year is 58. The highest number of fire incidents - 96 took place in 2009, and the least - 7 in 2002. The data has a rising trend.
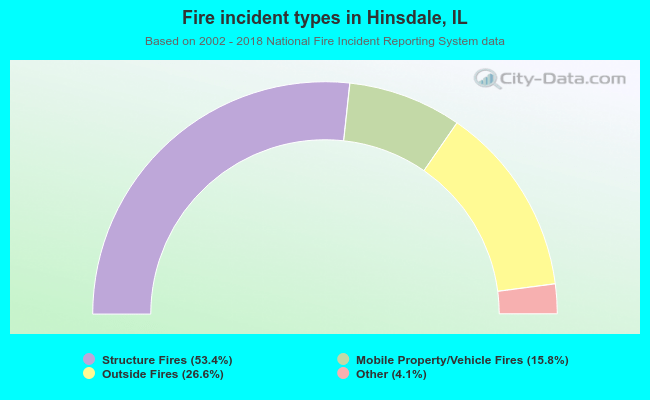 When looking into fire subcategories, the most incidents belonged to: Structure Fires (53.4%), and Outside Fires (26.6%).