Lacey, Washington Submit your own pictures of this city and show them to the world
OSM Map
General Map
Google Map
MSN Map
OSM Map
General Map
Google Map
MSN Map
OSM Map
General Map
Google Map
MSN Map
OSM Map
General Map
Google Map
MSN Map
Please wait while loading the map...
Population in 2022: 58,552 (100% urban, 0% rural). Population change since 2000: +87.5%Males: 28,761 Females: 29,791
March 2022 cost of living index in Lacey: 107.7 (more than average, U.S. average is 100) Percentage of residents living in poverty in 2022: 10.9%for White Non-Hispanic residents , 1.5% for Black residents , 13.5% for Hispanic or Latino residents , 30.2% for American Indian residents , 17.8% for Native Hawaiian and other Pacific Islander residents , 20.3% for other race residents , 6.2% for two or more races residents )
Profiles of local businesses
Business Search - 14 Million verified businesses
Data:
Median household income ($)
Median household income (% change since 2000)
Household income diversity
Ratio of average income to average house value (%)
Ratio of average income to average rent
Median household income ($) - White
Median household income ($) - Black or African American
Median household income ($) - Asian
Median household income ($) - Hispanic or Latino
Median household income ($) - American Indian and Alaska Native
Median household income ($) - Multirace
Median household income ($) - Other Race
Median household income for houses/condos with a mortgage ($)
Median household income for apartments without a mortgage ($)
Races - White alone (%)
Races - White alone (% change since 2000)
Races - Black alone (%)
Races - Black alone (% change since 2000)
Races - American Indian alone (%)
Races - American Indian alone (% change since 2000)
Races - Asian alone (%)
Races - Asian alone (% change since 2000)
Races - Hispanic (%)
Races - Hispanic (% change since 2000)
Races - Native Hawaiian and Other Pacific Islander alone (%)
Races - Native Hawaiian and Other Pacific Islander alone (% change since 2000)
Races - Two or more races (%)
Races - Two or more races (% change since 2000)
Races - Other race alone (%)
Races - Other race alone (% change since 2000)
Racial diversity
Unemployment (%)
Unemployment (% change since 2000)
Unemployment (%) - White
Unemployment (%) - Black or African American
Unemployment (%) - Asian
Unemployment (%) - Hispanic or Latino
Unemployment (%) - American Indian and Alaska Native
Unemployment (%) - Multirace
Unemployment (%) - Other Race
Population density (people per square mile)
Population - Males (%)
Population - Females (%)
Population - Males (%) - White
Population - Males (%) - Black or African American
Population - Males (%) - Asian
Population - Males (%) - Hispanic or Latino
Population - Males (%) - American Indian and Alaska Native
Population - Males (%) - Multirace
Population - Males (%) - Other Race
Population - Females (%) - White
Population - Females (%) - Black or African American
Population - Females (%) - Asian
Population - Females (%) - Hispanic or Latino
Population - Females (%) - American Indian and Alaska Native
Population - Females (%) - Multirace
Population - Females (%) - Other Race
Coronavirus confirmed cases (Apr 27, 2024)
Deaths caused by coronavirus (Apr 27, 2024)
Coronavirus confirmed cases (per 100k population) (Apr 27, 2024)
Deaths caused by coronavirus (per 100k population) (Apr 27, 2024)
Daily increase in number of cases (Apr 27, 2024)
Weekly increase in number of cases (Apr 27, 2024)
Cases doubled (in days) (Apr 27, 2024)
Hospitalized patients (Apr 18, 2022)
Negative test results (Apr 18, 2022)
Total test results (Apr 18, 2022)
COVID Vaccine doses distributed (per 100k population) (Sep 19, 2023)
COVID Vaccine doses administered (per 100k population) (Sep 19, 2023)
COVID Vaccine doses distributed (Sep 19, 2023)
COVID Vaccine doses administered (Sep 19, 2023)
Likely homosexual households (%)
Likely homosexual households (% change since 2000)
Likely homosexual households - Lesbian couples (%)
Likely homosexual households - Lesbian couples (% change since 2000)
Likely homosexual households - Gay men (%)
Likely homosexual households - Gay men (% change since 2000)
Cost of living index
Median gross rent ($)
Median contract rent ($)
Median monthly housing costs ($)
Median house or condo value ($)
Median house or condo value ($ change since 2000)
Mean house or condo value by units in structure - 1, detached ($)
Mean house or condo value by units in structure - 1, attached ($)
Mean house or condo value by units in structure - 2 ($)
Mean house or condo value by units in structure by units in structure - 3 or 4 ($)
Mean house or condo value by units in structure - 5 or more ($)
Mean house or condo value by units in structure - Boat, RV, van, etc. ($)
Mean house or condo value by units in structure - Mobile home ($)
Median house or condo value ($) - White
Median house or condo value ($) - Black or African American
Median house or condo value ($) - Asian
Median house or condo value ($) - Hispanic or Latino
Median house or condo value ($) - American Indian and Alaska Native
Median house or condo value ($) - Multirace
Median house or condo value ($) - Other Race
Median resident age
Resident age diversity
Median resident age - Males
Median resident age - Females
Median resident age - White
Median resident age - Black or African American
Median resident age - Asian
Median resident age - Hispanic or Latino
Median resident age - American Indian and Alaska Native
Median resident age - Multirace
Median resident age - Other Race
Median resident age - Males - White
Median resident age - Males - Black or African American
Median resident age - Males - Asian
Median resident age - Males - Hispanic or Latino
Median resident age - Males - American Indian and Alaska Native
Median resident age - Males - Multirace
Median resident age - Males - Other Race
Median resident age - Females - White
Median resident age - Females - Black or African American
Median resident age - Females - Asian
Median resident age - Females - Hispanic or Latino
Median resident age - Females - American Indian and Alaska Native
Median resident age - Females - Multirace
Median resident age - Females - Other Race
Commute - mean travel time to work (minutes)
Travel time to work - Less than 5 minutes (%)
Travel time to work - Less than 5 minutes (% change since 2000)
Travel time to work - 5 to 9 minutes (%)
Travel time to work - 5 to 9 minutes (% change since 2000)
Travel time to work - 10 to 19 minutes (%)
Travel time to work - 10 to 19 minutes (% change since 2000)
Travel time to work - 20 to 29 minutes (%)
Travel time to work - 20 to 29 minutes (% change since 2000)
Travel time to work - 30 to 39 minutes (%)
Travel time to work - 30 to 39 minutes (% change since 2000)
Travel time to work - 40 to 59 minutes (%)
Travel time to work - 40 to 59 minutes (% change since 2000)
Travel time to work - 60 to 89 minutes (%)
Travel time to work - 60 to 89 minutes (% change since 2000)
Travel time to work - 90 or more minutes (%)
Travel time to work - 90 or more minutes (% change since 2000)
Marital status - Never married (%)
Marital status - Now married (%)
Marital status - Separated (%)
Marital status - Widowed (%)
Marital status - Divorced (%)
Median family income ($)
Median family income (% change since 2000)
Median non-family income ($)
Median non-family income (% change since 2000)
Median per capita income ($)
Median per capita income (% change since 2000)
Median family income ($) - White
Median family income ($) - Black or African American
Median family income ($) - Asian
Median family income ($) - Hispanic or Latino
Median family income ($) - American Indian and Alaska Native
Median family income ($) - Multirace
Median family income ($) - Other Race
Median year house/condo built
Median year apartment built
Year house built - Built 2005 or later (%)
Year house built - Built 2000 to 2004 (%)
Year house built - Built 1990 to 1999 (%)
Year house built - Built 1980 to 1989 (%)
Year house built - Built 1970 to 1979 (%)
Year house built - Built 1960 to 1969 (%)
Year house built - Built 1950 to 1959 (%)
Year house built - Built 1940 to 1949 (%)
Year house built - Built 1939 or earlier (%)
Average household size
Household density (households per square mile)
Average household size - White
Average household size - Black or African American
Average household size - Asian
Average household size - Hispanic or Latino
Average household size - American Indian and Alaska Native
Average household size - Multirace
Average household size - Other Race
Occupied housing units (%)
Vacant housing units (%)
Owner occupied housing units (%)
Renter occupied housing units (%)
Vacancy status - For rent (%)
Vacancy status - For sale only (%)
Vacancy status - Rented or sold, not occupied (%)
Vacancy status - For seasonal, recreational, or occasional use (%)
Vacancy status - For migrant workers (%)
Vacancy status - Other vacant (%)
Residents with income below the poverty level (%)
Residents with income below 50% of the poverty level (%)
Children below poverty level (%)
Poor families by family type - Married-couple family (%)
Poor families by family type - Male, no wife present (%)
Poor families by family type - Female, no husband present (%)
Poverty status for native-born residents (%)
Poverty status for foreign-born residents (%)
Poverty among high school graduates not in families (%)
Poverty among people who did not graduate high school not in families (%)
Residents with income below the poverty level (%) - White
Residents with income below the poverty level (%) - Black or African American
Residents with income below the poverty level (%) - Asian
Residents with income below the poverty level (%) - Hispanic or Latino
Residents with income below the poverty level (%) - American Indian and Alaska Native
Residents with income below the poverty level (%) - Multirace
Residents with income below the poverty level (%) - Other Race
Air pollution - Air Quality Index (AQI)
Air pollution - CO
Air pollution - NO2
Air pollution - SO2
Air pollution - Ozone
Air pollution - PM10
Air pollution - PM25
Air pollution - Pb
Crime - Murders per 100,000 population
Crime - Rapes per 100,000 population
Crime - Robberies per 100,000 population
Crime - Assaults per 100,000 population
Crime - Burglaries per 100,000 population
Crime - Thefts per 100,000 population
Crime - Auto thefts per 100,000 population
Crime - Arson per 100,000 population
Crime - City-data.com crime index
Crime - Violent crime index
Crime - Property crime index
Crime - Murders per 100,000 population (5 year average)
Crime - Rapes per 100,000 population (5 year average)
Crime - Robberies per 100,000 population (5 year average)
Crime - Assaults per 100,000 population (5 year average)
Crime - Burglaries per 100,000 population (5 year average)
Crime - Thefts per 100,000 population (5 year average)
Crime - Auto thefts per 100,000 population (5 year average)
Crime - Arson per 100,000 population (5 year average)
Crime - City-data.com crime index (5 year average)
Crime - Violent crime index (5 year average)
Crime - Property crime index (5 year average)
1996 Presidential Elections Results (%) - Democratic Party (Clinton)
1996 Presidential Elections Results (%) - Republican Party (Dole)
1996 Presidential Elections Results (%) - Other
2000 Presidential Elections Results (%) - Democratic Party (Gore)
2000 Presidential Elections Results (%) - Republican Party (Bush)
2000 Presidential Elections Results (%) - Other
2004 Presidential Elections Results (%) - Democratic Party (Kerry)
2004 Presidential Elections Results (%) - Republican Party (Bush)
2004 Presidential Elections Results (%) - Other
2008 Presidential Elections Results (%) - Democratic Party (Obama)
2008 Presidential Elections Results (%) - Republican Party (McCain)
2008 Presidential Elections Results (%) - Other
2012 Presidential Elections Results (%) - Democratic Party (Obama)
2012 Presidential Elections Results (%) - Republican Party (Romney)
2012 Presidential Elections Results (%) - Other
2016 Presidential Elections Results (%) - Democratic Party (Clinton)
2016 Presidential Elections Results (%) - Republican Party (Trump)
2016 Presidential Elections Results (%) - Other
2020 Presidential Elections Results (%) - Democratic Party (Biden)
2020 Presidential Elections Results (%) - Republican Party (Trump)
2020 Presidential Elections Results (%) - Other
Ancestries Reported - Arab (%)
Ancestries Reported - Czech (%)
Ancestries Reported - Danish (%)
Ancestries Reported - Dutch (%)
Ancestries Reported - English (%)
Ancestries Reported - French (%)
Ancestries Reported - French Canadian (%)
Ancestries Reported - German (%)
Ancestries Reported - Greek (%)
Ancestries Reported - Hungarian (%)
Ancestries Reported - Irish (%)
Ancestries Reported - Italian (%)
Ancestries Reported - Lithuanian (%)
Ancestries Reported - Norwegian (%)
Ancestries Reported - Polish (%)
Ancestries Reported - Portuguese (%)
Ancestries Reported - Russian (%)
Ancestries Reported - Scotch-Irish (%)
Ancestries Reported - Scottish (%)
Ancestries Reported - Slovak (%)
Ancestries Reported - Subsaharan African (%)
Ancestries Reported - Swedish (%)
Ancestries Reported - Swiss (%)
Ancestries Reported - Ukrainian (%)
Ancestries Reported - United States (%)
Ancestries Reported - Welsh (%)
Ancestries Reported - West Indian (%)
Ancestries Reported - Other (%)
Educational Attainment - No schooling completed (%)
Educational Attainment - Less than high school (%)
Educational Attainment - High school or equivalent (%)
Educational Attainment - Less than 1 year of college (%)
Educational Attainment - 1 or more years of college (%)
Educational Attainment - Associate degree (%)
Educational Attainment - Bachelor's degree (%)
Educational Attainment - Master's degree (%)
Educational Attainment - Professional school degree (%)
Educational Attainment - Doctorate degree (%)
School Enrollment - Nursery, preschool (%)
School Enrollment - Kindergarten (%)
School Enrollment - Grade 1 to 4 (%)
School Enrollment - Grade 5 to 8 (%)
School Enrollment - Grade 9 to 12 (%)
School Enrollment - College undergrad (%)
School Enrollment - Graduate or professional (%)
School Enrollment - Not enrolled in school (%)
School enrollment - Public schools (%)
School enrollment - Private schools (%)
School enrollment - Not enrolled (%)
Median number of rooms in houses and condos
Median number of rooms in apartments
Housing units lacking complete plumbing facilities (%)
Housing units lacking complete kitchen facilities (%)
Density of houses
Urban houses (%)
Rural houses (%)
Households with people 60 years and over (%)
Households with people 65 years and over (%)
Households with people 75 years and over (%)
Households with one or more nonrelatives (%)
Households with no nonrelatives (%)
Population in households (%)
Family households (%)
Nonfamily households (%)
Population in families (%)
Family households with own children (%)
Median number of bedrooms in owner occupied houses
Mean number of bedrooms in owner occupied houses
Median number of bedrooms in renter occupied houses
Mean number of bedrooms in renter occupied houses
Median number of vehichles in owner occupied houses
Mean number of vehichles in owner occupied houses
Median number of vehichles in renter occupied houses
Mean number of vehichles in renter occupied houses
Mortgage status - with mortgage (%)
Mortgage status - with second mortgage (%)
Mortgage status - with home equity loan (%)
Mortgage status - with both second mortgage and home equity loan (%)
Mortgage status - without a mortgage (%)
Average family size
Average family size - White
Average family size - Black or African American
Average family size - Asian
Average family size - Hispanic or Latino
Average family size - American Indian and Alaska Native
Average family size - Multirace
Average family size - Other Race
Geographical mobility - Same house 1 year ago (%)
Geographical mobility - Moved within same county (%)
Geographical mobility - Moved from different county within same state (%)
Geographical mobility - Moved from different state (%)
Geographical mobility - Moved from abroad (%)
Place of birth - Born in state of residence (%)
Place of birth - Born in other state (%)
Place of birth - Native, outside of US (%)
Place of birth - Foreign born (%)
Housing units in structures - 1, detached (%)
Housing units in structures - 1, attached (%)
Housing units in structures - 2 (%)
Housing units in structures - 3 or 4 (%)
Housing units in structures - 5 to 9 (%)
Housing units in structures - 10 to 19 (%)
Housing units in structures - 20 to 49 (%)
Housing units in structures - 50 or more (%)
Housing units in structures - Mobile home (%)
Housing units in structures - Boat, RV, van, etc. (%)
House/condo owner moved in on average (years ago)
Renter moved in on average (years ago)
Year householder moved into unit - Moved in 1999 to March 2000 (%)
Year householder moved into unit - Moved in 1995 to 1998 (%)
Year householder moved into unit - Moved in 1990 to 1994 (%)
Year householder moved into unit - Moved in 1980 to 1989 (%)
Year householder moved into unit - Moved in 1970 to 1979 (%)
Year householder moved into unit - Moved in 1969 or earlier (%)
Means of transportation to work - Drove car alone (%)
Means of transportation to work - Carpooled (%)
Means of transportation to work - Public transportation (%)
Means of transportation to work - Bus or trolley bus (%)
Means of transportation to work - Streetcar or trolley car (%)
Means of transportation to work - Subway or elevated (%)
Means of transportation to work - Railroad (%)
Means of transportation to work - Ferryboat (%)
Means of transportation to work - Taxicab (%)
Means of transportation to work - Motorcycle (%)
Means of transportation to work - Bicycle (%)
Means of transportation to work - Walked (%)
Means of transportation to work - Other means (%)
Working at home (%)
Industry diversity
Most Common Industries - Agriculture, forestry, fishing and hunting, and mining (%)
Most Common Industries - Agriculture, forestry, fishing and hunting (%)
Most Common Industries - Mining, quarrying, and oil and gas extraction (%)
Most Common Industries - Construction (%)
Most Common Industries - Manufacturing (%)
Most Common Industries - Wholesale trade (%)
Most Common Industries - Retail trade (%)
Most Common Industries - Transportation and warehousing, and utilities (%)
Most Common Industries - Transportation and warehousing (%)
Most Common Industries - Utilities (%)
Most Common Industries - Information (%)
Most Common Industries - Finance and insurance, and real estate and rental and leasing (%)
Most Common Industries - Finance and insurance (%)
Most Common Industries - Real estate and rental and leasing (%)
Most Common Industries - Professional, scientific, and management, and administrative and waste management services (%)
Most Common Industries - Professional, scientific, and technical services (%)
Most Common Industries - Management of companies and enterprises (%)
Most Common Industries - Administrative and support and waste management services (%)
Most Common Industries - Educational services, and health care and social assistance (%)
Most Common Industries - Educational services (%)
Most Common Industries - Health care and social assistance (%)
Most Common Industries - Arts, entertainment, and recreation, and accommodation and food services (%)
Most Common Industries - Arts, entertainment, and recreation (%)
Most Common Industries - Accommodation and food services (%)
Most Common Industries - Other services, except public administration (%)
Most Common Industries - Public administration (%)
Occupation diversity
Most Common Occupations - Management, business, science, and arts occupations (%)
Most Common Occupations - Management, business, and financial occupations (%)
Most Common Occupations - Management occupations (%)
Most Common Occupations - Business and financial operations occupations (%)
Most Common Occupations - Computer, engineering, and science occupations (%)
Most Common Occupations - Computer and mathematical occupations (%)
Most Common Occupations - Architecture and engineering occupations (%)
Most Common Occupations - Life, physical, and social science occupations (%)
Most Common Occupations - Education, legal, community service, arts, and media occupations (%)
Most Common Occupations - Community and social service occupations (%)
Most Common Occupations - Legal occupations (%)
Most Common Occupations - Education, training, and library occupations (%)
Most Common Occupations - Arts, design, entertainment, sports, and media occupations (%)
Most Common Occupations - Healthcare practitioners and technical occupations (%)
Most Common Occupations - Health diagnosing and treating practitioners and other technical occupations (%)
Most Common Occupations - Health technologists and technicians (%)
Most Common Occupations - Service occupations (%)
Most Common Occupations - Healthcare support occupations (%)
Most Common Occupations - Protective service occupations (%)
Most Common Occupations - Fire fighting and prevention, and other protective service workers including supervisors (%)
Most Common Occupations - Law enforcement workers including supervisors (%)
Most Common Occupations - Food preparation and serving related occupations (%)
Most Common Occupations - Building and grounds cleaning and maintenance occupations (%)
Most Common Occupations - Personal care and service occupations (%)
Most Common Occupations - Sales and office occupations (%)
Most Common Occupations - Sales and related occupations (%)
Most Common Occupations - Office and administrative support occupations (%)
Most Common Occupations - Natural resources, construction, and maintenance occupations (%)
Most Common Occupations - Farming, fishing, and forestry occupations (%)
Most Common Occupations - Construction and extraction occupations (%)
Most Common Occupations - Installation, maintenance, and repair occupations (%)
Most Common Occupations - Production, transportation, and material moving occupations (%)
Most Common Occupations - Production occupations (%)
Most Common Occupations - Transportation occupations (%)
Most Common Occupations - Material moving occupations (%)
People in Group quarters - Institutionalized population (%)
People in Group quarters - Correctional institutions (%)
People in Group quarters - Federal prisons and detention centers (%)
People in Group quarters - Halfway houses (%)
People in Group quarters - Local jails and other confinement facilities (including police lockups) (%)
People in Group quarters - Military disciplinary barracks (%)
People in Group quarters - State prisons (%)
People in Group quarters - Other types of correctional institutions (%)
People in Group quarters - Nursing homes (%)
People in Group quarters - Hospitals/wards, hospices, and schools for the handicapped (%)
People in Group quarters - Hospitals/wards and hospices for chronically ill (%)
People in Group quarters - Hospices or homes for chronically ill (%)
People in Group quarters - Military hospitals or wards for chronically ill (%)
People in Group quarters - Other hospitals or wards for chronically ill (%)
People in Group quarters - Hospitals or wards for drug/alcohol abuse (%)
People in Group quarters - Mental (Psychiatric) hospitals or wards (%)
People in Group quarters - Schools, hospitals, or wards for the mentally retarded (%)
People in Group quarters - Schools, hospitals, or wards for the physically handicapped (%)
People in Group quarters - Institutions for the deaf (%)
People in Group quarters - Institutions for the blind (%)
People in Group quarters - Orthopedic wards and institutions for the physically handicapped (%)
People in Group quarters - Wards in general hospitals for patients who have no usual home elsewhere (%)
People in Group quarters - Wards in military hospitals for patients who have no usual home elsewhere (%)
People in Group quarters - Juvenile institutions (%)
People in Group quarters - Long-term care (%)
People in Group quarters - Homes for abused, dependent, and neglected children (%)
People in Group quarters - Residential treatment centers for emotionally disturbed children (%)
People in Group quarters - Training schools for juvenile delinquents (%)
People in Group quarters - Short-term care, detention or diagnostic centers for delinquent children (%)
People in Group quarters - Type of juvenile institution unknown (%)
People in Group quarters - Noninstitutionalized population (%)
People in Group quarters - College dormitories (includes college quarters off campus) (%)
People in Group quarters - Military quarters (%)
People in Group quarters - On base (%)
People in Group quarters - Barracks, unaccompanied personnel housing (UPH), (Enlisted/Officer), ;and similar group living quarters for military personnel (%)
People in Group quarters - Transient quarters for temporary residents (%)
People in Group quarters - Military ships (%)
People in Group quarters - Group homes (%)
People in Group quarters - Homes or halfway houses for drug/alcohol abuse (%)
People in Group quarters - Homes for the mentally ill (%)
People in Group quarters - Homes for the mentally retarded (%)
People in Group quarters - Homes for the physically handicapped (%)
People in Group quarters - Other group homes (%)
People in Group quarters - Religious group quarters (%)
People in Group quarters - Dormitories (%)
People in Group quarters - Agriculture workers' dormitories on farms (%)
People in Group quarters - Job Corps and vocational training facilities (%)
People in Group quarters - Other workers' dormitories (%)
People in Group quarters - Crews of maritime vessels (%)
People in Group quarters - Other nonhousehold living situations (%)
People in Group quarters - Other noninstitutional group quarters (%)
Residents speaking English at home (%)
Residents speaking English at home - Born in the United States (%)
Residents speaking English at home - Native, born elsewhere (%)
Residents speaking English at home - Foreign born (%)
Residents speaking Spanish at home (%)
Residents speaking Spanish at home - Born in the United States (%)
Residents speaking Spanish at home - Native, born elsewhere (%)
Residents speaking Spanish at home - Foreign born (%)
Residents speaking other language at home (%)
Residents speaking other language at home - Born in the United States (%)
Residents speaking other language at home - Native, born elsewhere (%)
Residents speaking other language at home - Foreign born (%)
Class of Workers - Employee of private company (%)
Class of Workers - Self-employed in own incorporated business (%)
Class of Workers - Private not-for-profit wage and salary workers (%)
Class of Workers - Local government workers (%)
Class of Workers - State government workers (%)
Class of Workers - Federal government workers (%)
Class of Workers - Self-employed workers in own not incorporated business and Unpaid family workers (%)
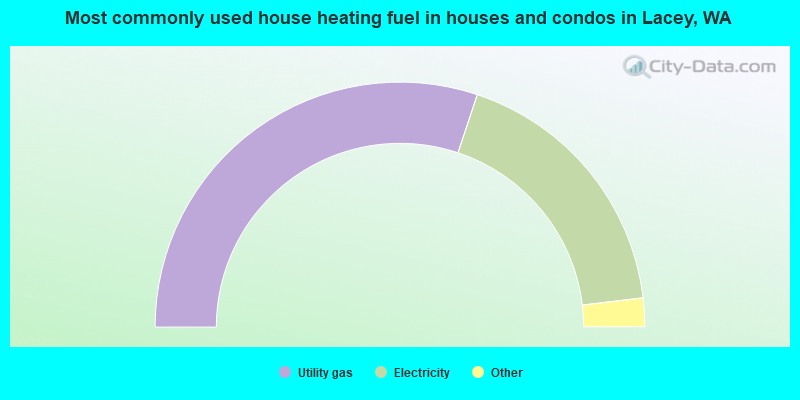
House heating fuel used in houses and condos - Utility gas (%)
House heating fuel used in houses and condos - Bottled, tank, or LP gas (%)
House heating fuel used in houses and condos - Electricity (%)
House heating fuel used in houses and condos - Fuel oil, kerosene, etc. (%)
House heating fuel used in houses and condos - Coal or coke (%)
House heating fuel used in houses and condos - Wood (%)
House heating fuel used in houses and condos - Solar energy (%)
House heating fuel used in houses and condos - Other fuel (%)
House heating fuel used in houses and condos - No fuel used (%)
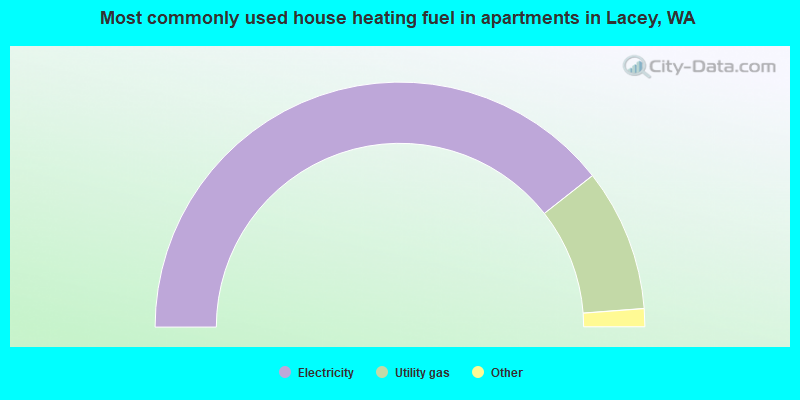
House heating fuel used in apartments - Utility gas (%)
House heating fuel used in apartments - Bottled, tank, or LP gas (%)
House heating fuel used in apartments - Electricity (%)
House heating fuel used in apartments - Fuel oil, kerosene, etc. (%)
House heating fuel used in apartments - Coal or coke (%)
House heating fuel used in apartments - Wood (%)
House heating fuel used in apartments - Solar energy (%)
House heating fuel used in apartments - Other fuel (%)
House heating fuel used in apartments - No fuel used (%)
Armed forces status - In Armed Forces (%)
Armed forces status - Civilian (%)
Armed forces status - Civilian - Veteran (%)
Armed forces status - Civilian - Nonveteran (%)
Fatal accidents locations in years 2005-2021
Fatal accidents locations in 2005
Fatal accidents locations in 2006
Fatal accidents locations in 2007
Fatal accidents locations in 2008
Fatal accidents locations in 2009
Fatal accidents locations in 2010
Fatal accidents locations in 2011
Fatal accidents locations in 2012
Fatal accidents locations in 2013
Fatal accidents locations in 2014
Fatal accidents locations in 2015
Fatal accidents locations in 2016
Fatal accidents locations in 2017
Fatal accidents locations in 2018
Fatal accidents locations in 2019
Fatal accidents locations in 2020
Fatal accidents locations in 2021
Alcohol use - People drinking some alcohol every month (%)
Alcohol use - People not drinking at all (%)
Alcohol use - Average days/month drinking alcohol
Alcohol use - Average drinks/week
Alcohol use - Average days/year people drink much
Audiometry - Average condition of hearing (%)
Audiometry - People that can hear a whisper from across a quiet room (%)
Audiometry - People that can hear normal voice from across a quiet room (%)
Audiometry - Ears ringing, roaring, buzzing (%)
Audiometry - Had a job exposure to loud noise (%)
Audiometry - Had off-work exposure to loud noise (%)
Blood Pressure & Cholesterol - Has high blood pressure (%)
Blood Pressure & Cholesterol - Checking blood pressure at home (%)
Blood Pressure & Cholesterol - Frequently checking blood cholesterol (%)
Blood Pressure & Cholesterol - Has high cholesterol level (%)
Consumer Behavior - Money monthly spent on food at supermarket/grocery store
Consumer Behavior - Money monthly spent on food at other stores
Consumer Behavior - Money monthly spent on eating out
Consumer Behavior - Money monthly spent on carryout/delivered foods
Consumer Behavior - Income spent on food at supermarket/grocery store (%)
Consumer Behavior - Income spent on food at other stores (%)
Consumer Behavior - Income spent on eating out (%)
Consumer Behavior - Income spent on carryout/delivered foods (%)
Current Health Status - General health condition (%)
Current Health Status - Blood donors (%)
Current Health Status - Has blood ever tested for HIV virus (%)
Current Health Status - Left-handed people (%)
Dermatology - People using sunscreen (%)
Diabetes - Diabetics (%)
Diabetes - Had a blood test for high blood sugar (%)
Diabetes - People taking insulin (%)
Diet Behavior & Nutrition - Diet health (%)
Diet Behavior & Nutrition - Milk product consumption (# of products/month)
Diet Behavior & Nutrition - Meals not home prepared (#/week)
Diet Behavior & Nutrition - Meals from fast food or pizza place (#/week)
Diet Behavior & Nutrition - Ready-to-eat foods (#/month)
Diet Behavior & Nutrition - Frozen meals/pizza (#/month)
Drug Use - People that ever used marijuana or hashish (%)
Drug Use - Ever used hard drugs (%)
Drug Use - Ever used any form of cocaine (%)
Drug Use - Ever used heroin (%)
Drug Use - Ever used methamphetamine (%)
Health Insurance - People covered by health insurance (%)
Kidney Conditions-Urology - Avg. # of times urinating at night
Medical Conditions - People with asthma (%)
Medical Conditions - People with anemia (%)
Medical Conditions - People with psoriasis (%)
Medical Conditions - People with overweight (%)
Medical Conditions - Elderly people having difficulties in thinking or remembering (%)
Medical Conditions - People who ever received blood transfusion (%)
Medical Conditions - People having trouble seeing even with glass/contacts (%)
Medical Conditions - People with arthritis (%)
Medical Conditions - People with gout (%)
Medical Conditions - People with congestive heart failure (%)
Medical Conditions - People with coronary heart disease (%)
Medical Conditions - People with angina pectoris (%)
Medical Conditions - People who ever had heart attack (%)
Medical Conditions - People who ever had stroke (%)
Medical Conditions - People with emphysema (%)
Medical Conditions - People with thyroid problem (%)
Medical Conditions - People with chronic bronchitis (%)
Medical Conditions - People with any liver condition (%)
Medical Conditions - People who ever had cancer or malignancy (%)
Mental Health - People who have little interest in doing things (%)
Mental Health - People feeling down, depressed, or hopeless (%)
Mental Health - People who have trouble sleeping or sleeping too much (%)
Mental Health - People feeling tired or having little energy (%)
Mental Health - People with poor appetite or overeating (%)
Mental Health - People feeling bad about themself (%)
Mental Health - People who have trouble concentrating on things (%)
Mental Health - People moving or speaking slowly or too fast (%)
Mental Health - People having thoughts they would be better off dead (%)
Oral Health - Average years since last visit a dentist
Oral Health - People embarrassed because of mouth (%)
Oral Health - People with gum disease (%)
Oral Health - General health of teeth and gums (%)
Oral Health - Average days a week using dental floss/device
Oral Health - Average days a week using mouthwash for dental problem
Oral Health - Average number of teeth
Pesticide Use - Households using pesticides to control insects (%)
Pesticide Use - Households using pesticides to kill weeds (%)
Physical Activity - People doing vigorous-intensity work activities (%)
Physical Activity - People doing moderate-intensity work activities (%)
Physical Activity - People walking or bicycling (%)
Physical Activity - People doing vigorous-intensity recreational activities (%)
Physical Activity - People doing moderate-intensity recreational activities (%)
Physical Activity - Average hours a day doing sedentary activities
Physical Activity - Average hours a day watching TV or videos
Physical Activity - Average hours a day using computer
Physical Functioning - People having limitations keeping them from working (%)
Physical Functioning - People limited in amount of work they can do (%)
Physical Functioning - People that need special equipment to walk (%)
Physical Functioning - People experiencing confusion/memory problems (%)
Physical Functioning - People requiring special healthcare equipment (%)
Prescription Medications - Average number of prescription medicines taking
Preventive Aspirin Use - Adults 40+ taking low-dose aspirin (%)
Reproductive Health - Vaginal deliveries (%)
Reproductive Health - Cesarean deliveries (%)
Reproductive Health - Deliveries resulted in a live birth (%)
Reproductive Health - Pregnancies resulted in a delivery (%)
Reproductive Health - Women breastfeeding newborns (%)
Reproductive Health - Women that had a hysterectomy (%)
Reproductive Health - Women that had both ovaries removed (%)
Reproductive Health - Women that have ever taken birth control pills (%)
Reproductive Health - Women taking birth control pills (%)
Reproductive Health - Women that have ever used Depo-Provera or injectables (%)
Reproductive Health - Women that have ever used female hormones (%)
Sexual Behavior - People 18+ that ever had sex (vaginal, anal, or oral) (%)
Sexual Behavior - Males 18+ that ever had vaginal sex with a woman (%)
Sexual Behavior - Males 18+ that ever performed oral sex on a woman (%)
Sexual Behavior - Males 18+ that ever had anal sex with a woman (%)
Sexual Behavior - Males 18+ that ever had any sex with a man (%)
Sexual Behavior - Females 18+ that ever had vaginal sex with a man (%)
Sexual Behavior - Females 18+ that ever performed oral sex on a man (%)
Sexual Behavior - Females 18+ that ever had anal sex with a man (%)
Sexual Behavior - Females 18+ that ever had any kind of sex with a woman (%)
Sexual Behavior - Average age people first had sex
Sexual Behavior - Average number of female sex partners in lifetime (males 18+)
Sexual Behavior - Average number of female vaginal sex partners in lifetime (males 18+)
Sexual Behavior - Average age people first performed oral sex on a woman (18+)
Sexual Behavior - Average number of woman performed oral sex on in lifetime (18+)
Sexual Behavior - Average number of male sex partners in lifetime (males 18+)
Sexual Behavior - Average number of male anal sex partners in lifetime (males 18+)
Sexual Behavior - Average age people first performed oral sex on a man (18+)
Sexual Behavior - Average number of male oral sex partners in lifetime (18+)
Sexual Behavior - People using protection when performing oral sex (%)
Sexual Behavior - Average number of times people have vaginal or anal sex a year
Sexual Behavior - People having sex without condom (%)
Sexual Behavior - Average number of male sex partners in lifetime (females 18+)
Sexual Behavior - Average number of male vaginal sex partners in lifetime (females 18+)
Sexual Behavior - Average number of female sex partners in lifetime (females 18+)
Sexual Behavior - Circumcised males 18+ (%)
Sleep Disorders - Average hours sleeping at night
Sleep Disorders - People that has trouble sleeping (%)
Smoking-Cigarette Use - People smoking cigarettes (%)
Taste & Smell - People 40+ having problems with smell (%)
Taste & Smell - People 40+ having problems with taste (%)
Taste & Smell - People 40+ that ever had wisdom teeth removed (%)
Taste & Smell - People 40+ that ever had tonsils teeth removed (%)
Taste & Smell - People 40+ that ever had a loss of consciousness because of a head injury (%)
Taste & Smell - People 40+ that ever had a broken nose or other serious injury to face or skull (%)
Taste & Smell - People 40+ that ever had two or more sinus infections (%)
Weight - Average height (inches)
Weight - Average weight (pounds)
Weight - Average BMI
Weight - People that are obese (%)
Weight - People that ever were obese (%)
Weight - People trying to lose weight (%)
According to our research of Washington and other state lists, there were 11 registered sex offenders living in Lacey, Washington as of April 27, 2024 . The ratio of all residents to sex offenders in Lacey is 4,288 to 1.The ratio of registered sex offenders to all residents in this city is much lower than the state average.
The City-Data.com crime index weighs serious crimes and violent crimes more heavily. Higher means more crime, U.S. average is 246.1. It adjusts for the number of visitors and daily workers commuting into cities.
- means the value is smaller than the state average.
- means the value is about the same as the state average.
- means the value is bigger than the state average.
- means the value is much bigger than the state average.
Crime rate in Lacey detailed stats: murders, rapes, robberies, assaults, burglaries, thefts, arson Officers per 1,000 residents here:
0.88Washington average:
1.35
Latest news from Lacey, WA collected exclusively by city-data.com from local newspapers, TV, and radio stations
Ancestries: German (8.6%), English (5.8%), Irish (5.0%), American (4.2%), European (4.1%), Norwegian (3.9%).
Current Local Time:
Land area: 15.9 square miles.
Population density: 3,671 people per square mile (average).
7,219 residents are foreign born (6.3% Asia , 3.7% Latin America , 1.3% Europe ).
This city:
12.6%Washington:
14.9%
Median real estate property taxes paid for housing units with mortgages in 2022: $3,542 (0.8%)Median real estate property taxes paid for housing units with no mortgage in 2022: $3,328 (0.8%)
Nearest city with pop. 50,000+: Lakewood, WA
Nearest city with pop. 200,000+: Seattle, WA
Nearest city with pop. 1,000,000+: Los Angeles, CA
Nearest cities:
Latitude: 47.03 N, Longitude: 122.81 W
Daytime population change due to commuting: +377 (+0.7%)Workers who live and work in this city: 11,028 (40.6%)
Area code commonly used in this area: 360
Single-family new house construction building permits:
2022: 44 buildings , average cost: $293,3002021: 107 buildings , average cost: $261,1002020: 135 buildings , average cost: $298,4002019: 243 buildings , average cost: $273,5002018: 201 buildings , average cost: $289,6002017: 163 buildings , average cost: $288,9002016: 335 buildings , average cost: $270,3002015: 308 buildings , average cost: $254,5002014: 314 buildings , average cost: $248,1002013: 213 buildings , average cost: $232,3002012: 283 buildings , average cost: $232,7002011: 219 buildings , average cost: $191,6002010: 267 buildings , average cost: $154,4002009: 298 buildings , average cost: $159,5002008: 338 buildings , average cost: $163,7002007: 808 buildings , average cost: $174,7002006: 1086 buildings , average cost: $167,3002005: 836 buildings , average cost: $168,1002004: 249 buildings , average cost: $162,4002003: 200 buildings , average cost: $148,6002002: 110 buildings , average cost: $111,3002001: 159 buildings , average cost: $108,2002000: 124 buildings , average cost: $107,0001999: 273 buildings , average cost: $101,1001998: 286 buildings , average cost: $96,0001997: 309 buildings , average cost: $87,400Unemployment in December 2023:
Population change in the 1990s: +10,466 (+50.4%).
Most common occupations in Lacey, WA (%)
Both Males Females
Other office and administrative support workers, including supervisors (6.1%)
Secretaries and administrative assistants (3.9%)
Other management occupations, except farmers and farm managers (3.8%)
Computer specialists (3.7%)
Other sales and related occupations, including supervisors (3.6%)
Building and grounds cleaning and maintenance occupations (3.4%)
Cooks and food preparation workers (2.9%)
Computer specialists (5.5%)
Other sales and related occupations, including supervisors (4.4%)
Electrical equipment mechanics and other installation, maintenance, and repair workers, including supervisors (4.3%)
Building and grounds cleaning and maintenance occupations (4.3%)
Other management occupations, except farmers and farm managers (4.1%)
Driver/sales workers and truck drivers (3.8%)
Cooks and food preparation workers (3.4%)
Other office and administrative support workers, including supervisors (9.2%)
Secretaries and administrative assistants (7.6%)
Information and record clerks, except customer service representatives (5.3%)
Preschool, kindergarten, elementary, and middle school teachers (4.7%)
Other management occupations, except farmers and farm managers (3.5%)
Registered nurses (3.3%)
Child care workers (3.3%)
Earthquake activity:
Lacey-area historical earthquake activity is significantly above Washington state average. It is 1383% greater than the overall U.S. average. On 4/13/1949 at 19:55:42, a magnitude 7.0 (7.0 UK, Class: Major, Intensity: VIII - XII) earthquake occurred 21.2 miles away from Lacey center, causing $80,000,000 total damage On 2/28/2001 at 18:54:32, a magnitude 6.8 (6.8 MD, Depth: 32.2 mi, Class: Strong, Intensity: VII - IX) earthquake occurred 9.3 miles away from Lacey center On 2/28/2001 at 18:54:32, a magnitude 6.8 (6.5 MB, 6.6 MS, 6.8 MW) earthquake occurred 11.6 miles away from Lacey center, causing $2,000,000,000 total damage and $305,000,000 insured lossesOn 4/29/1965 at 15:28:43, a magnitude 6.6 (6.6 UK) earthquake occurred 30.0 miles away from Lacey center, causing $28,000,000 total damage On 7/3/1999 at 01:43:54, a magnitude 5.8 (5.4 MB, 5.5 MS, 5.8 MW, 5.3 ME, Depth: 25.2 mi, Class: Moderate, Intensity: VI - VII) earthquake occurred 20.3 miles away from the city center On 1/31/1922 at 13:17:28, a magnitude 7.6 (7.6 UK) earthquake occurred 458.4 miles away from Lacey center Magnitude types: body-wave magnitude (MB), duration magnitude (MD), energy magnitude (ME), surface-wave magnitude (MS), moment magnitude (MW) Natural disasters: The number of natural disasters in Thurston County (25) is a lot greater than the US average (15).Major Disasters (Presidential) Declared: 23Emergencies Declared: 1Floods: 17, Storms: 14, Mudslides: 8, Landslides: 7, Winter Storms: 5, Earthquakes: 2, Snows: 2, Winds: 2, Heavy Rain: 1, Hurricane: 1, Volcanic Eruption: 1, Other: 1 (Note: some incidents may be assigned to more than one category). Main business address for: VENTURE FINANCIAL GROUP INC STATE COMMERCIAL BANKS ).
Hospitals and medical centers in Lacey: MOTHER JOSEPH CARE CENTER (3333 ENSIGN ROAD NE)
PANORAMA CITY CONV AND REHAB CTR (1600 SLEATER KINNEY ROAD SE)
ROO-LAN HEALTHCARE CENTER (1505 SOUTHEAST CARPENTER ROAD)
Amtrak station near Lacey: 3 miles: OLYMPIA/LACEY (OLYMPIA, 6600 YELM HWY. S.E.) Services: fully wheelchair accessible, enclosed waiting area, public restrooms, public payphones, vending machines, free short-term parking, free long-term parking, call for car rental service, call for taxi service, public transit connection.
College/University in Lacey: Saint Martin's University Full-time enrollment: 1,567; Location: 5000 Abbey Way SE; Private, not-for-profit; Website: www.stmartin.edu; Offers Master's degree )
Colleges/universities with over 2000 students nearest to Lacey:
South Puget Sound Community College (about 6 miles; Olympia, WA ; Full-time enrollment: 3,981)
The Evergreen State College (about 9 miles; Olympia, WA ; FT enrollment: 4,613)
Pierce College at Fort Steilacoom (about 16 miles; Lakewood, WA ; FT enrollment: 5,228)
Clover Park Technical College (about 18 miles; Lakewood, WA ; FT enrollment: 4,185)
Pacific Lutheran University (about 19 miles; Tacoma, WA ; FT enrollment: 3,548)
Tacoma Community College (about 21 miles; Tacoma, WA ; FT enrollment: 6,622)
University of Puget Sound (about 23 miles; Tacoma, WA ; FT enrollment: 2,788)
Public high schools in Lacey:
Private high schools in Lacey: COMMUNITY CHRISTIAN ACADEMY/NORTHWEST CHRISTIAN HS Students: 392, Location: 4710 PARK CENTER AVE NE, Grades: PK-12)
POPE JOHN PAUL II HIGH SCHOOL Students: 42, Location: 5608 PACIFIC AVE SE, Grades: 9-11)
TEMPLE BAPTIST ACADEMY Students: 12, Location: 3806 COLLEGE ST SE, Grades: KG-11)
Biggest public elementary/middle schools in Lacey: HORIZONS ELEMENTARY Location: 4601 67TH AVE SE, Grades: KG-6)
KOMACHIN MIDDLE SCHOOL Location: 3650 COLLEGE ST SE, Grades: 7-8)CHINOOK MIDDLE SCHOOL Location: 4301 6TH AVE NE, Grades: 6-8)
EVERGREEN FOREST ELEMENTARY Location: 3025 MARVIN RD SE, Grades: PK-6)LACEY ELEMENTARY Location: 1800 HOMANN DR SE, Grades: KG-6)LAKES ELEMENTARY SCHOOL Location: 6211 MULLEN RD SE, Grades: PK-6)LYDIA HAWK ELEMENTARY Location: 7600 5TH AVE SE, Grades: PK-6)MOUNTAIN VIEW ELEMENTARY Location: 1900 COLLEGE ST SE, Grades: PK-6)NISQUALLY MIDDLE SCHOOL Location: 8100 STEILACOOM RD SE, Grades: 7-8)OLYMPIC VIEW ELEMENTARY Location: 1330 HORNE AVE NE, Grades: KG-6)Private elementary/middle schools in Lacey: FAITH LUTHERAN SCHOOL Students: 185, Location: 7075 PACIFIC AVE SE, Grades: PK-6)
HOLY FAMILY SCHOOL Students: 66, Location: 2606 CARPENTER RD SE, Grades: PK-8)
See full list of schools located in Lacey
Notable locations in Lacey: (A) , Pacific Plaza (B) , Market Square (C) , South Sound Pavilion (D) , South Sound Center (E) , Thurston County Fire District 3 Lacey Fire District 3 Station 35 (F) , Olympic Ambulance Lacey Branch (G) , Thurston County Fire District 3 Lacey Fire District 3 Headquarters (H) , Lacey Fire Department (I) . Display/hide their locations on the map
Shopping Centers: (1) , Hawks Prairie Mall (2) . Display/hide their locations on the map
Main business address in Lacey: (A) . Display/hide its location on the map
Churches in Lacey include: (A) , Paramount Christian Church (B) , Sacred Heart Catholic Church (C) , Saint Benedict Episcopal Church (D) , Temple Baptist Church (E) , Christ the Servant Lutheran Church (F) , Christian Life Church (G) , First Baptist Church of Lacey (H) , Hispanic Ministries Open Bible (I) . Display/hide their locations on the map
Lakes: (A) , Southwick Lake (B) , Hicks Lake (C) . Display/hide their locations on the map
Tourist attractions: (1) , Ground Zero (Arcades & Amusements; 3011 Carpenter Loop Southeast) (2) . Display/hide their approximate locations on the map
Hotel: (1) . Display/hide its approximate location on the map
Thurston County has a predicted average indoor radon screening level less than 2 pCi/L (pico curies per liter) - Low Potential Drinking water stations with addresses in Lacey and their reported violations in the past:
COLONIAL MANOR (Population served: 25, Groundwater):
Past monitoring violations:
Follow-up Or Routine LCR Tap M/R - In JAN-01-2006, Contaminant: Lead and Copper Rule. Follow-up actions: St Compliance achieved (DEC-31-2006)
6 routine major monitoring violations
52 regular monitoring violations
Average household size: This city:
2.4 peopleWashington:
2.5 people
Percentage of family households: This city:
64.1%Whole state:
64.4%
Percentage of households with unmarried partners: This city:
7.3%Whole state:
7.7%
Likely homosexual households (counted as self-reported same-sex unmarried-partner households)
Lesbian couples: 0.6% of all households Gay men: 0.3% of all households
People in group quarters in Lacey in 2010:
456 people in college/university student housing
204 people in nursing facilities/skilled-nursing facilities
188 people in residential treatment centers for adults
90 people in group homes intended for adults
43 people in other noninstitutional facilities
14 people in workers' group living quarters and job corps centers
3 people in residential treatment centers for juveniles (non-correctional)
People in group quarters in Lacey in 2000:
297 people in nursing homes
106 people in college dormitories (includes college quarters off campus)
61 people in religious group quarters
6 people in other noninstitutional group quarters
Banks with most branches in Lacey (2011 data):
JPMorgan Chase Bank, National Association: Hawks Prairie Branch, Lacey Branch, Lacey Qfc Branch. Info updated 2011/11/10: Bank assets: $1,811,678.0 mil, Deposits: $1,190,738.0 mil, headquarters in Columbus, OH, positive income , International Specialization, 5577 total offices , Holding Company: Jpmorgan Chase & Co.
Sterling Savings Bank: Lacey Branch at 749 Sleater-Kinney Road, branch established on 1922/01/01; Panorama City Branch at 1751 Circle Lane Se, branch established on 1989/06/30. Info updated 2012/03/21: Bank assets: $9,207.8 mil, Deposits: $6,454.1 mil, headquarters in Spokane, WA, positive income , Commercial Lending Specialization, 192 total offices , Holding Company: Sterling Financial Corporation
West Coast Bank: Lacey Branch at 665 Woodland Square Loop, Southeast, branch established on 1989/02/01; Hawks Prairie Branch at 8140 Freedom Lane Bldg E Sutie A, branch established on 2006/07/31. Info updated 2010/09/16: Bank assets: $2,424.8 mil, Deposits: $1,925.6 mil, headquarters in Lake Oswego, OR, positive income , Commercial Lending Specialization, 63 total offices , Holding Company: West Coast Bancorp
Timberland Bank: Panorama City Branch at 150 Circle Drive, branch established on 1997/03/31; Lacey Branch at 1201 Marvin Road N.E., branch established on 1997/04/23. Info updated 2008/07/15: Bank assets: $731.3 mil, Deposits: $589.4 mil, headquarters in Hoquiam, WA, positive income , Commercial Lending Specialization, 22 total offices , Holding Company: Timberland Bancorp, Inc.
Olympia Federal Savings and Loan Association: 4310 6th Ave Se Branch at 4310 6th Ave Se, branch established on 1906/01/01; Yelm Highway Branch at 4860 Yelm Highway Southeast, branch established on 1996/06/30. Info updated 2011/07/21: Bank assets: $559.5 mil, Deposits: $472.7 mil, headquarters in Olympia, WA, positive income , Mortgage Lending Specialization, 7 total offices
Heritage Bank: Lacey Branch at 4400 Pacific Avenue, branch established on 1927/01/01; Indian Summer Branch at 5800 Rainier Loop Southeast, branch established on 1995/01/09. Info updated 2011/09/02: Bank assets: $1,202.8 mil, Deposits: $1,009.5 mil, headquarters in Olympia, WA, positive income , Commercial Lending Specialization, 28 total offices , Holding Company: Heritage Financial Corporation
U.S. Bank National Association: Lacey Branch at 5520 Martin Way East, branch established on 1994/01/03; Lacey Safeway at 4700 Yelm Highway Southeast, branch established on 2010/08/16. Info updated 2012/01/30: Bank assets: $330,470.8 mil, Deposits: $236,091.5 mil, headquarters in Cincinnati, OH, positive income , 3121 total offices , Holding Company: U.S. Bancorp
Bank of America, National Association: Lacey Branch at 601 Sleater-Kinney Road, branch established on 1967/11/15; Hawks Prairie Safeway Branch at 1243 Marvin Rd Ne, branch established on 1988/09/17. Info updated 2009/11/18: Bank assets: $1,451,969.3 mil, Deposits: $1,077,176.8 mil, headquarters in Charlotte, NC, positive income , 5782 total offices , Holding Company: Bank Of America Corporation
Wells Fargo Bank, National Association: Hawks Prairie Branch at 1419 Marvin Rd Ne, branch established on 2008/03/12; Lacey Branch at 1010 Sleater Kinney Road Southeast, branch established on 1991/01/28. Info updated 2011/04/05: Bank assets: $1,161,490.0 mil, Deposits: $905,653.0 mil, headquarters in Sioux Falls, SD, positive income , 6395 total offices , Holding Company: Wells Fargo & Company
6 other banks with 6 local branches
For population 15 years and over in Lacey:
Never married: 29.8%Now married: 50.5%Separated: 1.4%Widowed: 6.1%Divorced: 12.1% For population 25 years and over in Lacey:
High school or higher: 93.2%Bachelor's degree or higher: 32.1%Graduate or professional degree: 11.5%Unemployed: 6.6%Mean travel time to work (commute): 19.4 minutes
Education Gini index (Inequality in education) Here:
10.1Washington average:
11.6
Religion statistics for Lacey, WA (based on Thurston County data)
Religion Adherents Congregations Evangelical Protestant 28,471 116 Catholic 18,526 8 Other 15,334 50 Mainline Protestant 10,497 31 Orthodox 110 1 None 179,326 -
Source: Clifford Grammich, Kirk Hadaway, Richard Houseal, Dale E.Jones, Alexei Krindatch, Richie Stanley and Richard H.Taylor. 2012. 2010 U.S.Religion Census: Religious Congregations & Membership Study. Association of Statisticians of American Religious Bodies. Jones, Dale E., et al. 2002. Congregations and Membership in the United States 2000. Nashville, TN: Glenmary Research Center. Graphs represent county-level data
Food Environment Statistics: Number of grocery stores : 41Thurston County :
1.72 / 10,000 pop.Washington :
2.06 / 10,000 pop.
Number of supercenters and club stores : 4This county :
0.17 / 10,000 pop.Washington :
0.19 / 10,000 pop.
Number of convenience stores (no gas) : 28Thurston County :
1.18 / 10,000 pop.Washington :
1.18 / 10,000 pop.
Number of convenience stores (with gas) : 70Here :
2.94 / 10,000 pop.Washington :
2.67 / 10,000 pop.
Number of full-service restaurants : 166This county :
6.97 / 10,000 pop.Washington :
8.26 / 10,000 pop.
Adult diabetes rate : Thurston County :
7.7%State :
7.7%
Adult obesity rate : Thurston County :
26.9%State :
25.7%
Low-income preschool obesity rate : Thurston County :
13.5%Washington :
13.9%
Health and Nutrition: Healthy diet rate : This city:
51.5%State:
49.9%
Average overall health of teeth and gums : Average BMI : Lacey:
28.2Washington:
28.4
People feeling badly about themselves : Here:
20.0%Washington:
20.9%
People not drinking alcohol at all : Here:
11.3%Washington:
10.5%
Average hours sleeping at night : General health condition : Lacey:
58.2%Washington:
56.8%
Average condition of hearing : Lacey:
80.2%Washington:
79.4%
More about Health and Nutrition of Lacey, WA Residents
Local government employment and payroll (March 2022)
Function
Full-time employees
Monthly full-time payroll
Average yearly full-time wage
Part-time employees
Monthly part-time payroll
Police Protection - Officers
57 $571,530 $120,322 0 $0 Streets and Highways
45 $326,904 $87,174 0 $0 Parks and Recreation
35 $223,043 $76,472 31 $28,718 Water Supply
26 $180,527 $83,320 0 $0 Financial Administration
25 $179,177 $86,005 0 $0 Other Government Administration
19 $159,488 $100,729 7 $12,065 Sewerage
15 $100,509 $80,407 0 $0 Natural Resources
15 $117,198 $93,758 2 $2,393 Health
14 $54,553 $46,760 0 $0 Other and Unallocable
14 $99,166 $84,999 0 $0 Police - Other
12 $87,544 $87,544 1 $1,159 Housing and Community Development (Local)
12 $100,751 $100,751 0 $0
Totals for Government
289 $2,200,389 $91,366 41 $44,334
Lacey government finances - Expenditure in 2021 (per resident):
Construction - Regular Highways: $6,484,000 ($110.74)
General - Other: $1,798,000 ($30.71)Natural Resources - Other: $802,000 ($13.70)Police Protection: $525,000 ($8.97)Parks and Recreation: $445,000 ($7.60)General Public Buildings: $1,000 ($0.02)Current Operations - Sewerage: $19,857,000 ($339.13)
Water Utilities: $12,214,000 ($208.60)Police Protection: $11,305,000 ($193.08)General - Other: $8,211,000 ($140.23)Parks and Recreation: $5,438,000 ($92.87)Regular Highways: $3,257,000 ($55.63)Central Staff Services: $3,101,000 ($52.96)General Public Buildings: $1,963,000 ($33.53)Financial Administration: $1,549,000 ($26.46)Natural Resources - Other: $1,527,000 ($26.08)Judicial and Legal Services: $1,373,000 ($23.45)Protective Inspection and Regulation - Other: $1,225,000 ($20.92)Correctional Institutions: $508,000 ($8.68)Public Welfare - Other: $367,000 ($6.27)Health - Other: $311,000 ($5.31)Libraries: $47,000 ($0.80)General - Interest on Debt: $382,000 ($6.52)
Intergovernmental to Local - Other - General - Other: $2,433,000 ($41.55)
Other Capital Outlay - Water Utilities: $2,548,000 ($43.52)
Public Welfare - Other: $1,761,000 ($30.08)Natural Resources - Other: $173,000 ($2.95)Sewerage: $55,000 ($0.94)General - Other: $51,000 ($0.87)Regular Highways: $7,000 ($0.12)Total Salaries and Wages: $26,052,000 ($444.94)
Water Utilities - Interest on Debt: $188,000 ($3.21)
Lacey government finances - Revenue in 2021 (per resident):
Charges - Sewerage: $24,438,000 ($417.37)
Other: $7,740,000 ($132.19)Regular Highways: $424,000 ($7.24)Parks and Recreation: $406,000 ($6.93)Federal Intergovernmental - Other: $3,000 ($0.05)
Local Intergovernmental - Other: $2,806,000 ($47.92)
Miscellaneous - Interest Earnings: $2,894,000 ($49.43)
Special Assessments: $936,000 ($15.99)Donations From Private Sources: $452,000 ($7.72)General Revenue - Other: $264,000 ($4.51)Sale of Property: $179,000 ($3.06)Fines and Forfeits: $171,000 ($2.92)Rents: $124,000 ($2.12)Revenue - Water Utilities: $19,410,000 ($331.50)
State Intergovernmental - Other: $6,184,000 ($105.62)
Highways: $1,363,000 ($23.28)General Local Government Support: $751,000 ($12.83)Health and Hospitals: $78,000 ($1.33)Housing and Community Development: $10,000 ($0.17)Tax - General Sales and Gross Receipts: $18,122,000 ($309.50)
Property: $8,178,000 ($139.67)Public Utilities Sales: $8,136,000 ($138.95)Documentary and Stock Transfer: $3,611,000 ($61.67)Occupation and Business License - Other: $2,514,000 ($42.94)Other License: $1,765,000 ($30.14)Other Selective Sales: $359,000 ($6.13)Amusements Sales: $159,000 ($2.72)
Lacey government finances - Debt in 2021 (per resident):
Long Term Debt - Beginning Outstanding - Unspecified Public Purpose: $28,072,000 ($479.44)
Outstanding Unspecified Public Purpose: $27,369,000 ($467.43)Retired Unspecified Public Purpose: $10,301,000 ($175.93)Issue, Unspecified Public Purpose: $9,598,000 ($163.92)
9.25% of this county's 2021 resident taxpayers lived in other counties in 2020 ($63,260 average adjusted gross income )
Here:
9.25%Washington average:
7.53%
0.16% of residents moved from foreign countries ($1,052 average AGI )Thurston County:
0.16%Washington average:
0.05%
Top counties from which taxpayers relocated into this county between 2020 and 2021:
8.63% of this county's 2020 resident taxpayers moved to other counties in 2021 ($62,834 average adjusted gross income )
Here:
8.63%Washington average:
7.40%
0.10% of residents moved to foreign countries ($792 average AGI )Thurston County:
0.10%Washington average:
0.04%
Top counties to which taxpayers relocated from this county between 2020 and 2021:
Businesses in Lacey, WA
Name Count Name Count
7-Eleven 1 La Quinta 1 AT&T 1 Little Caesars Pizza 1 Albertsons 1 Long John Silver's 1 Applebee's 1 Lowe's 1 Arby's 1 Marshalls 1 AutoZone 2 MasterBrand Cabinets 2 Baskin-Robbins 1 McDonald's 4 Best Western 1 Nike 1 Blockbuster 1 Office Depot 1 Burger King 2 OfficeMax 1 Carl\s Jr. 1 Panda Express 1 Circle K 1 Panera Bread 1 Cold Stone Creamery 1 Papa John's Pizza 1 Comfort Inn 1 Payless 1 Costco 1 PetSmart 1 Curves 1 Pizza Hut 1 DHL 2 Quality 1 Decora Cabinetry 1 Quiznos 1 Dennys 1 RadioShack 2 Discount Tire 1 Rite Aid 3 Domino's Pizza 1 Sears 2 Famous Footwear 1 Sprint Nextel 1 FedEx 5 Starbucks 6 Firestone Complete Auto Care 1 Subway 5 GNC 3 Super 8 1 GameStop 1 T-Mobile 5 H&R Block 3 Taco Bell 2 Holiday Inn 2 Target 1 Home Depot 1 The Room Place 1 Jack In The Box 2 U-Haul 1 Jamba Juice 1 UPS 8 Jones New York 2 Verizon Wireless 1 KFC 2 Vons 2 Kmart 1 Walgreens 2 Kohl's 1 Walmart 1 Kroger 3 Wendy's 1 LA Fitness 1
Strongest AM radio stations in Lacey:
KGHO (920 AM; 5 kW; OLYMPIA, WA; Owner: SPENCER BROADCASTING, L.P.)
KLDY (1280 AM; 1 kW; LACEY, WA; Owner: SKIP MARROW)
KJR (950 AM; 50 kW; SEATTLE, WA)
KIRO (710 AM; 50 kW; SEATTLE, WA; Owner: ENTERCOM SEATTLE LICENSE, LLC)
KTTH (770 AM; 50 kW; SEATTLE, WA; Owner: ENTERCOM SEATTLE LICENSE, LLC)
KGNW (820 AM; 50 kW; BURIEN-SEATTLE, WA; Owner: INSPIRATION MEDIA, INC.)
KBRD (680 AM; daytime; 0 kW; LACEY, WA; Owner: SKIP MARROW)
KYCW (1090 AM; 50 kW; SEATTLE, WA; Owner: INFINITY RADIO SUBSIDIARY OPERATIONS INC.)
KOMO (1000 AM; 50 kW; SEATTLE, WA; Owner: FISHER BROADCASTING - SEATTLE RADIO, L.L.C.)
KGY (1240 AM; 1 kW; OLYMPIA, WA; Owner: KGY, INC.)
KMAS (1030 AM; 10 kW; SHELTON, WA; Owner: SOUND BROADCASTING, INC.)
KVSN (1340 AM; 1 kW; TUMWATER, WA; Owner: EVERGREEN BROADCASTING INCORPORATED)
KIXI (880 AM; 50 kW; MERCER ISLAND/SEATTL, WA; Owner: BELLEVUE RADIO, INC.)
Strongest FM radio stations in Lacey:
K281AD (104.1 FM; OLYMPIA, WA; Owner: ENTERCOM SEATTLE LICENSE, LLC)
K211CA (90.1 FM; OLYMPIA, WA; Owner: FAMILY STATIONS, INC.)
KAYO-FM1 (99.3 FM; OLYMPIA, WA; Owner: BLACK HILLS BROADCASTING, L.P.)
K254AP (98.7 FM; OLYMPIA, WA; Owner: CALVARY CHAPEL OF TWIN FALLS, INC.)
KFMY (97.7 FM; RAYMOND, WA; Owner: SOUTH SOUND BROADCASTING, LLC)
KGY-FM (96.9 FM; MCCLEARY, WA; Owner: KGY, INC.)
KRXY (94.5 FM; SHELTON, WA; Owner: PREMIER BROADCASTERS, INC.)
KXXO (96.1 FM; OLYMPIA, WA; Owner: 3 CITIES, INC.)
KMNT (102.9 FM; CENTRALIA, WA; Owner: CITICASTERS LICENSES, L.P.)
KAYO-FM (99.3 FM; ELMA, WA; Owner: SOUTH SOUND BROADCASTING, LLC)
KQBZ (100.7 FM; SEATTLE, WA; Owner: ENTERCOM SEATTLE LICENSE, LLC)
KBSG-FM (97.3 FM; TACOMA, WA; Owner: ENTERCOM SEATTLE LICENSE, LLC)
KAOS (89.3 FM; OLYMPIA, WA; Owner: THE EVERGREEN STATE COLLEGE)
KMTT (103.7 FM; TACOMA, WA; Owner: ENTERCOM SEATTLE LICENSE, LLC)
KNDD (107.7 FM; SEATTLE, WA; Owner: ENTERCOM SEATTLE LICENSE, LLC)
KYPT (96.5 FM; SEATTLE, WA; Owner: INFINITY RADIO SUBSIDIARY OPERATIONS INC.)
KBKS (106.1 FM; TACOMA, WA; Owner: INFINITY RADIO SUBSIDIARY OPERATIONS INC.)
KING-FM (98.1 FM; SEATTLE, WA; Owner: CLASSIC RADIO, INC.)
KLSY-FM (92.5 FM; BELLEVUE, WA; Owner: BELLEVUE RADIO INC.)
KPLU-FM (88.5 FM; TACOMA, WA; Owner: PACIFIC LUTHERAN UNIVERSITY, INC.)
TV broadcast stations around Lacey:
KCPQ (Channel 13; TACOMA, WA; Owner: TRIBUNE TELEVISION NORTHWEST, INC.)
KBTC-TV (Channel 28; TACOMA, WA; Owner: BATES TECHNICAL COLLEGE)
National Bridge Inventory (NBI) Statistics 35 Number of bridges433ft / 132m Total length $98,638,000 Total costs1,075,937 Total average daily traffic117,850 Total average daily truck traffic
New bridges - historical statistics
1 1920-1929 1 1930-1939 2 1950-1959 17 1960-1969 4 1980-1989 2 1990-1999 6 2000-2009 2 2010-2019
See full National Bridge Inventory statistics for Lacey, WA
Home Mortgage Disclosure Act Aggregated Statistics For Year 2009(Based on 1 full and 8 partial tracts) A) FHA, FSA/RHS & VA B) Conventional C) Refinancings D) Home Improvement Loans F) Non-occupant Loans on G) Loans On Manufactured Number Average Value Number Average Value Number Average Value Number Average Value Number Average Value Number Average Value
LOANS ORIGINATED 260 $229,670 117 $186,691 917 $200,236 39 $82,431 79 $160,690 13 $123,394 APPLICATIONS APPROVED, NOT ACCEPTED 16 $219,747 13 $177,622 79 $205,696 10 $25,598 9 $171,204 4 $84,965 APPLICATIONS DENIED 28 $232,738 21 $174,617 194 $211,704 16 $66,802 16 $159,566 11 $81,119 APPLICATIONS WITHDRAWN 24 $216,756 13 $168,175 190 $215,056 5 $146,542 16 $157,196 5 $104,828 FILES CLOSED FOR INCOMPLETENESS 9 $213,999 6 $194,443 60 $194,645 2 $147,180 4 $180,320 2 $135,065
Aggregated Statistics For Year 2008(Based on 1 full and 8 partial tracts) A) FHA, FSA/RHS & VA B) Conventional C) Refinancings D) Home Improvement Loans E) Loans on Dwellings For 5+ Families F) Non-occupant Loans on G) Loans On Manufactured Number Average Value Number Average Value Number Average Value Number Average Value Number Average Value Number Average Value Number Average Value
LOANS ORIGINATED 223 $242,628 191 $208,132 515 $197,143 62 $60,197 10 $1,132,614 97 $183,996 30 $128,332 APPLICATIONS APPROVED, NOT ACCEPTED 16 $233,190 24 $168,676 80 $197,134 11 $61,073 0 $0 11 $174,316 5 $86,350 APPLICATIONS DENIED 21 $222,905 43 $197,408 275 $208,207 63 $82,700 0 $0 31 $191,400 10 $90,220 APPLICATIONS WITHDRAWN 16 $242,762 29 $210,807 160 $207,760 21 $162,967 1 $363,000 19 $191,313 8 $110,862 FILES CLOSED FOR INCOMPLETENESS 4 $218,608 5 $254,594 22 $191,456 3 $94,680 0 $0 2 $148,770 1 $78,100
Aggregated Statistics For Year 2007(Based on 1 full and 8 partial tracts) A) FHA, FSA/RHS & VA B) Conventional C) Refinancings D) Home Improvement Loans E) Loans on Dwellings For 5+ Families F) Non-occupant Loans on G) Loans On Manufactured Number Average Value Number Average Value Number Average Value Number Average Value Number Average Value Number Average Value Number Average Value
LOANS ORIGINATED 131 $251,183 511 $191,297 668 $178,332 122 $76,177 2 $2,581,840 171 $166,863 27 $98,997 APPLICATIONS APPROVED, NOT ACCEPTED 10 $246,649 57 $200,735 113 $188,077 18 $73,016 1 $274,270 18 $163,579 5 $87,126 APPLICATIONS DENIED 17 $242,927 94 $156,684 322 $186,847 81 $102,519 0 $0 49 $169,979 20 $61,231 APPLICATIONS WITHDRAWN 14 $251,232 56 $222,383 210 $183,894 37 $98,961 0 $0 20 $193,577 6 $127,045 FILES CLOSED FOR INCOMPLETENESS 3 $252,877 10 $218,836 59 $202,997 5 $103,962 0 $0 3 $189,827 2 $166,055
Aggregated Statistics For Year 2006(Based on 1 full and 8 partial tracts) A) FHA, FSA/RHS & VA B) Conventional C) Refinancings D) Home Improvement Loans E) Loans on Dwellings For 5+ Families F) Non-occupant Loans on G) Loans On Manufactured Number Average Value Number Average Value Number Average Value Number Average Value Number Average Value Number Average Value Number Average Value
LOANS ORIGINATED 117 $238,770 791 $156,501 735 $160,246 105 $79,145 3 $648,540 208 $153,501 35 $116,755 APPLICATIONS APPROVED, NOT ACCEPTED 10 $242,489 98 $157,983 128 $159,627 10 $82,486 0 $0 25 $168,317 8 $80,225 APPLICATIONS DENIED 11 $242,515 157 $163,760 308 $173,730 62 $111,348 0 $0 44 $185,813 27 $120,902 APPLICATIONS WITHDRAWN 11 $241,795 79 $162,799 312 $168,581 35 $103,856 0 $0 24 $159,290 7 $106,984 FILES CLOSED FOR INCOMPLETENESS 2 $172,955 13 $154,627 61 $173,855 6 $122,432 0 $0 4 $125,170 0 $0
Aggregated Statistics For Year 2005(Based on 1 full and 8 partial tracts) A) FHA, FSA/RHS & VA B) Conventional C) Refinancings D) Home Improvement Loans E) Loans on Dwellings For 5+ Families F) Non-occupant Loans on G) Loans On Manufactured Number Average Value Number Average Value Number Average Value Number Average Value Number Average Value Number Average Value Number Average Value
LOANS ORIGINATED 88 $211,980 758 $142,870 881 $148,886 93 $77,977 5 $2,496,632 254 $147,004 23 $112,260 APPLICATIONS APPROVED, NOT ACCEPTED 9 $185,662 79 $134,859 120 $147,942 15 $72,713 1 $404,000 21 $156,834 9 $118,176 APPLICATIONS DENIED 9 $182,913 129 $118,482 353 $159,287 66 $74,037 0 $0 31 $129,395 31 $106,055 APPLICATIONS WITHDRAWN 6 $197,318 75 $154,168 318 $159,101 30 $111,506 0 $0 33 $148,397 6 $125,420 FILES CLOSED FOR INCOMPLETENESS 1 $105,090 20 $134,776 103 $165,387 4 $54,475 0 $0 3 $119,610 4 $113,595
Aggregated Statistics For Year 2004(Based on 1 full and 8 partial tracts) A) FHA, FSA/RHS & VA B) Conventional C) Refinancings D) Home Improvement Loans E) Loans on Dwellings For 5+ Families F) Non-occupant Loans on G) Loans On Manufactured Number Average Value Number Average Value Number Average Value Number Average Value Number Average Value Number Average Value Number Average Value
LOANS ORIGINATED 89 $175,519 668 $125,329 882 $132,594 69 $55,155 5 $1,631,552 248 $134,537 21 $94,333 APPLICATIONS APPROVED, NOT ACCEPTED 5 $176,030 84 $133,505 129 $135,477 15 $48,516 0 $0 22 $162,127 10 $58,086 APPLICATIONS DENIED 13 $161,125 109 $120,443 328 $133,818 55 $46,930 0 $0 31 $158,155 31 $97,197 APPLICATIONS WITHDRAWN 5 $164,696 67 $125,482 284 $137,446 26 $61,042 0 $0 19 $131,834 6 $79,513 FILES CLOSED FOR INCOMPLETENESS 1 $161,920 19 $157,936 78 $147,972 6 $43,092 0 $0 6 $164,838 1 $156,820
Aggregated Statistics For Year 2003(Based on 1 full and 8 partial tracts) A) FHA, FSA/RHS & VA B) Conventional C) Refinancings D) Home Improvement Loans E) Loans on Dwellings For 5+ Families F) Non-occupant Loans on Number Average Value Number Average Value Number Average Value Number Average Value Number Average Value Number Average Value
LOANS ORIGINATED 147 $154,142 447 $124,797 1,838 $121,271 73 $25,549 5 $761,326 334 $114,098 APPLICATIONS APPROVED, NOT ACCEPTED 11 $150,273 72 $115,893 207 $119,883 16 $21,649 0 $0 29 $108,421 APPLICATIONS DENIED 14 $165,041 94 $101,614 335 $128,798 43 $25,208 1 $506,970 45 $121,457 APPLICATIONS WITHDRAWN 13 $133,909 45 $113,583 286 $129,667 5 $55,796 0 $0 22 $122,231 FILES CLOSED FOR INCOMPLETENESS 2 $160,375 9 $128,052 53 $124,051 3 $26,427 0 $0 7 $105,300
Aggregated Statistics For Year 2002(Based on 6 partial tracts) A) FHA, FSA/RHS & VA B) Conventional C) Refinancings D) Home Improvement Loans E) Loans on Dwellings For 5+ Families F) Non-occupant Loans on Number Average Value Number Average Value Number Average Value Number Average Value Number Average Value Number Average Value
LOANS ORIGINATED 89 $140,127 183 $115,329 546 $121,845 24 $21,325 2 $813,645 97 $101,339 APPLICATIONS APPROVED, NOT ACCEPTED 10 $133,212 33 $111,884 58 $115,458 8 $15,440 0 $0 11 $108,875 APPLICATIONS DENIED 6 $137,047 61 $92,148 130 $112,459 17 $19,329 1 $147,050 15 $113,191 APPLICATIONS WITHDRAWN 6 $123,810 19 $107,141 100 $124,476 6 $32,790 0 $0 9 $102,150 FILES CLOSED FOR INCOMPLETENESS 0 $0 4 $109,200 21 $109,453 1 $18,520 0 $0 4 $90,460
Aggregated Statistics For Year 2001(Based on 6 partial tracts) A) FHA, FSA/RHS & VA B) Conventional C) Refinancings D) Home Improvement Loans F) Non-occupant Loans on Number Average Value Number Average Value Number Average Value Number Average Value Number Average Value
LOANS ORIGINATED 100 $130,476 186 $112,771 390 $119,994 30 $23,149 67 $107,799 APPLICATIONS APPROVED, NOT ACCEPTED 7 $127,291 37 $89,033 50 $105,837 7 $24,196 2 $129,865 APPLICATIONS DENIED 5 $132,032 53 $80,915 118 $100,212 19 $19,515 7 $170,349 APPLICATIONS WITHDRAWN 9 $132,337 24 $110,468 69 $113,106 5 $43,494 6 $114,497 FILES CLOSED FOR INCOMPLETENESS 0 $0 3 $72,987 19 $98,159 1 $60,830 1 $78,030
Aggregated Statistics For Year 2000(Based on 6 partial tracts) A) FHA, FSA/RHS & VA B) Conventional C) Refinancings D) Home Improvement Loans E) Loans on Dwellings For 5+ Families F) Non-occupant Loans on Number Average Value Number Average Value Number Average Value Number Average Value Number Average Value Number Average Value
LOANS ORIGINATED 75 $128,903 154 $104,392 87 $99,608 41 $24,641 3 $1,208,143 28 $105,419 APPLICATIONS APPROVED, NOT ACCEPTED 8 $109,960 29 $85,333 20 $86,736 17 $18,223 0 $0 5 $65,402 APPLICATIONS DENIED 16 $96,088 57 $71,147 80 $82,660 28 $25,250 0 $0 7 $113,336 APPLICATIONS WITHDRAWN 10 $114,827 18 $103,960 31 $96,335 4 $57,215 1 $111,520 1 $138,930 FILES CLOSED FOR INCOMPLETENESS 1 $69,850 3 $84,327 18 $97,894 0 $0 0 $0 2 $58,600
Aggregated Statistics For Year 1999(Based on 7 partial tracts) A) FHA, FSA/RHS & VA B) Conventional C) Refinancings D) Home Improvement Loans E) Loans on Dwellings For 5+ Families F) Non-occupant Loans on Number Average Value Number Average Value Number Average Value Number Average Value Number Average Value Number Average Value
LOANS ORIGINATED 144 $122,505 271 $105,572 378 $96,471 70 $20,092 3 $1,877,923 77 $98,322 APPLICATIONS APPROVED, NOT ACCEPTED 5 $104,508 43 $87,836 68 $90,556 23 $15,404 1 $86,790 5 $63,802 APPLICATIONS DENIED 17 $120,516 108 $73,053 173 $100,006 46 $19,621 0 $0 21 $92,889 APPLICATIONS WITHDRAWN 8 $110,290 43 $108,323 125 $98,668 10 $39,618 0 $0 11 $106,868 FILES CLOSED FOR INCOMPLETENESS 3 $164,430 11 $100,916 51 $102,645 0 $0 0 $0 6 $89,280
Detailed mortgage data for all 9 tracts in Lacey, WA
Private Mortgage Insurance Companies Aggregated Statistics For Year 2009(Based on 1 full and 7 partial tracts) A) Conventional B) Refinancings C) Non-occupant Loans on Number Average Value Number Average Value Number Average Value
LOANS ORIGINATED 19 $240,793 16 $244,467 0 $0 APPLICATIONS APPROVED, NOT ACCEPTED 5 $261,204 10 $213,242 1 $260,930 APPLICATIONS DENIED 1 $140,100 4 $300,672 0 $0 APPLICATIONS WITHDRAWN 1 $159,320 3 $199,823 0 $0 FILES CLOSED FOR INCOMPLETENESS 0 $0 1 $139,540 0 $0
Aggregated Statistics For Year 2008(Based on 1 full and 8 partial tracts) A) Conventional B) Refinancings C) Non-occupant Loans on Number Average Value Number Average Value Number Average Value
LOANS ORIGINATED 65 $239,926 49 $230,576 8 $221,018 APPLICATIONS APPROVED, NOT ACCEPTED 27 $230,321 18 $235,110 4 $192,935 APPLICATIONS DENIED 3 $231,607 4 $219,422 3 $222,137 APPLICATIONS WITHDRAWN 5 $239,232 5 $288,326 2 $198,755 FILES CLOSED FOR INCOMPLETENESS 0 $0 0 $0 0 $0
Aggregated Statistics For Year 2007(Based on 1 full and 8 partial tracts) A) Conventional B) Refinancings C) Non-occupant Loans on D) Loans On Manufactured Number Average Value Number Average Value Number Average Value Number Average Value
LOANS ORIGINATED 133 $236,001 60 $234,105 11 $205,732 1 $138,040 APPLICATIONS APPROVED, NOT ACCEPTED 10 $245,203 10 $231,919 1 $180,000 0 $0 APPLICATIONS DENIED 1 $277,460 1 $322,860 1 $171,710 0 $0 APPLICATIONS WITHDRAWN 5 $278,540 9 $241,110 0 $0 0 $0 FILES CLOSED FOR INCOMPLETENESS 3 $248,633 3 $302,447 1 $155,960 0 $0
Aggregated Statistics For Year 2006(Based on 1 full and 8 partial tracts) A) Conventional B) Refinancings C) Non-occupant Loans on D) Loans On Manufactured Number Average Value Number Average Value Number Average Value Number Average Value
LOANS ORIGINATED 52 $219,922 26 $230,607 4 $183,610 1 $77,390 APPLICATIONS APPROVED, NOT ACCEPTED 7 $258,189 14 $206,804 2 $211,560 1 $75,580 APPLICATIONS DENIED 1 $150,850 3 $235,273 0 $0 0 $0 APPLICATIONS WITHDRAWN 1 $375,560 2 $218,210 0 $0 0 $0 FILES CLOSED FOR INCOMPLETENESS 1 $126,220 0 $0 0 $0 0 $0
Aggregated Statistics For Year 2005(Based on 1 full and 8 partial tracts) A) Conventional B) Refinancings C) Non-occupant Loans on D) Loans On Manufactured Number Average Value Number Average Value Number Average Value Number Average Value
LOANS ORIGINATED 67 $186,226 52 $178,227 12 $174,853 1 $83,700 APPLICATIONS APPROVED, NOT ACCEPTED 6 $179,227 5 $181,878 0 $0 0 $0 APPLICATIONS DENIED 0 $0 0 $0 0 $0 0 $0 APPLICATIONS WITHDRAWN 1 $221,830 3 $191,320 0 $0 0 $0 FILES CLOSED FOR INCOMPLETENESS 0 $0 0 $0 0 $0 0 $0
Aggregated Statistics For Year 2004(Based on 1 full and 8 partial tracts) A) Conventional B) Refinancings C) Non-occupant Loans on D) Loans On Manufactured Number Average Value Number Average Value Number Average Value Number Average Value
LOANS ORIGINATED 71 $162,787 51 $161,668 18 $133,221 2 $93,520 APPLICATIONS APPROVED, NOT ACCEPTED 12 $156,168 15 $147,775 5 $146,924 1 $90,870 APPLICATIONS DENIED 0 $0 1 $174,260 0 $0 0 $0 APPLICATIONS WITHDRAWN 2 $135,360 2 $189,415 1 $154,980 0 $0 FILES CLOSED FOR INCOMPLETENESS 0 $0 0 $0 0 $0 0 $0
Aggregated Statistics For Year 2003(Based on 1 full and 8 partial tracts) A) Conventional B) Refinancings C) Non-occupant Loans on Number Average Value Number Average Value Number Average Value
LOANS ORIGINATED 93 $145,734 151 $140,423 12 $131,786 APPLICATIONS APPROVED, NOT ACCEPTED 10 $173,665 36 $139,956 6 $131,338 APPLICATIONS DENIED 2 $113,635 3 $143,580 0 $0 APPLICATIONS WITHDRAWN 1 $192,740 7 $131,047 1 $138,820 FILES CLOSED FOR INCOMPLETENESS 0 $0 0 $0 0 $0
Aggregated Statistics For Year 2002(Based on 6 partial tracts) A) Conventional B) Refinancings C) Non-occupant Loans on Number Average Value Number Average Value Number Average Value
LOANS ORIGINATED 41 $137,642 59 $138,591 8 $113,375 APPLICATIONS APPROVED, NOT ACCEPTED 5 $163,904 17 $132,906 3 $108,140 APPLICATIONS DENIED 1 $165,070 3 $128,963 0 $0 APPLICATIONS WITHDRAWN 3 $164,020 1 $162,530 2 $116,330 FILES CLOSED FOR INCOMPLETENESS 0 $0 0 $0 0 $0
Aggregated Statistics For Year 2001(Based on 6 partial tracts) A) Conventional B) Refinancings C) Non-occupant Loans on Number Average Value Number Average Value Number Average Value
LOANS ORIGINATED 39 $129,192 46 $127,959 3 $125,293 APPLICATIONS APPROVED, NOT ACCEPTED 3 $140,580 7 $125,219 0 $0 APPLICATIONS DENIED 2 $105,060 4 $123,288 1 $100,780 APPLICATIONS WITHDRAWN 1 $107,700 1 $184,260 1 $82,220 FILES CLOSED FOR INCOMPLETENESS 0 $0 0 $0 0 $0
Aggregated Statistics For Year 2000(Based on 6 partial tracts) A) Conventional B) Refinancings C) Non-occupant Loans on Number Average Value Number Average Value Number Average Value
LOANS ORIGINATED 51 $125,106 8 $142,680 7 $85,703 APPLICATIONS APPROVED, NOT ACCEPTED 6 $93,408 2 $165,880 0 $0 APPLICATIONS DENIED 1 $162,920 1 $92,760 0 $0 APPLICATIONS WITHDRAWN 1 $85,650 0 $0 0 $0 FILES CLOSED FOR INCOMPLETENESS 1 $61,670 0 $0 0 $0
Aggregated Statistics For Year 1999(Based on 7 partial tracts) A) Conventional B) Refinancings C) Non-occupant Loans on Number Average Value Number Average Value Number Average Value
LOANS ORIGINATED 89 $132,256 50 $128,865 3 $184,377 APPLICATIONS APPROVED, NOT ACCEPTED 9 $118,873 8 $125,301 0 $0 APPLICATIONS DENIED 2 $161,995 5 $150,754 1 $211,700 APPLICATIONS WITHDRAWN 2 $149,405 4 $134,010 1 $149,430 FILES CLOSED FOR INCOMPLETENESS 0 $0 1 $188,760 0 $0
Fire-safe hotels and motels in Lacey, Washington:
Comfort Inn, 4700 Park Ctr Ave NE, Lacey, Washington 98516 Phone: (360) 456-6300, Fax: (360) 456-7423
Quality Inn & Suties, 120 College St SE, Lacey, Washington 98503 Phone: (360) 493-1991, Fax: (360) 493-1991
Candlewood Suites, 4440 3rd Ave SE, Lacey, Washington 98503 Phone: (360) 491-1698, Fax: (206) 441-9794
Holiday Inn Express Lacey, 4460 3rd Ave SE, Lacey, Washington 98503 Phone: (360) 491-7985, Fax: (360) 456-2893
All 4 fire-safe hotels and motels in Lacey, Washington
Most common first names in Lacey, WA among deceased individuals Name Count Lived (average)
Robert 149 73.3 years John 144 78.0 years William 132 75.6 years James 114 72.6 years Mary 103 80.3 years Dorothy 102 80.7 years Margaret 99 81.3 years George 92 80.1 years Ruth 76 82.7 years Donald 71 73.9 years
Most common last names in Lacey, WA among deceased individuals Last name Count Lived (average)
Johnson 75 76.6 years Smith 56 78.0 years Anderson 41 80.4 years Jones 36 75.5 years Miller 32 75.4 years Brown 28 76.9 years Adams 27 79.6 years Davis 26 74.3 years Wilson 25 72.7 years Williams 21 80.0 years
Lacey compared to Washington state average:
Unemployed percentage below state average. Black race population percentage significantly above state average. Foreign-born population percentage above state average. Length of stay since moving in significantly above state average. House age below state average. Number of college students above state average.
#71 on the list of "Top 101 cities with largest percentage of males in industries: public administration (population 5,000+)"
#83 on the list of "Top 101 cities with the most residents born in Cambodia (population 500+)"
#19 on the list of "Top 101 counties with the largest increase in the number of births per 1000 residents 2000-2006 to 2007-2013 (pop 50,000+)"
#31 on the list of "Top 101 counties with the highest percentage of residents that exercised in the past month"
#53 on the list of "Top 101 counties with highest percentage of residents voting for 3rd party candidates in the 2012 Presidential Election (pop. 50,000+)"
#63 on the list of "Top 101 counties with the highest percentage of residents relocating from foreign countries between 2010 and 2011 (pop. 50,000+)"
#69 on the list of "Top 101 counties with the highest average weight of females"
Top Patent Applicants
Mei-Feng Hong (6)
Thien Van Pham (6)
Bennett M. Butters (4)
George Clark (4)
Shelby Ferguson (3)
Darlene Hamilton (3)
Jonathon Robert Carstens (3)
Michael Lee Mattox (3)
Doan D. Pham (3)
Laura S. Mortimer (2)
Total of 68 patent applications in 2008-2024.
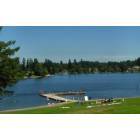
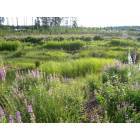
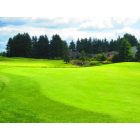
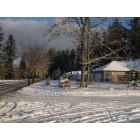
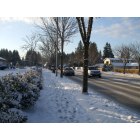
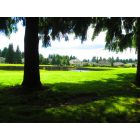


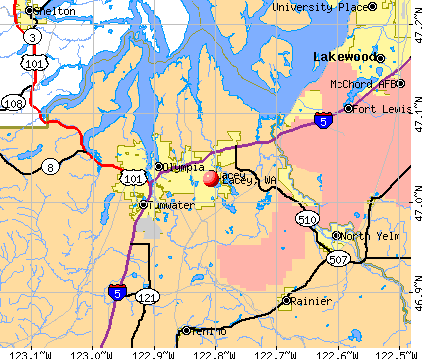


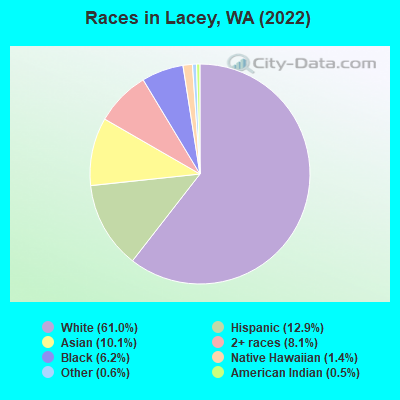
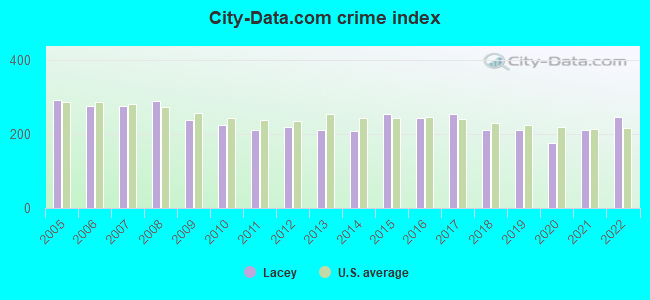
 Recent articles from our blog. Our writers, many of them Ph.D. graduates or candidates, create easy-to-read articles on a wide variety of topics.

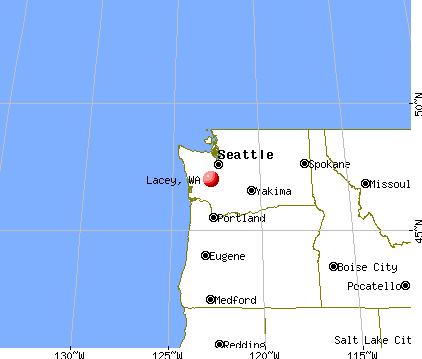
 (16.3 miles
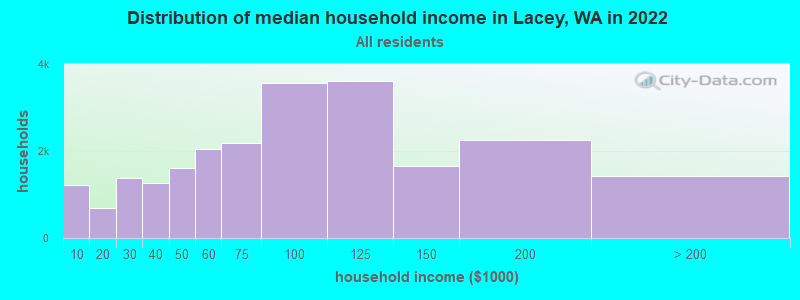
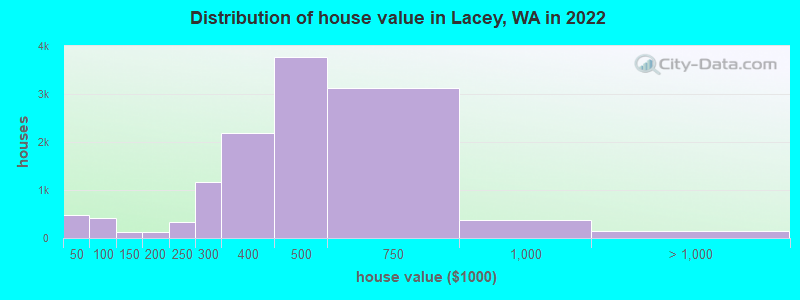

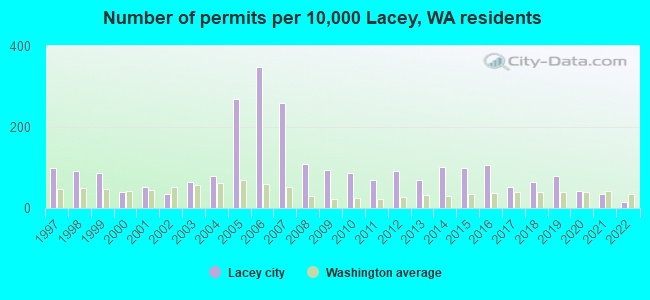
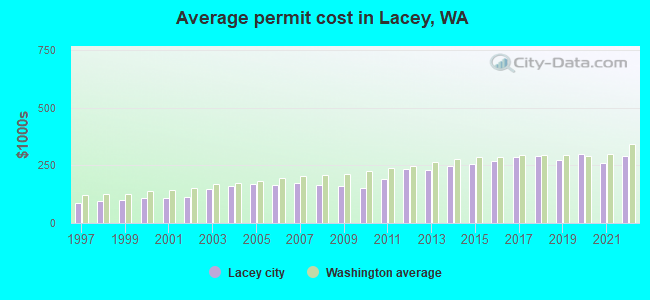
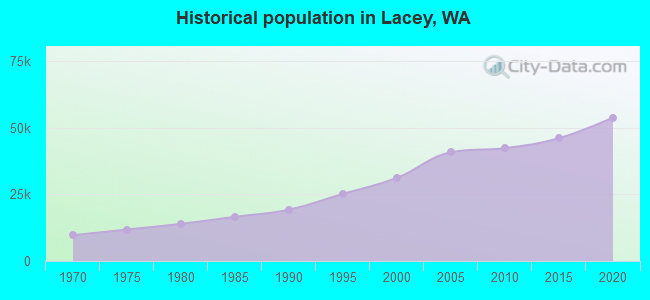
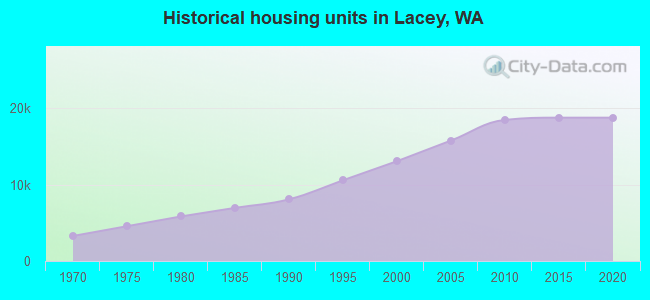
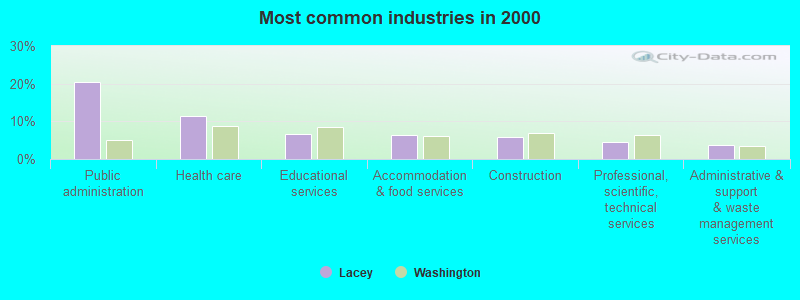
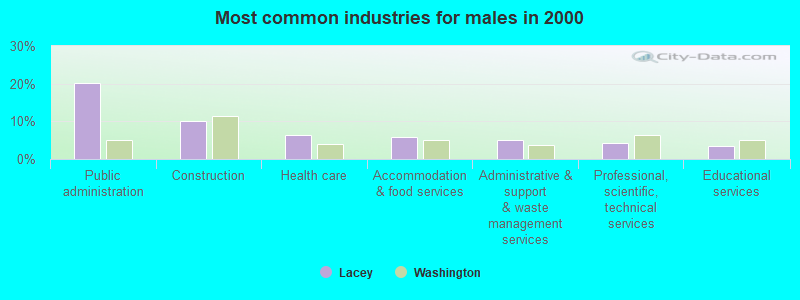
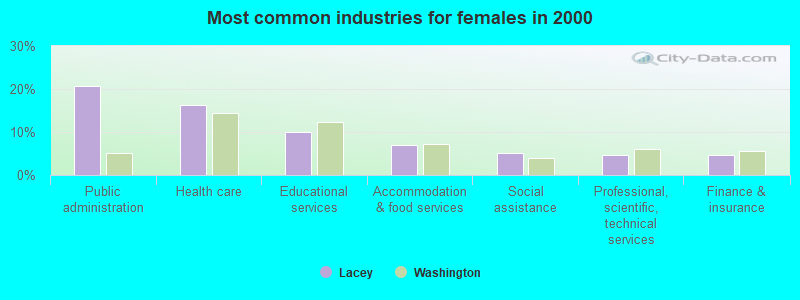
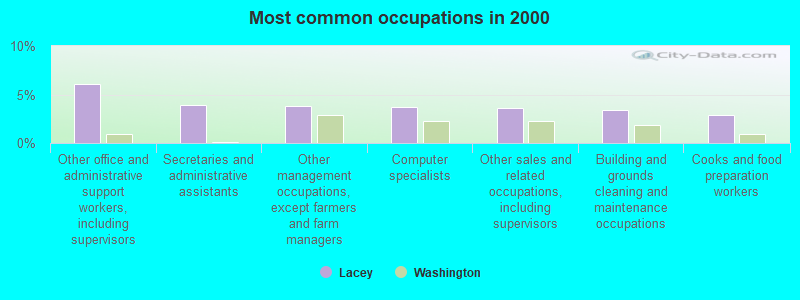
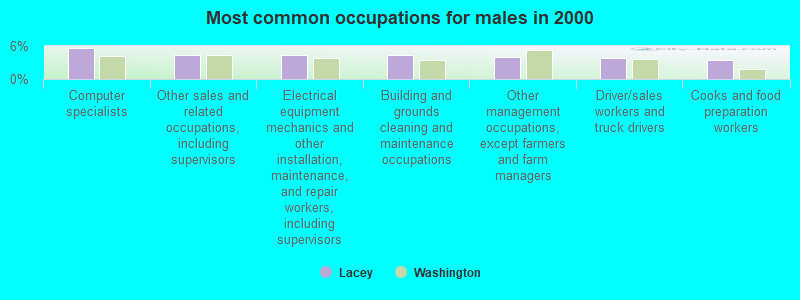
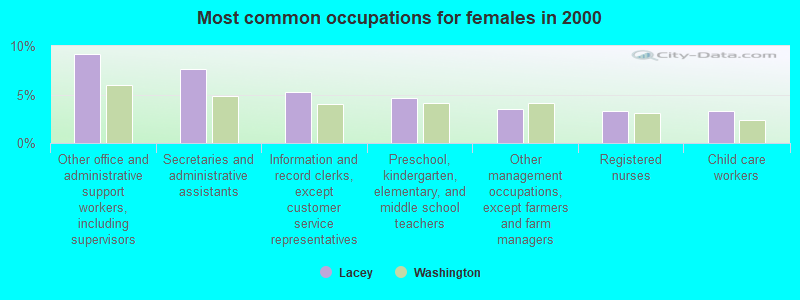
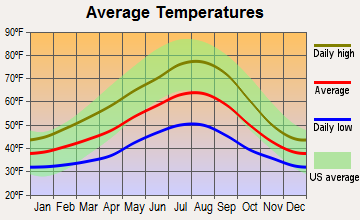
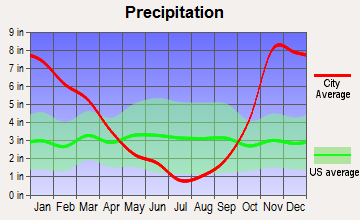
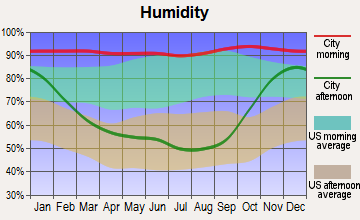
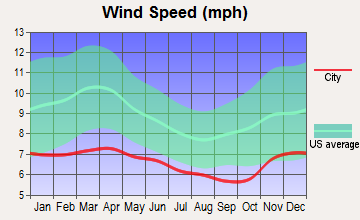
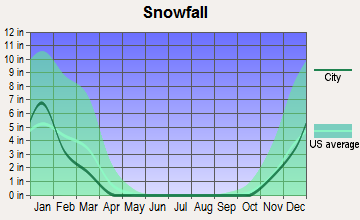
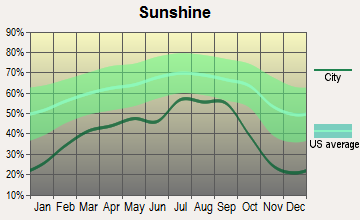
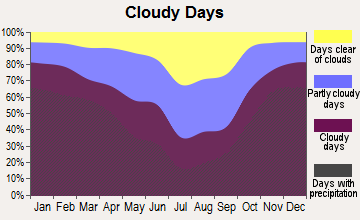


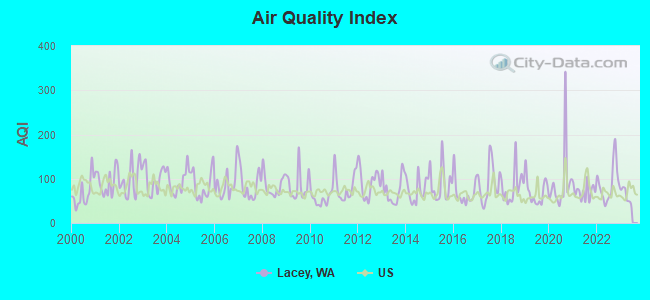
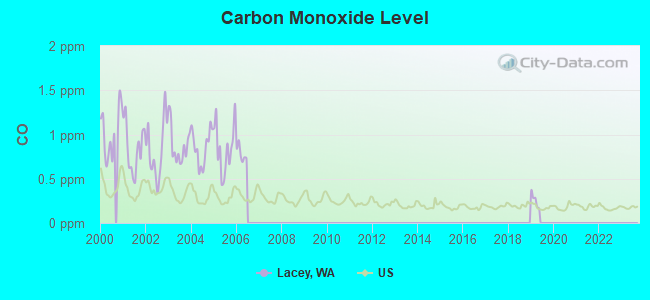
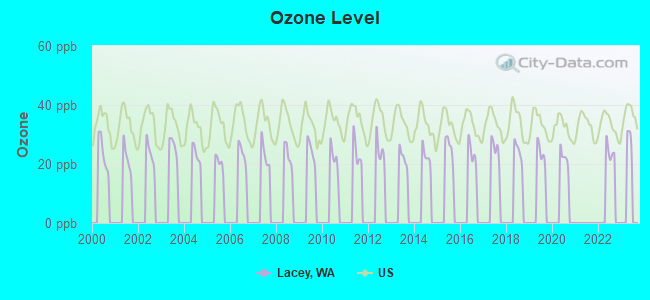
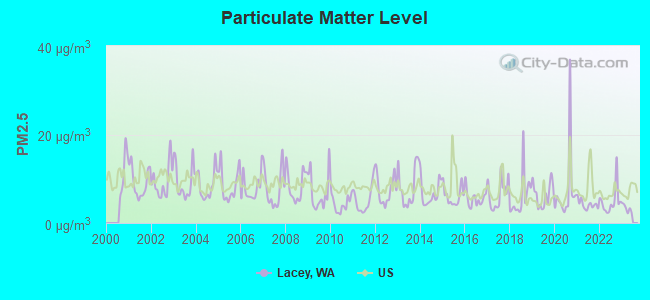
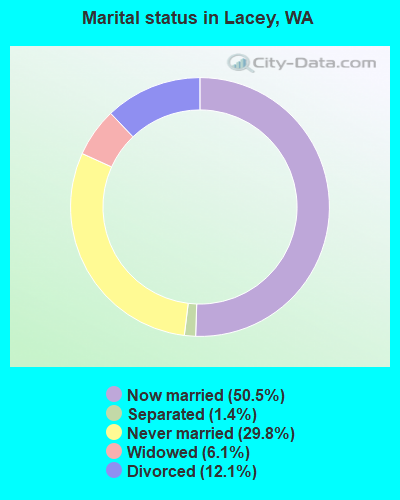
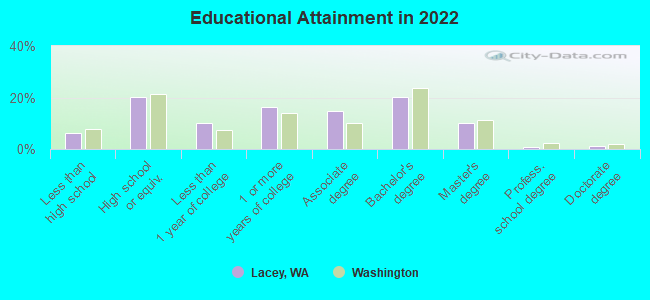
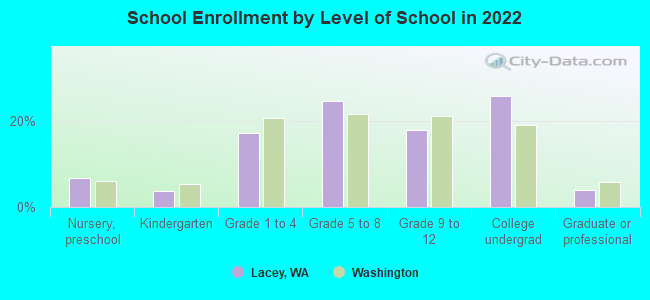
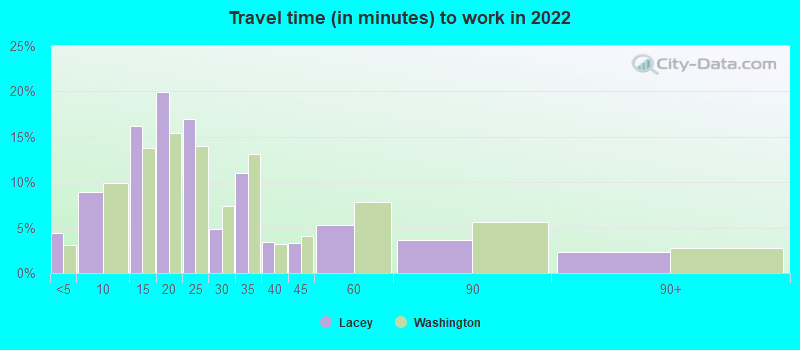
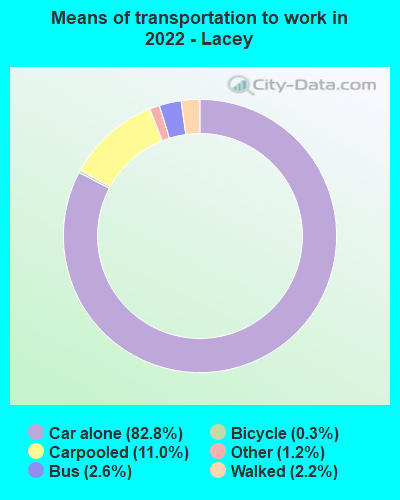
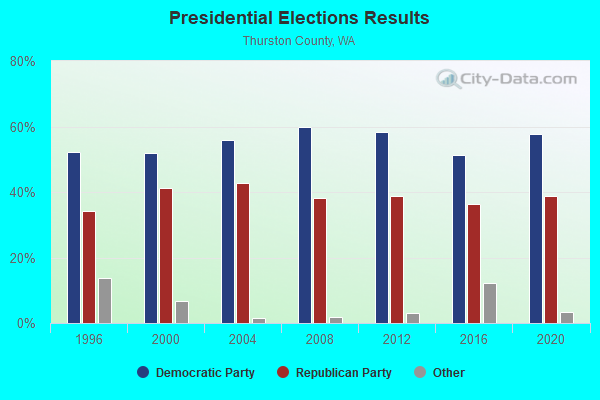

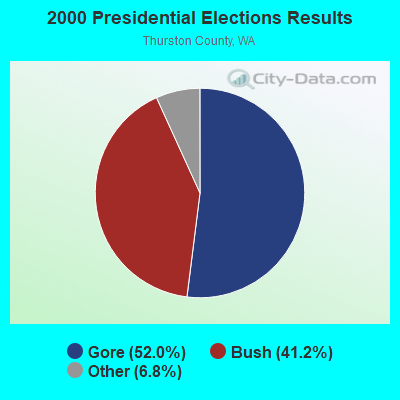
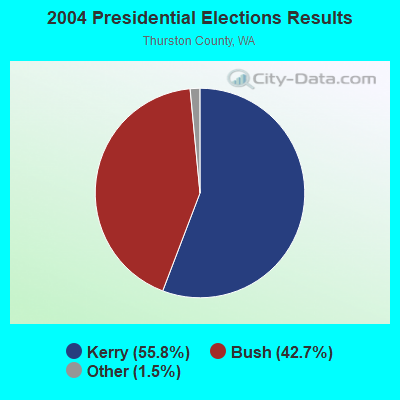
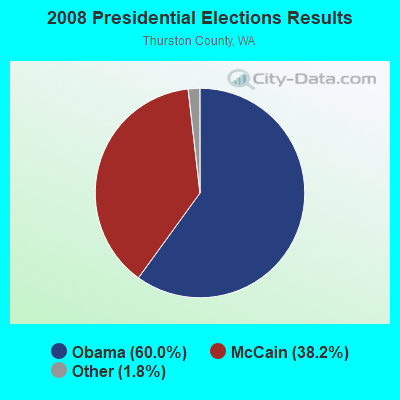
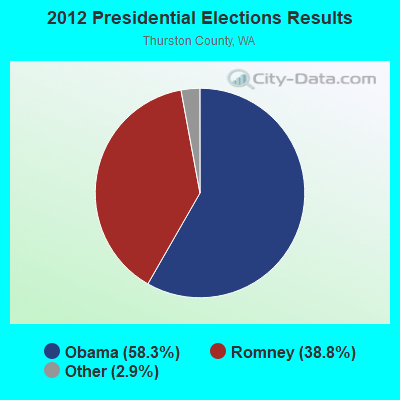
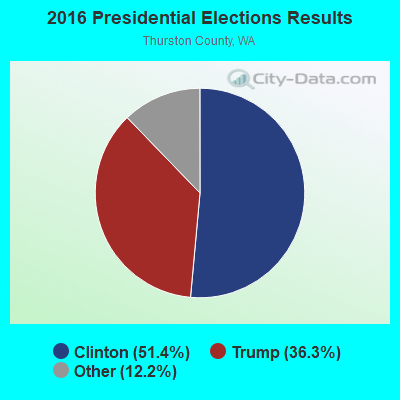

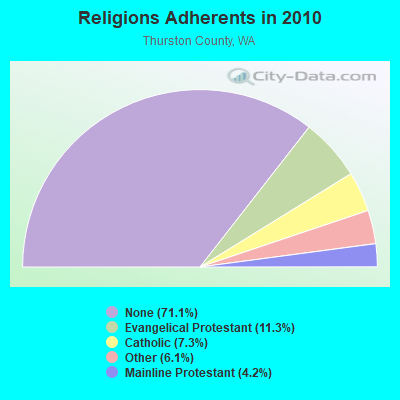
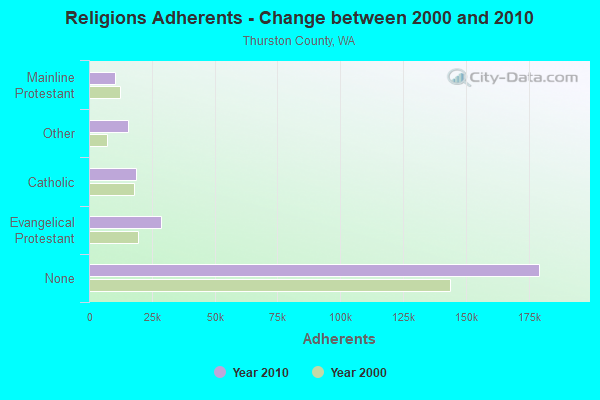
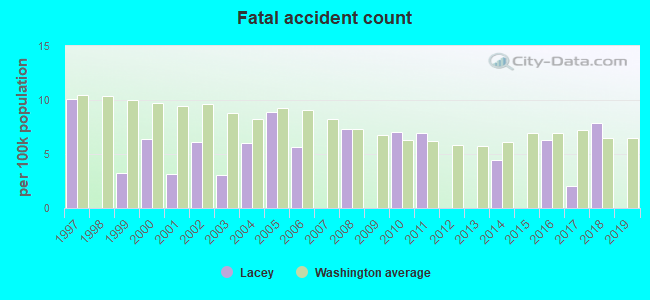
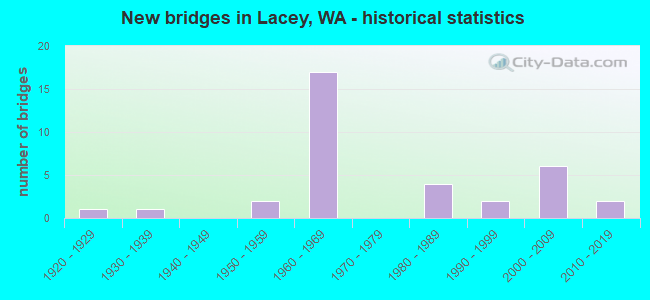
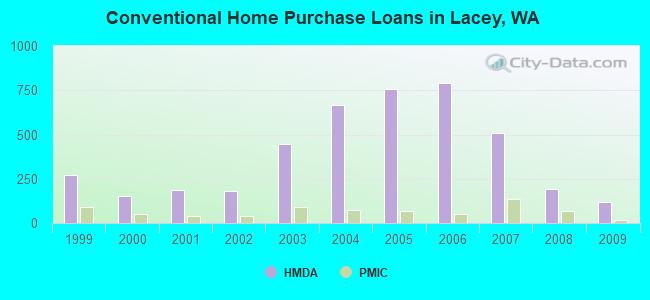
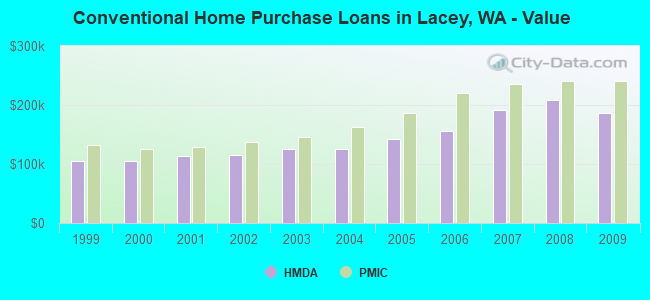
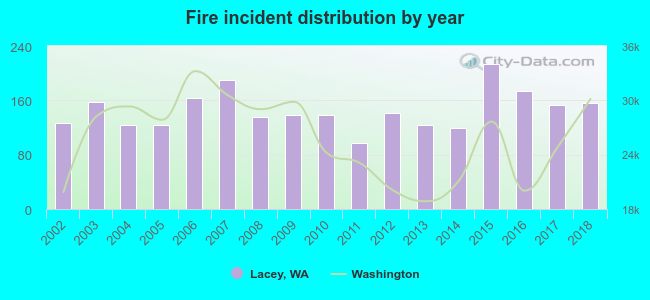 According to the data from the years 2002 - 2018 the average number of fires per year is 146. The highest number of reported fire incidents - 214 took place in 2015, and the least - 97 in 2011. The data has a growing trend.
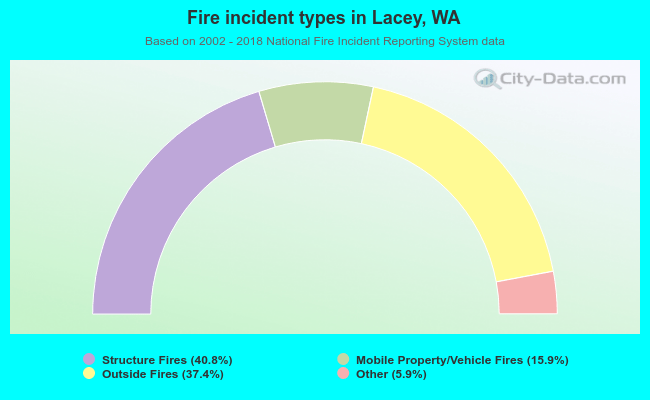 When looking into fire subcategories, the most incidents belonged to: Structure Fires (40.8%), and Outside Fires (37.4%).