Leavenworth, Kansas Submit your own pictures of this city and show them to the world
OSM Map
General Map
Google Map
MSN Map
OSM Map
General Map
Google Map
MSN Map
OSM Map
General Map
Google Map
MSN Map
OSM Map
General Map
Google Map
MSN Map
Please wait while loading the map...
Population in 2022: 37,081 (99% urban, 1% rural). Population change since 2000: +4.7%Males: 20,689 Females: 16,392
March 2022 cost of living index in Leavenworth: 86.7 (less than average, U.S. average is 100) Percentage of residents living in poverty in 2022: 14.6%for White Non-Hispanic residents , 27.8% for Black residents , 35.5% for Hispanic or Latino residents , 5.2% for American Indian residents , 32.1% for other race residents , 28.7% for two or more races residents )
Profiles of local businesses
Business Search - 14 Million verified businesses
Data:
Median household income ($)
Median household income (% change since 2000)
Household income diversity
Ratio of average income to average house value (%)
Ratio of average income to average rent
Median household income ($) - White
Median household income ($) - Black or African American
Median household income ($) - Asian
Median household income ($) - Hispanic or Latino
Median household income ($) - American Indian and Alaska Native
Median household income ($) - Multirace
Median household income ($) - Other Race
Median household income for houses/condos with a mortgage ($)
Median household income for apartments without a mortgage ($)
Races - White alone (%)
Races - White alone (% change since 2000)
Races - Black alone (%)
Races - Black alone (% change since 2000)
Races - American Indian alone (%)
Races - American Indian alone (% change since 2000)
Races - Asian alone (%)
Races - Asian alone (% change since 2000)
Races - Hispanic (%)
Races - Hispanic (% change since 2000)
Races - Native Hawaiian and Other Pacific Islander alone (%)
Races - Native Hawaiian and Other Pacific Islander alone (% change since 2000)
Races - Two or more races (%)
Races - Two or more races (% change since 2000)
Races - Other race alone (%)
Races - Other race alone (% change since 2000)
Racial diversity
Unemployment (%)
Unemployment (% change since 2000)
Unemployment (%) - White
Unemployment (%) - Black or African American
Unemployment (%) - Asian
Unemployment (%) - Hispanic or Latino
Unemployment (%) - American Indian and Alaska Native
Unemployment (%) - Multirace
Unemployment (%) - Other Race
Population density (people per square mile)
Population - Males (%)
Population - Females (%)
Population - Males (%) - White
Population - Males (%) - Black or African American
Population - Males (%) - Asian
Population - Males (%) - Hispanic or Latino
Population - Males (%) - American Indian and Alaska Native
Population - Males (%) - Multirace
Population - Males (%) - Other Race
Population - Females (%) - White
Population - Females (%) - Black or African American
Population - Females (%) - Asian
Population - Females (%) - Hispanic or Latino
Population - Females (%) - American Indian and Alaska Native
Population - Females (%) - Multirace
Population - Females (%) - Other Race
Coronavirus confirmed cases (Apr 27, 2024)
Deaths caused by coronavirus (Apr 27, 2024)
Coronavirus confirmed cases (per 100k population) (Apr 27, 2024)
Deaths caused by coronavirus (per 100k population) (Apr 27, 2024)
Daily increase in number of cases (Apr 27, 2024)
Weekly increase in number of cases (Apr 27, 2024)
Cases doubled (in days) (Apr 27, 2024)
Hospitalized patients (Apr 18, 2022)
Negative test results (Apr 18, 2022)
Total test results (Apr 18, 2022)
COVID Vaccine doses distributed (per 100k population) (Sep 19, 2023)
COVID Vaccine doses administered (per 100k population) (Sep 19, 2023)
COVID Vaccine doses distributed (Sep 19, 2023)
COVID Vaccine doses administered (Sep 19, 2023)
Likely homosexual households (%)
Likely homosexual households (% change since 2000)
Likely homosexual households - Lesbian couples (%)
Likely homosexual households - Lesbian couples (% change since 2000)
Likely homosexual households - Gay men (%)
Likely homosexual households - Gay men (% change since 2000)
Cost of living index
Median gross rent ($)
Median contract rent ($)
Median monthly housing costs ($)
Median house or condo value ($)
Median house or condo value ($ change since 2000)
Mean house or condo value by units in structure - 1, detached ($)
Mean house or condo value by units in structure - 1, attached ($)
Mean house or condo value by units in structure - 2 ($)
Mean house or condo value by units in structure by units in structure - 3 or 4 ($)
Mean house or condo value by units in structure - 5 or more ($)
Mean house or condo value by units in structure - Boat, RV, van, etc. ($)
Mean house or condo value by units in structure - Mobile home ($)
Median house or condo value ($) - White
Median house or condo value ($) - Black or African American
Median house or condo value ($) - Asian
Median house or condo value ($) - Hispanic or Latino
Median house or condo value ($) - American Indian and Alaska Native
Median house or condo value ($) - Multirace
Median house or condo value ($) - Other Race
Median resident age
Resident age diversity
Median resident age - Males
Median resident age - Females
Median resident age - White
Median resident age - Black or African American
Median resident age - Asian
Median resident age - Hispanic or Latino
Median resident age - American Indian and Alaska Native
Median resident age - Multirace
Median resident age - Other Race
Median resident age - Males - White
Median resident age - Males - Black or African American
Median resident age - Males - Asian
Median resident age - Males - Hispanic or Latino
Median resident age - Males - American Indian and Alaska Native
Median resident age - Males - Multirace
Median resident age - Males - Other Race
Median resident age - Females - White
Median resident age - Females - Black or African American
Median resident age - Females - Asian
Median resident age - Females - Hispanic or Latino
Median resident age - Females - American Indian and Alaska Native
Median resident age - Females - Multirace
Median resident age - Females - Other Race
Commute - mean travel time to work (minutes)
Travel time to work - Less than 5 minutes (%)
Travel time to work - Less than 5 minutes (% change since 2000)
Travel time to work - 5 to 9 minutes (%)
Travel time to work - 5 to 9 minutes (% change since 2000)
Travel time to work - 10 to 19 minutes (%)
Travel time to work - 10 to 19 minutes (% change since 2000)
Travel time to work - 20 to 29 minutes (%)
Travel time to work - 20 to 29 minutes (% change since 2000)
Travel time to work - 30 to 39 minutes (%)
Travel time to work - 30 to 39 minutes (% change since 2000)
Travel time to work - 40 to 59 minutes (%)
Travel time to work - 40 to 59 minutes (% change since 2000)
Travel time to work - 60 to 89 minutes (%)
Travel time to work - 60 to 89 minutes (% change since 2000)
Travel time to work - 90 or more minutes (%)
Travel time to work - 90 or more minutes (% change since 2000)
Marital status - Never married (%)
Marital status - Now married (%)
Marital status - Separated (%)
Marital status - Widowed (%)
Marital status - Divorced (%)
Median family income ($)
Median family income (% change since 2000)
Median non-family income ($)
Median non-family income (% change since 2000)
Median per capita income ($)
Median per capita income (% change since 2000)
Median family income ($) - White
Median family income ($) - Black or African American
Median family income ($) - Asian
Median family income ($) - Hispanic or Latino
Median family income ($) - American Indian and Alaska Native
Median family income ($) - Multirace
Median family income ($) - Other Race
Median year house/condo built
Median year apartment built
Year house built - Built 2005 or later (%)
Year house built - Built 2000 to 2004 (%)
Year house built - Built 1990 to 1999 (%)
Year house built - Built 1980 to 1989 (%)
Year house built - Built 1970 to 1979 (%)
Year house built - Built 1960 to 1969 (%)
Year house built - Built 1950 to 1959 (%)
Year house built - Built 1940 to 1949 (%)
Year house built - Built 1939 or earlier (%)
Average household size
Household density (households per square mile)
Average household size - White
Average household size - Black or African American
Average household size - Asian
Average household size - Hispanic or Latino
Average household size - American Indian and Alaska Native
Average household size - Multirace
Average household size - Other Race
Occupied housing units (%)
Vacant housing units (%)
Owner occupied housing units (%)
Renter occupied housing units (%)
Vacancy status - For rent (%)
Vacancy status - For sale only (%)
Vacancy status - Rented or sold, not occupied (%)
Vacancy status - For seasonal, recreational, or occasional use (%)
Vacancy status - For migrant workers (%)
Vacancy status - Other vacant (%)
Residents with income below the poverty level (%)
Residents with income below 50% of the poverty level (%)
Children below poverty level (%)
Poor families by family type - Married-couple family (%)
Poor families by family type - Male, no wife present (%)
Poor families by family type - Female, no husband present (%)
Poverty status for native-born residents (%)
Poverty status for foreign-born residents (%)
Poverty among high school graduates not in families (%)
Poverty among people who did not graduate high school not in families (%)
Residents with income below the poverty level (%) - White
Residents with income below the poverty level (%) - Black or African American
Residents with income below the poverty level (%) - Asian
Residents with income below the poverty level (%) - Hispanic or Latino
Residents with income below the poverty level (%) - American Indian and Alaska Native
Residents with income below the poverty level (%) - Multirace
Residents with income below the poverty level (%) - Other Race
Air pollution - Air Quality Index (AQI)
Air pollution - CO
Air pollution - NO2
Air pollution - SO2
Air pollution - Ozone
Air pollution - PM10
Air pollution - PM25
Air pollution - Pb
Crime - Murders per 100,000 population
Crime - Rapes per 100,000 population
Crime - Robberies per 100,000 population
Crime - Assaults per 100,000 population
Crime - Burglaries per 100,000 population
Crime - Thefts per 100,000 population
Crime - Auto thefts per 100,000 population
Crime - Arson per 100,000 population
Crime - City-data.com crime index
Crime - Violent crime index
Crime - Property crime index
Crime - Murders per 100,000 population (5 year average)
Crime - Rapes per 100,000 population (5 year average)
Crime - Robberies per 100,000 population (5 year average)
Crime - Assaults per 100,000 population (5 year average)
Crime - Burglaries per 100,000 population (5 year average)
Crime - Thefts per 100,000 population (5 year average)
Crime - Auto thefts per 100,000 population (5 year average)
Crime - Arson per 100,000 population (5 year average)
Crime - City-data.com crime index (5 year average)
Crime - Violent crime index (5 year average)
Crime - Property crime index (5 year average)
1996 Presidential Elections Results (%) - Democratic Party (Clinton)
1996 Presidential Elections Results (%) - Republican Party (Dole)
1996 Presidential Elections Results (%) - Other
2000 Presidential Elections Results (%) - Democratic Party (Gore)
2000 Presidential Elections Results (%) - Republican Party (Bush)
2000 Presidential Elections Results (%) - Other
2004 Presidential Elections Results (%) - Democratic Party (Kerry)
2004 Presidential Elections Results (%) - Republican Party (Bush)
2004 Presidential Elections Results (%) - Other
2008 Presidential Elections Results (%) - Democratic Party (Obama)
2008 Presidential Elections Results (%) - Republican Party (McCain)
2008 Presidential Elections Results (%) - Other
2012 Presidential Elections Results (%) - Democratic Party (Obama)
2012 Presidential Elections Results (%) - Republican Party (Romney)
2012 Presidential Elections Results (%) - Other
2016 Presidential Elections Results (%) - Democratic Party (Clinton)
2016 Presidential Elections Results (%) - Republican Party (Trump)
2016 Presidential Elections Results (%) - Other
2020 Presidential Elections Results (%) - Democratic Party (Biden)
2020 Presidential Elections Results (%) - Republican Party (Trump)
2020 Presidential Elections Results (%) - Other
Ancestries Reported - Arab (%)
Ancestries Reported - Czech (%)
Ancestries Reported - Danish (%)
Ancestries Reported - Dutch (%)
Ancestries Reported - English (%)
Ancestries Reported - French (%)
Ancestries Reported - French Canadian (%)
Ancestries Reported - German (%)
Ancestries Reported - Greek (%)
Ancestries Reported - Hungarian (%)
Ancestries Reported - Irish (%)
Ancestries Reported - Italian (%)
Ancestries Reported - Lithuanian (%)
Ancestries Reported - Norwegian (%)
Ancestries Reported - Polish (%)
Ancestries Reported - Portuguese (%)
Ancestries Reported - Russian (%)
Ancestries Reported - Scotch-Irish (%)
Ancestries Reported - Scottish (%)
Ancestries Reported - Slovak (%)
Ancestries Reported - Subsaharan African (%)
Ancestries Reported - Swedish (%)
Ancestries Reported - Swiss (%)
Ancestries Reported - Ukrainian (%)
Ancestries Reported - United States (%)
Ancestries Reported - Welsh (%)
Ancestries Reported - West Indian (%)
Ancestries Reported - Other (%)
Educational Attainment - No schooling completed (%)
Educational Attainment - Less than high school (%)
Educational Attainment - High school or equivalent (%)
Educational Attainment - Less than 1 year of college (%)
Educational Attainment - 1 or more years of college (%)
Educational Attainment - Associate degree (%)
Educational Attainment - Bachelor's degree (%)
Educational Attainment - Master's degree (%)
Educational Attainment - Professional school degree (%)
Educational Attainment - Doctorate degree (%)
School Enrollment - Nursery, preschool (%)
School Enrollment - Kindergarten (%)
School Enrollment - Grade 1 to 4 (%)
School Enrollment - Grade 5 to 8 (%)
School Enrollment - Grade 9 to 12 (%)
School Enrollment - College undergrad (%)
School Enrollment - Graduate or professional (%)
School Enrollment - Not enrolled in school (%)
School enrollment - Public schools (%)
School enrollment - Private schools (%)
School enrollment - Not enrolled (%)
Median number of rooms in houses and condos
Median number of rooms in apartments
Housing units lacking complete plumbing facilities (%)
Housing units lacking complete kitchen facilities (%)
Density of houses
Urban houses (%)
Rural houses (%)
Households with people 60 years and over (%)
Households with people 65 years and over (%)
Households with people 75 years and over (%)
Households with one or more nonrelatives (%)
Households with no nonrelatives (%)
Population in households (%)
Family households (%)
Nonfamily households (%)
Population in families (%)
Family households with own children (%)
Median number of bedrooms in owner occupied houses
Mean number of bedrooms in owner occupied houses
Median number of bedrooms in renter occupied houses
Mean number of bedrooms in renter occupied houses
Median number of vehichles in owner occupied houses
Mean number of vehichles in owner occupied houses
Median number of vehichles in renter occupied houses
Mean number of vehichles in renter occupied houses
Mortgage status - with mortgage (%)
Mortgage status - with second mortgage (%)
Mortgage status - with home equity loan (%)
Mortgage status - with both second mortgage and home equity loan (%)
Mortgage status - without a mortgage (%)
Average family size
Average family size - White
Average family size - Black or African American
Average family size - Asian
Average family size - Hispanic or Latino
Average family size - American Indian and Alaska Native
Average family size - Multirace
Average family size - Other Race
Geographical mobility - Same house 1 year ago (%)
Geographical mobility - Moved within same county (%)
Geographical mobility - Moved from different county within same state (%)
Geographical mobility - Moved from different state (%)
Geographical mobility - Moved from abroad (%)
Place of birth - Born in state of residence (%)
Place of birth - Born in other state (%)
Place of birth - Native, outside of US (%)
Place of birth - Foreign born (%)
Housing units in structures - 1, detached (%)
Housing units in structures - 1, attached (%)
Housing units in structures - 2 (%)
Housing units in structures - 3 or 4 (%)
Housing units in structures - 5 to 9 (%)
Housing units in structures - 10 to 19 (%)
Housing units in structures - 20 to 49 (%)
Housing units in structures - 50 or more (%)
Housing units in structures - Mobile home (%)
Housing units in structures - Boat, RV, van, etc. (%)
House/condo owner moved in on average (years ago)
Renter moved in on average (years ago)
Year householder moved into unit - Moved in 1999 to March 2000 (%)
Year householder moved into unit - Moved in 1995 to 1998 (%)
Year householder moved into unit - Moved in 1990 to 1994 (%)
Year householder moved into unit - Moved in 1980 to 1989 (%)
Year householder moved into unit - Moved in 1970 to 1979 (%)
Year householder moved into unit - Moved in 1969 or earlier (%)
Means of transportation to work - Drove car alone (%)
Means of transportation to work - Carpooled (%)
Means of transportation to work - Public transportation (%)
Means of transportation to work - Bus or trolley bus (%)
Means of transportation to work - Streetcar or trolley car (%)
Means of transportation to work - Subway or elevated (%)
Means of transportation to work - Railroad (%)
Means of transportation to work - Ferryboat (%)
Means of transportation to work - Taxicab (%)
Means of transportation to work - Motorcycle (%)
Means of transportation to work - Bicycle (%)
Means of transportation to work - Walked (%)
Means of transportation to work - Other means (%)
Working at home (%)
Industry diversity
Most Common Industries - Agriculture, forestry, fishing and hunting, and mining (%)
Most Common Industries - Agriculture, forestry, fishing and hunting (%)
Most Common Industries - Mining, quarrying, and oil and gas extraction (%)
Most Common Industries - Construction (%)
Most Common Industries - Manufacturing (%)
Most Common Industries - Wholesale trade (%)
Most Common Industries - Retail trade (%)
Most Common Industries - Transportation and warehousing, and utilities (%)
Most Common Industries - Transportation and warehousing (%)
Most Common Industries - Utilities (%)
Most Common Industries - Information (%)
Most Common Industries - Finance and insurance, and real estate and rental and leasing (%)
Most Common Industries - Finance and insurance (%)
Most Common Industries - Real estate and rental and leasing (%)
Most Common Industries - Professional, scientific, and management, and administrative and waste management services (%)
Most Common Industries - Professional, scientific, and technical services (%)
Most Common Industries - Management of companies and enterprises (%)
Most Common Industries - Administrative and support and waste management services (%)
Most Common Industries - Educational services, and health care and social assistance (%)
Most Common Industries - Educational services (%)
Most Common Industries - Health care and social assistance (%)
Most Common Industries - Arts, entertainment, and recreation, and accommodation and food services (%)
Most Common Industries - Arts, entertainment, and recreation (%)
Most Common Industries - Accommodation and food services (%)
Most Common Industries - Other services, except public administration (%)
Most Common Industries - Public administration (%)
Occupation diversity
Most Common Occupations - Management, business, science, and arts occupations (%)
Most Common Occupations - Management, business, and financial occupations (%)
Most Common Occupations - Management occupations (%)
Most Common Occupations - Business and financial operations occupations (%)
Most Common Occupations - Computer, engineering, and science occupations (%)
Most Common Occupations - Computer and mathematical occupations (%)
Most Common Occupations - Architecture and engineering occupations (%)
Most Common Occupations - Life, physical, and social science occupations (%)
Most Common Occupations - Education, legal, community service, arts, and media occupations (%)
Most Common Occupations - Community and social service occupations (%)
Most Common Occupations - Legal occupations (%)
Most Common Occupations - Education, training, and library occupations (%)
Most Common Occupations - Arts, design, entertainment, sports, and media occupations (%)
Most Common Occupations - Healthcare practitioners and technical occupations (%)
Most Common Occupations - Health diagnosing and treating practitioners and other technical occupations (%)
Most Common Occupations - Health technologists and technicians (%)
Most Common Occupations - Service occupations (%)
Most Common Occupations - Healthcare support occupations (%)
Most Common Occupations - Protective service occupations (%)
Most Common Occupations - Fire fighting and prevention, and other protective service workers including supervisors (%)
Most Common Occupations - Law enforcement workers including supervisors (%)
Most Common Occupations - Food preparation and serving related occupations (%)
Most Common Occupations - Building and grounds cleaning and maintenance occupations (%)
Most Common Occupations - Personal care and service occupations (%)
Most Common Occupations - Sales and office occupations (%)
Most Common Occupations - Sales and related occupations (%)
Most Common Occupations - Office and administrative support occupations (%)
Most Common Occupations - Natural resources, construction, and maintenance occupations (%)
Most Common Occupations - Farming, fishing, and forestry occupations (%)
Most Common Occupations - Construction and extraction occupations (%)
Most Common Occupations - Installation, maintenance, and repair occupations (%)
Most Common Occupations - Production, transportation, and material moving occupations (%)
Most Common Occupations - Production occupations (%)
Most Common Occupations - Transportation occupations (%)
Most Common Occupations - Material moving occupations (%)
People in Group quarters - Institutionalized population (%)
People in Group quarters - Correctional institutions (%)
People in Group quarters - Federal prisons and detention centers (%)
People in Group quarters - Halfway houses (%)
People in Group quarters - Local jails and other confinement facilities (including police lockups) (%)
People in Group quarters - Military disciplinary barracks (%)
People in Group quarters - State prisons (%)
People in Group quarters - Other types of correctional institutions (%)
People in Group quarters - Nursing homes (%)
People in Group quarters - Hospitals/wards, hospices, and schools for the handicapped (%)
People in Group quarters - Hospitals/wards and hospices for chronically ill (%)
People in Group quarters - Hospices or homes for chronically ill (%)
People in Group quarters - Military hospitals or wards for chronically ill (%)
People in Group quarters - Other hospitals or wards for chronically ill (%)
People in Group quarters - Hospitals or wards for drug/alcohol abuse (%)
People in Group quarters - Mental (Psychiatric) hospitals or wards (%)
People in Group quarters - Schools, hospitals, or wards for the mentally retarded (%)
People in Group quarters - Schools, hospitals, or wards for the physically handicapped (%)
People in Group quarters - Institutions for the deaf (%)
People in Group quarters - Institutions for the blind (%)
People in Group quarters - Orthopedic wards and institutions for the physically handicapped (%)
People in Group quarters - Wards in general hospitals for patients who have no usual home elsewhere (%)
People in Group quarters - Wards in military hospitals for patients who have no usual home elsewhere (%)
People in Group quarters - Juvenile institutions (%)
People in Group quarters - Long-term care (%)
People in Group quarters - Homes for abused, dependent, and neglected children (%)
People in Group quarters - Residential treatment centers for emotionally disturbed children (%)
People in Group quarters - Training schools for juvenile delinquents (%)
People in Group quarters - Short-term care, detention or diagnostic centers for delinquent children (%)
People in Group quarters - Type of juvenile institution unknown (%)
People in Group quarters - Noninstitutionalized population (%)
People in Group quarters - College dormitories (includes college quarters off campus) (%)
People in Group quarters - Military quarters (%)
People in Group quarters - On base (%)
People in Group quarters - Barracks, unaccompanied personnel housing (UPH), (Enlisted/Officer), ;and similar group living quarters for military personnel (%)
People in Group quarters - Transient quarters for temporary residents (%)
People in Group quarters - Military ships (%)
People in Group quarters - Group homes (%)
People in Group quarters - Homes or halfway houses for drug/alcohol abuse (%)
People in Group quarters - Homes for the mentally ill (%)
People in Group quarters - Homes for the mentally retarded (%)
People in Group quarters - Homes for the physically handicapped (%)
People in Group quarters - Other group homes (%)
People in Group quarters - Religious group quarters (%)
People in Group quarters - Dormitories (%)
People in Group quarters - Agriculture workers' dormitories on farms (%)
People in Group quarters - Job Corps and vocational training facilities (%)
People in Group quarters - Other workers' dormitories (%)
People in Group quarters - Crews of maritime vessels (%)
People in Group quarters - Other nonhousehold living situations (%)
People in Group quarters - Other noninstitutional group quarters (%)
Residents speaking English at home (%)
Residents speaking English at home - Born in the United States (%)
Residents speaking English at home - Native, born elsewhere (%)
Residents speaking English at home - Foreign born (%)
Residents speaking Spanish at home (%)
Residents speaking Spanish at home - Born in the United States (%)
Residents speaking Spanish at home - Native, born elsewhere (%)
Residents speaking Spanish at home - Foreign born (%)
Residents speaking other language at home (%)
Residents speaking other language at home - Born in the United States (%)
Residents speaking other language at home - Native, born elsewhere (%)
Residents speaking other language at home - Foreign born (%)
Class of Workers - Employee of private company (%)
Class of Workers - Self-employed in own incorporated business (%)
Class of Workers - Private not-for-profit wage and salary workers (%)
Class of Workers - Local government workers (%)
Class of Workers - State government workers (%)
Class of Workers - Federal government workers (%)
Class of Workers - Self-employed workers in own not incorporated business and Unpaid family workers (%)
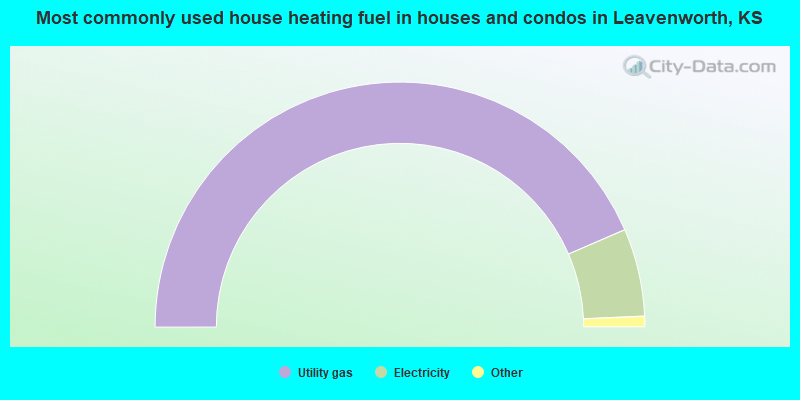
House heating fuel used in houses and condos - Utility gas (%)
House heating fuel used in houses and condos - Bottled, tank, or LP gas (%)
House heating fuel used in houses and condos - Electricity (%)
House heating fuel used in houses and condos - Fuel oil, kerosene, etc. (%)
House heating fuel used in houses and condos - Coal or coke (%)
House heating fuel used in houses and condos - Wood (%)
House heating fuel used in houses and condos - Solar energy (%)
House heating fuel used in houses and condos - Other fuel (%)
House heating fuel used in houses and condos - No fuel used (%)
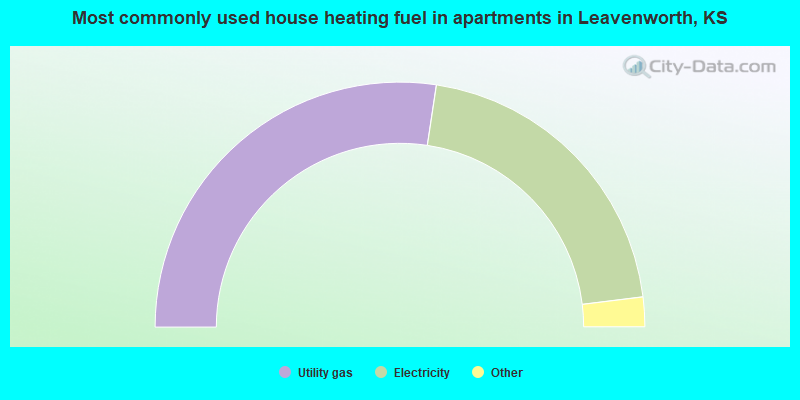
House heating fuel used in apartments - Utility gas (%)
House heating fuel used in apartments - Bottled, tank, or LP gas (%)
House heating fuel used in apartments - Electricity (%)
House heating fuel used in apartments - Fuel oil, kerosene, etc. (%)
House heating fuel used in apartments - Coal or coke (%)
House heating fuel used in apartments - Wood (%)
House heating fuel used in apartments - Solar energy (%)
House heating fuel used in apartments - Other fuel (%)
House heating fuel used in apartments - No fuel used (%)
Armed forces status - In Armed Forces (%)
Armed forces status - Civilian (%)
Armed forces status - Civilian - Veteran (%)
Armed forces status - Civilian - Nonveteran (%)
Fatal accidents locations in years 2005-2021
Fatal accidents locations in 2005
Fatal accidents locations in 2006
Fatal accidents locations in 2007
Fatal accidents locations in 2008
Fatal accidents locations in 2009
Fatal accidents locations in 2010
Fatal accidents locations in 2011
Fatal accidents locations in 2012
Fatal accidents locations in 2013
Fatal accidents locations in 2014
Fatal accidents locations in 2015
Fatal accidents locations in 2016
Fatal accidents locations in 2017
Fatal accidents locations in 2018
Fatal accidents locations in 2019
Fatal accidents locations in 2020
Fatal accidents locations in 2021
Alcohol use - People drinking some alcohol every month (%)
Alcohol use - People not drinking at all (%)
Alcohol use - Average days/month drinking alcohol
Alcohol use - Average drinks/week
Alcohol use - Average days/year people drink much
Audiometry - Average condition of hearing (%)
Audiometry - People that can hear a whisper from across a quiet room (%)
Audiometry - People that can hear normal voice from across a quiet room (%)
Audiometry - Ears ringing, roaring, buzzing (%)
Audiometry - Had a job exposure to loud noise (%)
Audiometry - Had off-work exposure to loud noise (%)
Blood Pressure & Cholesterol - Has high blood pressure (%)
Blood Pressure & Cholesterol - Checking blood pressure at home (%)
Blood Pressure & Cholesterol - Frequently checking blood cholesterol (%)
Blood Pressure & Cholesterol - Has high cholesterol level (%)
Consumer Behavior - Money monthly spent on food at supermarket/grocery store
Consumer Behavior - Money monthly spent on food at other stores
Consumer Behavior - Money monthly spent on eating out
Consumer Behavior - Money monthly spent on carryout/delivered foods
Consumer Behavior - Income spent on food at supermarket/grocery store (%)
Consumer Behavior - Income spent on food at other stores (%)
Consumer Behavior - Income spent on eating out (%)
Consumer Behavior - Income spent on carryout/delivered foods (%)
Current Health Status - General health condition (%)
Current Health Status - Blood donors (%)
Current Health Status - Has blood ever tested for HIV virus (%)
Current Health Status - Left-handed people (%)
Dermatology - People using sunscreen (%)
Diabetes - Diabetics (%)
Diabetes - Had a blood test for high blood sugar (%)
Diabetes - People taking insulin (%)
Diet Behavior & Nutrition - Diet health (%)
Diet Behavior & Nutrition - Milk product consumption (# of products/month)
Diet Behavior & Nutrition - Meals not home prepared (#/week)
Diet Behavior & Nutrition - Meals from fast food or pizza place (#/week)
Diet Behavior & Nutrition - Ready-to-eat foods (#/month)
Diet Behavior & Nutrition - Frozen meals/pizza (#/month)
Drug Use - People that ever used marijuana or hashish (%)
Drug Use - Ever used hard drugs (%)
Drug Use - Ever used any form of cocaine (%)
Drug Use - Ever used heroin (%)
Drug Use - Ever used methamphetamine (%)
Health Insurance - People covered by health insurance (%)
Kidney Conditions-Urology - Avg. # of times urinating at night
Medical Conditions - People with asthma (%)
Medical Conditions - People with anemia (%)
Medical Conditions - People with psoriasis (%)
Medical Conditions - People with overweight (%)
Medical Conditions - Elderly people having difficulties in thinking or remembering (%)
Medical Conditions - People who ever received blood transfusion (%)
Medical Conditions - People having trouble seeing even with glass/contacts (%)
Medical Conditions - People with arthritis (%)
Medical Conditions - People with gout (%)
Medical Conditions - People with congestive heart failure (%)
Medical Conditions - People with coronary heart disease (%)
Medical Conditions - People with angina pectoris (%)
Medical Conditions - People who ever had heart attack (%)
Medical Conditions - People who ever had stroke (%)
Medical Conditions - People with emphysema (%)
Medical Conditions - People with thyroid problem (%)
Medical Conditions - People with chronic bronchitis (%)
Medical Conditions - People with any liver condition (%)
Medical Conditions - People who ever had cancer or malignancy (%)
Mental Health - People who have little interest in doing things (%)
Mental Health - People feeling down, depressed, or hopeless (%)
Mental Health - People who have trouble sleeping or sleeping too much (%)
Mental Health - People feeling tired or having little energy (%)
Mental Health - People with poor appetite or overeating (%)
Mental Health - People feeling bad about themself (%)
Mental Health - People who have trouble concentrating on things (%)
Mental Health - People moving or speaking slowly or too fast (%)
Mental Health - People having thoughts they would be better off dead (%)
Oral Health - Average years since last visit a dentist
Oral Health - People embarrassed because of mouth (%)
Oral Health - People with gum disease (%)
Oral Health - General health of teeth and gums (%)
Oral Health - Average days a week using dental floss/device
Oral Health - Average days a week using mouthwash for dental problem
Oral Health - Average number of teeth
Pesticide Use - Households using pesticides to control insects (%)
Pesticide Use - Households using pesticides to kill weeds (%)
Physical Activity - People doing vigorous-intensity work activities (%)
Physical Activity - People doing moderate-intensity work activities (%)
Physical Activity - People walking or bicycling (%)
Physical Activity - People doing vigorous-intensity recreational activities (%)
Physical Activity - People doing moderate-intensity recreational activities (%)
Physical Activity - Average hours a day doing sedentary activities
Physical Activity - Average hours a day watching TV or videos
Physical Activity - Average hours a day using computer
Physical Functioning - People having limitations keeping them from working (%)
Physical Functioning - People limited in amount of work they can do (%)
Physical Functioning - People that need special equipment to walk (%)
Physical Functioning - People experiencing confusion/memory problems (%)
Physical Functioning - People requiring special healthcare equipment (%)
Prescription Medications - Average number of prescription medicines taking
Preventive Aspirin Use - Adults 40+ taking low-dose aspirin (%)
Reproductive Health - Vaginal deliveries (%)
Reproductive Health - Cesarean deliveries (%)
Reproductive Health - Deliveries resulted in a live birth (%)
Reproductive Health - Pregnancies resulted in a delivery (%)
Reproductive Health - Women breastfeeding newborns (%)
Reproductive Health - Women that had a hysterectomy (%)
Reproductive Health - Women that had both ovaries removed (%)
Reproductive Health - Women that have ever taken birth control pills (%)
Reproductive Health - Women taking birth control pills (%)
Reproductive Health - Women that have ever used Depo-Provera or injectables (%)
Reproductive Health - Women that have ever used female hormones (%)
Sexual Behavior - People 18+ that ever had sex (vaginal, anal, or oral) (%)
Sexual Behavior - Males 18+ that ever had vaginal sex with a woman (%)
Sexual Behavior - Males 18+ that ever performed oral sex on a woman (%)
Sexual Behavior - Males 18+ that ever had anal sex with a woman (%)
Sexual Behavior - Males 18+ that ever had any sex with a man (%)
Sexual Behavior - Females 18+ that ever had vaginal sex with a man (%)
Sexual Behavior - Females 18+ that ever performed oral sex on a man (%)
Sexual Behavior - Females 18+ that ever had anal sex with a man (%)
Sexual Behavior - Females 18+ that ever had any kind of sex with a woman (%)
Sexual Behavior - Average age people first had sex
Sexual Behavior - Average number of female sex partners in lifetime (males 18+)
Sexual Behavior - Average number of female vaginal sex partners in lifetime (males 18+)
Sexual Behavior - Average age people first performed oral sex on a woman (18+)
Sexual Behavior - Average number of woman performed oral sex on in lifetime (18+)
Sexual Behavior - Average number of male sex partners in lifetime (males 18+)
Sexual Behavior - Average number of male anal sex partners in lifetime (males 18+)
Sexual Behavior - Average age people first performed oral sex on a man (18+)
Sexual Behavior - Average number of male oral sex partners in lifetime (18+)
Sexual Behavior - People using protection when performing oral sex (%)
Sexual Behavior - Average number of times people have vaginal or anal sex a year
Sexual Behavior - People having sex without condom (%)
Sexual Behavior - Average number of male sex partners in lifetime (females 18+)
Sexual Behavior - Average number of male vaginal sex partners in lifetime (females 18+)
Sexual Behavior - Average number of female sex partners in lifetime (females 18+)
Sexual Behavior - Circumcised males 18+ (%)
Sleep Disorders - Average hours sleeping at night
Sleep Disorders - People that has trouble sleeping (%)
Smoking-Cigarette Use - People smoking cigarettes (%)
Taste & Smell - People 40+ having problems with smell (%)
Taste & Smell - People 40+ having problems with taste (%)
Taste & Smell - People 40+ that ever had wisdom teeth removed (%)
Taste & Smell - People 40+ that ever had tonsils teeth removed (%)
Taste & Smell - People 40+ that ever had a loss of consciousness because of a head injury (%)
Taste & Smell - People 40+ that ever had a broken nose or other serious injury to face or skull (%)
Taste & Smell - People 40+ that ever had two or more sinus infections (%)
Weight - Average height (inches)
Weight - Average weight (pounds)
Weight - Average BMI
Weight - People that are obese (%)
Weight - People that ever were obese (%)
Weight - People trying to lose weight (%)
Officers per 1,000 residents here:
1.47Kansas average:
2.70
Latest news from Leavenworth, KS collected exclusively by city-data.com from local newspapers, TV, and radio stations
Ancestries: English (17.9%), German (14.8%), American (13.2%), Irish (5.7%), European (2.7%), Italian (2.2%).
Current Local Time:
Land area: 23.5 square miles.
Population density: 1,577 people per square mile (low).
1,122 residents are foreign born (1.2% Asia , 0.8% Europe , 0.7% Latin America ).
This city:
3.0%Kansas:
7.1%
Median real estate property taxes paid for housing units with mortgages in 2022: $2,595 (1.3%)Median real estate property taxes paid for housing units with no mortgage in 2022: $1,777 (1.2%)
Nearest city with pop. 50,000+: Kansas City, KS
Nearest city with pop. 200,000+: Kansas City, MO
Nearest city with pop. 1,000,000+: Chicago, IL
Nearest cities:
Iatan, MO (3.5 miles)
Latitude: 39.31 N, Longitude: 94.92 W
Daytime population change due to commuting: +4,872 (+13.0%)Workers who live and work in this city: 9,215 (58.0%)
Single-family new house construction building permits:
2022: 16 buildings , average cost: $220,9002021: 27 buildings , average cost: $218,8002020: 41 buildings , average cost: $206,6002019: 24 buildings , average cost: $195,2002018: 29 buildings , average cost: $197,8002017: 14 buildings , average cost: $217,8002016: 19 buildings , average cost: $237,0002015: 11 buildings , average cost: $172,2002014: 10 buildings , average cost: $220,6002013: 25 buildings , average cost: $215,4002012: 19 buildings , average cost: $229,7002011: 35 buildings , average cost: $234,5002010: 50 buildings , average cost: $196,7002009: 67 buildings , average cost: $151,9002008: 65 buildings , average cost: $146,9002007: 65 buildings , average cost: $157,9002006: 142 buildings , average cost: $147,6002005: 145 buildings , average cost: $154,4002004: 128 buildings , average cost: $149,2002003: 82 buildings , average cost: $141,0002002: 115 buildings , average cost: $107,9002001: 72 buildings , average cost: $99,7002000: 52 buildings , average cost: $91,9001999: 53 buildings , average cost: $97,0001998: 42 buildings , average cost: $91,9001997: 67 buildings , average cost: $90,800Unemployment in December 2023:
Most common occupations in Leavenworth, KS (%)
Both Males Females
Other office and administrative support workers, including supervisors (5.0%)
Law enforcement workers, including supervisors (5.0%)
Preschool, kindergarten, elementary, and middle school teachers (4.0%)
Building and grounds cleaning and maintenance occupations (3.7%)
Other sales and related occupations, including supervisors (3.7%)
Retail sales workers, except cashiers (3.0%)
Secretaries and administrative assistants (2.9%)
Law enforcement workers, including supervisors (8.2%)
Building and grounds cleaning and maintenance occupations (5.4%)
Material recording, scheduling, dispatching, and distributing workers (4.1%)
Driver/sales workers and truck drivers (3.9%)
Computer specialists (3.9%)
Vehicle and mobile equipment mechanics, installers, and repairers (3.5%)
Electrical equipment mechanics and other installation, maintenance, and repair workers, including supervisors (3.4%)
Other office and administrative support workers, including supervisors (7.9%)
Preschool, kindergarten, elementary, and middle school teachers (5.9%)
Secretaries and administrative assistants (5.2%)
Health technologists and technicians (4.4%)
Other sales and related occupations, including supervisors (4.3%)
Registered nurses (3.7%)
Customer service representatives (3.6%)
Tornado activity:
Leavenworth-area historical tornado activity is slightly above Kansas state average. It is 108% greater than the overall U.S. average.
On 6/8/1966, a category F4 (max. wind speeds 207-260 mph) tornado 5.6 miles away from the Leavenworth city center killed one person and injured 2 people and caused between $50,000 and $500,000 in damages.
On 5/7/1961, a category F4 tornado 9.6 miles away from the city center injured 12 people and caused between $500,000 and $5,000,000 in damages.
Earthquake activity:
Leavenworth-area historical earthquake activity is significantly above Kansas state average. It is 495% greater than the overall U.S. average. On 9/3/2016 at 12:02:44, a magnitude 5.8 (5.8 MW, Depth: 3.5 mi, Class: Moderate, Intensity: VI - VII) earthquake occurred 227.5 miles away from Leavenworth center On 11/6/2011 at 03:53:10, a magnitude 5.7 (5.7 MW, Depth: 3.2 mi) earthquake occurred 280.1 miles away from Leavenworth center On 11/12/2014 at 21:40:00, a magnitude 4.9 (4.9 MW, Depth: 2.5 mi, Class: Light, Intensity: IV - V) earthquake occurred 203.2 miles away from Leavenworth center On 11/7/2016 at 01:44:24, a magnitude 5.0 (5.0 MW, Depth: 2.8 mi) earthquake occurred 251.5 miles away from the city center On 2/13/2016 at 17:07:06, a magnitude 5.1 (5.1 MW, Depth: 5.2 mi) earthquake occurred 284.0 miles away from Leavenworth center On 1/19/2020 at 19:08:42, a magnitude 4.5 (4.5 MW, Depth: 3.1 mi) earthquake occurred 187.1 miles away from the city center Magnitude types: moment magnitude (MW) Natural disasters: The number of natural disasters in Leavenworth County (20) is greater than the US average (15).Major Disasters (Presidential) Declared: 15Emergencies Declared: 3Floods: 14, Storms: 11, Tornadoes: 6, Winter Storms: 4, Heavy Rain: 1, Hurricane: 1, Ice Storm: 1, Landslide: 1, Mudslide: 1, Snowstorm: 1, Wind: 1, Other: 1 (Note: some incidents may be assigned to more than one category). Hospitals in Leavenworth: CUSHING MEMORIAL HOSPITAL (Voluntary non-profit - Private, provides emergency services, 711 MARSHALL STREET) SAINT JOHN HOSPITAL (Voluntary non-profit - Other, 3500 SOUTH 4TH STREET) SUNFLOWER HEALTH CARE INC (3601 S 4TH STREET STE 2) VA EASTERN KANSAS HEALTHCARE SYSTEM (Government Federal, 4101 S. 4TH STREET) Nursing Homes in Leavenworth: BROADWAY HEIGHTS OF LEAVENWORTH COUNTY (1830 S BROADWAY ST) COUNTRY CARE ON BROADWAY (1830 S BROADWAY ST) LEAVENWORTH CO CONV INFIRMARY (BROADWAY AND REES) MEDICALODGES LEAVENWORTH (1503 OHIO ST) ST JOHN HOSPITAL SNF (3500 S 4TH ST) Dialysis Facilities in Leavenworth: LEAVENWORTH DIALYSIS (501 OAK ST) Home Health Centers in Leavenworth: CUSHING COMMUNITY HOME HEALTH (920 6TH AVE)
College/University in Leavenworth: University of Saint Mary Full-time enrollment: 937; Location: 4100 S 4th St Trafficway; Private, not-for-profit; Website: www.stmary.edu; Offers Doctor's degree )
Colleges/universities with over 2000 students nearest to Leavenworth:
Grantham University (about 15 miles; Kansas City, MO ; Full-time enrollment: 8,385)
Park University (about 16 miles; Parkville, MO ; FT enrollment: 9,131)
Kansas City Kansas Community College (about 16 miles; Kansas City, KS ; FT enrollment: 4,718)
Metropolitan Community College-Kansas City (about 25 miles; Kansas City, MO ; FT enrollment: 12,834)
University of Missouri-Kansas City (about 27 miles; Kansas City, MO ; FT enrollment: 10,544)
Rockhurst University (about 27 miles; Kansas City, MO ; FT enrollment: 2,013)
Johnson County Community College (about 29 miles; Overland Park, KS ; FT enrollment: 11,976)
Public high school in Leavenworth:
Public elementary/middle schools in Leavenworth: MACARTHUR ELEM Students: 410, Location: BIDDLE BLVD., Grades: PK-6)BRADLEY ELEM Students: 398, Location: 7TH CAVALRY ROAD, Grades: KG-6)EISENHOWER ELEM Location: KING AND LIGGETT, Grades: PK-6)
See full list of schools located in Leavenworth Library in Leavenworth: LEAVENWORTH PUBLIC LIBRARY Operating income: $1,126,676; Location: 417 SPRUCE STREET; 113,648 books ; 256 e-books ; 3,788 audio materials ; 4,357 video materials ; 14 local licensed databases ; 30 state licensed databases ; 90 print serial subscriptions )
Notable locations in Leavenworth: (A) , Dillon Plaza (B) , Midtown Centre (C) , Westside Plaza (D) , Leavenworth Industrial Park (E) , Leavenworth Wastewater Treatment Plant (F) , The Oaks Golf Club (G) , Trails West Golf Course (H) , Stockholm Hall (I) , Westside Village (J) , Leavenworth Plaza (K) , The Leavenworth Landing (L) , Leavenworth Area Business Center (M) , Leavenworth County Sheriff's Office (N) , KKLO - AM (Leavenworth) (O) , Leavenworth Police Department (P) , Leavenworth Justice Center (Q) , United States Penitentiary Leavenworth Kansas (R) , Frontier Army Museum (S) , Leavenworth County Historical Society Carroll House Museum (T) . Display/hide their locations on the map
Churches in Leavenworth include: (A) , Southern Heights United Methodist Church (B) , Wilson Avenue Church (C) , Church of Christ (D) , University of Saint Mary - Leavenworth Campus Annunciation Chapel (E) , Church of the Nazarene (F) , Grace Fellowship Church (G) , Saint Josephs Catholic Church (H) . Display/hide their locations on the map
Cemeteries: (1) , Fort Leavenworth National Cemetery (2) , Greenwood Cemetery (3) , Mount Olivet Cemetery (4) , United States Penitentiary in Leavenworth Cemetery (5) . Display/hide their locations on the map
Reservoirs: (A) , Smith Lake (B) , Lake Jeanette (C) . Display/hide their locations on the map
Creek: (A) . Display/hide its location on the map
Parks in Leavenworth include: (1) , Buffalo Bill Park (2) , Hawthorne Park (3) , Jefferson Park (4) , Miller Bicentennial Park (5) , Sportsman Field (6) , Veterans Administration Park (7) , Wollman Park (8) , Riverfront Park (9) . Display/hide their locations on the map
Tourist attractions: (1) , Leavenworth's Carroll Mansion (Cultural Attractions- Events- & Facilities; 1128 5th Avenue) (2) , Richard Allen Cultural Center (Cultural Attractions- Events- & Facilities; 412 Kiowa Street) (3) , Leavenworth City - Community Development Dept- Public Housing Autho (Cultural Attractions- Events- & Facilities; 200 Shawnee Street) (4) , National Fred Harvey Museum (Cultural Attractions- Events- & Facilities; 743 Delaware Street) (5) . Display/hide their approximate locations on the map
Hotels: (1) , Ramada Inn Motor Hotel (3 And Delaware) (2) , Super 8 Motel (303 Montana Court) (3) , Days Inn Leavenworth (3211 South 4th Street) (4) , Commander's Inn (1118 North 6th Street) (5) , Hallmark Inns (3211 South 4th Street) (6) , Villager Lodge Leavenworth KS (3211 South 4th Street) (7) , Condotels Suites-Extended Stay (801 West Eisenhower Road) (8) , Masonic Hall AF Am (423 Delaware Street) (9) . Display/hide their approximate locations on the map
Courts: (1) , Leavenworth County - Clerk Of The District Court- Marriage License (601 South 3rd Street) (2) , Leavenworth County - Clerk Of The District Court- Probate Division (601 South 3rd Street) (3) , Leavenworth County - Clerk Of The District Court- Records Division (601 South 3rd Street) (4) , Leavenworth County - Clerk of the District Court (601 South 3rd Street) (5) , Leavenworth City - Municipal Court (601 South 3rd Street Suite 2055) (6) , Leavenworth County - Probation Departments City-County Probation- District Court Proba (601 South 3rd Street) (7) , Leavenworth County - Clerk Of The District Court- Domestic Division (601 South 3rd Street) (8) , Leavenworth County - Clerk Of The District Court- Criminal Division (601 South 3rd Street) (9) . Display/hide their approximate locations on the map
Birthplace of: Doug Lamborn - Politician, Richard J. Seitz - Recipient of the Purple Heart medal, Clift Andrus - Soilder, David C. Schilling - World War II flying ace, Duff Cooley - Baseball player, Joseph W. Bettendorf - Industrialist, Neil Dougherty - Basketball player-coach, R. H. Barlow - Anthropologist, Thomas Greason - Politician, Walter Nelles - Lawyer.
Leavenworth County has a predicted average indoor radon screening level greater than 4 pCi/L (pico curies per liter) - Highest Potential Drinking water stations with addresses in Leavenworth and their reported violations in the past:
LEAVENWORTH CO RWD 5 (Population served: 740, Purch surface water):
Past monitoring violations:
Failure Submit IDSE/Subpart V Plan Rpt - In JAN-02-2010, Contaminant: DBP STAGE 2. Follow-up actions: Fed FAO issued (APR-26-2010), Fed Public Notif requested (APR-26-2010), Fed Compliance achieved (MAR-24-2011)
Monitoring, Routine (IDSE) - Between OCT-2008 and SEP-2009, Contaminant: TTHM. Follow-up actions: Fed FAO issued (APR-26-2010), Fed Public Notif requested (APR-26-2010), Fed Compliance achieved (MAR-24-2011)
Monitoring, Routine (IDSE) - Between OCT-2008 and SEP-2009, Contaminant: Total Haloacetic Acids (HAA5). Follow-up actions: Fed FAO issued (APR-26-2010), Fed Public Notif requested (APR-26-2010), Fed Compliance achieved (MAR-24-2011)
4 minor monitoring violations
Population served: 483, Purch surface water):
Past monitoring violations:
2 minor monitoring violations
Population served: 40, Purch surface water):
Past health violations:
MCL, Monthly (TCR) - In FEB-2013, Contaminant: Coliform. Follow-up actions: St Public Notif requested (FEB-19-2013), St Violation/Reminder Notice (FEB-19-2013), St Compliance achieved (MAR-31-2013)
Past monitoring violations:
2 minor monitoring violations
Drinking water stations with addresses in Leavenworth that have no violations reported:
LEAVENWORTH WATER DEPARTMENT (Population served: 35,816, Primary Water Source Type: Surface water)
Average household size: This city:
2.5 peopleKansas:
2.5 people
Percentage of family households: This city:
66.3%Whole state:
66.0%
Percentage of households with unmarried partners: This city:
6.1%Whole state:
5.8%
Likely homosexual households (counted as self-reported same-sex unmarried-partner households)
Lesbian couples: 0.3% of all households Gay men: 0.2% of all households
People in group quarters in Leavenworth in 2010:
2,039 people in federal prisons
799 people in federal detention centers
442 people in military disciplinary barracks and jails
197 people in residential treatment centers for adults
192 people in military barracks and dormitories (nondisciplinary)
148 people in college/university student housing
120 people in other noninstitutional facilities
72 people in nursing facilities/skilled-nursing facilities
15 people in group homes intended for adults
7 people in emergency and transitional shelters (with sleeping facilities) for people experiencing homelessness
People in group quarters in Leavenworth in 2000:
2,249 people in federal prisons and detention centers
508 people in military disciplinary barracks
320 people in other types of correctional institutions
214 people in college dormitories (includes college quarters off campus)
214 people in military barracks, etc.
157 people in nursing homes
147 people in mental (psychiatric) hospitals or wards
144 people in other nonhousehold living situations
64 people in local jails and other confinement facilities (including police lockups)
44 people in other noninstitutional group quarters
25 people in homes for the mentally retarded
12 people in wards in general hospitals for patients who have no usual home elsewhere
5 people in unknown juvenile institutions
Banks with branches in Leavenworth (2011 data):
Country Club Bank: Leavenworth-Delaware Branch, Leavenworth-Chestnut Branch, Leavenworth-South Branch. Info updated 2011/11/18: Bank assets: $1,042.5 mil, Deposits: $860.6 mil, headquarters in Kansas City, MO, positive income , Commercial Lending Specialization, 26 total offices , Holding Company: Ccb Financial Corporation
Exchange National Bank & Trust Co.: 630 Delaware Branch, Drive-In Branch, First National South Branch. Info updated 2011/06/13: Bank assets: $330.5 mil, Deposits: $286.5 mil, headquarters in Atchison, KS, positive income , 10 total offices , Holding Company: Exchange Bankshares Corporation Of Kansas
Armed Forces Bank, National Association: Leavenworth Limit Branch # 32 at 2901 South 4th Street, branch established on 1995/05/01; Motor Branch at 615 Metropolitan Avenue, branch established on 1980/12/31. Info updated 2010/12/16: Bank assets: $1,839.7 mil, Deposits: $1,387.5 mil, headquarters in Fort Leavenworth, KS, negative income in the last year , Commercial Lending Specialization, 78 total offices , Holding Company: Dickinson Financial Corporation Ii
Mutual Savings Association, FSA: Mutual Savings Association, Fsa at 100 South 4th St, branch established on 1888/01/01; Leavenworth Plaza Shopping Center Br at 3400 South Fourth Street, branch established on 1888/01/01. Info updated 2011/07/21: Bank assets: $217.9 mil, Deposits: $159.3 mil, local headquarters , negative income in the last year , Mortgage Lending Specialization, 6 total offices
Citizens Savings and Loan Association, FSB: Citizens Savings And Loan Association, Fsb at 5151 S 4th Street Trafficway, branch established on 1884/01/01; 312 South Fifth Street Branch at 312 South Fifth St, branch established on 1884/01/01. Info updated 2011/07/21: Bank assets: $190.8 mil, Deposits: $123.9 mil, local headquarters , positive income , Mortgage Lending Specialization, 3 total offices
Commerce Bank: Leavenworth Main Branch at 2830 S 4th Street, branch established on 1984/07/02; Leavenworth Boadway Branch at 200 N Broadway, branch established on 1966/02/14. Info updated 2011/07/07: Bank assets: $20,493.6 mil, Deposits: $16,805.3 mil, headquarters in Kansas City, MO, positive income , 206 total offices , Holding Company: Commerce Bancshares, Inc.
The Citizens National Bank: Leavenworth Branch at 601 Delaware, branch established on 1993/09/27. Info updated 2006/11/03: Bank assets: $176.3 mil, Deposits: $159.0 mil, headquarters in Greenleaf, KS, positive income , Agricultural Specialization, 7 total offices , Holding Company: Padgett Agency, Inc.
For population 15 years and over in Leavenworth:
Never married: 26.3%Now married: 49.4%Separated: 3.3%Widowed: 5.3%Divorced: 15.8% For population 25 years and over in Leavenworth:
High school or higher: 92.2%Bachelor's degree or higher: 33.8%Graduate or professional degree: 15.3%Unemployed: 4.6%Mean travel time to work (commute): 17.1 minutes
Education Gini index (Inequality in education) Here:
10.3Kansas average:
11.5
Religion statistics for Leavenworth, KS (based on Leavenworth County data)
Religion Adherents Congregations Catholic 9,321 7 Evangelical Protestant 7,953 44 Mainline Protestant 5,094 19 Other 1,869 8 Black Protestant 579 4 None 51,411 -
Source: Clifford Grammich, Kirk Hadaway, Richard Houseal, Dale E.Jones, Alexei Krindatch, Richie Stanley and Richard H.Taylor. 2012. 2010 U.S.Religion Census: Religious Congregations & Membership Study. Association of Statisticians of American Religious Bodies. Jones, Dale E., et al. 2002. Congregations and Membership in the United States 2000. Nashville, TN: Glenmary Research Center. Graphs represent county-level data
Food Environment Statistics: Number of grocery stores : 6Leavenworth County :
0.82 / 10,000 pop.Kansas :
1.96 / 10,000 pop.
Number of convenience stores (no gas) : 1Leavenworth County :
0.14 / 10,000 pop.Kansas :
0.51 / 10,000 pop.
Number of convenience stores (with gas) : 24This county :
3.26 / 10,000 pop.Kansas :
3.84 / 10,000 pop.
Number of full-service restaurants : 32Leavenworth County :
4.35 / 10,000 pop.State :
7.33 / 10,000 pop.
Adult diabetes rate : Leavenworth County :
7.8%Kansas :
8.1%
Low-income preschool obesity rate : Leavenworth County :
13.9%State :
13.4%
Health and Nutrition: Healthy diet rate : Leavenworth:
50.5%Kansas:
49.2%
Average overall health of teeth and gums : Leavenworth:
49.1%Kansas:
46.3%
Average BMI : This city:
28.8Kansas:
28.6
People feeling badly about themselves : People not drinking alcohol at all : This city:
10.2%State:
10.5%
Average hours sleeping at night : Overweight people : Leavenworth:
33.8%Kansas:
33.5%
General health condition : This city:
58.4%State:
56.0%
Average condition of hearing : This city:
81.1%Kansas:
78.6%
More about Health and Nutrition of Leavenworth, KS Residents
Local government employment and payroll (March 2022)
Function
Full-time employees
Monthly full-time payroll
Average yearly full-time wage
Part-time employees
Monthly part-time payroll
Firefighters
55 $243,891 $53,213 0 $0 Police Protection - Officers
50 $243,317 $58,396 0 $0 Parks and Recreation
15 $61,406 $49,125 43 $31,730 Solid Waste Management
13 $42,061 $38,826 0 $0 Police - Other
11 $56,304 $61,423 0 $0 Streets and Highways
11 $40,774 $44,481 0 $0 Sewerage
8 $28,060 $42,090 0 $0 Financial Administration
7 $40,510 $69,446 12 $18,657 Judicial and Legal
6 $26,596 $53,192 5 $3,225 Fire - Other
5 $33,108 $79,459 0 $0 Housing and Community Development (Local)
5 $19,981 $47,954 0 $0 Other Government Administration
4 $20,369 $61,107 5 $883
Totals for Government
190 $856,378 $54,087 65 $54,495
Leavenworth government finances - Expenditure in 2021 (per resident):
Construction - Regular Highways: $6,144,000 ($165.69)
Current Operations - Police Protection: $7,619,000 ($205.47)
Local Fire Protection: $4,754,000 ($128.21)General - Other: $3,676,000 ($99.13)Housing and Community Development: $3,371,000 ($90.91)Sewerage: $2,902,000 ($78.26)Libraries: $2,480,000 ($66.88)Central Staff Services: $2,053,000 ($55.37)Parks and Recreation: $2,010,000 ($54.21)Solid Waste Management: $1,829,000 ($49.32)Regular Highways: $1,565,000 ($42.20)Financial Administration: $494,000 ($13.32)Judicial and Legal Services: $428,000 ($11.54)Protective Inspection and Regulation - Other: $308,000 ($8.31)Corrections - Other: $188,000 ($5.07)Public Welfare - Other: $184,000 ($4.96)Air Transportation: $94,000 ($2.53)Health - Other: $46,000 ($1.24)General - Interest on Debt: $1,018,000 ($27.45)
Other Capital Outlay - Sewerage: $1,771,000 ($47.76)
Housing and Community Development: $605,000 ($16.32)Parks and Recreation: $568,000 ($15.32)Police Protection: $382,000 ($10.30)Solid Waste Management: $194,000 ($5.23)General Public Building: $184,000 ($4.96)General - Other: $52,000 ($1.40)Local Fire Protection: $17,000 ($0.46)Total Salaries and Wages: $13,967,000 ($376.66)
Leavenworth government finances - Revenue in 2021 (per resident):
Charges - Sewerage: $4,771,000 ($128.66)
Solid Waste Management: $2,300,000 ($62.03)Other: $1,287,000 ($34.71)Housing and Community Development: $384,000 ($10.36)Parks and Recreation: $176,000 ($4.75)Air Transportation: $2,000 ($0.05)Federal Intergovernmental - General Local Government Support: $6,898,000 ($186.03)
Housing and Community Development: $2,296,000 ($61.92)Other: $500,000 ($13.48)Local Intergovernmental - Other: $2,784,000 ($75.08)
Miscellaneous - Fines and Forfeits: $561,000 ($15.13)
General Revenue - Other: $159,000 ($4.29)Interest Earnings: $157,000 ($4.23)Sale of Property: $58,000 ($1.56)Rents: $58,000 ($1.56)Donations From Private Sources: $37,000 ($1.00)State Intergovernmental - Highways: $1,109,000 ($29.91)
Other: $291,000 ($7.85)General Local Government Support: $159,000 ($4.29)Tax - General Sales and Gross Receipts: $12,642,000 ($340.93)
Property: $9,677,000 ($260.97)Public Utilities Sales: $2,600,000 ($70.12)Other License: $612,000 ($16.50)Other Selective Sales: $383,000 ($10.33)Occupation and Business License - Other: $77,000 ($2.08)
Leavenworth government finances - Debt in 2021 (per resident):
Long Term Debt - Outstanding Unspecified Public Purpose: $24,940,000 ($672.58)
Beginning Outstanding - Unspecified Public Purpose: $24,705,000 ($666.24)Issue, Unspecified Public Purpose: $7,900,000 ($213.05)Retired Unspecified Public Purpose: $7,665,000 ($206.71)Beginning Outstanding - Public Debt for Private Purpose: $1,197,000 ($32.28)Outstanding Nonguaranteed - Industrial Revenue: $1,061,000 ($28.61)Retired Nonguaranteed - Public Debt for Private Purpose: $135,000 ($3.64)Short Term Debt Outstanding - Beginning: $9,185,000 ($247.70)
End of Fiscal Year: $7,835,000 ($211.29)
Leavenworth government finances - Cash and Securities in 2021 (per resident):
Bond Funds - Cash and Securities: $2,530,000 ($68.23)
Other Funds - Cash and Securities: $24,156,000 ($651.44)
Sinking Funds - Cash and Securities: $1,422,000 ($38.35)
10.92% of this county's 2021 resident taxpayers lived in other counties in 2020 ($74,110 average adjusted gross income )
Here:
10.92%Kansas average:
6.64%
0.31% of residents moved from foreign countries ($2,028 average AGI )Leavenworth County:
0.31%Kansas average:
0.04%
Top counties from which taxpayers relocated into this county between 2020 and 2021:
10.24% of this county's 2020 resident taxpayers moved to other counties in 2021 ($64,678 average adjusted gross income )
Here:
10.24%Kansas average:
6.88%
0.23% of residents moved to foreign countries ($2,050 average AGI )Leavenworth County:
0.23%Kansas average:
0.03%
Top counties to which taxpayers relocated from this county between 2020 and 2021:
Businesses in Leavenworth, KS
Name Count Name Count
7-Eleven 1 Kroger 1 Ace Hardware 1 La-Z-Boy 1 Advance Auto Parts 1 Little Caesars Pizza 1 Applebee's 1 Long John Silver's 1 AutoZone 1 Maurices 1 CVS 1 McDonald's 1 Chevrolet 1 Papa John's Pizza 1 Cricket Wireless 1 Payless 1 Curves 1 Pizza Hut 1 DHL 1 Quiznos 1 Dairy Queen 1 RadioShack 1 Days Inn 1 SONIC Drive-In 2 Domino's Pizza 1 Sears 1 FedEx 7 Sprint Nextel 1 Firestone Complete Auto Care 1 Starbucks 1 Ford 1 Subway 4 GNC 1 Super 8 1 GameStop 1 T-Mobile 2 Goodwill 1 Taco Bell 1 H&R Block 1 U-Haul 2 Hardee's 1 UPS 4 Home Depot 1 Walgreens 1 KFC 1 Walmart 1 Kmart 1 Wendy's 1
Strongest AM radio stations in Leavenworth:
KKLO (1410 AM; 5 kW; LEAVENWORTH, KS; Owner: CHARA COMMUNICATIONS, INC.)
WHB (810 AM; 50 kW; KANSAS CITY, MO; Owner: UNION BROADCASTING, INC.)
KKHK (1250 AM; 25 kW; KANSAS CITY, KS)
KCMO (710 AM; 10 kW; KANSAS CITY, MO; Owner: SUSQUEHANNA KANSAS CITY PARTNERSHIP)
KCSP (610 AM; 5 kW; KANSAS CITY, MO; Owner: ENTERCOM KANSAS CITY LICENSE, LLC)
KXTR (1660 AM; 10 kW; KANSAS CITY, KS; Owner: ENTERCOM KANSAS CITY LICENSE, LLC)
KCCV (760 AM; daytime; 6 kW; OVERLAND PARK, KS; Owner: BOTT BROADCASTING COMPANY)
KMBZ (980 AM; 5 kW; KANSAS CITY, MO; Owner: ENTERCOM KANSAS CITY LICENSE, LLC)
KCTE (1510 AM; daytime; 10 kW; INDEPENDENCE, MO; Owner: UNION BROADCASTING, INC.)
KPHN (1190 AM; 5 kW; KANSAS CITY, MO; Owner: ABC, INC.)
KFEQ (680 AM; 5 kW; ST. JOSEPH, MO; Owner: EAGLE RADIO, INC.)
KCNW (1380 AM; 2 kW; FAIRWAY, KS; Owner: KANSAS CITY RADIO, INC.)
KSFT (1550 AM; 5 kW; ST. JOSEPH, MO; Owner: EAGLE RADIO, INC)
Strongest FM radio stations in Leavenworth:
KFKF-FM (94.1 FM; KANSAS CITY, KS; Owner: INFINITY RADIO SUBSIDIARY OPERATIONS INC.)
KZPL (97.3 FM; LEE'S SUMMIT, MO; Owner: UNION FIRST BROADCASTING, LLC)
KCMO-FM (94.9 FM; KANSAS CITY, MO; Owner: SUSQUEHANNA KANSAS CITY PARTNERSHIP)
KSRC (102.1 FM; KANSAS CITY, MO; Owner: INFINITY RADIO OPERATIONS INC.)
WDAF-FM (106.5 FM; LIBERTY, MO; Owner: ENTERCOM KANSAS CITY LICENSE, LLC)
KUDL (98.1 FM; KANSAS CITY, KS; Owner: ENTERCOM KANSAS CITY LICENSE, LLC)
KQRC-FM (98.9 FM; LEAVENWORTH, KS; Owner: ENTERCOM KANSAS CITY LICENSE, LLC)
KRBZ (96.5 FM; KANSAS CITY, MO; Owner: ENTERCOM KANSAS CITY LICENSE, LLC)
KYYS (99.7 FM; KANSAS CITY, MO; Owner: ENTERCOM KANSAS CITY LICENSE, LLC)
KBEQ-FM (104.3 FM; KANSAS CITY, MO; Owner: INFINITY RADIO SUBSIDIARY OPERATIONS INC.)
KMXV (93.3 FM; KANSAS CITY, MO; Owner: INFINITY RADIO OPERATIONS INC.)
KKJO-FM (105.5 FM; ST. JOSEPH, MO; Owner: EAGLE RADIO, INC)
KPRS (103.3 FM; KANSAS CITY, MO; Owner: CARTER BROADCAST GROUP, INC.)
KCUR-FM (89.3 FM; KANSAS CITY, MO; Owner: CURATORS OF UNIVERSITY OF MISSOURI)
KLJC (88.5 FM; KANSAS CITY, MO; Owner: CALVARY BIBLE COLLEGE)
KCCV-FM (92.3 FM; OLATHE, KS; Owner: BOTT BROADCASTING COMPANY)
KANU (91.5 FM; LAWRENCE, KS; Owner: UNIVERSITY OF KANSAS)
KLZR (105.9 FM; LAWRENCE, KS; Owner: ZIMMER RADIO OF MID-MISSOURI, INC)
KCFX (101.1 FM; HARRISONVILLE, MO; Owner: SUSQUEHANNA KANSAS CITY PARTNERSHIP)
KKFI (90.1 FM; KANSAS CITY, MO; Owner: MID-COAST RADIO PROJECT, INC.)
TV broadcast stations around Leavenworth:
KCTV (Channel 5; KANSAS CITY, MO; Owner: MEREDITH CORPORATION)
KMBC-TV (Channel 9; KANSAS CITY, MO; Owner: KMBC HEARST-ARGYLE TELEVISION, INC.)
KSHB-TV (Channel 41; KANSAS CITY, MO; Owner: SCRIPPS HOWARD BROADCASTING COMPANY)
WDAF-TV (Channel 4; KANSAS CITY, MO; Owner: WDAF LICENSE, INC.)
KTAJ (Channel 16; ST. JOSEPH, MO; Owner: TRINITY BROADCASTING NETWORK)
KCPT (Channel 19; KANSAS CITY, MO; Owner: PUBLIC TELEVISION 19, INC.)
KCWE (Channel 29; KANSAS CITY, MO; Owner: KCWE-TV, INC.)
KSMO-TV (Channel 62; KANSAS CITY, MO; Owner: KSMO LICENSEE, INC.)
KPXE (Channel 50; KANSAS CITY, MO; Owner: PAXSON KANSAS CITY LICENSE, INC.)
KMCI (Channel 38; LAWRENCE, KS; Owner: SCRIPPS HOWARD BROADCASTING COMPANY)
K48FS (Channel 48; KANSAS CITY, MO; Owner: WORD OF GOD FELLOWSHIP, INC.)
K35CT (Channel 35; KANSAS CITY, MO; Owner: WORD OF GOD FELLOWSHIP, INC.)
KQTV (Channel 2; ST. JOSEPH, MO; Owner: NEXSTAR BROADCASTING OF THE MIDWEST, INC.)
K26CR (Channel 26; KANSAS CITY, MO; Owner: VENTANA TELEVISION, INC.)
Medal of Honor Recipients
Medal of Honor Recipient born in Leavenworth: Joseph Henderson.
National Bridge Inventory (NBI) Statistics 45 Number of bridges577ft / 176m Total length $923,000 Total costs154,311 Total average daily traffic9,793 Total average daily truck traffic181,381 Total future (year 2030) average daily traffic
New bridges - historical statistics
1 1910-1919 2 1930-1939 5 1950-1959 5 1960-1969 4 1970-1979 12 1980-1989 9 1990-1999 3 2000-2009 4 2010-2019
See full National Bridge Inventory statistics for Leavenworth, KS
Home Mortgage Disclosure Act Aggregated Statistics For Year 2009(Based on 5 full and 5 partial tracts) A) FHA, FSA/RHS & VA B) Conventional C) Refinancings D) Home Improvement Loans E) Loans on Dwellings For 5+ Families F) Non-occupant Loans on G) Loans On Manufactured Number Average Value Number Average Value Number Average Value Number Average Value Number Average Value Number Average Value Number Average Value
LOANS ORIGINATED 155 $129,032 108 $99,742 378 $123,003 72 $57,531 4 $1,071,622 86 $78,805 2 $33,500 APPLICATIONS APPROVED, NOT ACCEPTED 2 $127,055 2 $68,020 37 $121,600 7 $26,503 0 $0 2 $67,635 0 $0 APPLICATIONS DENIED 17 $101,876 20 $106,954 156 $117,597 34 $21,389 0 $0 21 $82,681 0 $0 APPLICATIONS WITHDRAWN 19 $114,732 14 $94,511 102 $120,860 9 $66,873 0 $0 7 $105,999 1 $14,250 FILES CLOSED FOR INCOMPLETENESS 1 $78,870 3 $106,403 19 $134,774 1 $35,650 0 $0 2 $47,105 0 $0
Aggregated Statistics For Year 2008(Based on 5 full and 5 partial tracts) A) FHA, FSA/RHS & VA B) Conventional C) Refinancings D) Home Improvement Loans E) Loans on Dwellings For 5+ Families F) Non-occupant Loans on G) Loans On Manufactured Number Average Value Number Average Value Number Average Value Number Average Value Number Average Value Number Average Value Number Average Value
LOANS ORIGINATED 152 $133,508 175 $102,113 286 $109,088 68 $44,872 3 $229,697 105 $80,100 2 $17,670 APPLICATIONS APPROVED, NOT ACCEPTED 5 $82,226 9 $80,330 26 $118,582 13 $25,659 0 $0 6 $95,433 1 $59,860 APPLICATIONS DENIED 12 $108,186 32 $70,026 218 $113,284 48 $26,146 2 $289,045 13 $88,174 3 $32,763 APPLICATIONS WITHDRAWN 19 $112,778 22 $86,147 91 $115,330 11 $46,701 0 $0 8 $63,296 0 $0 FILES CLOSED FOR INCOMPLETENESS 1 $253,720 1 $267,260 20 $125,355 3 $45,837 0 $0 1 $230,850 0 $0
Aggregated Statistics For Year 2007(Based on 5 full and 5 partial tracts) A) FHA, FSA/RHS & VA B) Conventional C) Refinancings D) Home Improvement Loans E) Loans on Dwellings For 5+ Families F) Non-occupant Loans on G) Loans On Manufactured Number Average Value Number Average Value Number Average Value Number Average Value Number Average Value Number Average Value Number Average Value
LOANS ORIGINATED 106 $131,230 320 $97,477 397 $99,259 104 $38,407 3 $198,097 140 $82,915 3 $36,267 APPLICATIONS APPROVED, NOT ACCEPTED 1 $188,000 13 $125,992 68 $105,521 14 $24,979 3 $84,333 10 $79,587 0 $0 APPLICATIONS DENIED 21 $96,305 63 $93,675 363 $102,464 87 $41,575 0 $0 43 $78,785 8 $37,789 APPLICATIONS WITHDRAWN 10 $142,214 38 $106,895 160 $101,607 9 $50,066 0 $0 19 $87,131 0 $0 FILES CLOSED FOR INCOMPLETENESS 0 $0 5 $122,772 48 $111,304 0 $0 0 $0 2 $75,860 0 $0
Aggregated Statistics For Year 2006(Based on 5 full and 5 partial tracts) A) FHA, FSA/RHS & VA B) Conventional C) Refinancings D) Home Improvement Loans E) Loans on Dwellings For 5+ Families F) Non-occupant Loans on G) Loans On Manufactured Number Average Value Number Average Value Number Average Value Number Average Value Number Average Value Number Average Value Number Average Value
LOANS ORIGINATED 123 $136,961 439 $90,540 469 $90,006 119 $40,395 2 $411,000 170 $82,478 4 $39,895 APPLICATIONS APPROVED, NOT ACCEPTED 1 $92,000 56 $81,871 91 $90,042 10 $33,519 0 $0 20 $96,226 3 $23,430 APPLICATIONS DENIED 3 $135,493 128 $96,152 480 $92,296 84 $48,978 3 $112,810 51 $130,333 8 $32,480 APPLICATIONS WITHDRAWN 10 $133,224 81 $100,795 309 $96,971 25 $55,581 0 $0 33 $98,535 0 $0 FILES CLOSED FOR INCOMPLETENESS 0 $0 25 $92,005 58 $104,849 1 $23,750 0 $0 3 $74,583 0 $0
Aggregated Statistics For Year 2005(Based on 5 full and 5 partial tracts) A) FHA, FSA/RHS & VA B) Conventional C) Refinancings D) Home Improvement Loans E) Loans on Dwellings For 5+ Families F) Non-occupant Loans on G) Loans On Manufactured Number Average Value Number Average Value Number Average Value Number Average Value Number Average Value Number Average Value Number Average Value
LOANS ORIGINATED 110 $139,237 495 $93,102 573 $93,864 118 $37,182 2 $144,425 175 $81,333 1 $46,820 APPLICATIONS APPROVED, NOT ACCEPTED 2 $94,555 49 $70,913 85 $104,301 14 $32,091 0 $0 10 $79,323 2 $36,915 APPLICATIONS DENIED 11 $103,208 150 $82,206 499 $95,853 91 $38,673 1 $4,600,000 69 $88,287 15 $36,512 APPLICATIONS WITHDRAWN 15 $105,034 96 $93,461 343 $99,789 50 $91,870 1 $93,590 40 $91,146 1 $90,000 FILES CLOSED FOR INCOMPLETENESS 0 $0 21 $93,073 52 $105,984 4 $34,580 0 $0 7 $86,067 0 $0
Aggregated Statistics For Year 2004(Based on 5 full and 5 partial tracts) A) FHA, FSA/RHS & VA B) Conventional C) Refinancings D) Home Improvement Loans E) Loans on Dwellings For 5+ Families F) Non-occupant Loans on G) Loans On Manufactured Number Average Value Number Average Value Number Average Value Number Average Value Number Average Value Number Average Value Number Average Value
LOANS ORIGINATED 105 $117,397 414 $93,717 693 $88,372 133 $33,190 6 $426,435 222 $78,155 0 $0 APPLICATIONS APPROVED, NOT ACCEPTED 2 $96,905 35 $84,723 104 $95,692 11 $40,105 0 $0 5 $66,474 3 $58,217 APPLICATIONS DENIED 12 $119,409 108 $87,630 476 $86,976 71 $25,177 0 $0 48 $105,583 5 $72,402 APPLICATIONS WITHDRAWN 5 $126,224 49 $89,243 373 $92,777 30 $56,076 0 $0 30 $93,681 2 $48,155 FILES CLOSED FOR INCOMPLETENESS 0 $0 13 $88,374 95 $103,546 4 $37,012 0 $0 2 $102,025 0 $0
Aggregated Statistics For Year 2003(Based on 5 full and 5 partial tracts) A) FHA, FSA/RHS & VA B) Conventional C) Refinancings D) Home Improvement Loans E) Loans on Dwellings For 5+ Families F) Non-occupant Loans on Number Average Value Number Average Value Number Average Value Number Average Value Number Average Value Number Average Value
LOANS ORIGINATED 101 $109,980 353 $87,068 1,078 $92,662 68 $19,661 3 $270,860 225 $73,506 APPLICATIONS APPROVED, NOT ACCEPTED 4 $111,245 24 $92,131 109 $92,531 14 $19,726 0 $0 18 $76,518 APPLICATIONS DENIED 5 $94,322 78 $76,368 470 $83,089 46 $25,501 0 $0 33 $65,118 APPLICATIONS WITHDRAWN 9 $95,427 68 $84,532 347 $90,202 8 $31,230 0 $0 19 $56,362 FILES CLOSED FOR INCOMPLETENESS 2 $94,000 8 $67,282 58 $96,875 1 $47,780 0 $0 5 $104,154
Aggregated Statistics For Year 2002(Based on 4 full and 2 partial tracts) A) FHA, FSA/RHS & VA B) Conventional C) Refinancings D) Home Improvement Loans E) Loans on Dwellings For 5+ Families F) Non-occupant Loans on Number Average Value Number Average Value Number Average Value Number Average Value Number Average Value Number Average Value
LOANS ORIGINATED 89 $94,758 311 $81,041 654 $82,181 92 $19,831 9 $225,194 147 $60,821 APPLICATIONS APPROVED, NOT ACCEPTED 3 $44,487 16 $61,492 70 $87,839 13 $24,354 0 $0 8 $64,901 APPLICATIONS DENIED 11 $73,215 49 $60,980 244 $71,328 48 $13,600 0 $0 21 $57,932 APPLICATIONS WITHDRAWN 7 $108,159 33 $76,048 289 $77,037 11 $24,263 1 $802,170 10 $56,536 FILES CLOSED FOR INCOMPLETENESS 2 $66,785 7 $73,486 112 $82,216 3 $18,667 0 $0 9 $51,948
Aggregated Statistics For Year 2001(Based on 4 full and 2 partial tracts) A) FHA, FSA/RHS & VA B) Conventional C) Refinancings D) Home Improvement Loans E) Loans on Dwellings For 5+ Families F) Non-occupant Loans on Number Average Value Number Average Value Number Average Value Number Average Value Number Average Value Number Average Value
LOANS ORIGINATED 137 $94,313 269 $75,108 505 $79,983 111 $15,104 3 $248,333 115 $73,712 APPLICATIONS APPROVED, NOT ACCEPTED 2 $109,415 15 $59,050 50 $68,210 5 $33,534 0 $0 3 $58,790 APPLICATIONS DENIED 13 $67,379 57 $48,604 271 $62,020 53 $15,902 0 $0 14 $55,669 APPLICATIONS WITHDRAWN 7 $77,056 42 $64,623 262 $72,434 13 $19,418 0 $0 12 $46,980 FILES CLOSED FOR INCOMPLETENESS 3 $89,333 5 $60,660 51 $73,998 1 $5,000 0 $0 5 $55,396
Aggregated Statistics For Year 2000(Based on 4 full and 2 partial tracts) A) FHA, FSA/RHS & VA B) Conventional C) Refinancings D) Home Improvement Loans E) Loans on Dwellings For 5+ Families F) Non-occupant Loans on Number Average Value Number Average Value Number Average Value Number Average Value Number Average Value Number Average Value
LOANS ORIGINATED 121 $82,974 305 $67,516 262 $56,276 126 $14,982 6 $129,710 139 $50,246 APPLICATIONS APPROVED, NOT ACCEPTED 0 $0 24 $60,922 35 $56,531 30 $17,856 0 $0 4 $42,418 APPLICATIONS DENIED 12 $54,338 84 $45,663 165 $51,393 62 $15,805 0 $0 12 $42,513 APPLICATIONS WITHDRAWN 9 $79,374 26 $72,170 82 $49,538 6 $23,202 0 $0 7 $48,380 FILES CLOSED FOR INCOMPLETENESS 3 $43,970 12 $51,667 30 $66,242 3 $15,000 0 $0 2 $85,000
Aggregated Statistics For Year 1999(Based on 4 full and 5 partial tracts) A) FHA, FSA/RHS & VA B) Conventional C) Refinancings D) Home Improvement Loans E) Loans on Dwellings For 5+ Families F) Non-occupant Loans on Number Average Value Number Average Value Number Average Value Number Average Value Number Average Value Number Average Value
LOANS ORIGINATED 156 $76,122 299 $66,544 448 $61,885 142 $13,121 4 $753,510 137 $56,644 APPLICATIONS APPROVED, NOT ACCEPTED 1 $64,280 23 $52,692 47 $58,542 24 $11,983 0 $0 8 $57,795 APPLICATIONS DENIED 10 $63,905 109 $44,826 179 $57,476 80 $13,365 1 $933,040 24 $48,655 APPLICATIONS WITHDRAWN 11 $60,436 33 $69,898 129 $57,959 6 $10,407 0 $0 10 $57,506 FILES CLOSED FOR INCOMPLETENESS 0 $0 7 $49,659 23 $74,247 3 $18,683 0 $0 2 $54,120
Detailed mortgage data for all 10 tracts in Leavenworth, KS
Private Mortgage Insurance Companies Aggregated Statistics For Year 2009(Based on 4 full and 3 partial tracts) A) Conventional B) Refinancings C) Non-occupant Loans on Number Average Value Number Average Value Number Average Value
LOANS ORIGINATED 26 $139,480 11 $173,426 0 $0 APPLICATIONS APPROVED, NOT ACCEPTED 10 $97,172 4 $152,962 2 $48,500 APPLICATIONS DENIED 2 $169,165 2 $128,135 0 $0 APPLICATIONS WITHDRAWN 0 $0 2 $128,355 0 $0 FILES CLOSED FOR INCOMPLETENESS 1 $66,000 0 $0 1 $66,000
Aggregated Statistics For Year 2008(Based on 4 full and 4 partial tracts) A) Conventional B) Refinancings C) Non-occupant Loans on Number Average Value Number Average Value Number Average Value
LOANS ORIGINATED 62 $119,120 32 $135,012 7 $89,334 APPLICATIONS APPROVED, NOT ACCEPTED 13 $114,525 15 $122,503 4 $128,113 APPLICATIONS DENIED 6 $103,670 2 $129,970 4 $87,135 APPLICATIONS WITHDRAWN 1 $257,000 2 $85,000 1 $57,000 FILES CLOSED FOR INCOMPLETENESS 0 $0 0 $0 0 $0
Aggregated Statistics For Year 2007(Based on 5 full and 4 partial tracts) A) Conventional B) Refinancings C) Non-occupant Loans on Number Average Value Number Average Value Number Average Value
LOANS ORIGINATED 114 $99,751 59 $117,652 11 $72,485 APPLICATIONS APPROVED, NOT ACCEPTED 8 $107,321 8 $158,334 1 $116,100 APPLICATIONS DENIED 1 $72,850 0 $0 0 $0 APPLICATIONS WITHDRAWN 5 $112,866 3 $174,753 2 $101,500 FILES CLOSED FOR INCOMPLETENESS 0 $0 1 $215,770 0 $0
Aggregated Statistics For Year 2006(Based on 4 full and 4 partial tracts) A) Conventional B) Refinancings C) Non-occupant Loans on Number Average Value Number Average Value Number Average Value
LOANS ORIGINATED 103 $96,360 31 $105,313 13 $83,037 APPLICATIONS APPROVED, NOT ACCEPTED 10 $98,279 14 $93,283 1 $81,460 APPLICATIONS DENIED 2 $95,800 2 $88,370 4 $92,085 APPLICATIONS WITHDRAWN 1 $113,420 6 $114,198 2 $124,980 FILES CLOSED FOR INCOMPLETENESS 1 $214,790 0 $0 0 $0
Aggregated Statistics For Year 2005(Based on 4 full and 4 partial tracts) A) Conventional B) Refinancings C) Non-occupant Loans on Number Average Value Number Average Value Number Average Value
LOANS ORIGINATED 107 $102,586 72 $112,500 13 $68,841 APPLICATIONS APPROVED, NOT ACCEPTED 11 $133,994 10 $103,556 0 $0 APPLICATIONS DENIED 1 $201,960 0 $0 1 $158,730 APPLICATIONS WITHDRAWN 2 $66,240 6 $102,257 1 $79,730 FILES CLOSED FOR INCOMPLETENESS 3 $227,667 2 $107,810 0 $0
Aggregated Statistics For Year 2004(Based on 4 full and 4 partial tracts) A) Conventional B) Refinancings C) Non-occupant Loans on Number Average Value Number Average Value Number Average Value
LOANS ORIGINATED 113 $98,748 71 $105,841 23 $75,032 APPLICATIONS APPROVED, NOT ACCEPTED 8 $79,179 13 $99,676 2 $113,000 APPLICATIONS DENIED 1 $36,110 3 $113,000 0 $0 APPLICATIONS WITHDRAWN 1 $53,410 3 $133,100 0 $0 FILES CLOSED FOR INCOMPLETENESS 1 $58,000 0 $0 0 $0
Aggregated Statistics For Year 2003(Based on 4 full and 4 partial tracts) A) Conventional B) Refinancings C) Non-occupant Loans on Number Average Value Number Average Value Number Average Value
LOANS ORIGINATED 123 $94,002 132 $104,349 16 $71,811 APPLICATIONS APPROVED, NOT ACCEPTED 8 $106,376 24 $97,655 2 $112,915 APPLICATIONS DENIED 1 $107,000 3 $102,393 0 $0 APPLICATIONS WITHDRAWN 1 $160,020 6 $111,675 2 $126,000 FILES CLOSED FOR INCOMPLETENESS 1 $110,000 2 $110,500 2 $110,500
Aggregated Statistics For Year 2002(Based on 4 full and 2 partial tracts) A) Conventional B) Refinancings C) Non-occupant Loans on Number Average Value Number Average Value Number Average Value
LOANS ORIGINATED 122 $87,946 90 $91,292 19 $75,303 APPLICATIONS APPROVED, NOT ACCEPTED 8 $60,005 21 $88,625 1 $61,780 APPLICATIONS DENIED 2 $139,135 2 $171,000 0 $0 APPLICATIONS WITHDRAWN 1 $62,700 2 $90,500 0 $0 FILES CLOSED FOR INCOMPLETENESS 0 $0 0 $0 0 $0
Aggregated Statistics For Year 2001(Based on 4 full and 2 partial tracts) A) Conventional B) Refinancings C) Non-occupant Loans on Number Average Value Number Average Value Number Average Value
LOANS ORIGINATED 119 $84,148 52 $97,964 11 $58,968 APPLICATIONS APPROVED, NOT ACCEPTED 8 $66,392 7 $98,629 1 $96,000 APPLICATIONS DENIED 1 $34,760 2 $82,155 0 $0 APPLICATIONS WITHDRAWN 1 $37,810 3 $91,353 1 $37,810 FILES CLOSED FOR INCOMPLETENESS 0 $0 0 $0 0 $0
Aggregated Statistics For Year 2000(Based on 4 full and 2 partial tracts) A) Conventional B) Refinancings C) Non-occupant Loans on Number Average Value Number Average Value Number Average Value
LOANS ORIGINATED 92 $72,575 16 $55,148 8 $54,219 APPLICATIONS APPROVED, NOT ACCEPTED 8 $65,366 4 $68,140 4 $76,250 APPLICATIONS DENIED 1 $100,000 1 $60,610 0 $0 APPLICATIONS WITHDRAWN 1 $38,730 0 $0 0 $0 FILES CLOSED FOR INCOMPLETENESS 1 $54,000 0 $0 0 $0
Aggregated Statistics For Year 1999(Based on 4 full and 5 partial tracts) A) Conventional B) Refinancings C) Non-occupant Loans on Number Average Value Number Average Value Number Average Value
LOANS ORIGINATED 83 $73,821 21 $71,358 6 $63,473 APPLICATIONS APPROVED, NOT ACCEPTED 9 $90,681 5 $72,890 0 $0 APPLICATIONS DENIED 6 $58,880 2 $60,855 2 $63,000 APPLICATIONS WITHDRAWN 0 $0 0 $0 0 $0 FILES CLOSED FOR INCOMPLETENESS 2 $55,005 1 $76,000 1 $57,950
Fire-safe hotels and motels in Leavenworth, Kansas:
Americas Best Value Inn, 303 Montana Ct, Leavenworth, Kansas 66048 Phone: (913) 682-0744, Fax: (913) 682-0740
Fairfield Inn and Suites Leavenworth, 1101 N 4th St, Leavenworth, Kansas 66048 Phone: (913) 758-9303, Fax: (913) 758-9304
Hampton Inn by HIlton Leavenworth, 405 Choctaw St, Leavenworth, Kansas 66048 Phone: (800) 426-7866, Fax: (913) 680-1501
Home2 Suites by Hilton Leavenworth, 250 Delaware St, Leavenworth, Kansas 66048 Phone: (913) 651-8600
TownePlace Suites, 1001 N 4th St, Leavenworth, Kansas 66048 Phone: (913) 297-5400, Fax: (913) 297-5401
All 5 fire-safe hotels and motels in Leavenworth, Kansas
Most common first names in Leavenworth, KS among deceased individuals Name Count Lived (average)
Mary 322 80.5 years John 309 73.4 years William 264 74.4 years James 210 71.5 years Charles 194 72.5 years Robert 194 68.8 years George 172 73.7 years Helen 137 80.7 years Joseph 133 75.4 years Edward 122 74.8 years
Most common last names in Leavenworth, KS among deceased individuals Last name Count Lived (average)
Smith 104 73.7 years Williams 81 74.1 years Brown 74 73.9 years Johnson 71 74.5 years Jones 63 74.3 years Thomas 55 77.6 years Miller 51 75.3 years Davis 48 73.0 years Moore 45 71.6 years Harris 40 72.2 years
Leavenworth compared to Kansas state average:
Unemployed percentage significantly below state average. Black race population percentage above state average. Foreign-born population percentage below state average. Renting percentage above state average. Length of stay since moving in significantly above state average. Institutionalized population percentage significantly above state average. Leavenworth on our top lists :
#6 on the list of "Top 101 cities with the largest percentage of people in military disciplinary barracks (population 1,000+)"
#33 on the list of "Top 101 cities with the largest percentage of people in federal prisons and detention centers (population 1,000+)"
#55 on the list of "Top 101 cities with the largest percentage of people in other types of correctional institutions (population 1,000+)"
#65 on the list of "Top 101 cities with largest percentage of males in occupations: law enforcement workers including supervisors (population 5,000+)"
#74 on the list of "Top 101 cities with largest percentage of males in industries: public administration (population 5,000+)"
#47 (66027) on the list of "Top 101 zip codes with the smallest percentage of taxpayers reporting profit/loss from business in 2012 (pop 5,000+)"
#48 (66027) on the list of "Top 101 zip codes with the largest percentage of returns reporting salary or wage in 2012 (pop 5,000+)"
#62 (66027) on the list of "Top 101 zip codes with the smallest percentage of taxpayers using paid preparers for 2012 taxes (pop 5,000+)"
#15 on the list of "Top 101 counties with the highest percentage of residents that drank alcohol in the past 30 days"
#18 on the list of "Top 101 counties with the highest percentage of residents relocating to foreign countries in 2011"
#25 on the list of "Top 101 counties with the highest percentage of residents relocating from foreign countries between 2010 and 2011"
#41 on the list of "Top 101 counties with the highest percentage of residents relocating to other counties in 2011 (pop. 50,000+)"
#55 on the list of "Top 101 counties with the highest percentage of residents relocating from other counties between 2010 and 2011 (pop. 50,000+)"
Top Patent Applicants
Scott A. Schimke (4)
Kenneth Ira Ritchey (3)
Kurtis John Ritchey (3)
Ehren Burton (3)
Jerry Garrison (2)
Katie J. Boyer (2)
Durand Kevin Dickerson (2)
Daniel T. Marshall (2)
Brandon Burns (1)
Catherine E. Mcmanus (1)
Total of 27 patent applications in 2008-2024.
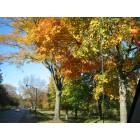
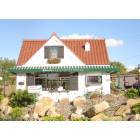
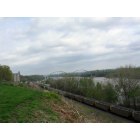
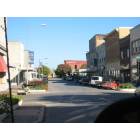
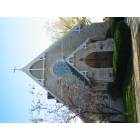


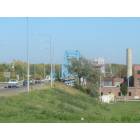
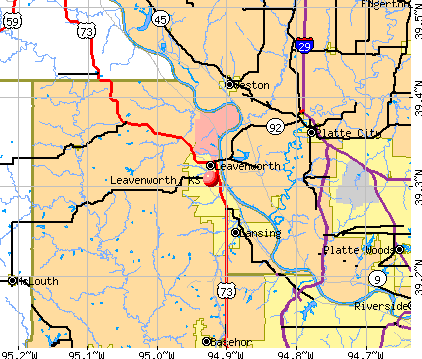


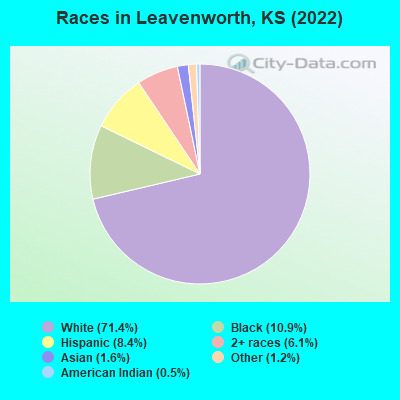
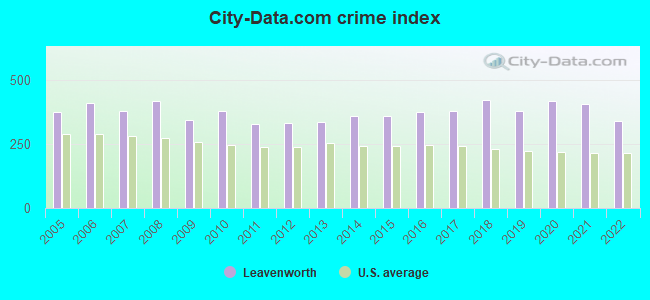
 Recent articles from our blog. Our writers, many of them Ph.D. graduates or candidates, create easy-to-read articles on a wide variety of topics.

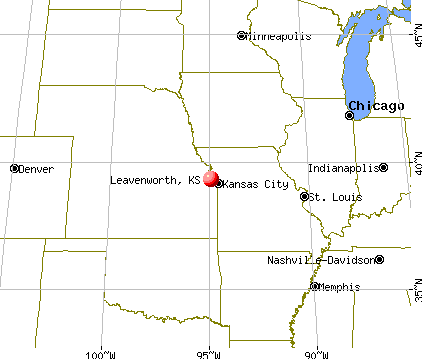
 (19.2 miles
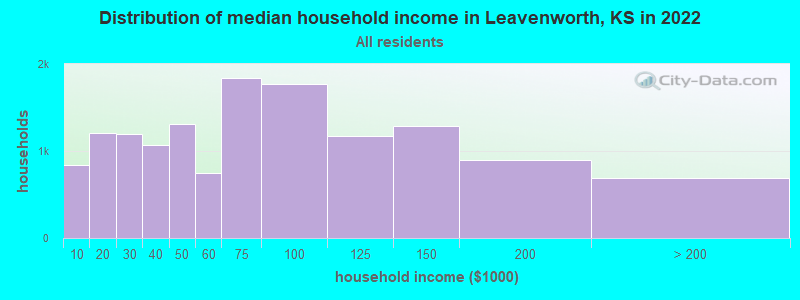
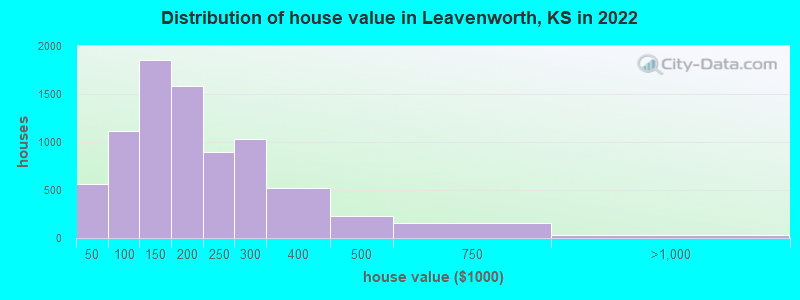

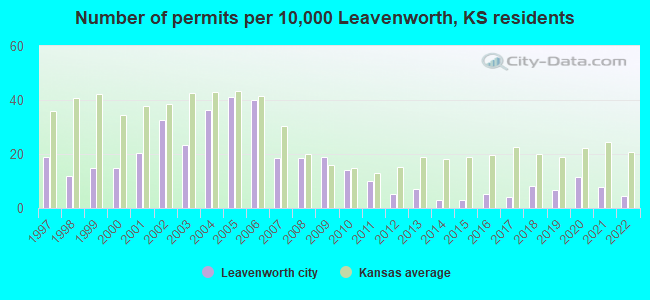
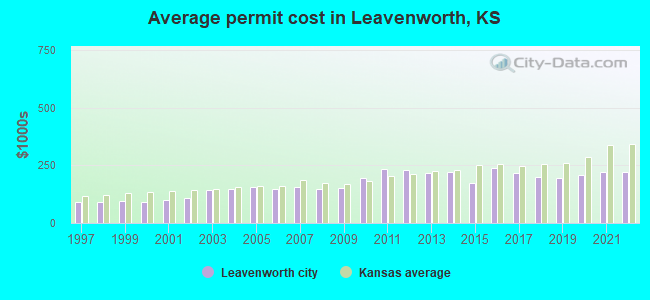
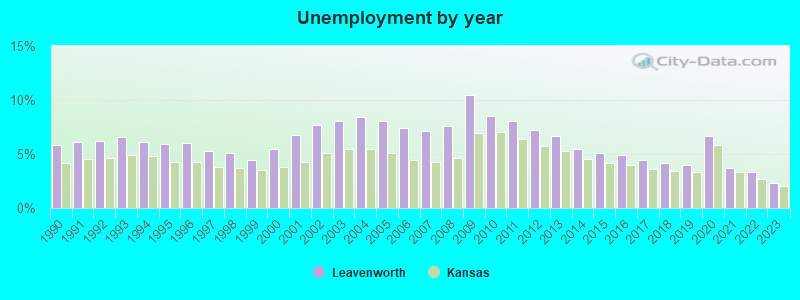
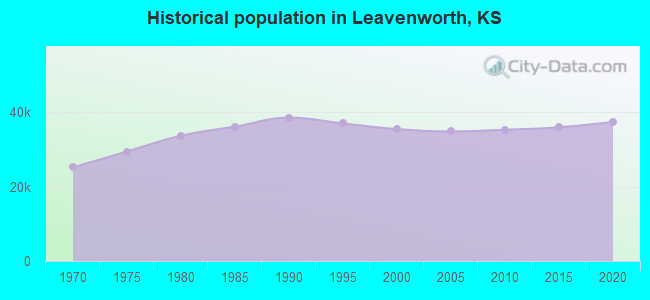
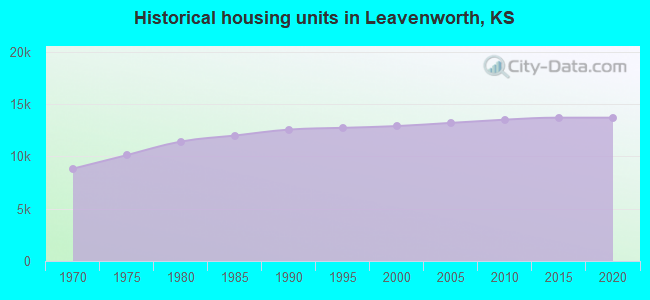
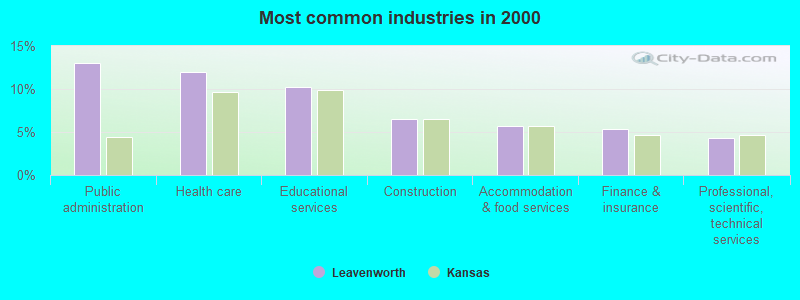
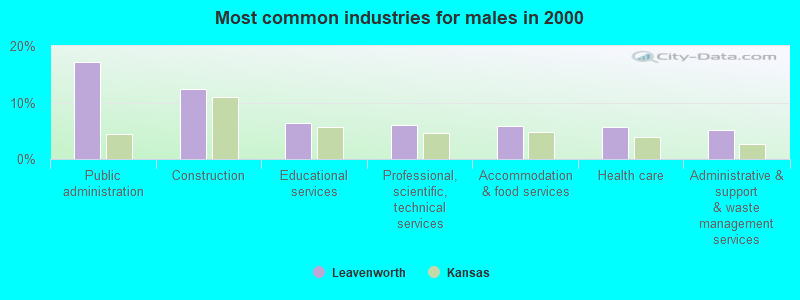
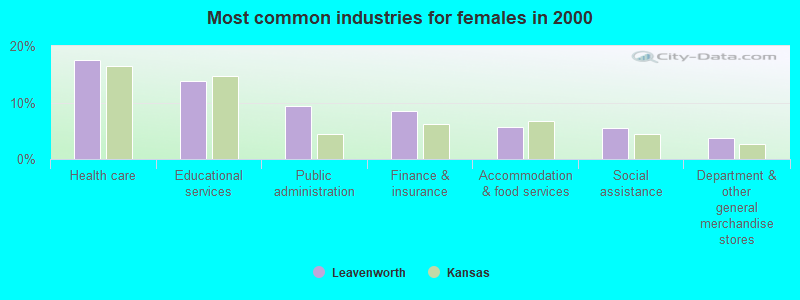
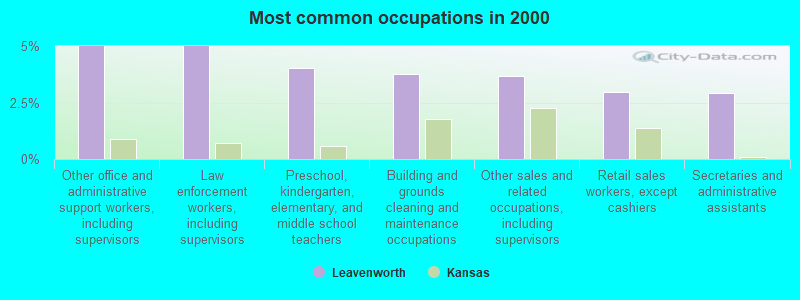
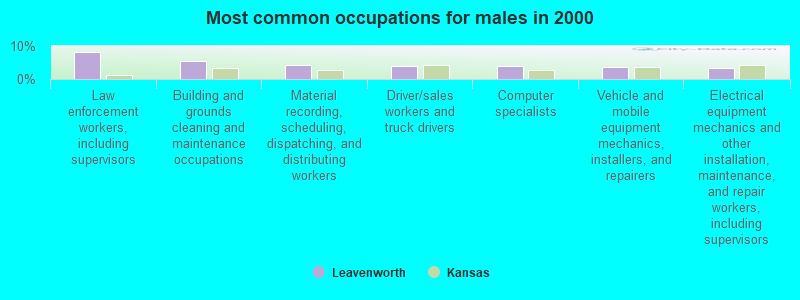
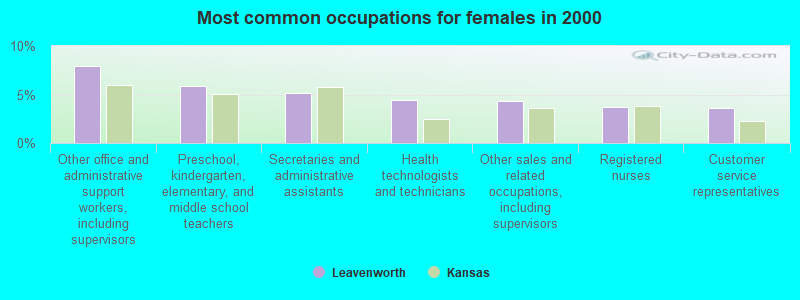


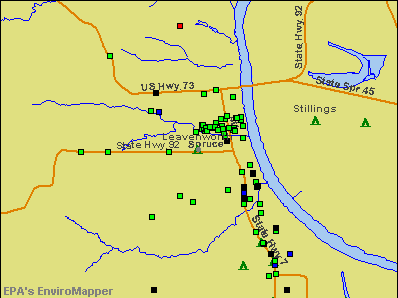

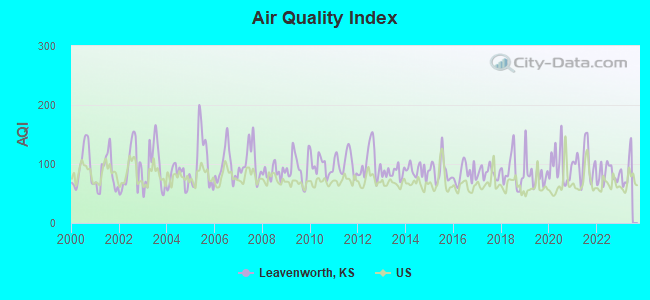
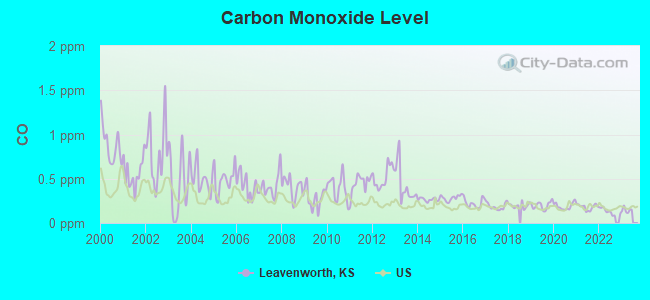
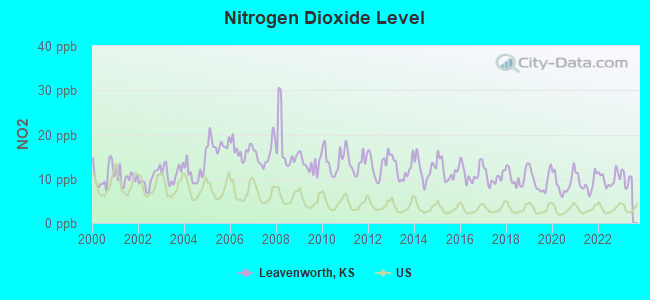
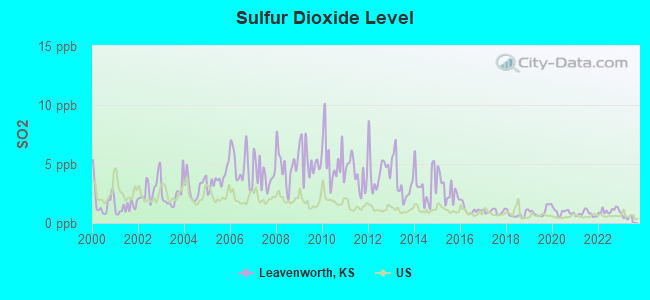
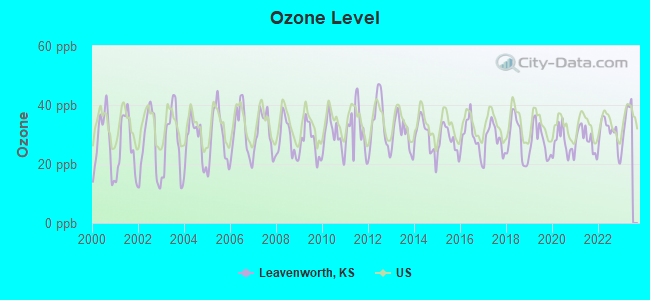
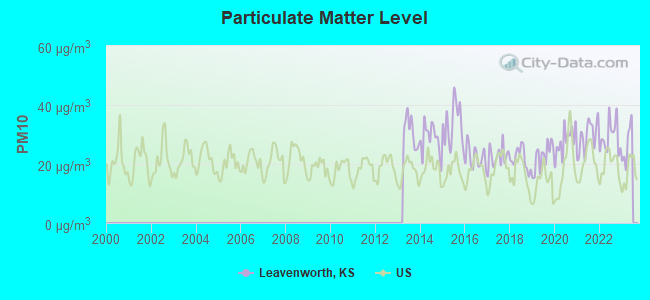
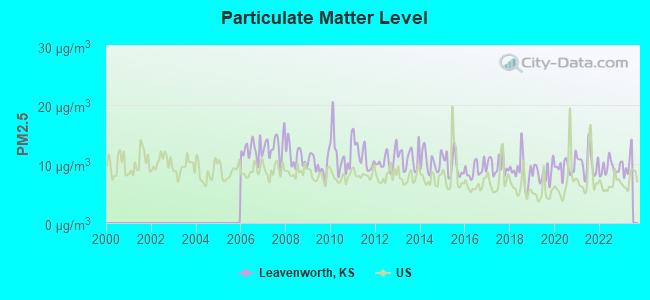
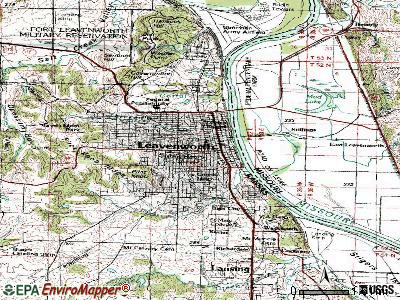
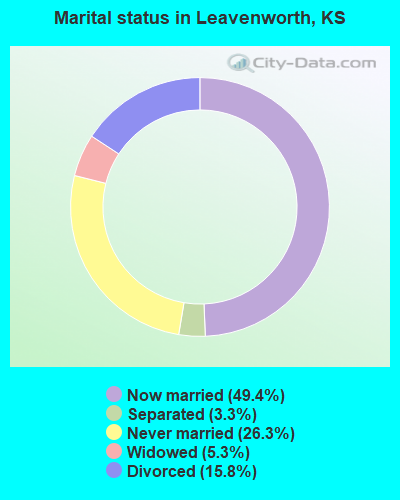
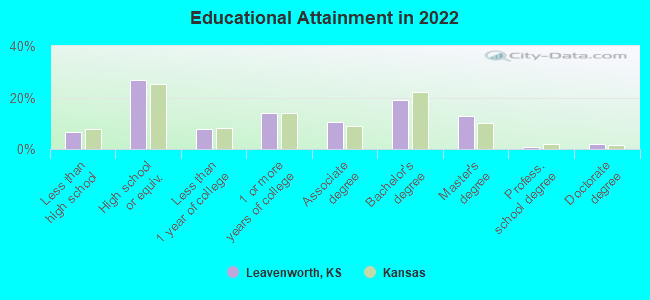
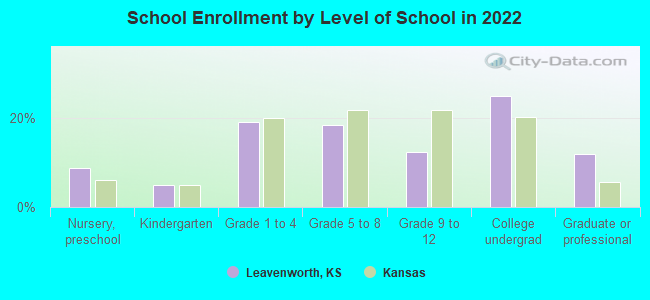
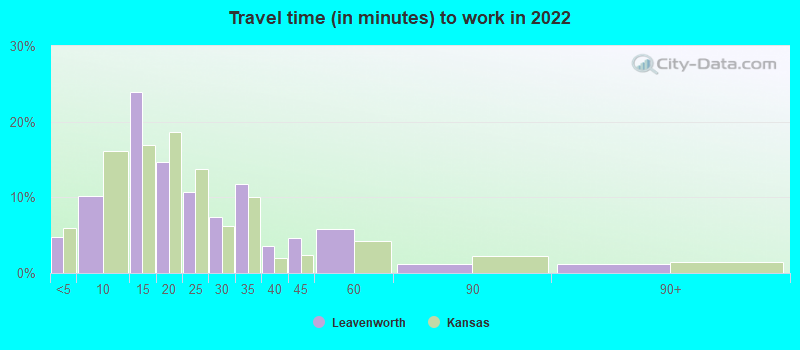
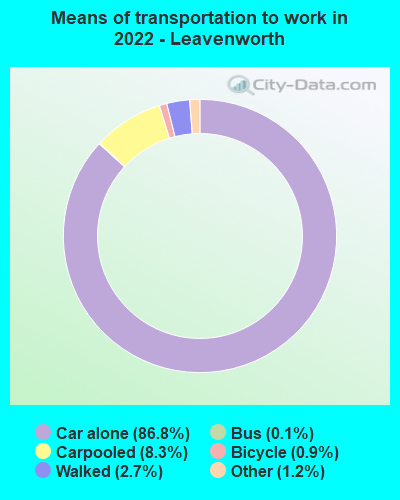
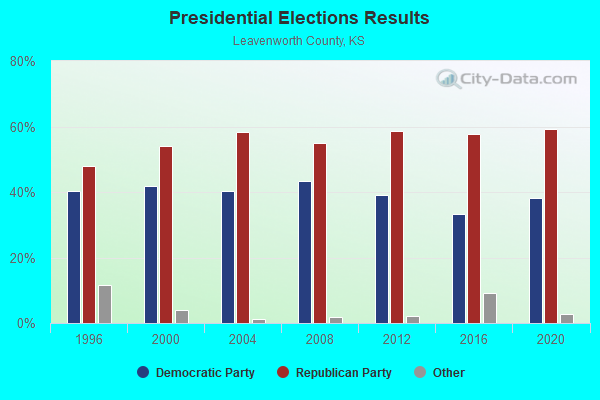
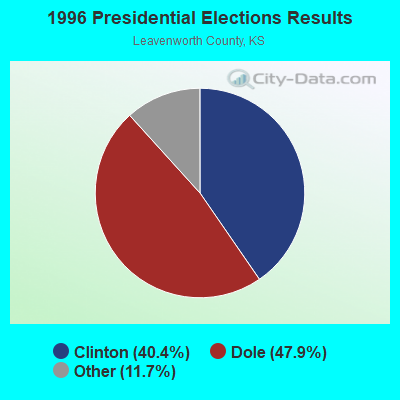
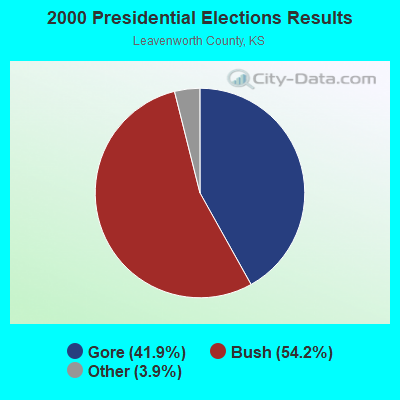
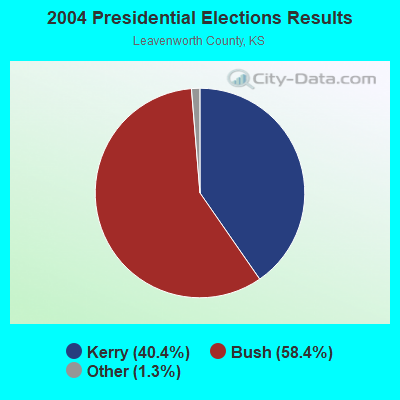
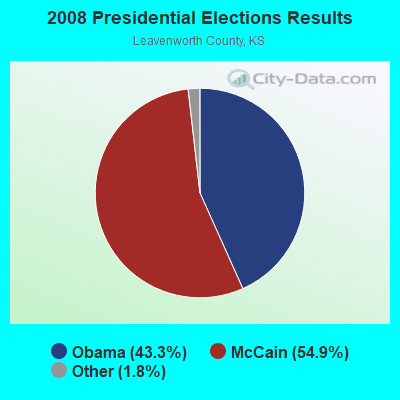
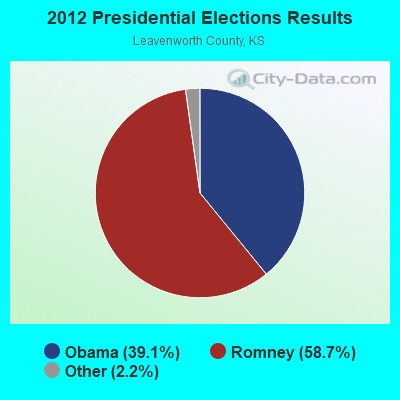
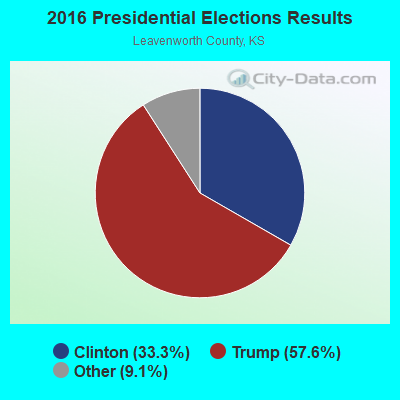
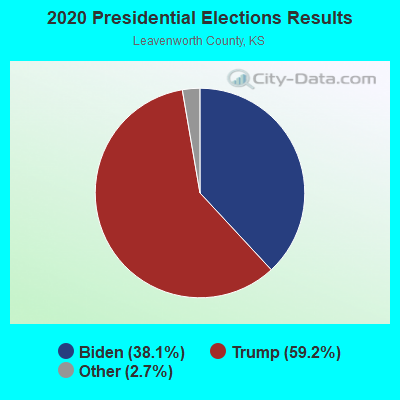
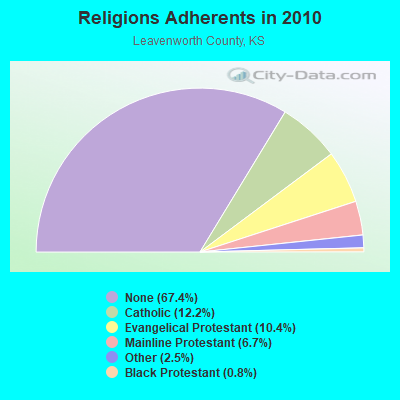
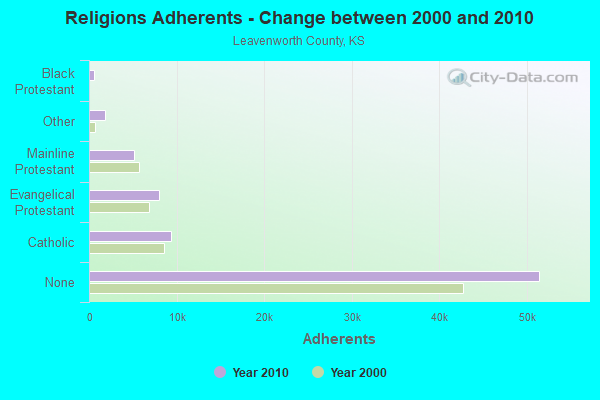
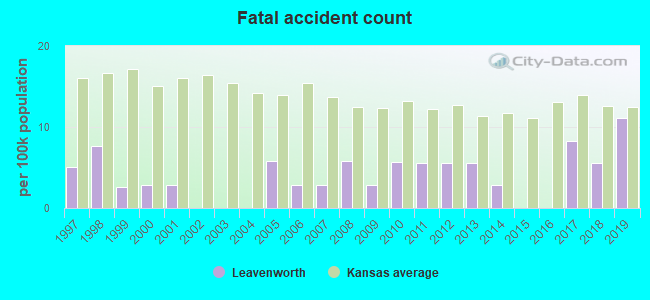
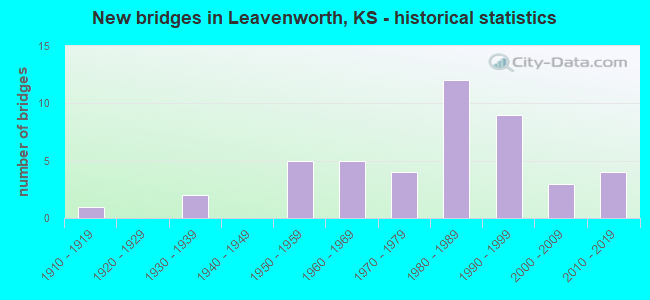
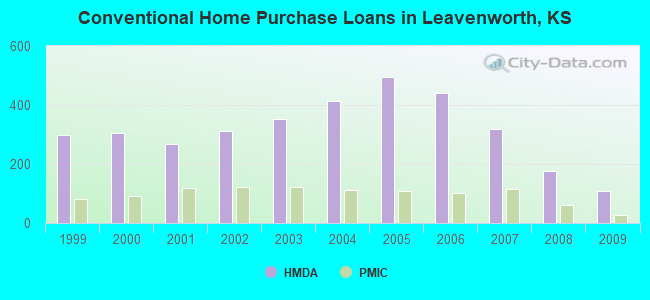
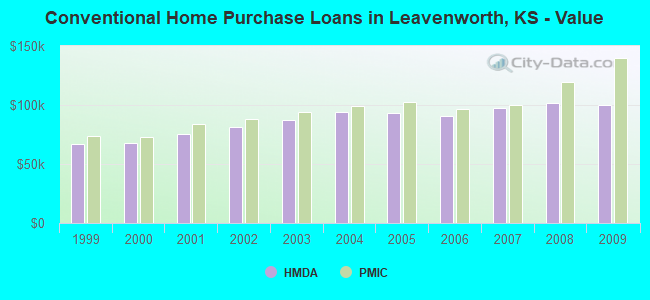
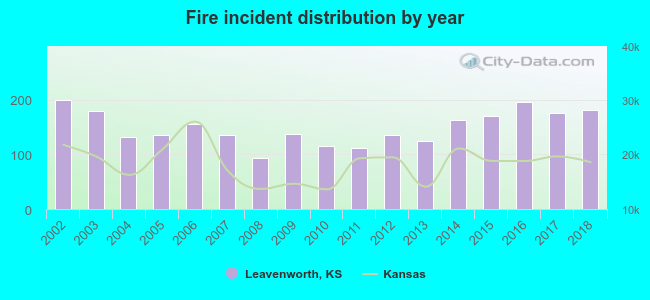 According to the data from the years 2002 - 2018 the average number of fires per year is 150. The highest number of fire incidents - 199 took place in 2002, and the least - 94 in 2008. The data has a declining trend.
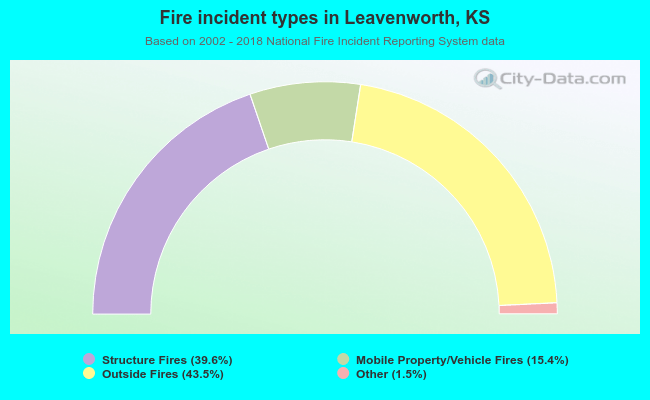 When looking into fire subcategories, the most reports belonged to: Outside Fires (43.5%), and Structure Fires (39.6%).