Lebanon, Indiana Submit your own pictures of this city and show them to the world
OSM Map
General Map
Google Map
MSN Map
OSM Map
General Map
Google Map
MSN Map
OSM Map
General Map
Google Map
MSN Map
OSM Map
General Map
Google Map
MSN Map
Please wait while loading the map...
Population in 2022: 16,982 (96% urban, 4% rural). Population change since 2000: +19.4%Males: 7,755 Females: 9,227
March 2022 cost of living index in Lebanon: 86.7 (less than average, U.S. average is 100) Percentage of residents living in poverty in 2022: 9.6%for White Non-Hispanic residents , 41.1% for Black residents , 2.0% for Hispanic or Latino residents , 10.7% for two or more races residents )
Profiles of local businesses
Business Search - 14 Million verified businesses
Data:
Median household income ($)
Median household income (% change since 2000)
Household income diversity
Ratio of average income to average house value (%)
Ratio of average income to average rent
Median household income ($) - White
Median household income ($) - Black or African American
Median household income ($) - Asian
Median household income ($) - Hispanic or Latino
Median household income ($) - American Indian and Alaska Native
Median household income ($) - Multirace
Median household income ($) - Other Race
Median household income for houses/condos with a mortgage ($)
Median household income for apartments without a mortgage ($)
Races - White alone (%)
Races - White alone (% change since 2000)
Races - Black alone (%)
Races - Black alone (% change since 2000)
Races - American Indian alone (%)
Races - American Indian alone (% change since 2000)
Races - Asian alone (%)
Races - Asian alone (% change since 2000)
Races - Hispanic (%)
Races - Hispanic (% change since 2000)
Races - Native Hawaiian and Other Pacific Islander alone (%)
Races - Native Hawaiian and Other Pacific Islander alone (% change since 2000)
Races - Two or more races (%)
Races - Two or more races (% change since 2000)
Races - Other race alone (%)
Races - Other race alone (% change since 2000)
Racial diversity
Unemployment (%)
Unemployment (% change since 2000)
Unemployment (%) - White
Unemployment (%) - Black or African American
Unemployment (%) - Asian
Unemployment (%) - Hispanic or Latino
Unemployment (%) - American Indian and Alaska Native
Unemployment (%) - Multirace
Unemployment (%) - Other Race
Population density (people per square mile)
Population - Males (%)
Population - Females (%)
Population - Males (%) - White
Population - Males (%) - Black or African American
Population - Males (%) - Asian
Population - Males (%) - Hispanic or Latino
Population - Males (%) - American Indian and Alaska Native
Population - Males (%) - Multirace
Population - Males (%) - Other Race
Population - Females (%) - White
Population - Females (%) - Black or African American
Population - Females (%) - Asian
Population - Females (%) - Hispanic or Latino
Population - Females (%) - American Indian and Alaska Native
Population - Females (%) - Multirace
Population - Females (%) - Other Race
Coronavirus confirmed cases (Apr 27, 2024)
Deaths caused by coronavirus (Apr 27, 2024)
Coronavirus confirmed cases (per 100k population) (Apr 27, 2024)
Deaths caused by coronavirus (per 100k population) (Apr 27, 2024)
Daily increase in number of cases (Apr 27, 2024)
Weekly increase in number of cases (Apr 27, 2024)
Cases doubled (in days) (Apr 27, 2024)
Hospitalized patients (Apr 18, 2022)
Negative test results (Apr 18, 2022)
Total test results (Apr 18, 2022)
COVID Vaccine doses distributed (per 100k population) (Sep 19, 2023)
COVID Vaccine doses administered (per 100k population) (Sep 19, 2023)
COVID Vaccine doses distributed (Sep 19, 2023)
COVID Vaccine doses administered (Sep 19, 2023)
Likely homosexual households (%)
Likely homosexual households (% change since 2000)
Likely homosexual households - Lesbian couples (%)
Likely homosexual households - Lesbian couples (% change since 2000)
Likely homosexual households - Gay men (%)
Likely homosexual households - Gay men (% change since 2000)
Cost of living index
Median gross rent ($)
Median contract rent ($)
Median monthly housing costs ($)
Median house or condo value ($)
Median house or condo value ($ change since 2000)
Mean house or condo value by units in structure - 1, detached ($)
Mean house or condo value by units in structure - 1, attached ($)
Mean house or condo value by units in structure - 2 ($)
Mean house or condo value by units in structure by units in structure - 3 or 4 ($)
Mean house or condo value by units in structure - 5 or more ($)
Mean house or condo value by units in structure - Boat, RV, van, etc. ($)
Mean house or condo value by units in structure - Mobile home ($)
Median house or condo value ($) - White
Median house or condo value ($) - Black or African American
Median house or condo value ($) - Asian
Median house or condo value ($) - Hispanic or Latino
Median house or condo value ($) - American Indian and Alaska Native
Median house or condo value ($) - Multirace
Median house or condo value ($) - Other Race
Median resident age
Resident age diversity
Median resident age - Males
Median resident age - Females
Median resident age - White
Median resident age - Black or African American
Median resident age - Asian
Median resident age - Hispanic or Latino
Median resident age - American Indian and Alaska Native
Median resident age - Multirace
Median resident age - Other Race
Median resident age - Males - White
Median resident age - Males - Black or African American
Median resident age - Males - Asian
Median resident age - Males - Hispanic or Latino
Median resident age - Males - American Indian and Alaska Native
Median resident age - Males - Multirace
Median resident age - Males - Other Race
Median resident age - Females - White
Median resident age - Females - Black or African American
Median resident age - Females - Asian
Median resident age - Females - Hispanic or Latino
Median resident age - Females - American Indian and Alaska Native
Median resident age - Females - Multirace
Median resident age - Females - Other Race
Commute - mean travel time to work (minutes)
Travel time to work - Less than 5 minutes (%)
Travel time to work - Less than 5 minutes (% change since 2000)
Travel time to work - 5 to 9 minutes (%)
Travel time to work - 5 to 9 minutes (% change since 2000)
Travel time to work - 10 to 19 minutes (%)
Travel time to work - 10 to 19 minutes (% change since 2000)
Travel time to work - 20 to 29 minutes (%)
Travel time to work - 20 to 29 minutes (% change since 2000)
Travel time to work - 30 to 39 minutes (%)
Travel time to work - 30 to 39 minutes (% change since 2000)
Travel time to work - 40 to 59 minutes (%)
Travel time to work - 40 to 59 minutes (% change since 2000)
Travel time to work - 60 to 89 minutes (%)
Travel time to work - 60 to 89 minutes (% change since 2000)
Travel time to work - 90 or more minutes (%)
Travel time to work - 90 or more minutes (% change since 2000)
Marital status - Never married (%)
Marital status - Now married (%)
Marital status - Separated (%)
Marital status - Widowed (%)
Marital status - Divorced (%)
Median family income ($)
Median family income (% change since 2000)
Median non-family income ($)
Median non-family income (% change since 2000)
Median per capita income ($)
Median per capita income (% change since 2000)
Median family income ($) - White
Median family income ($) - Black or African American
Median family income ($) - Asian
Median family income ($) - Hispanic or Latino
Median family income ($) - American Indian and Alaska Native
Median family income ($) - Multirace
Median family income ($) - Other Race
Median year house/condo built
Median year apartment built
Year house built - Built 2005 or later (%)
Year house built - Built 2000 to 2004 (%)
Year house built - Built 1990 to 1999 (%)
Year house built - Built 1980 to 1989 (%)
Year house built - Built 1970 to 1979 (%)
Year house built - Built 1960 to 1969 (%)
Year house built - Built 1950 to 1959 (%)
Year house built - Built 1940 to 1949 (%)
Year house built - Built 1939 or earlier (%)
Average household size
Household density (households per square mile)
Average household size - White
Average household size - Black or African American
Average household size - Asian
Average household size - Hispanic or Latino
Average household size - American Indian and Alaska Native
Average household size - Multirace
Average household size - Other Race
Occupied housing units (%)
Vacant housing units (%)
Owner occupied housing units (%)
Renter occupied housing units (%)
Vacancy status - For rent (%)
Vacancy status - For sale only (%)
Vacancy status - Rented or sold, not occupied (%)
Vacancy status - For seasonal, recreational, or occasional use (%)
Vacancy status - For migrant workers (%)
Vacancy status - Other vacant (%)
Residents with income below the poverty level (%)
Residents with income below 50% of the poverty level (%)
Children below poverty level (%)
Poor families by family type - Married-couple family (%)
Poor families by family type - Male, no wife present (%)
Poor families by family type - Female, no husband present (%)
Poverty status for native-born residents (%)
Poverty status for foreign-born residents (%)
Poverty among high school graduates not in families (%)
Poverty among people who did not graduate high school not in families (%)
Residents with income below the poverty level (%) - White
Residents with income below the poverty level (%) - Black or African American
Residents with income below the poverty level (%) - Asian
Residents with income below the poverty level (%) - Hispanic or Latino
Residents with income below the poverty level (%) - American Indian and Alaska Native
Residents with income below the poverty level (%) - Multirace
Residents with income below the poverty level (%) - Other Race
Air pollution - Air Quality Index (AQI)
Air pollution - CO
Air pollution - NO2
Air pollution - SO2
Air pollution - Ozone
Air pollution - PM10
Air pollution - PM25
Air pollution - Pb
Crime - Murders per 100,000 population
Crime - Rapes per 100,000 population
Crime - Robberies per 100,000 population
Crime - Assaults per 100,000 population
Crime - Burglaries per 100,000 population
Crime - Thefts per 100,000 population
Crime - Auto thefts per 100,000 population
Crime - Arson per 100,000 population
Crime - City-data.com crime index
Crime - Violent crime index
Crime - Property crime index
Crime - Murders per 100,000 population (5 year average)
Crime - Rapes per 100,000 population (5 year average)
Crime - Robberies per 100,000 population (5 year average)
Crime - Assaults per 100,000 population (5 year average)
Crime - Burglaries per 100,000 population (5 year average)
Crime - Thefts per 100,000 population (5 year average)
Crime - Auto thefts per 100,000 population (5 year average)
Crime - Arson per 100,000 population (5 year average)
Crime - City-data.com crime index (5 year average)
Crime - Violent crime index (5 year average)
Crime - Property crime index (5 year average)
1996 Presidential Elections Results (%) - Democratic Party (Clinton)
1996 Presidential Elections Results (%) - Republican Party (Dole)
1996 Presidential Elections Results (%) - Other
2000 Presidential Elections Results (%) - Democratic Party (Gore)
2000 Presidential Elections Results (%) - Republican Party (Bush)
2000 Presidential Elections Results (%) - Other
2004 Presidential Elections Results (%) - Democratic Party (Kerry)
2004 Presidential Elections Results (%) - Republican Party (Bush)
2004 Presidential Elections Results (%) - Other
2008 Presidential Elections Results (%) - Democratic Party (Obama)
2008 Presidential Elections Results (%) - Republican Party (McCain)
2008 Presidential Elections Results (%) - Other
2012 Presidential Elections Results (%) - Democratic Party (Obama)
2012 Presidential Elections Results (%) - Republican Party (Romney)
2012 Presidential Elections Results (%) - Other
2016 Presidential Elections Results (%) - Democratic Party (Clinton)
2016 Presidential Elections Results (%) - Republican Party (Trump)
2016 Presidential Elections Results (%) - Other
2020 Presidential Elections Results (%) - Democratic Party (Biden)
2020 Presidential Elections Results (%) - Republican Party (Trump)
2020 Presidential Elections Results (%) - Other
Ancestries Reported - Arab (%)
Ancestries Reported - Czech (%)
Ancestries Reported - Danish (%)
Ancestries Reported - Dutch (%)
Ancestries Reported - English (%)
Ancestries Reported - French (%)
Ancestries Reported - French Canadian (%)
Ancestries Reported - German (%)
Ancestries Reported - Greek (%)
Ancestries Reported - Hungarian (%)
Ancestries Reported - Irish (%)
Ancestries Reported - Italian (%)
Ancestries Reported - Lithuanian (%)
Ancestries Reported - Norwegian (%)
Ancestries Reported - Polish (%)
Ancestries Reported - Portuguese (%)
Ancestries Reported - Russian (%)
Ancestries Reported - Scotch-Irish (%)
Ancestries Reported - Scottish (%)
Ancestries Reported - Slovak (%)
Ancestries Reported - Subsaharan African (%)
Ancestries Reported - Swedish (%)
Ancestries Reported - Swiss (%)
Ancestries Reported - Ukrainian (%)
Ancestries Reported - United States (%)
Ancestries Reported - Welsh (%)
Ancestries Reported - West Indian (%)
Ancestries Reported - Other (%)
Educational Attainment - No schooling completed (%)
Educational Attainment - Less than high school (%)
Educational Attainment - High school or equivalent (%)
Educational Attainment - Less than 1 year of college (%)
Educational Attainment - 1 or more years of college (%)
Educational Attainment - Associate degree (%)
Educational Attainment - Bachelor's degree (%)
Educational Attainment - Master's degree (%)
Educational Attainment - Professional school degree (%)
Educational Attainment - Doctorate degree (%)
School Enrollment - Nursery, preschool (%)
School Enrollment - Kindergarten (%)
School Enrollment - Grade 1 to 4 (%)
School Enrollment - Grade 5 to 8 (%)
School Enrollment - Grade 9 to 12 (%)
School Enrollment - College undergrad (%)
School Enrollment - Graduate or professional (%)
School Enrollment - Not enrolled in school (%)
School enrollment - Public schools (%)
School enrollment - Private schools (%)
School enrollment - Not enrolled (%)
Median number of rooms in houses and condos
Median number of rooms in apartments
Housing units lacking complete plumbing facilities (%)
Housing units lacking complete kitchen facilities (%)
Density of houses
Urban houses (%)
Rural houses (%)
Households with people 60 years and over (%)
Households with people 65 years and over (%)
Households with people 75 years and over (%)
Households with one or more nonrelatives (%)
Households with no nonrelatives (%)
Population in households (%)
Family households (%)
Nonfamily households (%)
Population in families (%)
Family households with own children (%)
Median number of bedrooms in owner occupied houses
Mean number of bedrooms in owner occupied houses
Median number of bedrooms in renter occupied houses
Mean number of bedrooms in renter occupied houses
Median number of vehichles in owner occupied houses
Mean number of vehichles in owner occupied houses
Median number of vehichles in renter occupied houses
Mean number of vehichles in renter occupied houses
Mortgage status - with mortgage (%)
Mortgage status - with second mortgage (%)
Mortgage status - with home equity loan (%)
Mortgage status - with both second mortgage and home equity loan (%)
Mortgage status - without a mortgage (%)
Average family size
Average family size - White
Average family size - Black or African American
Average family size - Asian
Average family size - Hispanic or Latino
Average family size - American Indian and Alaska Native
Average family size - Multirace
Average family size - Other Race
Geographical mobility - Same house 1 year ago (%)
Geographical mobility - Moved within same county (%)
Geographical mobility - Moved from different county within same state (%)
Geographical mobility - Moved from different state (%)
Geographical mobility - Moved from abroad (%)
Place of birth - Born in state of residence (%)
Place of birth - Born in other state (%)
Place of birth - Native, outside of US (%)
Place of birth - Foreign born (%)
Housing units in structures - 1, detached (%)
Housing units in structures - 1, attached (%)
Housing units in structures - 2 (%)
Housing units in structures - 3 or 4 (%)
Housing units in structures - 5 to 9 (%)
Housing units in structures - 10 to 19 (%)
Housing units in structures - 20 to 49 (%)
Housing units in structures - 50 or more (%)
Housing units in structures - Mobile home (%)
Housing units in structures - Boat, RV, van, etc. (%)
House/condo owner moved in on average (years ago)
Renter moved in on average (years ago)
Year householder moved into unit - Moved in 1999 to March 2000 (%)
Year householder moved into unit - Moved in 1995 to 1998 (%)
Year householder moved into unit - Moved in 1990 to 1994 (%)
Year householder moved into unit - Moved in 1980 to 1989 (%)
Year householder moved into unit - Moved in 1970 to 1979 (%)
Year householder moved into unit - Moved in 1969 or earlier (%)
Means of transportation to work - Drove car alone (%)
Means of transportation to work - Carpooled (%)
Means of transportation to work - Public transportation (%)
Means of transportation to work - Bus or trolley bus (%)
Means of transportation to work - Streetcar or trolley car (%)
Means of transportation to work - Subway or elevated (%)
Means of transportation to work - Railroad (%)
Means of transportation to work - Ferryboat (%)
Means of transportation to work - Taxicab (%)
Means of transportation to work - Motorcycle (%)
Means of transportation to work - Bicycle (%)
Means of transportation to work - Walked (%)
Means of transportation to work - Other means (%)
Working at home (%)
Industry diversity
Most Common Industries - Agriculture, forestry, fishing and hunting, and mining (%)
Most Common Industries - Agriculture, forestry, fishing and hunting (%)
Most Common Industries - Mining, quarrying, and oil and gas extraction (%)
Most Common Industries - Construction (%)
Most Common Industries - Manufacturing (%)
Most Common Industries - Wholesale trade (%)
Most Common Industries - Retail trade (%)
Most Common Industries - Transportation and warehousing, and utilities (%)
Most Common Industries - Transportation and warehousing (%)
Most Common Industries - Utilities (%)
Most Common Industries - Information (%)
Most Common Industries - Finance and insurance, and real estate and rental and leasing (%)
Most Common Industries - Finance and insurance (%)
Most Common Industries - Real estate and rental and leasing (%)
Most Common Industries - Professional, scientific, and management, and administrative and waste management services (%)
Most Common Industries - Professional, scientific, and technical services (%)
Most Common Industries - Management of companies and enterprises (%)
Most Common Industries - Administrative and support and waste management services (%)
Most Common Industries - Educational services, and health care and social assistance (%)
Most Common Industries - Educational services (%)
Most Common Industries - Health care and social assistance (%)
Most Common Industries - Arts, entertainment, and recreation, and accommodation and food services (%)
Most Common Industries - Arts, entertainment, and recreation (%)
Most Common Industries - Accommodation and food services (%)
Most Common Industries - Other services, except public administration (%)
Most Common Industries - Public administration (%)
Occupation diversity
Most Common Occupations - Management, business, science, and arts occupations (%)
Most Common Occupations - Management, business, and financial occupations (%)
Most Common Occupations - Management occupations (%)
Most Common Occupations - Business and financial operations occupations (%)
Most Common Occupations - Computer, engineering, and science occupations (%)
Most Common Occupations - Computer and mathematical occupations (%)
Most Common Occupations - Architecture and engineering occupations (%)
Most Common Occupations - Life, physical, and social science occupations (%)
Most Common Occupations - Education, legal, community service, arts, and media occupations (%)
Most Common Occupations - Community and social service occupations (%)
Most Common Occupations - Legal occupations (%)
Most Common Occupations - Education, training, and library occupations (%)
Most Common Occupations - Arts, design, entertainment, sports, and media occupations (%)
Most Common Occupations - Healthcare practitioners and technical occupations (%)
Most Common Occupations - Health diagnosing and treating practitioners and other technical occupations (%)
Most Common Occupations - Health technologists and technicians (%)
Most Common Occupations - Service occupations (%)
Most Common Occupations - Healthcare support occupations (%)
Most Common Occupations - Protective service occupations (%)
Most Common Occupations - Fire fighting and prevention, and other protective service workers including supervisors (%)
Most Common Occupations - Law enforcement workers including supervisors (%)
Most Common Occupations - Food preparation and serving related occupations (%)
Most Common Occupations - Building and grounds cleaning and maintenance occupations (%)
Most Common Occupations - Personal care and service occupations (%)
Most Common Occupations - Sales and office occupations (%)
Most Common Occupations - Sales and related occupations (%)
Most Common Occupations - Office and administrative support occupations (%)
Most Common Occupations - Natural resources, construction, and maintenance occupations (%)
Most Common Occupations - Farming, fishing, and forestry occupations (%)
Most Common Occupations - Construction and extraction occupations (%)
Most Common Occupations - Installation, maintenance, and repair occupations (%)
Most Common Occupations - Production, transportation, and material moving occupations (%)
Most Common Occupations - Production occupations (%)
Most Common Occupations - Transportation occupations (%)
Most Common Occupations - Material moving occupations (%)
People in Group quarters - Institutionalized population (%)
People in Group quarters - Correctional institutions (%)
People in Group quarters - Federal prisons and detention centers (%)
People in Group quarters - Halfway houses (%)
People in Group quarters - Local jails and other confinement facilities (including police lockups) (%)
People in Group quarters - Military disciplinary barracks (%)
People in Group quarters - State prisons (%)
People in Group quarters - Other types of correctional institutions (%)
People in Group quarters - Nursing homes (%)
People in Group quarters - Hospitals/wards, hospices, and schools for the handicapped (%)
People in Group quarters - Hospitals/wards and hospices for chronically ill (%)
People in Group quarters - Hospices or homes for chronically ill (%)
People in Group quarters - Military hospitals or wards for chronically ill (%)
People in Group quarters - Other hospitals or wards for chronically ill (%)
People in Group quarters - Hospitals or wards for drug/alcohol abuse (%)
People in Group quarters - Mental (Psychiatric) hospitals or wards (%)
People in Group quarters - Schools, hospitals, or wards for the mentally retarded (%)
People in Group quarters - Schools, hospitals, or wards for the physically handicapped (%)
People in Group quarters - Institutions for the deaf (%)
People in Group quarters - Institutions for the blind (%)
People in Group quarters - Orthopedic wards and institutions for the physically handicapped (%)
People in Group quarters - Wards in general hospitals for patients who have no usual home elsewhere (%)
People in Group quarters - Wards in military hospitals for patients who have no usual home elsewhere (%)
People in Group quarters - Juvenile institutions (%)
People in Group quarters - Long-term care (%)
People in Group quarters - Homes for abused, dependent, and neglected children (%)
People in Group quarters - Residential treatment centers for emotionally disturbed children (%)
People in Group quarters - Training schools for juvenile delinquents (%)
People in Group quarters - Short-term care, detention or diagnostic centers for delinquent children (%)
People in Group quarters - Type of juvenile institution unknown (%)
People in Group quarters - Noninstitutionalized population (%)
People in Group quarters - College dormitories (includes college quarters off campus) (%)
People in Group quarters - Military quarters (%)
People in Group quarters - On base (%)
People in Group quarters - Barracks, unaccompanied personnel housing (UPH), (Enlisted/Officer), ;and similar group living quarters for military personnel (%)
People in Group quarters - Transient quarters for temporary residents (%)
People in Group quarters - Military ships (%)
People in Group quarters - Group homes (%)
People in Group quarters - Homes or halfway houses for drug/alcohol abuse (%)
People in Group quarters - Homes for the mentally ill (%)
People in Group quarters - Homes for the mentally retarded (%)
People in Group quarters - Homes for the physically handicapped (%)
People in Group quarters - Other group homes (%)
People in Group quarters - Religious group quarters (%)
People in Group quarters - Dormitories (%)
People in Group quarters - Agriculture workers' dormitories on farms (%)
People in Group quarters - Job Corps and vocational training facilities (%)
People in Group quarters - Other workers' dormitories (%)
People in Group quarters - Crews of maritime vessels (%)
People in Group quarters - Other nonhousehold living situations (%)
People in Group quarters - Other noninstitutional group quarters (%)
Residents speaking English at home (%)
Residents speaking English at home - Born in the United States (%)
Residents speaking English at home - Native, born elsewhere (%)
Residents speaking English at home - Foreign born (%)
Residents speaking Spanish at home (%)
Residents speaking Spanish at home - Born in the United States (%)
Residents speaking Spanish at home - Native, born elsewhere (%)
Residents speaking Spanish at home - Foreign born (%)
Residents speaking other language at home (%)
Residents speaking other language at home - Born in the United States (%)
Residents speaking other language at home - Native, born elsewhere (%)
Residents speaking other language at home - Foreign born (%)
Class of Workers - Employee of private company (%)
Class of Workers - Self-employed in own incorporated business (%)
Class of Workers - Private not-for-profit wage and salary workers (%)
Class of Workers - Local government workers (%)
Class of Workers - State government workers (%)
Class of Workers - Federal government workers (%)
Class of Workers - Self-employed workers in own not incorporated business and Unpaid family workers (%)
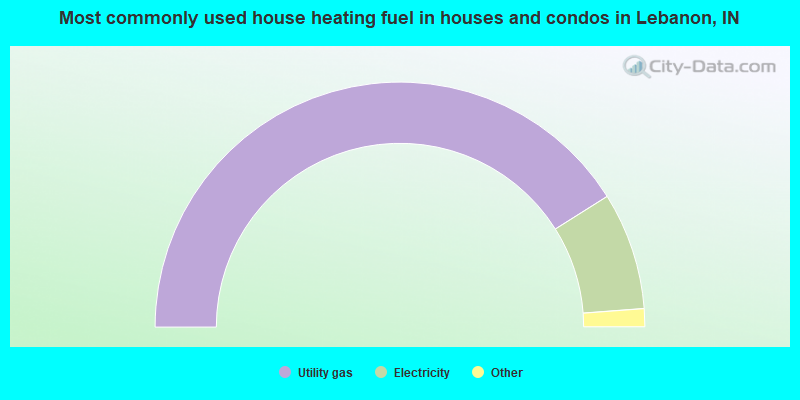
House heating fuel used in houses and condos - Utility gas (%)
House heating fuel used in houses and condos - Bottled, tank, or LP gas (%)
House heating fuel used in houses and condos - Electricity (%)
House heating fuel used in houses and condos - Fuel oil, kerosene, etc. (%)
House heating fuel used in houses and condos - Coal or coke (%)
House heating fuel used in houses and condos - Wood (%)
House heating fuel used in houses and condos - Solar energy (%)
House heating fuel used in houses and condos - Other fuel (%)
House heating fuel used in houses and condos - No fuel used (%)
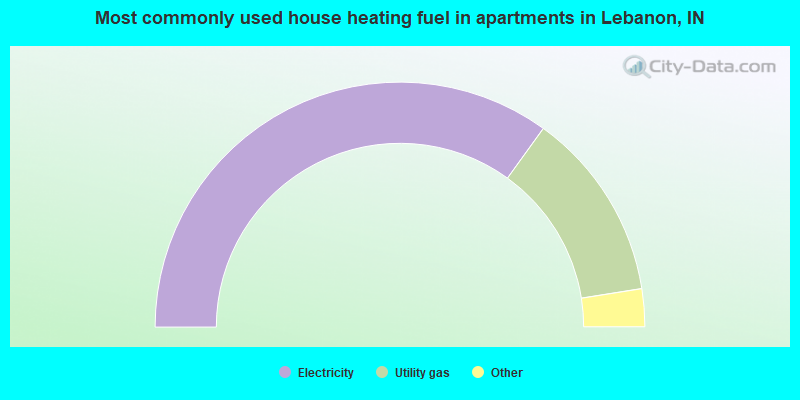
House heating fuel used in apartments - Utility gas (%)
House heating fuel used in apartments - Bottled, tank, or LP gas (%)
House heating fuel used in apartments - Electricity (%)
House heating fuel used in apartments - Fuel oil, kerosene, etc. (%)
House heating fuel used in apartments - Coal or coke (%)
House heating fuel used in apartments - Wood (%)
House heating fuel used in apartments - Solar energy (%)
House heating fuel used in apartments - Other fuel (%)
House heating fuel used in apartments - No fuel used (%)
Armed forces status - In Armed Forces (%)
Armed forces status - Civilian (%)
Armed forces status - Civilian - Veteran (%)
Armed forces status - Civilian - Nonveteran (%)
Fatal accidents locations in years 2005-2021
Fatal accidents locations in 2005
Fatal accidents locations in 2006
Fatal accidents locations in 2007
Fatal accidents locations in 2008
Fatal accidents locations in 2009
Fatal accidents locations in 2010
Fatal accidents locations in 2011
Fatal accidents locations in 2012
Fatal accidents locations in 2013
Fatal accidents locations in 2014
Fatal accidents locations in 2015
Fatal accidents locations in 2016
Fatal accidents locations in 2017
Fatal accidents locations in 2018
Fatal accidents locations in 2019
Fatal accidents locations in 2020
Fatal accidents locations in 2021
Alcohol use - People drinking some alcohol every month (%)
Alcohol use - People not drinking at all (%)
Alcohol use - Average days/month drinking alcohol
Alcohol use - Average drinks/week
Alcohol use - Average days/year people drink much
Audiometry - Average condition of hearing (%)
Audiometry - People that can hear a whisper from across a quiet room (%)
Audiometry - People that can hear normal voice from across a quiet room (%)
Audiometry - Ears ringing, roaring, buzzing (%)
Audiometry - Had a job exposure to loud noise (%)
Audiometry - Had off-work exposure to loud noise (%)
Blood Pressure & Cholesterol - Has high blood pressure (%)
Blood Pressure & Cholesterol - Checking blood pressure at home (%)
Blood Pressure & Cholesterol - Frequently checking blood cholesterol (%)
Blood Pressure & Cholesterol - Has high cholesterol level (%)
Consumer Behavior - Money monthly spent on food at supermarket/grocery store
Consumer Behavior - Money monthly spent on food at other stores
Consumer Behavior - Money monthly spent on eating out
Consumer Behavior - Money monthly spent on carryout/delivered foods
Consumer Behavior - Income spent on food at supermarket/grocery store (%)
Consumer Behavior - Income spent on food at other stores (%)
Consumer Behavior - Income spent on eating out (%)
Consumer Behavior - Income spent on carryout/delivered foods (%)
Current Health Status - General health condition (%)
Current Health Status - Blood donors (%)
Current Health Status - Has blood ever tested for HIV virus (%)
Current Health Status - Left-handed people (%)
Dermatology - People using sunscreen (%)
Diabetes - Diabetics (%)
Diabetes - Had a blood test for high blood sugar (%)
Diabetes - People taking insulin (%)
Diet Behavior & Nutrition - Diet health (%)
Diet Behavior & Nutrition - Milk product consumption (# of products/month)
Diet Behavior & Nutrition - Meals not home prepared (#/week)
Diet Behavior & Nutrition - Meals from fast food or pizza place (#/week)
Diet Behavior & Nutrition - Ready-to-eat foods (#/month)
Diet Behavior & Nutrition - Frozen meals/pizza (#/month)
Drug Use - People that ever used marijuana or hashish (%)
Drug Use - Ever used hard drugs (%)
Drug Use - Ever used any form of cocaine (%)
Drug Use - Ever used heroin (%)
Drug Use - Ever used methamphetamine (%)
Health Insurance - People covered by health insurance (%)
Kidney Conditions-Urology - Avg. # of times urinating at night
Medical Conditions - People with asthma (%)
Medical Conditions - People with anemia (%)
Medical Conditions - People with psoriasis (%)
Medical Conditions - People with overweight (%)
Medical Conditions - Elderly people having difficulties in thinking or remembering (%)
Medical Conditions - People who ever received blood transfusion (%)
Medical Conditions - People having trouble seeing even with glass/contacts (%)
Medical Conditions - People with arthritis (%)
Medical Conditions - People with gout (%)
Medical Conditions - People with congestive heart failure (%)
Medical Conditions - People with coronary heart disease (%)
Medical Conditions - People with angina pectoris (%)
Medical Conditions - People who ever had heart attack (%)
Medical Conditions - People who ever had stroke (%)
Medical Conditions - People with emphysema (%)
Medical Conditions - People with thyroid problem (%)
Medical Conditions - People with chronic bronchitis (%)
Medical Conditions - People with any liver condition (%)
Medical Conditions - People who ever had cancer or malignancy (%)
Mental Health - People who have little interest in doing things (%)
Mental Health - People feeling down, depressed, or hopeless (%)
Mental Health - People who have trouble sleeping or sleeping too much (%)
Mental Health - People feeling tired or having little energy (%)
Mental Health - People with poor appetite or overeating (%)
Mental Health - People feeling bad about themself (%)
Mental Health - People who have trouble concentrating on things (%)
Mental Health - People moving or speaking slowly or too fast (%)
Mental Health - People having thoughts they would be better off dead (%)
Oral Health - Average years since last visit a dentist
Oral Health - People embarrassed because of mouth (%)
Oral Health - People with gum disease (%)
Oral Health - General health of teeth and gums (%)
Oral Health - Average days a week using dental floss/device
Oral Health - Average days a week using mouthwash for dental problem
Oral Health - Average number of teeth
Pesticide Use - Households using pesticides to control insects (%)
Pesticide Use - Households using pesticides to kill weeds (%)
Physical Activity - People doing vigorous-intensity work activities (%)
Physical Activity - People doing moderate-intensity work activities (%)
Physical Activity - People walking or bicycling (%)
Physical Activity - People doing vigorous-intensity recreational activities (%)
Physical Activity - People doing moderate-intensity recreational activities (%)
Physical Activity - Average hours a day doing sedentary activities
Physical Activity - Average hours a day watching TV or videos
Physical Activity - Average hours a day using computer
Physical Functioning - People having limitations keeping them from working (%)
Physical Functioning - People limited in amount of work they can do (%)
Physical Functioning - People that need special equipment to walk (%)
Physical Functioning - People experiencing confusion/memory problems (%)
Physical Functioning - People requiring special healthcare equipment (%)
Prescription Medications - Average number of prescription medicines taking
Preventive Aspirin Use - Adults 40+ taking low-dose aspirin (%)
Reproductive Health - Vaginal deliveries (%)
Reproductive Health - Cesarean deliveries (%)
Reproductive Health - Deliveries resulted in a live birth (%)
Reproductive Health - Pregnancies resulted in a delivery (%)
Reproductive Health - Women breastfeeding newborns (%)
Reproductive Health - Women that had a hysterectomy (%)
Reproductive Health - Women that had both ovaries removed (%)
Reproductive Health - Women that have ever taken birth control pills (%)
Reproductive Health - Women taking birth control pills (%)
Reproductive Health - Women that have ever used Depo-Provera or injectables (%)
Reproductive Health - Women that have ever used female hormones (%)
Sexual Behavior - People 18+ that ever had sex (vaginal, anal, or oral) (%)
Sexual Behavior - Males 18+ that ever had vaginal sex with a woman (%)
Sexual Behavior - Males 18+ that ever performed oral sex on a woman (%)
Sexual Behavior - Males 18+ that ever had anal sex with a woman (%)
Sexual Behavior - Males 18+ that ever had any sex with a man (%)
Sexual Behavior - Females 18+ that ever had vaginal sex with a man (%)
Sexual Behavior - Females 18+ that ever performed oral sex on a man (%)
Sexual Behavior - Females 18+ that ever had anal sex with a man (%)
Sexual Behavior - Females 18+ that ever had any kind of sex with a woman (%)
Sexual Behavior - Average age people first had sex
Sexual Behavior - Average number of female sex partners in lifetime (males 18+)
Sexual Behavior - Average number of female vaginal sex partners in lifetime (males 18+)
Sexual Behavior - Average age people first performed oral sex on a woman (18+)
Sexual Behavior - Average number of woman performed oral sex on in lifetime (18+)
Sexual Behavior - Average number of male sex partners in lifetime (males 18+)
Sexual Behavior - Average number of male anal sex partners in lifetime (males 18+)
Sexual Behavior - Average age people first performed oral sex on a man (18+)
Sexual Behavior - Average number of male oral sex partners in lifetime (18+)
Sexual Behavior - People using protection when performing oral sex (%)
Sexual Behavior - Average number of times people have vaginal or anal sex a year
Sexual Behavior - People having sex without condom (%)
Sexual Behavior - Average number of male sex partners in lifetime (females 18+)
Sexual Behavior - Average number of male vaginal sex partners in lifetime (females 18+)
Sexual Behavior - Average number of female sex partners in lifetime (females 18+)
Sexual Behavior - Circumcised males 18+ (%)
Sleep Disorders - Average hours sleeping at night
Sleep Disorders - People that has trouble sleeping (%)
Smoking-Cigarette Use - People smoking cigarettes (%)
Taste & Smell - People 40+ having problems with smell (%)
Taste & Smell - People 40+ having problems with taste (%)
Taste & Smell - People 40+ that ever had wisdom teeth removed (%)
Taste & Smell - People 40+ that ever had tonsils teeth removed (%)
Taste & Smell - People 40+ that ever had a loss of consciousness because of a head injury (%)
Taste & Smell - People 40+ that ever had a broken nose or other serious injury to face or skull (%)
Taste & Smell - People 40+ that ever had two or more sinus infections (%)
Weight - Average height (inches)
Weight - Average weight (pounds)
Weight - Average BMI
Weight - People that are obese (%)
Weight - People that ever were obese (%)
Weight - People trying to lose weight (%)
According to our research of Indiana and other state lists, there were 3 registered sex offenders living in Lebanon, Indiana as of April 27, 2024 . The ratio of all residents to sex offenders in Lebanon is 5,317 to 1.The ratio of registered sex offenders to all residents in this city is much lower than the state average.
Officers per 1,000 residents here:
2.60Indiana average:
2.16
Latest news from Lebanon, IN collected exclusively by city-data.com from local newspapers, TV, and radio stations
Ancestries: American (30.6%), German (13.9%), English (10.2%), Irish (7.0%), Italian (4.0%), European (2.7%).
Current Local Time:
Land area: 7.28 square miles.
Population density: 2,332 people per square mile (low).
726 residents are foreign born (2.6% Latin America , 0.6% Europe ).
This city:
4.0%Indiana:
5.6%
Median real estate property taxes paid for housing units with mortgages in 2022: $1,243 (0.6%)Median real estate property taxes paid for housing units with no mortgage in 2022: $1,046 (0.6%)
Nearest city with pop. 50,000+: Indianapolis, IN
Nearest city with pop. 1,000,000+: Chicago, IL
Nearest cities:
Ulen, IN (1.0 miles),
Latitude: 40.05 N, Longitude: 86.47 W
Daytime population change due to commuting: +1,016 (+5.6%)Workers who live and work in this city: 4,694 (49.7%)
Lebanon tourist attractions:
Single-family new house construction building permits:
2022: 107 buildings , average cost: $194,2002021: 55 buildings , average cost: $462,4002020: 76 buildings , average cost: $205,5002019: 60 buildings , average cost: $193,8002018: 22 buildings , average cost: $137,5002017: 33 buildings , average cost: $153,2002016: 34 buildings , average cost: $128,4002015: 27 buildings , average cost: $126,9002014: 8 buildings , average cost: $203,1002013: 9 buildings , average cost: $175,7002012: 3 buildings , average cost: $66,7002011: 3 buildings , average cost: $155,6002010: 12 buildings , average cost: $185,9002009: 3 buildings , average cost: $118,3002008: 14 buildings , average cost: $123,4002007: 27 buildings , average cost: $112,2002006: 26 buildings , average cost: $122,5002005: 64 buildings , average cost: $136,2002004: 62 buildings , average cost: $130,4002003: 59 buildings , average cost: $128,6002002: 64 buildings , average cost: $129,9002001: 74 buildings , average cost: $111,0002000: 66 buildings , average cost: $107,7001999: 82 buildings , average cost: $100,8001998: 88 buildings , average cost: $106,0001997: 70 buildings , average cost: $95,000Unemployment in December 2023:
Population change in the 1990s: +2,026 (+16.6%).
Most common occupations in Lebanon, IN (%)
Both Males Females
Other office and administrative support workers, including supervisors (5.7%)
Other production occupations, including supervisors (4.2%)
Building and grounds cleaning and maintenance occupations (3.7%)
Other sales and related occupations, including supervisors (3.5%)
Metal workers and plastic workers (3.5%)
Driver/sales workers and truck drivers (3.5%)
Material recording, scheduling, dispatching, and distributing workers (3.4%)
Driver/sales workers and truck drivers (6.7%)
Other production occupations, including supervisors (6.1%)
Building and grounds cleaning and maintenance occupations (5.0%)
Metal workers and plastic workers (4.8%)
Laborers and material movers, hand (3.9%)
Other sales and related occupations, including supervisors (3.6%)
Material recording, scheduling, dispatching, and distributing workers (3.6%)
Other office and administrative support workers, including supervisors (9.4%)
Secretaries and administrative assistants (6.6%)
Child care workers (4.7%)
Cashiers (3.9%)
Other sales and related occupations, including supervisors (3.3%)
Assemblers and fabricators (3.2%)
Material recording, scheduling, dispatching, and distributing workers (3.2%)
Tornado activity:
Lebanon-area historical tornado activity is slightly above Indiana state average. It is 118% greater than the overall U.S. average.
On 4/11/1965, a category F4 (max. wind speeds 207-260 mph) tornado 21.2 miles away from the Lebanon city center killed 28 people and injured 123 people and caused between $5,000,000 and $50,000,000 in damages.
On 4/11/1965, a category F4 tornado 24.5 miles away from the city center killed 25 people and injured 835 people and caused between $50,000,000 and $500,000,000 in damages.
Earthquake activity:
Lebanon-area historical earthquake activity is significantly above Indiana state average. It is 81% greater than the overall U.S. average. On 4/18/2008 at 09:36:59, a magnitude 5.4 (5.1 MB, 4.8 MS, 5.4 MW, 5.2 MW, Class: Moderate, Intensity: VI - VII) earthquake occurred 134.1 miles away from Lebanon center On 4/18/2008 at 09:36:59, a magnitude 5.2 (5.2 MW, Depth: 8.9 mi) earthquake occurred 134.2 miles away from the city center On 6/10/1987 at 23:48:54, a magnitude 5.1 (4.9 MB, 4.4 MS, 4.6 MS, 5.1 LG) earthquake occurred 113.8 miles away from the city center On 7/27/1980 at 18:52:21, a magnitude 5.2 (5.1 MB, 4.7 MS, 5.0 UK, 5.2 UK) earthquake occurred 186.3 miles away from Lebanon center On 6/18/2002 at 17:37:15, a magnitude 5.0 (4.3 MB, 4.6 MW, 5.0 LG) earthquake occurred 159.2 miles away from the city center On 4/18/2008 at 15:14:16, a magnitude 4.8 (4.5 MB, 4.8 MW, 4.6 MW, Class: Light, Intensity: IV - V) earthquake occurred 131.6 miles away from the city center Magnitude types: regional Lg-wave magnitude (LG), body-wave magnitude (MB), surface-wave magnitude (MS), moment magnitude (MW) Natural disasters: The number of natural disasters in Boone County (14) is near the US average (15).Major Disasters (Presidential) Declared: 9Emergencies Declared: 4Storms: 6, Floods: 5, Tornadoes: 4, Winter Storms: 3, Snowstorms: 2, Blizzard: 1, Hurricane: 1, Ice Storm: 1, Snow: 1, Other: 1 (Note: some incidents may be assigned to more than one category). Hospitals in Lebanon: BEHAVIORAL HEALTHCARE OF LEBANON (provides emergency services, 1711 LAFAYETTE AVE) HOUSTON GROUP HOMES INC (1275 MID JAMESTOWN RD) HOUSTON GROUP HOMES INC (2805 W 50 N) KOALA HOSPITAL AND COUNSELING CENTERS (provides emergency services, 1711 LAFAYETTE AVENUE) WITHAM HEALTH SERVICES (Government - Local, 2605 N LEBANON ST) Nursing Homes in Lebanon: COUNTRYSIDE HEALTHCARE CENTER (1585 PERRY WORTH ROAD PO BOX 100) ENGLISH NURSING HOME (1015 NORTH LEBANON STREET) ESSEX MANOR (301 WEST ESSEX STREET) ESSEX NURSING AND REHABILITATION CENTER (301 W ESSEX ST) HICKORY CREEK AT LEBANON (1585 PERRY WORTH RD) HOMEWOOD HEALTH CAMPUS (2494 N LEBANON ST) KINDRED TRANSITIONAL CARE AND REHAB-PARKWOOD (1001 N GRANT ST) PARKWOOD HEALTHCARE CENTER (1001 NORTH GRANT STREET) Dialysis Facilities in Lebanon: LIBERTY DIALYSIS - LEBANON, LLC (2485 N. LEBANON STREET) Home Health Centers in Lebanon: EXCEL HOME HEALTH CARE LLC (1102 S LEBANON ST) Airports located in Lebanon: Colleges/universities with over 2000 students nearest to Lebanon:
ITT Technical Institute-Indianapolis (about 16 miles; Indianapolis, IN ; Full-time enrollment: 4,765)
Butler University (about 22 miles; Indianapolis, IN ; FT enrollment: 4,388)
Marian University (about 22 miles; Indianapolis, IN ; FT enrollment: 2,476)
Ivy Tech Community College (about 24 miles; Indianapolis, IN ; FT enrollment: 71,493)
Indiana University-Purdue University-Indianapolis (about 26 miles; Indianapolis, IN ; FT enrollment: 22,751)
American College of Education (about 26 miles; Indianapolis, IN ; FT enrollment: 2,718)
Harrison College-Indianapolis (about 27 miles; Indianapolis, IN ; FT enrollment: 4,244)
Public high school in Lebanon:
Private high schools in Lebanon:
Public elementary/middle schools in Lebanon: LEBANON MIDDLE SCHOOL Students: 826, Location: 1800 N GRANT ST, Grades: 6-8)HATTIE B STOKES ELEMENTARY SCHOOL Students: 520, Location: 1005 HENDRICKS DR, Grades: KG-5)HARNEY ELEMENTARY SCHOOL Students: 507, Location: 1500 N GARFIELD ST, Grades: KG-5)CENTRAL ELEMENTARY SCHOOL Students: 344, Location: 515 E WILLIAMS ST, Grades: KG-5)PERRY WORTH ELEMENTARY SCHOOL Students: 316, Location: 3900 E 300 S, Grades: KG-5)See full list of schools located in Lebanon Library in Lebanon: LEBANON PUBLIC LIBRARY Operating income: $1,398,563; Location: 104 EAST WASHINGTON STREET; 77,226 books ; 4,633 audio materials ; 5,832 video materials ; 10 local licensed databases ; 37 state licensed databases ; 216 print serial subscriptions )
Notable locations in Lebanon: (A) , Center Township Fire Department (B) , Lebanon Fire Department Station 1 (C) . Display/hide their locations on the map
Cemetery: (1) . Display/hide its location on the map
Parks in Lebanon include: (1) , Municipal Park (2) . Display/hide their locations on the map
Tourist attractions:
Hotels:
Birthplace of: Sylvia Likens - Children, Craig Terrill - 2005 NFL player (Seattle Seahawks, born : Jun 27, 1980), Doug Jones (baseball) - Baseball player, Robert H. Johns - Meteorologist.
Boone County has a predicted average indoor radon screening level greater than 4 pCi/L (pico curies per liter) - Highest Potential Drinking water stations with addresses in Lebanon and their reported violations in the past:
PLEASANT VIEW CHURCH (Population served: 100, Groundwater):
Past health violations:
MCL, Monthly (TCR) - In JUL-2013, Contaminant: Coliform. Follow-up actions: St Public Notif requested (AUG-06-2013), St Violation/Reminder Notice (AUG-06-2013), St Boil Water Order (AUG-06-2013), St Compliance achieved (OCT-28-2013)
MCL, Monthly (TCR) - In JAN-2013, Contaminant: Coliform. Follow-up actions: St Boil Water Order (FEB-01-2013), St Violation/Reminder Notice (FEB-01-2013), St Public Notif requested (FEB-01-2013), St Public Notif received (FEB-12-2013), St Compliance achieved (FEB-18-2013)
MCL, Monthly (TCR) - In OCT-2010, Contaminant: Coliform. Follow-up actions: St Public Notif requested (NOV-17-2010), St Violation/Reminder Notice (NOV-17-2010), St Compliance achieved (MAR-01-2011)
Past monitoring violations:
Monitoring, Source Water (GWR) - In NOV-16-2010, Contaminant: E. COLI. Follow-up actions: St Public Notif requested (NOV-17-2010), St Violation/Reminder Notice (NOV-17-2010), St Compliance achieved (3 times from DEC-10-2010 to MAY-24-2012)
Monitoring, Repeat Major (TCR) - In OCT-2010, Contaminant: Coliform (TCR). Follow-up actions: St Public Notif requested (NOV-17-2010), St Violation/Reminder Notice (NOV-17-2010), St Compliance achieved (MAR-01-2011)
6 routine major monitoring violations
2 regular monitoring violations
Population served: 100, Groundwater):
Past monitoring violations:
5 routine major monitoring violations
One regular monitoring violation
Drinking water stations with addresses in Lebanon that have no violations reported:
LEBANON UTILITIES (Population served: 16,120, Primary Water Source Type: Groundwater)
Average household size: This city:
2.4 peopleIndiana:
2.5 people
Percentage of family households: This city:
62.9%Whole state:
66.9%
Percentage of households with unmarried partners: This city:
8.5%Whole state:
6.9%
Likely homosexual households (counted as self-reported same-sex unmarried-partner households)
Lesbian couples: 0.4% of all households Gay men: 0.2% of all households
People in group quarters in Lebanon in 2010:
263 people in nursing facilities/skilled-nursing facilities
137 people in local jails and other municipal confinement facilities
40 people in residential treatment centers for juveniles (non-correctional)
23 people in other noninstitutional facilities
17 people in group homes intended for adults
2 people in workers' group living quarters and job corps centers
People in group quarters in Lebanon in 2000:
152 people in nursing homes
64 people in other noninstitutional group quarters
13 people in homes for the mentally ill
Banks with branches in Lebanon (2011 data):
The Huntington National Bank: 102 North Lebanon Street Branch at 102 North Lebanon Street, branch established on 1935/03/18. Info updated 2012/04/02: Bank assets: $54,183.4 mil, Deposits: $44,300.3 mil, headquarters in Columbus, OH, positive income , Commercial Lending Specialization, 878 total offices , Holding Company: Huntington Bancshares Incorporated
State Bank of Lizton: Lebanon Branch at 1801 Indianapolis Avenue, branch established on 1987/01/02. Info updated 2006/11/03: Bank assets: $376.5 mil, Deposits: $337.0 mil, headquarters in Lizton, IN, positive income , Commercial Lending Specialization, 10 total offices , Holding Company: Lizton Financial Corporation
PNC Bank, National Association: Lebanon Downtown Branch at 202 East Washington Street, branch established on 1800/01/01. Info updated 2012/03/20: Bank assets: $263,309.6 mil, Deposits: $197,343.0 mil, headquarters in Wilmington, DE, positive income , Commercial Lending Specialization, 3085 total offices , Holding Company: Pnc Financial Services Group, Inc., The
The Farmers Bank, Frankfort, Indiana: Lebanon Branch at 2304 North Lebanon Street, branch established on 2001/02/17. Info updated 2010/04/11: Bank assets: $421.5 mil, Deposits: $333.9 mil, headquarters in Frankfort, IN, positive income , Commercial Lending Specialization, 10 total offices , Holding Company: Farmers Bancorp, Frankfort, Indiana, The
The Home National Bank of Thorntown: Lebanon Branch at 2510 N Lebanon St, branch established on 2008/12/08. Info updated 2006/11/03: Bank assets: $93.0 mil, Deposits: $81.6 mil, headquarters in Thorntown, IN, positive income , 2 total offices , Holding Company: Home National Corporation
KeyBank National Association: Lebanon Main Branch at 127 West Main Street, branch established on 1911/09/29. Info updated 2008/03/03: Bank assets: $86,198.8 mil, Deposits: $64,214.8 mil, headquarters in Cleveland, OH, positive income , Commercial Lending Specialization, 1067 total offices , Holding Company: Keycorp
For population 15 years and over in Lebanon:
Never married: 30.2%Now married: 45.2%Separated: 0.7%Widowed: 7.4%Divorced: 16.4% For population 25 years and over in Lebanon:
High school or higher: 89.1%Bachelor's degree or higher: 23.7%Graduate or professional degree: 5.4%Unemployed: 3.8%Mean travel time to work (commute): 19.3 minutes
Education Gini index (Inequality in education) Here:
10.2Indiana average:
11.3
Religion statistics for Lebanon, IN (based on Boone County data)
Religion Adherents Congregations Evangelical Protestant 13,919 36 Mainline Protestant 9,955 22 Catholic 9,333 2 Other 340 3 None 23,093 -
Source: Clifford Grammich, Kirk Hadaway, Richard Houseal, Dale E.Jones, Alexei Krindatch, Richie Stanley and Richard H.Taylor. 2012. 2010 U.S.Religion Census: Religious Congregations & Membership Study. Association of Statisticians of American Religious Bodies. Jones, Dale E., et al. 2002. Congregations and Membership in the United States 2000. Nashville, TN: Glenmary Research Center. Graphs represent county-level data
Food Environment Statistics: Number of grocery stores : 10This county :
1.85 / 10,000 pop.Indiana :
1.73 / 10,000 pop.
Number of convenience stores (no gas) : 2Boone County :
0.37 / 10,000 pop.Indiana :
0.50 / 10,000 pop.
Number of convenience stores (with gas) : 11Boone County :
2.04 / 10,000 pop.Indiana :
3.57 / 10,000 pop.
Number of full-service restaurants : 38Boone County :
7.04 / 10,000 pop.Indiana :
6.78 / 10,000 pop.
Adult diabetes rate : Boone County :
9.3%Indiana :
9.2%
Adult obesity rate : Boone County :
30.3%Indiana :
29.0%
Low-income preschool obesity rate : Boone County :
11.2%Indiana :
14.3%
Health and Nutrition: Healthy diet rate : Lebanon:
51.4%Indiana:
49.3%
Average overall health of teeth and gums : This city:
48.9%Indiana:
46.2%
People feeling badly about themselves : People not drinking alcohol at all : This city:
9.4%State:
10.6%
Average hours sleeping at night : Overweight people : Lebanon:
31.7%Indiana:
33.9%
General health condition : Lebanon:
58.4%Indiana:
56.1%
Average condition of hearing : Lebanon:
79.2%Indiana:
78.7%
More about Health and Nutrition of Lebanon, IN Residents
Local government employment and payroll (March 2022)
Function
Full-time employees
Monthly full-time payroll
Average yearly full-time wage
Part-time employees
Monthly part-time payroll
Police Protection - Officers
37 $216,287 $70,147 0 $0 Firefighters
36 $203,669 $67,890 0 $0 Electric Power
19 $125,918 $79,527 0 $0 Sewerage
17 $94,543 $66,736 0 $0 Parks and Recreation
12 $41,317 $41,317 3 $523 Water Supply
12 $74,584 $74,584 0 $0 Streets and Highways
11 $51,607 $56,299 0 $0 Other Government Administration
5 $11,839 $28,414 13 $8,684 Other and Unallocable
4 $19,300 $57,900 11 $30,888 Financial Administration
4 $15,895 $47,685 0 $0 Police - Other
2 $9,170 $55,020 0 $0 Fire - Other
1 $3,528 $42,336 0 $0
Totals for Government
160 $867,657 $65,074 27 $40,095
Lebanon government finances - Expenditure in 2021 (per resident):
Construction - General - Other: $264,000 ($15.55)
Current Operations - Electric Utilities: $20,349,000 ($1198.27)
Police Protection: $6,146,000 ($361.91)Sewerage: $3,941,000 ($232.07)Water Utilities: $2,832,000 ($166.76)General Public Buildings: $2,275,000 ($133.97)Local Fire Protection: $2,172,000 ($127.90)Parks and Recreation: $1,418,000 ($83.50)Central Staff Services: $1,258,000 ($74.08)Regular Highways: $880,000 ($51.82)General - Other: $770,000 ($45.34)Miscellaneous Commercial Activities - Other: $521,000 ($30.68)Financial Administration: $226,000 ($13.31)Housing and Community Development: $158,000 ($9.30)Judicial and Legal Services: $120,000 ($7.07)Solid Waste Management: $1,000 ($0.06)Electric Utilities - Interest on Debt: $1,085,000 ($63.89)
General - Interest on Debt: $1,581,000 ($93.10)
Intergovernmental to Local - Other - Sewerage: $269,000 ($15.84)
Other - Electric Utilities: $189,000 ($11.13)Other - Water Utilities: $187,000 ($11.01)Other - General - Other: $7,000 ($0.41)Other Capital Outlay - Sewerage: $2,608,000 ($153.57)
General - Other: $772,000 ($45.46)Water Utilities: $720,000 ($42.40)Electric Utilities: $710,000 ($41.81)General Public Building: $166,000 ($9.78)Regular Highways: $108,000 ($6.36)Local Fire Protection: $95,000 ($5.59)Police Protection: $63,000 ($3.71)Parks and Recreation: $62,000 ($3.65)Central Staff Services: $16,000 ($0.94)Total Salaries and Wages: $3,062,000 ($180.31)
Water Utilities - Interest on Debt: $242,000 ($14.25)
Lebanon government finances - Revenue in 2021 (per resident):
Charges - Sewerage: $26,500,000 ($1560.48)
Miscellaneous Commercial Activities: $1,765,000 ($103.93)Solid Waste Management: $1,086,000 ($63.95)Parks and Recreation: $244,000 ($14.37)Parking Facilities: $10,000 ($0.59)Local Intergovernmental - Highways: $280,000 ($16.49)
Other: $40,000 ($2.36)Miscellaneous - General Revenue - Other: $1,470,000 ($86.56)
Rents: $240,000 ($14.13)Interest Earnings: $137,000 ($8.07)Fines and Forfeits: $27,000 ($1.59)Donations From Private Sources: $19,000 ($1.12)Revenue - Electric Utilities: $97,417,000 ($5736.49)
Water Utilities: $19,331,000 ($1138.32)State Intergovernmental - Other: $3,428,000 ($201.86)
Highways: $1,146,000 ($67.48)Sewerage: $518,000 ($30.50)General Local Government Support: $68,000 ($4.00)Tax - Property: $7,249,000 ($426.86)
Other Selective Sales: $424,000 ($24.97)Occupation and Business License - Other: $152,000 ($8.95)Other License: $35,000 ($2.06)
Lebanon government finances - Debt in 2021 (per resident):
Long Term Debt - Beginning Outstanding - Unspecified Public Purpose: $72,701,000 ($4281.06)
Outstanding Unspecified Public Purpose: $71,570,000 ($4214.46)Retired Unspecified Public Purpose: $1,298,000 ($76.43)Issue, Unspecified Public Purpose: $167,000 ($9.83)
Lebanon government finances - Cash and Securities in 2021 (per resident):
Bond Funds - Cash and Securities: $3,746,000 ($220.59)
Other Funds - Cash and Securities: $58,187,000 ($3426.39)
Sinking Funds - Cash and Securities: $4,227,000 ($248.91)
Businesses in Lebanon, IN
Name Count Name Count
ALDI 1 Little Caesars Pizza 1 AT&T 1 Long John Silver's 1 Advance Auto Parts 1 MasterBrand Cabinets 3 Arby's 1 McDonald's 1 AutoZone 1 Motel 6 1 Big O Tires 1 Papa John's Pizza 1 Burger King 1 Pizza Hut 1 CVS 1 RadioShack 1 Chevrolet 1 Sears 1 Comfort Inn 1 Starbucks 1 Curves 1 Steak 'n Shake 1 Dairy Queen 1 Subway 3 Dennys 2 Super 8 1 Domino's Pizza 1 T-Mobile 2 Econo Lodge 1 Taco Bell 1 FedEx 2 U-Haul 1 Ford 1 UPS 4 H&R Block 1 Walgreens 1 Hardee's 1 Walmart 1 Holiday Inn 1 Wendy's 1 KFC 1 White Castle 1 Kroger 1 YMCA 1 Lane Furniture 1
Strongest AM radio stations in Lebanon:
WIBC (1070 AM; 50 kW; INDIANAPOLIS, IN; Owner: EMMIS RADIO LICENSE CORPORATION)
WXLW (950 AM; 5 kW; INDIANAPOLIS, IN)
WXNT (1430 AM; 5 kW; INDIANAPOLIS, IN; Owner: MYSTAR COMMUNICATIONS CORPORATION)
WNDE (1260 AM; 5 kW; INDIANAPOLIS, IN; Owner: CAPSTAR TX LIMITED PARTNERSHIP)
WBAA (920 AM; 5 kW; WEST LAFAYETTE, IN; Owner: PURDUE UNIVERSITY)
WBRI (1500 AM; daytime; 5 kW; INDIANAPOLIS, IN)
WOWO (1190 AM; 50 kW; FORT WAYNE, IN; Owner: PATHFINDER COMMUNICATIONS CORPORATION)
WTLC (1310 AM; 5 kW; INDIANAPOLIS, IN; Owner: RADIO ONE OF INDIANA, LLC)
WLW (700 AM; 50 kW; CINCINNATI, OH; Owner: JACOR BROADCASTING CORPORATION)
WIOU (1350 AM; 5 kW; KOKOMO, IN; Owner: MID-AMERICA RADIO GROUP, INC.)
WNTS (1590 AM; 5 kW; BEECH GROVE, IN; Owner: S + M BROADCASTING CO., INC.)
WLS (890 AM; 50 kW; CHICAGO, IL; Owner: WLS, INC.)
WHAS (840 AM; 50 kW; LOUISVILLE, KY; Owner: CLEAR CHANNEL BROADCASTING LICENSES, INC.)
Strongest FM radio stations in Lebanon:
WYJZ (100.9 FM; LEBANON, IN; Owner: RADIO ONE OF INDIANA, LLC)
WFBQ (94.7 FM; INDIANAPOLIS, IN; Owner: CAPSTAR TX LIMITED PARTNERSHIP)
WRZX (103.3 FM; INDIANAPOLIS, IN; Owner: CAPSTAR TX LIMITED PARTNERSHIP)
WIRE (91.1 FM; LEBANON, IN; Owner: HOOSIER BROADCASTING CORPORATION)
WTPI (107.9 FM; INDIANAPOLIS, IN; Owner: MYSTAR COMMUNICATIONS CORPORATION)
WEDJ (107.1 FM; DANVILLE, IN; Owner: CONTINENTAL BROADCAST GROUP, LLC)
WFYI-FM (90.1 FM; INDIANAPOLIS, IN; Owner: METROPOLITAN IN. PUBLIC B/CING, INC.)
WNOU (93.1 FM; INDIANAPOLIS, IN; Owner: EMMIS RADIO LICENSE CORPORATION)
WFMS (95.5 FM; INDIANAPOLIS, IN; Owner: WFMS LICO, INC)
WYXB (105.7 FM; INDIANAPOLIS, IN; Owner: EMMIS RADIO LICENSE CORPORATION)
WZPL (99.5 FM; GREENFIELD, IN; Owner: MYSTAR COMMUNICATIONS CORPORATION)
WHHH (96.3 FM; INDIANAPOLIS, IN; Owner: RADIO ONE OF INDIANA, LLC)
WENS (97.1 FM; SHELBYVILLE, IN; Owner: EMMIS RADIO LICENSE CORPORATION)
WIMC (103.9 FM; CRAWFORDSVILLE, IN; Owner: C.V.L. BROADCASTING, INC.)
WGRL (93.9 FM; NOBLESVILLE, IN; Owner: INDY LICO, INC.)
WGLD (104.5 FM; INDIANAPOLIS, IN; Owner: INDY LICO, INC)
WCDQ (106.3 FM; CRAWFORDSVILLE, IN; Owner: C.V.L. BROADCASTING, INC.)
WSHW (99.7 FM; FRANKFORT, IN; Owner: KASPAR BROADCASTING CO., INC.)
WKLU (101.9 FM; BROWNSBURG, IN; Owner: QUINN BROADCASTING, INC.)
WRDZ-FM (98.3 FM; PLAINFIELD, IN; Owner: ABC, INC.)
TV broadcast stations around Lebanon:
WTHR (Channel 13; INDIANAPOLIS, IN; Owner: VIDEOINDIANA, INC.)
WISH-TV (Channel 8; INDIANAPOLIS, IN; Owner: INDIANA BROADCASTING, LLC)
WHMB-TV (Channel 40; INDIANAPOLIS, IN; Owner: LESEA BROADCASTING CORPORATION)
WXIN (Channel 59; INDIANAPOLIS, IN; Owner: TRIBUNE TELEVISION COMPANY)
WRTV (Channel 6; INDIANAPOLIS, IN; Owner: MCGRAW-HILL BROADCASTING COMPANY, INC.)
WBXI-CA (Channel 47; INDIANAPOLIS, IN; Owner: THE BOX WORLDWIDE LLC)
WALV-CA (Channel 50; INDIANAPOLIS, IN; Owner: VIDEOHIO, INC..)
WFYI (Channel 20; INDIANAPOLIS, IN; Owner: METROPOLITAN INDIANAPOLIS PUBLIC BROADCASTING, INC.)
WIIH-CA (Channel 11; INDIANAPOLIS, IN; Owner: INDIANA BROADCASTING, LLC)
WNDY-TV (Channel 23; MARION, IN; Owner: UPN STATIONS GROUP INC.)
WKOG-LP (Channel 31; INDIANAPOLIS, IN; Owner: KINGDOM OF GOD MINISTRIES, INC.)
WTBU-TV (Channel 69; INDIANAPOLIS, IN; Owner: BUTLER UNIVERSITY)
WDNI-LP (Channel 65; INDIANAPOLIS, IN; Owner: RADIO ONE OF INDIANA, LLC)
WIPX-LP (Channel 51; INDIANAPOLIS, IN; Owner: PAXSON COMMUNICATIONS LICENSE COMPANY, LLC)
WLFI-TV (Channel 18; LAFAYETTE, IN; Owner: PRIMELAND TELEVISION, INC.)
WTTK (Channel 29; KOKOMO, IN; Owner: TRIBUNE BROADCAST HOLDINGS, INC.)
National Bridge Inventory (NBI) Statistics 95 Number of bridges568ft / 173m Total length $7,230,000 Total costs812,341 Total average daily traffic209,923 Total average daily truck traffic
New bridges - historical statistics
1 Before 1900 1 1900-1909 2 1910-1919 4 1920-1929 9 1930-1939 9 1940-1949 8 1950-1959 7 1960-1969 12 1970-1979 2 1980-1989 10 1990-1999 15 2000-2009 12 2010-2019 3 2020-2022
See full National Bridge Inventory statistics for Lebanon, IN
Home Mortgage Disclosure Act Aggregated Statistics For Year 2009(Based on 2 partial tracts) A) FHA, FSA/RHS & VA B) Conventional C) Refinancings D) Home Improvement Loans E) Loans on Dwellings For 5+ Families F) Non-occupant Loans on G) Loans On Manufactured Number Average Value Number Average Value Number Average Value Number Average Value Number Average Value Number Average Value Number Average Value
LOANS ORIGINATED 61 $97,645 37 $81,119 152 $107,694 10 $27,101 1 $539,470 18 $56,274 4 $34,995 APPLICATIONS APPROVED, NOT ACCEPTED 2 $72,805 7 $88,713 12 $95,647 1 $6,620 0 $0 2 $43,500 5 $21,414 APPLICATIONS DENIED 13 $91,600 10 $56,444 84 $97,855 6 $32,748 0 $0 5 $69,580 5 $37,396 APPLICATIONS WITHDRAWN 6 $96,097 2 $47,745 36 $109,111 1 $43,040 0 $0 1 $57,390 1 $31,210 FILES CLOSED FOR INCOMPLETENESS 2 $98,990 2 $58,620 6 $149,922 0 $0 0 $0 0 $0 0 $0
Aggregated Statistics For Year 2008(Based on 2 partial tracts) A) FHA, FSA/RHS & VA B) Conventional C) Refinancings D) Home Improvement Loans E) Loans on Dwellings For 5+ Families F) Non-occupant Loans on G) Loans On Manufactured Number Average Value Number Average Value Number Average Value Number Average Value Number Average Value Number Average Value Number Average Value
LOANS ORIGINATED 66 $102,718 61 $91,858 109 $101,321 12 $36,642 1 $75,750 27 $65,976 14 $45,871 APPLICATIONS APPROVED, NOT ACCEPTED 7 $93,461 12 $38,058 17 $83,963 5 $14,100 0 $0 1 $42,470 12 $33,812 APPLICATIONS DENIED 13 $95,434 15 $71,519 80 $110,576 17 $54,628 0 $0 5 $58,782 9 $39,873 APPLICATIONS WITHDRAWN 5 $80,340 9 $84,958 45 $116,344 3 $53,280 0 $0 3 $71,860 3 $21,753 FILES CLOSED FOR INCOMPLETENESS 2 $103,730 2 $117,825 10 $89,708 0 $0 0 $0 1 $87,010 0 $0
Aggregated Statistics For Year 2007(Based on 2 partial tracts) A) FHA, FSA/RHS & VA B) Conventional C) Refinancings D) Home Improvement Loans E) Loans on Dwellings For 5+ Families F) Non-occupant Loans on G) Loans On Manufactured Number Average Value Number Average Value Number Average Value Number Average Value Number Average Value Number Average Value Number Average Value
LOANS ORIGINATED 41 $92,516 124 $84,316 116 $99,301 28 $29,503 1 $1,743,510 35 $76,545 22 $40,497 APPLICATIONS APPROVED, NOT ACCEPTED 1 $51,080 19 $80,608 26 $103,113 4 $22,940 0 $0 5 $86,636 5 $30,644 APPLICATIONS DENIED 4 $117,042 38 $78,294 118 $98,775 31 $46,390 1 $2,300 15 $78,639 17 $38,872 APPLICATIONS WITHDRAWN 3 $96,470 12 $72,843 44 $113,119 1 $40,170 0 $0 5 $106,262 5 $38,778 FILES CLOSED FOR INCOMPLETENESS 1 $51,080 4 $107,340 15 $112,195 1 $94,690 0 $0 2 $93,365 0 $0
Aggregated Statistics For Year 2006(Based on 2 partial tracts) A) FHA, FSA/RHS & VA B) Conventional C) Refinancings D) Home Improvement Loans E) Loans on Dwellings For 5+ Families F) Non-occupant Loans on G) Loans On Manufactured Number Average Value Number Average Value Number Average Value Number Average Value Number Average Value Number Average Value Number Average Value
LOANS ORIGINATED 34 $97,052 142 $79,585 136 $101,779 32 $31,044 1 $80,350 27 $122,733 5 $24,780 APPLICATIONS APPROVED, NOT ACCEPTED 6 $131,325 19 $72,073 28 $85,082 10 $23,914 0 $0 2 $80,995 5 $25,914 APPLICATIONS DENIED 7 $119,583 50 $74,985 151 $103,887 28 $24,543 0 $0 16 $119,414 14 $19,859 APPLICATIONS WITHDRAWN 2 $59,875 21 $90,307 69 $99,388 5 $64,702 0 $0 6 $143,090 1 $36,890 FILES CLOSED FOR INCOMPLETENESS 0 $0 7 $72,184 30 $102,210 1 $121,090 0 $0 4 $93,172 0 $0
Aggregated Statistics For Year 2005(Based on 2 partial tracts) A) FHA, FSA/RHS & VA B) Conventional C) Refinancings D) Home Improvement Loans E) Loans on Dwellings For 5+ Families F) Non-occupant Loans on G) Loans On Manufactured Number Average Value Number Average Value Number Average Value Number Average Value Number Average Value Number Average Value Number Average Value
LOANS ORIGINATED 41 $100,648 170 $80,815 182 $87,381 32 $37,531 4 $365,955 48 $65,760 7 $22,159 APPLICATIONS APPROVED, NOT ACCEPTED 2 $90,465 22 $66,431 30 $91,543 9 $40,146 0 $0 4 $84,242 5 $41,722 APPLICATIONS DENIED 2 $87,485 70 $72,374 155 $96,207 38 $29,405 0 $0 11 $79,424 25 $35,092 APPLICATIONS WITHDRAWN 0 $0 16 $78,108 86 $95,145 9 $125,233 0 $0 9 $86,062 1 $45,910 FILES CLOSED FOR INCOMPLETENESS 1 $115,390 8 $61,028 41 $103,918 1 $126,830 0 $0 7 $64,854 1 $12,300
Aggregated Statistics For Year 2004(Based on 2 partial tracts) A) FHA, FSA/RHS & VA B) Conventional C) Refinancings D) Home Improvement Loans E) Loans on Dwellings For 5+ Families F) Non-occupant Loans on G) Loans On Manufactured Number Average Value Number Average Value Number Average Value Number Average Value Number Average Value Number Average Value Number Average Value
LOANS ORIGINATED 42 $96,637 135 $85,537 204 $92,198 34 $34,158 2 $192,255 36 $91,756 3 $35,840 APPLICATIONS APPROVED, NOT ACCEPTED 3 $100,543 17 $99,287 40 $81,284 10 $21,727 0 $0 6 $124,243 5 $40,096 APPLICATIONS DENIED 7 $98,684 35 $60,582 139 $86,231 26 $29,780 0 $0 13 $72,915 19 $30,233 APPLICATIONS WITHDRAWN 1 $45,910 10 $94,788 83 $95,708 6 $38,178 0 $0 6 $70,183 3 $18,917 FILES CLOSED FOR INCOMPLETENESS 0 $0 8 $52,880 39 $98,925 1 $45,910 0 $0 2 $73,115 3 $26,483
Aggregated Statistics For Year 2003(Based on 2 partial tracts) A) FHA, FSA/RHS & VA B) Conventional C) Refinancings D) Home Improvement Loans E) Loans on Dwellings For 5+ Families F) Non-occupant Loans on Number Average Value Number Average Value Number Average Value Number Average Value Number Average Value Number Average Value
LOANS ORIGINATED 42 $90,146 113 $75,641 360 $89,819 28 $27,544 2 $154,065 48 $66,177 APPLICATIONS APPROVED, NOT ACCEPTED 5 $90,352 14 $66,468 56 $81,790 5 $78,662 0 $0 7 $60,534 APPLICATIONS DENIED 4 $86,950 32 $58,989 172 $89,198 18 $14,937 0 $0 7 $56,954 APPLICATIONS WITHDRAWN 2 $78,825 9 $97,049 75 $98,090 2 $14,060 0 $0 4 $78,118 FILES CLOSED FOR INCOMPLETENESS 1 $71,880 3 $96,937 23 $84,930 1 $22,960 0 $0 2 $69,210
Aggregated Statistics For Year 2002(Based on 2 partial tracts) A) FHA, FSA/RHS & VA B) Conventional C) Refinancings D) Home Improvement Loans E) Loans on Dwellings For 5+ Families F) Non-occupant Loans on Number Average Value Number Average Value Number Average Value Number Average Value Number Average Value Number Average Value
LOANS ORIGINATED 57 $101,488 99 $75,154 323 $87,616 32 $13,511 0 $0 36 $50,450 APPLICATIONS APPROVED, NOT ACCEPTED 2 $107,785 19 $49,179 60 $84,678 5 $10,916 0 $0 7 $60,937 APPLICATIONS DENIED 0 $0 54 $34,504 139 $73,759 25 $22,956 1 $127,680 6 $79,310 APPLICATIONS WITHDRAWN 3 $91,887 14 $85,294 66 $81,765 2 $7,095 0 $0 7 $65,537 FILES CLOSED FOR INCOMPLETENESS 0 $0 5 $75,646 39 $82,419 2 $8,560 0 $0 2 $69,045
Aggregated Statistics For Year 2001(Based on 2 partial tracts) A) FHA, FSA/RHS & VA B) Conventional C) Refinancings D) Home Improvement Loans E) Loans on Dwellings For 5+ Families F) Non-occupant Loans on Number Average Value Number Average Value Number Average Value Number Average Value Number Average Value Number Average Value
LOANS ORIGINATED 82 $93,553 94 $78,432 274 $80,404 31 $18,026 1 $146,340 26 $57,319 APPLICATIONS APPROVED, NOT ACCEPTED 1 $55,090 8 $56,056 50 $75,216 8 $12,828 0 $0 2 $74,095 APPLICATIONS DENIED 6 $89,040 54 $49,271 153 $72,707 28 $14,076 0 $0 6 $46,330 APPLICATIONS WITHDRAWN 2 $53,965 5 $83,544 65 $74,541 4 $11,112 1 $64,310 3 $53,370 FILES CLOSED FOR INCOMPLETENESS 2 $62,795 0 $0 30 $86,914 1 $23,650 0 $0 1 $68,870
Aggregated Statistics For Year 2000(Based on 2 partial tracts) A) FHA, FSA/RHS & VA B) Conventional C) Refinancings D) Home Improvement Loans F) Non-occupant Loans on Number Average Value Number Average Value Number Average Value Number Average Value Number Average Value
LOANS ORIGINATED 56 $91,748 88 $70,156 95 $58,943 52 $16,931 14 $59,036 APPLICATIONS APPROVED, NOT ACCEPTED 2 $69,440 16 $39,457 34 $64,421 18 $18,174 2 $61,115 APPLICATIONS DENIED 5 $94,514 67 $45,606 125 $58,354 32 $18,129 10 $46,411 APPLICATIONS WITHDRAWN 1 $92,970 5 $72,704 22 $42,940 7 $23,021 1 $28,370 FILES CLOSED FOR INCOMPLETENESS 1 $67,720 2 $81,060 29 $71,322 0 $0 2 $60,530
Aggregated Statistics For Year 1999(Based on 2 partial tracts) A) FHA, FSA/RHS & VA B) Conventional C) Refinancings D) Home Improvement Loans F) Non-occupant Loans on Number Average Value Number Average Value Number Average Value Number Average Value Number Average Value
LOANS ORIGINATED 62 $86,210 121 $65,605 182 $63,497 44 $17,568 17 $61,609 APPLICATIONS APPROVED, NOT ACCEPTED 2 $123,165 20 $56,366 56 $62,656 7 $9,029 3 $63,187 APPLICATIONS DENIED 9 $90,034 52 $39,383 119 $59,449 30 $9,870 6 $59,757 APPLICATIONS WITHDRAWN 2 $94,220 7 $74,679 60 $68,550 1 $96,700 1 $73,280 FILES CLOSED FOR INCOMPLETENESS 1 $44,660 3 $65,837 18 $68,432 0 $0 2 $45,705
Detailed HMDA statistics for the following Tracts:
8104.00
, 8105.00
Private Mortgage Insurance Companies Aggregated Statistics For Year 2009(Based on 2 partial tracts) A) Conventional B) Refinancings C) Non-occupant Loans on Number Average Value Number Average Value Number Average Value
LOANS ORIGINATED 3 $155,460 8 $135,444 0 $0 APPLICATIONS APPROVED, NOT ACCEPTED 2 $160,785 4 $149,722 0 $0 APPLICATIONS DENIED 1 $38,450 3 $298,427 1 $38,450 APPLICATIONS WITHDRAWN 0 $0 0 $0 0 $0 FILES CLOSED FOR INCOMPLETENESS 0 $0 0 $0 0 $0
Aggregated Statistics For Year 2008(Based on 2 partial tracts) A) Conventional B) Refinancings C) Non-occupant Loans on Number Average Value Number Average Value Number Average Value
LOANS ORIGINATED 29 $100,247 16 $101,092 2 $74,720 APPLICATIONS APPROVED, NOT ACCEPTED 6 $110,787 7 $100,856 2 $57,865 APPLICATIONS DENIED 1 $76,330 0 $0 0 $0 APPLICATIONS WITHDRAWN 1 $288,670 1 $121,060 0 $0 FILES CLOSED FOR INCOMPLETENESS 0 $0 0 $0 0 $0
Aggregated Statistics For Year 2007(Based on 2 partial tracts) A) Conventional B) Refinancings C) Non-occupant Loans on Number Average Value Number Average Value Number Average Value
LOANS ORIGINATED 57 $98,758 24 $105,498 8 $65,054 APPLICATIONS APPROVED, NOT ACCEPTED 12 $97,671 8 $90,732 2 $68,100 APPLICATIONS DENIED 0 $0 1 $93,630 0 $0 APPLICATIONS WITHDRAWN 4 $83,905 2 $107,820 0 $0 FILES CLOSED FOR INCOMPLETENESS 0 $0 0 $0 0 $0
Aggregated Statistics For Year 2006(Based on 2 partial tracts) A) Conventional B) Refinancings C) Non-occupant Loans on Number Average Value Number Average Value Number Average Value
LOANS ORIGINATED 44 $87,725 15 $99,345 4 $92,208 APPLICATIONS APPROVED, NOT ACCEPTED 7 $129,699 5 $87,706 1 $72,310 APPLICATIONS DENIED 1 $52,960 0 $0 1 $52,960 APPLICATIONS WITHDRAWN 2 $187,235 2 $92,015 1 $84,180 FILES CLOSED FOR INCOMPLETENESS 0 $0 1 $41,320 0 $0
Aggregated Statistics For Year 2005(Based on 2 partial tracts) A) Conventional B) Refinancings C) Non-occupant Loans on Number Average Value Number Average Value Number Average Value
LOANS ORIGINATED 48 $108,172 16 $118,087 7 $81,937 APPLICATIONS APPROVED, NOT ACCEPTED 5 $101,338 5 $93,914 0 $0 APPLICATIONS DENIED 0 $0 0 $0 0 $0 APPLICATIONS WITHDRAWN 2 $100,830 1 $90,800 1 $149,440 FILES CLOSED FOR INCOMPLETENESS 0 $0 0 $0 0 $0
Aggregated Statistics For Year 2004(Based on 2 partial tracts) A) Conventional B) Refinancings C) Non-occupant Loans on Number Average Value Number Average Value Number Average Value
LOANS ORIGINATED 41 $86,853 29 $102,213 11 $71,822 APPLICATIONS APPROVED, NOT ACCEPTED 7 $124,784 8 $116,888 4 $80,460 APPLICATIONS DENIED 0 $0 0 $0 0 $0 APPLICATIONS WITHDRAWN 2 $41,670 1 $249,070 1 $249,070 FILES CLOSED FOR INCOMPLETENESS 0 $0 0 $0 0 $0
Aggregated Statistics For Year 2003(Based on 2 partial tracts) A) Conventional B) Refinancings C) Non-occupant Loans on Number Average Value Number Average Value Number Average Value
LOANS ORIGINATED 32 $85,124 57 $97,839 6 $79,042 APPLICATIONS APPROVED, NOT ACCEPTED 5 $92,550 13 $93,118 2 $58,545 APPLICATIONS DENIED 0 $0 0 $0 0 $0 APPLICATIONS WITHDRAWN 1 $147,490 4 $93,365 1 $77,560 FILES CLOSED FOR INCOMPLETENESS 0 $0 1 $41,320 0 $0
Aggregated Statistics For Year 2002(Based on 2 partial tracts) A) Conventional B) Refinancings C) Non-occupant Loans on Number Average Value Number Average Value Number Average Value
LOANS ORIGINATED 34 $89,368 46 $96,459 3 $109,743 APPLICATIONS APPROVED, NOT ACCEPTED 7 $89,619 17 $102,451 0 $0 APPLICATIONS DENIED 0 $0 1 $95,840 0 $0 APPLICATIONS WITHDRAWN 2 $56,400 4 $106,478 0 $0 FILES CLOSED FOR INCOMPLETENESS 1 $100,430 0 $0 0 $0
Aggregated Statistics For Year 2001(Based on 2 partial tracts) A) Conventional B) Refinancings C) Non-occupant Loans on Number Average Value Number Average Value Number Average Value
LOANS ORIGINATED 30 $95,186 27 $92,479 5 $65,814 APPLICATIONS APPROVED, NOT ACCEPTED 2 $68,545 6 $95,453 0 $0 APPLICATIONS DENIED 2 $99,310 0 $0 1 $82,280 APPLICATIONS WITHDRAWN 0 $0 2 $64,095 0 $0 FILES CLOSED FOR INCOMPLETENESS 1 $71,880 1 $71,160 0 $0
Aggregated Statistics For Year 2000(Based on 2 partial tracts) A) Conventional B) Refinancings C) Non-occupant Loans on Number Average Value Number Average Value Number Average Value
LOANS ORIGINATED 16 $99,459 10 $80,093 2 $81,190 APPLICATIONS APPROVED, NOT ACCEPTED 3 $97,957 3 $69,613 0 $0 APPLICATIONS DENIED 1 $61,410 1 $42,470 1 $26,970 APPLICATIONS WITHDRAWN 1 $82,070 0 $0 0 $0 FILES CLOSED FOR INCOMPLETENESS 1 $39,030 0 $0 0 $0
Aggregated Statistics For Year 1999(Based on 2 partial tracts) A) Conventional B) Refinancings C) Non-occupant Loans on Number Average Value Number Average Value Number Average Value
LOANS ORIGINATED 32 $90,009 25 $73,263 4 $66,182 APPLICATIONS APPROVED, NOT ACCEPTED 2 $76,445 5 $74,796 0 $0 APPLICATIONS DENIED 2 $51,735 0 $0 0 $0 APPLICATIONS WITHDRAWN 1 $89,880 0 $0 0 $0 FILES CLOSED FOR INCOMPLETENESS 1 $51,520 0 $0 0 $0
Detailed PMIC statistics for the following Tracts:
8104.00
, 8105.00 Fire-safe hotels and motels in Lebanon, Indiana:
Quality Inn & Suites Conference Center, 505 S State Rte 39, Lebanon, Indiana 46052 Phone: (765) 482-0500, Fax: (765) 482-0311
Comfort Inn, 210 N Sam Ralston Rd, Lebanon, Indiana 46052 Phone: (765) 482-4800, Fax: (765) 482-4850
Holiday Inn Express Lebanon Hotel Associates LLC, 335 North Mt Zion Rd, Lebanon, Indiana 46052 Phone: (765) 483-4100, Fax: (765) 483-4101
All 3 fire-safe hotels and motels in Lebanon, Indiana
Most common first names in Lebanon, IN among deceased individuals Name Count Lived (average)
Mary 205 79.0 years William 128 75.3 years James 120 74.3 years Robert 119 73.0 years John 117 74.2 years Charles 94 72.2 years Ruth 76 78.7 years Dorothy 67 78.5 years Helen 64 81.0 years Donald 54 70.7 years
Most common last names in Lebanon, IN among deceased individuals Last name Count Lived (average)
Smith 88 77.3 years Jones 43 75.4 years Miller 43 75.7 years Davis 41 73.8 years Williams 33 79.5 years Johnson 31 74.0 years Anderson 29 76.7 years Scott 27 78.4 years Martin 26 76.0 years Perkins 25 78.1 years
Lebanon compared to Indiana state average:
Unemployed percentage significantly below state average. Black race population percentage significantly below state average. Length of stay since moving in significantly above state average.
Top Patent Applicants
Raymond E. Boucher, Jr. (27)
Robert J. Penny (24)
Daniel E. Williams (17)
James M. Gifford (13)
Timothy Brian Cupka (10)
Peter N. Scherer (10)
Monica B. Olson (9)
Duane D. Fortune (8)
David P. Kunkel (7)
Paul Joseph Kleindl (7)
Total of 250 patent applications in 2008-2024.


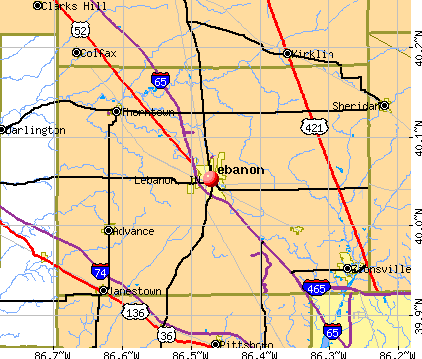


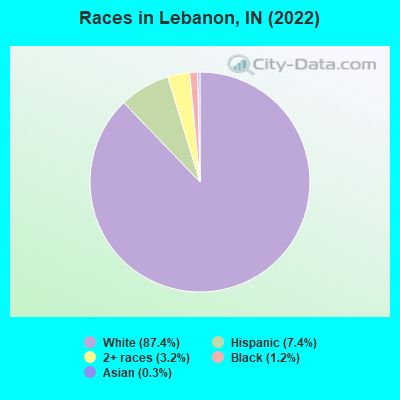
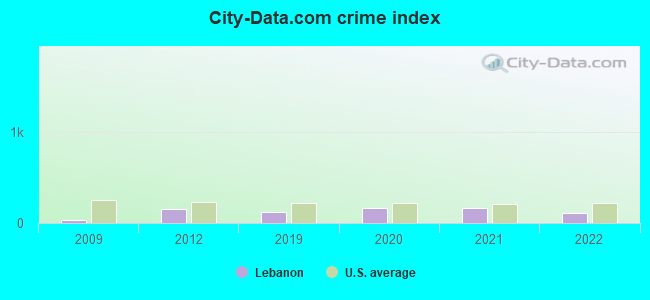
 Recent articles from our blog. Our writers, many of them Ph.D. graduates or candidates, create easy-to-read articles on a wide variety of topics.

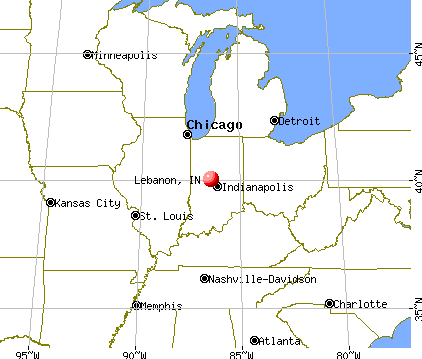
 (24.9 miles
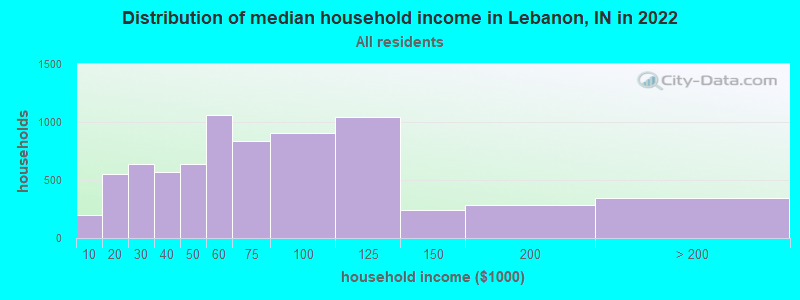
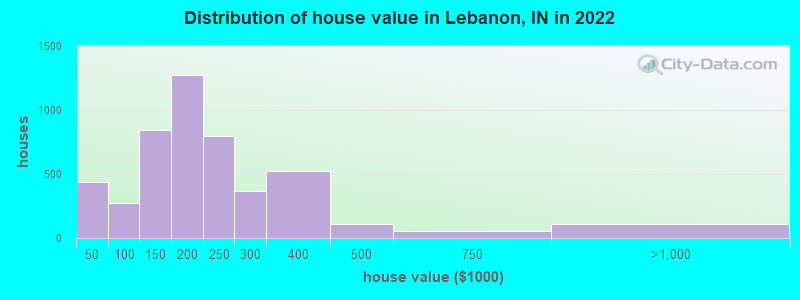

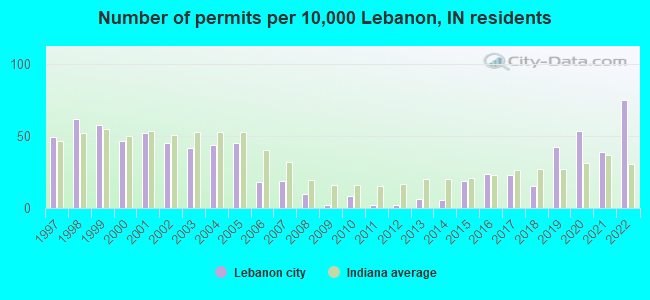
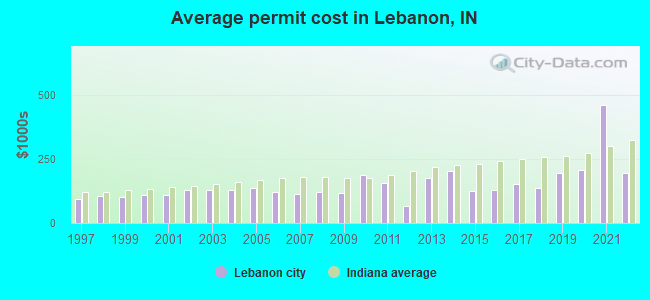
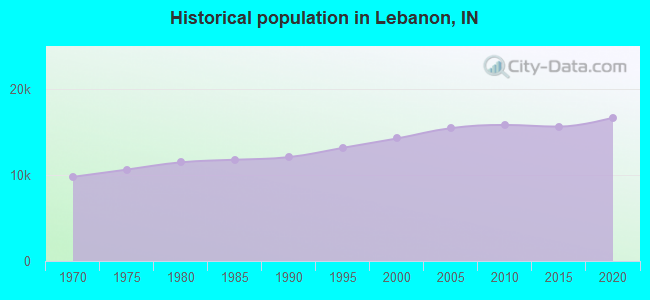
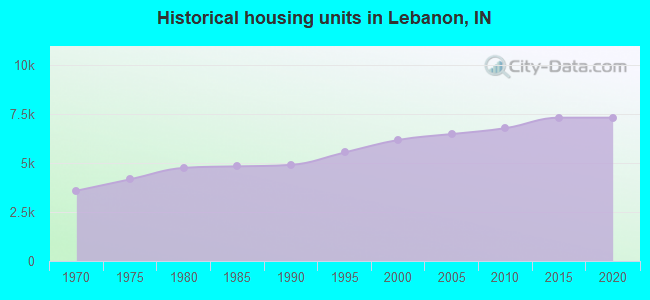
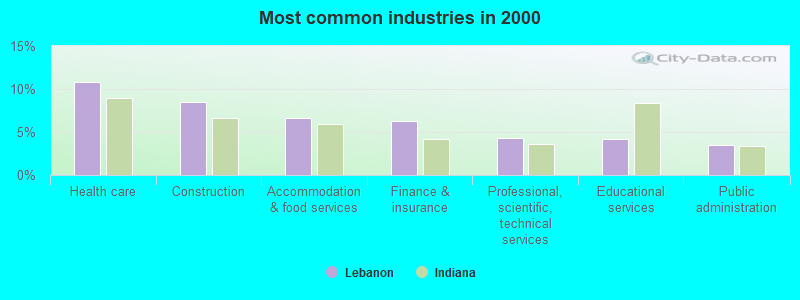
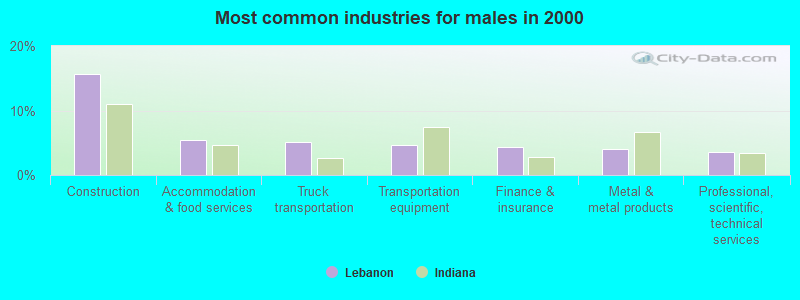
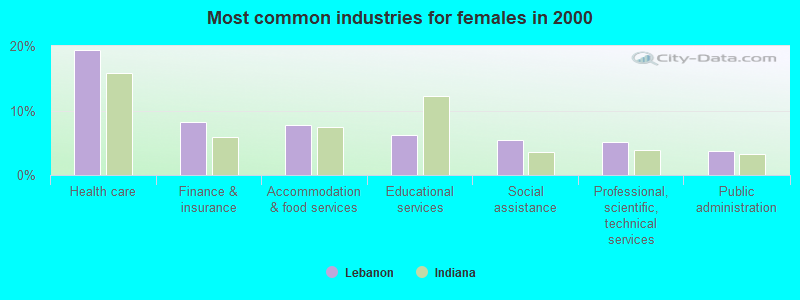
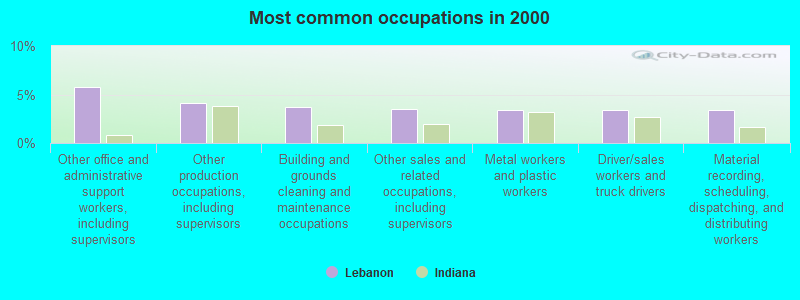
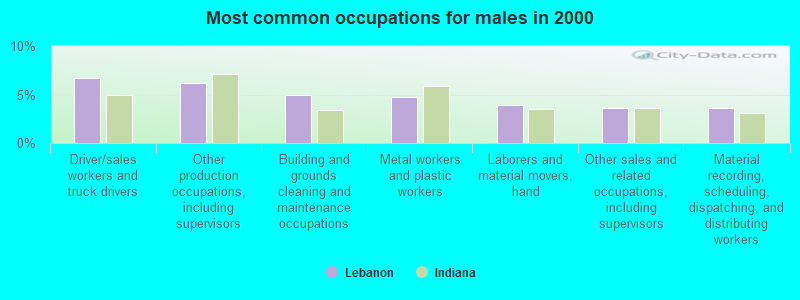
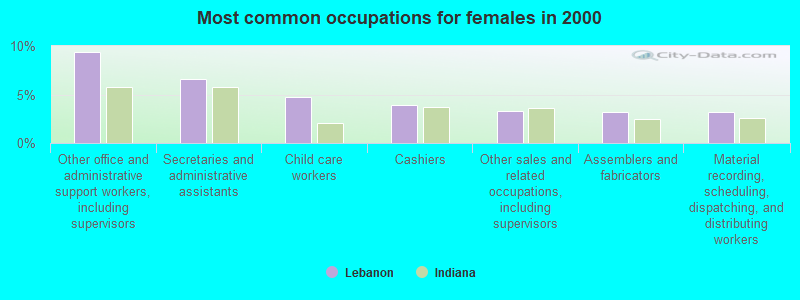
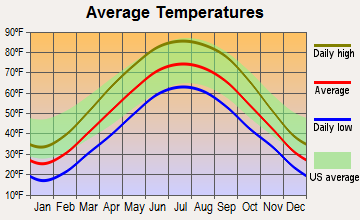
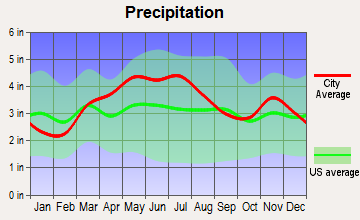
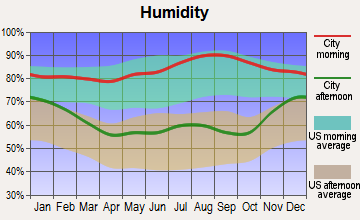
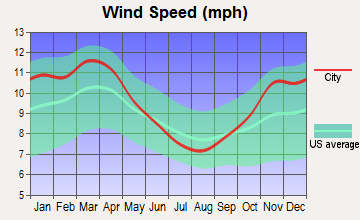
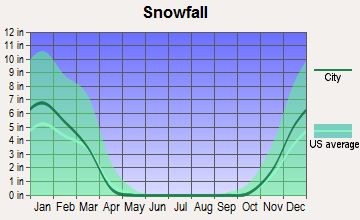
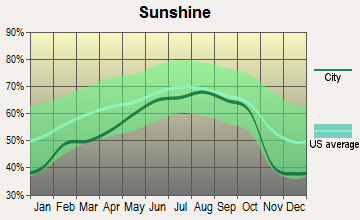
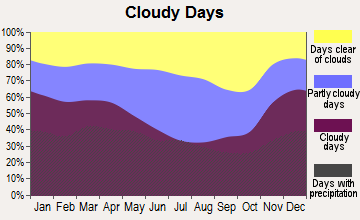


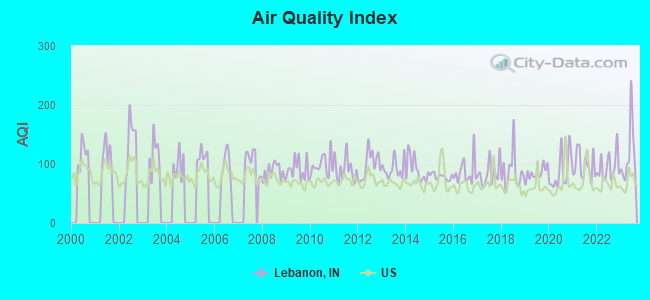
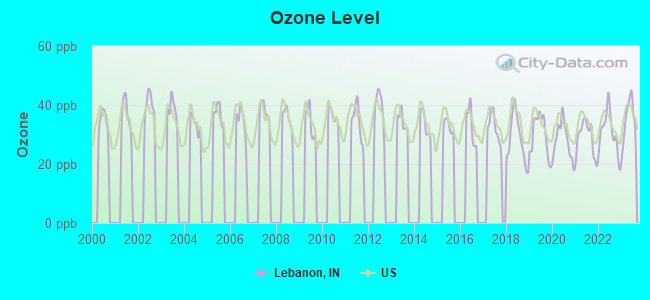
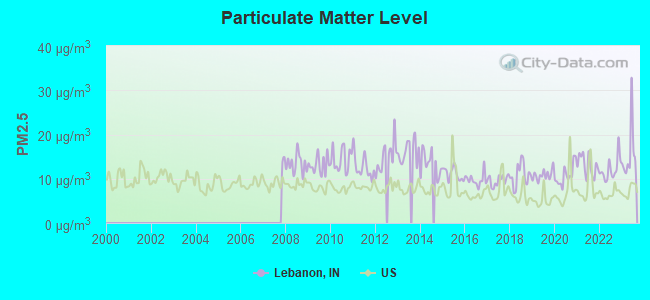
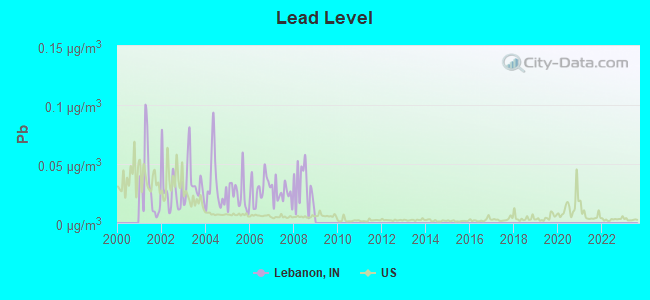

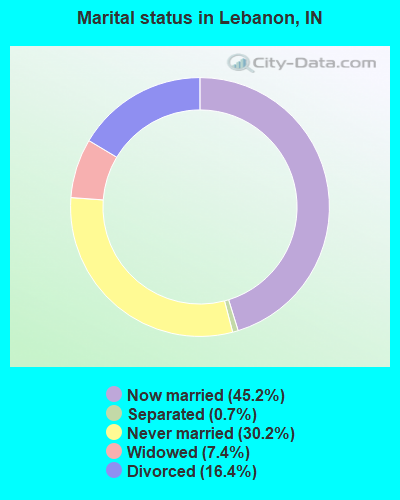
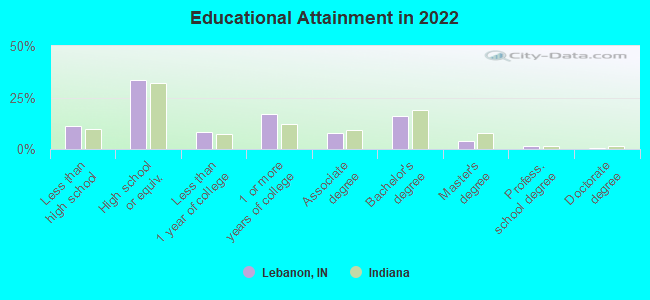
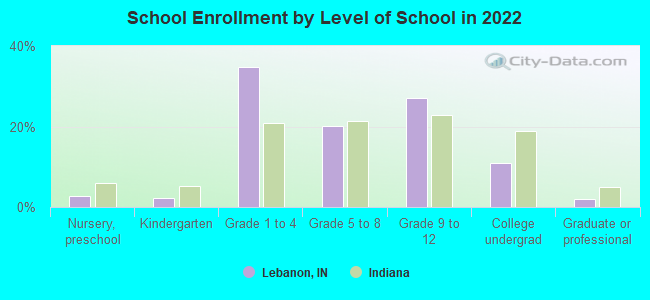
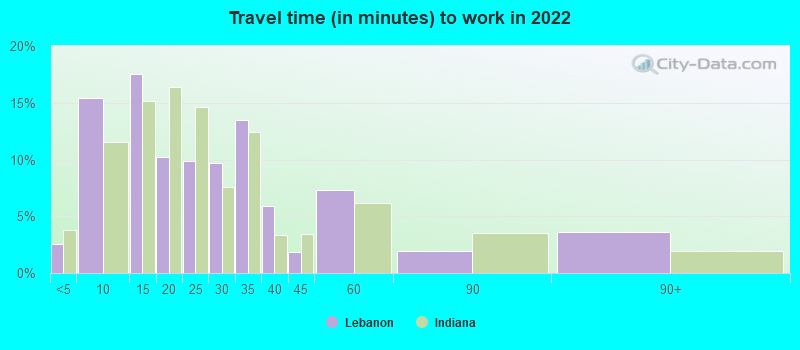
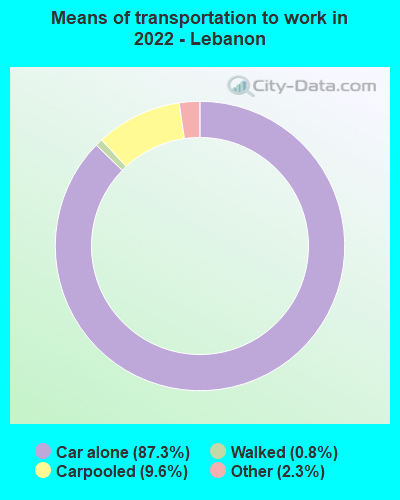
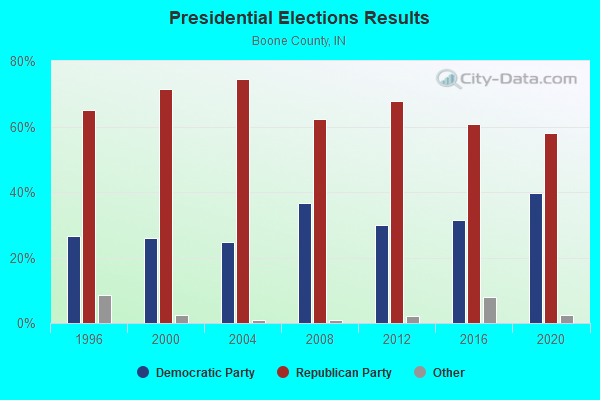
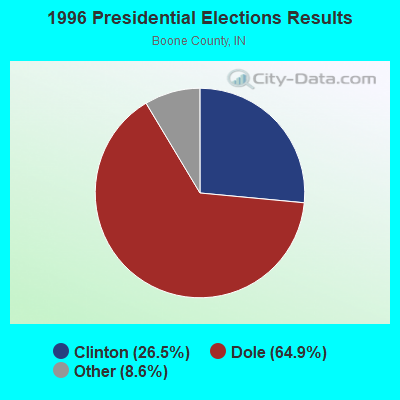
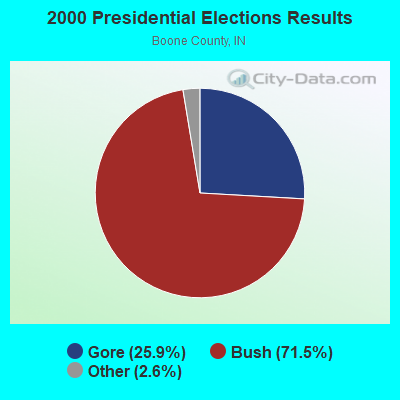
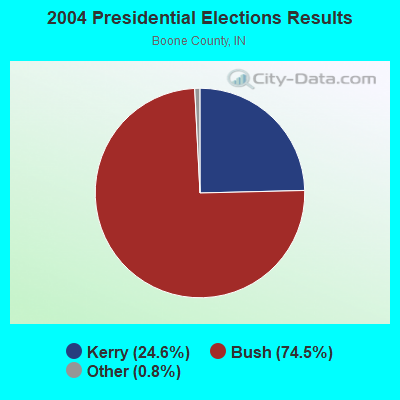
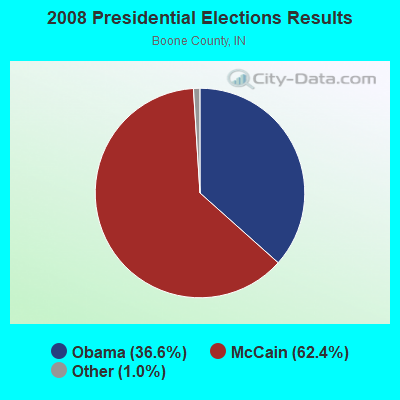
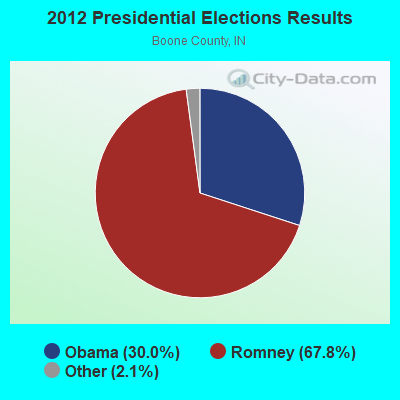
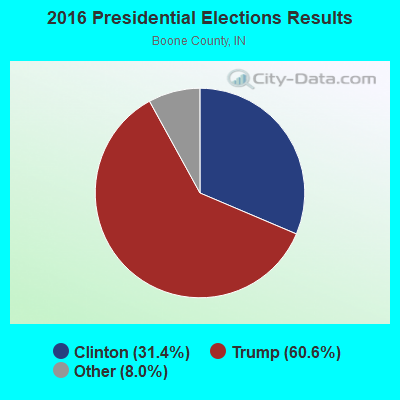
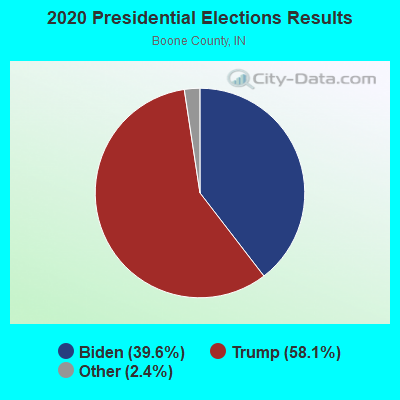
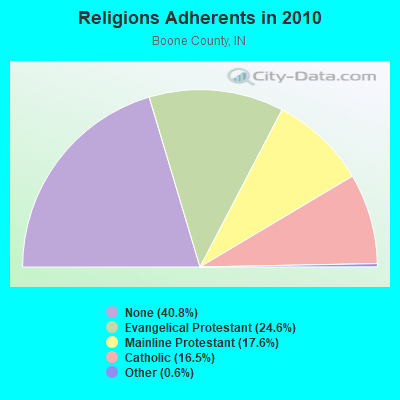
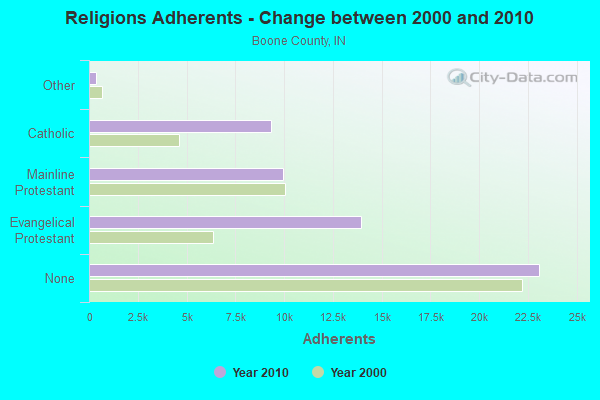
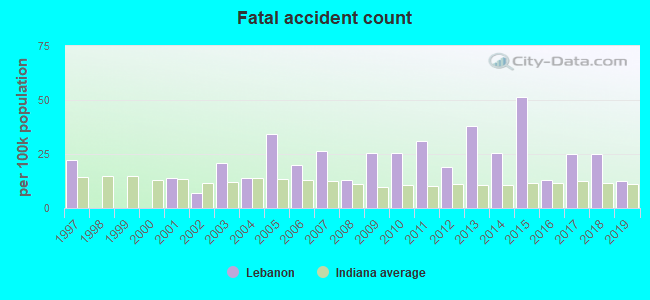
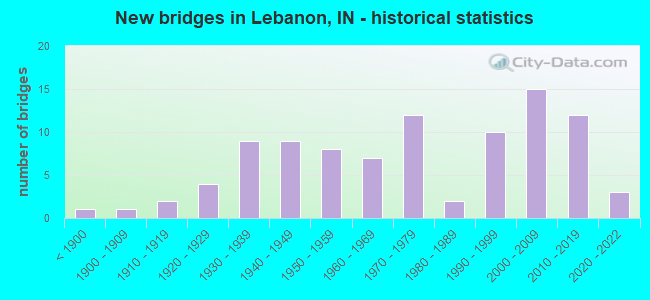
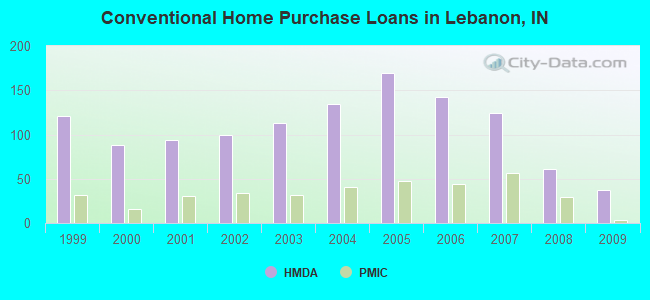
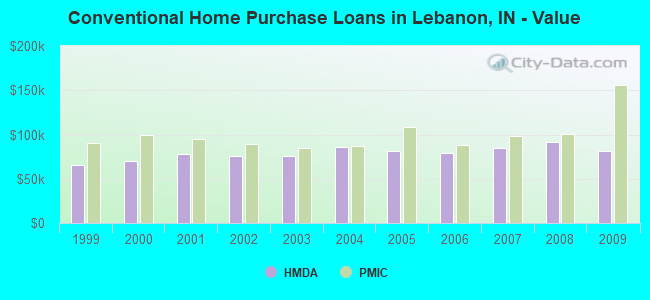
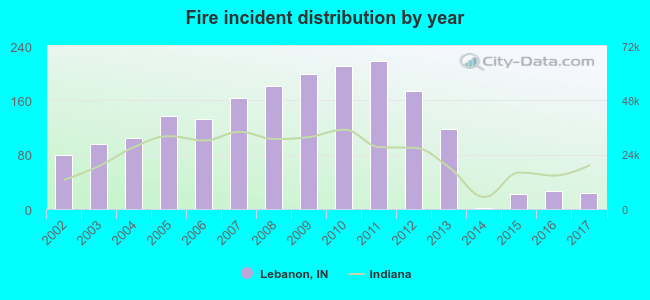 According to the data from the years 2002 - 2017 the average number of fires per year is 118. The highest number of fires - 218 took place in 2011, and the least - 2 in 2014. The data has a decreasing trend.
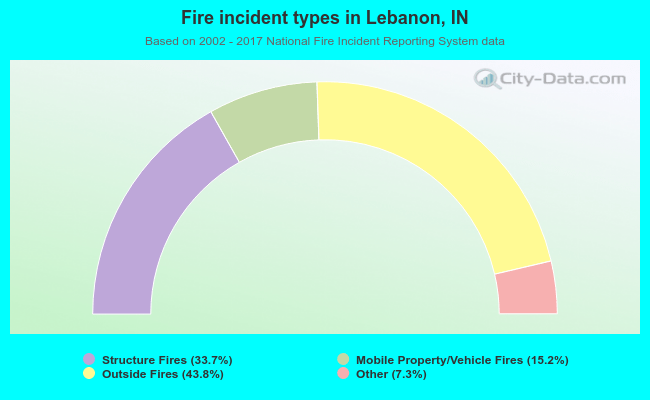 When looking into fire subcategories, the most reports belonged to: Outside Fires (43.8%), and Structure Fires (33.7%).