Leesburg, Virginia Submit your own pictures of this town and show them to the world
OSM Map
General Map
Google Map
MSN Map
OSM Map
General Map
Google Map
MSN Map
OSM Map
General Map
Google Map
MSN Map
OSM Map
General Map
Google Map
MSN Map
Please wait while loading the map...
Population in 2022: 48,974 (100% urban, 0% rural). Population change since 2000: +73.0%Males: 24,814 Females: 24,160
March 2022 cost of living index in Leesburg: 163.1 (very high, U.S. average is 100) Percentage of residents living in poverty in 2022: 6.2%for White Non-Hispanic residents , 12.1% for Black residents , 16.5% for Hispanic or Latino residents , 37.2% for other race residents , 11.2% for two or more races residents )
Profiles of local businesses
Business Search - 14 Million verified businesses
Data:
Median household income ($)
Median household income (% change since 2000)
Household income diversity
Ratio of average income to average house value (%)
Ratio of average income to average rent
Median household income ($) - White
Median household income ($) - Black or African American
Median household income ($) - Asian
Median household income ($) - Hispanic or Latino
Median household income ($) - American Indian and Alaska Native
Median household income ($) - Multirace
Median household income ($) - Other Race
Median household income for houses/condos with a mortgage ($)
Median household income for apartments without a mortgage ($)
Races - White alone (%)
Races - White alone (% change since 2000)
Races - Black alone (%)
Races - Black alone (% change since 2000)
Races - American Indian alone (%)
Races - American Indian alone (% change since 2000)
Races - Asian alone (%)
Races - Asian alone (% change since 2000)
Races - Hispanic (%)
Races - Hispanic (% change since 2000)
Races - Native Hawaiian and Other Pacific Islander alone (%)
Races - Native Hawaiian and Other Pacific Islander alone (% change since 2000)
Races - Two or more races (%)
Races - Two or more races (% change since 2000)
Races - Other race alone (%)
Races - Other race alone (% change since 2000)
Racial diversity
Unemployment (%)
Unemployment (% change since 2000)
Unemployment (%) - White
Unemployment (%) - Black or African American
Unemployment (%) - Asian
Unemployment (%) - Hispanic or Latino
Unemployment (%) - American Indian and Alaska Native
Unemployment (%) - Multirace
Unemployment (%) - Other Race
Population density (people per square mile)
Population - Males (%)
Population - Females (%)
Population - Males (%) - White
Population - Males (%) - Black or African American
Population - Males (%) - Asian
Population - Males (%) - Hispanic or Latino
Population - Males (%) - American Indian and Alaska Native
Population - Males (%) - Multirace
Population - Males (%) - Other Race
Population - Females (%) - White
Population - Females (%) - Black or African American
Population - Females (%) - Asian
Population - Females (%) - Hispanic or Latino
Population - Females (%) - American Indian and Alaska Native
Population - Females (%) - Multirace
Population - Females (%) - Other Race
Coronavirus confirmed cases (Apr 27, 2024)
Deaths caused by coronavirus (Apr 27, 2024)
Coronavirus confirmed cases (per 100k population) (Apr 27, 2024)
Deaths caused by coronavirus (per 100k population) (Apr 27, 2024)
Daily increase in number of cases (Apr 27, 2024)
Weekly increase in number of cases (Apr 27, 2024)
Cases doubled (in days) (Apr 27, 2024)
Hospitalized patients (Apr 18, 2022)
Negative test results (Apr 18, 2022)
Total test results (Apr 18, 2022)
COVID Vaccine doses distributed (per 100k population) (Sep 19, 2023)
COVID Vaccine doses administered (per 100k population) (Sep 19, 2023)
COVID Vaccine doses distributed (Sep 19, 2023)
COVID Vaccine doses administered (Sep 19, 2023)
Likely homosexual households (%)
Likely homosexual households (% change since 2000)
Likely homosexual households - Lesbian couples (%)
Likely homosexual households - Lesbian couples (% change since 2000)
Likely homosexual households - Gay men (%)
Likely homosexual households - Gay men (% change since 2000)
Cost of living index
Median gross rent ($)
Median contract rent ($)
Median monthly housing costs ($)
Median house or condo value ($)
Median house or condo value ($ change since 2000)
Mean house or condo value by units in structure - 1, detached ($)
Mean house or condo value by units in structure - 1, attached ($)
Mean house or condo value by units in structure - 2 ($)
Mean house or condo value by units in structure by units in structure - 3 or 4 ($)
Mean house or condo value by units in structure - 5 or more ($)
Mean house or condo value by units in structure - Boat, RV, van, etc. ($)
Mean house or condo value by units in structure - Mobile home ($)
Median house or condo value ($) - White
Median house or condo value ($) - Black or African American
Median house or condo value ($) - Asian
Median house or condo value ($) - Hispanic or Latino
Median house or condo value ($) - American Indian and Alaska Native
Median house or condo value ($) - Multirace
Median house or condo value ($) - Other Race
Median resident age
Resident age diversity
Median resident age - Males
Median resident age - Females
Median resident age - White
Median resident age - Black or African American
Median resident age - Asian
Median resident age - Hispanic or Latino
Median resident age - American Indian and Alaska Native
Median resident age - Multirace
Median resident age - Other Race
Median resident age - Males - White
Median resident age - Males - Black or African American
Median resident age - Males - Asian
Median resident age - Males - Hispanic or Latino
Median resident age - Males - American Indian and Alaska Native
Median resident age - Males - Multirace
Median resident age - Males - Other Race
Median resident age - Females - White
Median resident age - Females - Black or African American
Median resident age - Females - Asian
Median resident age - Females - Hispanic or Latino
Median resident age - Females - American Indian and Alaska Native
Median resident age - Females - Multirace
Median resident age - Females - Other Race
Commute - mean travel time to work (minutes)
Travel time to work - Less than 5 minutes (%)
Travel time to work - Less than 5 minutes (% change since 2000)
Travel time to work - 5 to 9 minutes (%)
Travel time to work - 5 to 9 minutes (% change since 2000)
Travel time to work - 10 to 19 minutes (%)
Travel time to work - 10 to 19 minutes (% change since 2000)
Travel time to work - 20 to 29 minutes (%)
Travel time to work - 20 to 29 minutes (% change since 2000)
Travel time to work - 30 to 39 minutes (%)
Travel time to work - 30 to 39 minutes (% change since 2000)
Travel time to work - 40 to 59 minutes (%)
Travel time to work - 40 to 59 minutes (% change since 2000)
Travel time to work - 60 to 89 minutes (%)
Travel time to work - 60 to 89 minutes (% change since 2000)
Travel time to work - 90 or more minutes (%)
Travel time to work - 90 or more minutes (% change since 2000)
Marital status - Never married (%)
Marital status - Now married (%)
Marital status - Separated (%)
Marital status - Widowed (%)
Marital status - Divorced (%)
Median family income ($)
Median family income (% change since 2000)
Median non-family income ($)
Median non-family income (% change since 2000)
Median per capita income ($)
Median per capita income (% change since 2000)
Median family income ($) - White
Median family income ($) - Black or African American
Median family income ($) - Asian
Median family income ($) - Hispanic or Latino
Median family income ($) - American Indian and Alaska Native
Median family income ($) - Multirace
Median family income ($) - Other Race
Median year house/condo built
Median year apartment built
Year house built - Built 2005 or later (%)
Year house built - Built 2000 to 2004 (%)
Year house built - Built 1990 to 1999 (%)
Year house built - Built 1980 to 1989 (%)
Year house built - Built 1970 to 1979 (%)
Year house built - Built 1960 to 1969 (%)
Year house built - Built 1950 to 1959 (%)
Year house built - Built 1940 to 1949 (%)
Year house built - Built 1939 or earlier (%)
Average household size
Household density (households per square mile)
Average household size - White
Average household size - Black or African American
Average household size - Asian
Average household size - Hispanic or Latino
Average household size - American Indian and Alaska Native
Average household size - Multirace
Average household size - Other Race
Occupied housing units (%)
Vacant housing units (%)
Owner occupied housing units (%)
Renter occupied housing units (%)
Vacancy status - For rent (%)
Vacancy status - For sale only (%)
Vacancy status - Rented or sold, not occupied (%)
Vacancy status - For seasonal, recreational, or occasional use (%)
Vacancy status - For migrant workers (%)
Vacancy status - Other vacant (%)
Residents with income below the poverty level (%)
Residents with income below 50% of the poverty level (%)
Children below poverty level (%)
Poor families by family type - Married-couple family (%)
Poor families by family type - Male, no wife present (%)
Poor families by family type - Female, no husband present (%)
Poverty status for native-born residents (%)
Poverty status for foreign-born residents (%)
Poverty among high school graduates not in families (%)
Poverty among people who did not graduate high school not in families (%)
Residents with income below the poverty level (%) - White
Residents with income below the poverty level (%) - Black or African American
Residents with income below the poverty level (%) - Asian
Residents with income below the poverty level (%) - Hispanic or Latino
Residents with income below the poverty level (%) - American Indian and Alaska Native
Residents with income below the poverty level (%) - Multirace
Residents with income below the poverty level (%) - Other Race
Air pollution - Air Quality Index (AQI)
Air pollution - CO
Air pollution - NO2
Air pollution - SO2
Air pollution - Ozone
Air pollution - PM10
Air pollution - PM25
Air pollution - Pb
Crime - Murders per 100,000 population
Crime - Rapes per 100,000 population
Crime - Robberies per 100,000 population
Crime - Assaults per 100,000 population
Crime - Burglaries per 100,000 population
Crime - Thefts per 100,000 population
Crime - Auto thefts per 100,000 population
Crime - Arson per 100,000 population
Crime - City-data.com crime index
Crime - Violent crime index
Crime - Property crime index
Crime - Murders per 100,000 population (5 year average)
Crime - Rapes per 100,000 population (5 year average)
Crime - Robberies per 100,000 population (5 year average)
Crime - Assaults per 100,000 population (5 year average)
Crime - Burglaries per 100,000 population (5 year average)
Crime - Thefts per 100,000 population (5 year average)
Crime - Auto thefts per 100,000 population (5 year average)
Crime - Arson per 100,000 population (5 year average)
Crime - City-data.com crime index (5 year average)
Crime - Violent crime index (5 year average)
Crime - Property crime index (5 year average)
1996 Presidential Elections Results (%) - Democratic Party (Clinton)
1996 Presidential Elections Results (%) - Republican Party (Dole)
1996 Presidential Elections Results (%) - Other
2000 Presidential Elections Results (%) - Democratic Party (Gore)
2000 Presidential Elections Results (%) - Republican Party (Bush)
2000 Presidential Elections Results (%) - Other
2004 Presidential Elections Results (%) - Democratic Party (Kerry)
2004 Presidential Elections Results (%) - Republican Party (Bush)
2004 Presidential Elections Results (%) - Other
2008 Presidential Elections Results (%) - Democratic Party (Obama)
2008 Presidential Elections Results (%) - Republican Party (McCain)
2008 Presidential Elections Results (%) - Other
2012 Presidential Elections Results (%) - Democratic Party (Obama)
2012 Presidential Elections Results (%) - Republican Party (Romney)
2012 Presidential Elections Results (%) - Other
2016 Presidential Elections Results (%) - Democratic Party (Clinton)
2016 Presidential Elections Results (%) - Republican Party (Trump)
2016 Presidential Elections Results (%) - Other
2020 Presidential Elections Results (%) - Democratic Party (Biden)
2020 Presidential Elections Results (%) - Republican Party (Trump)
2020 Presidential Elections Results (%) - Other
Ancestries Reported - Arab (%)
Ancestries Reported - Czech (%)
Ancestries Reported - Danish (%)
Ancestries Reported - Dutch (%)
Ancestries Reported - English (%)
Ancestries Reported - French (%)
Ancestries Reported - French Canadian (%)
Ancestries Reported - German (%)
Ancestries Reported - Greek (%)
Ancestries Reported - Hungarian (%)
Ancestries Reported - Irish (%)
Ancestries Reported - Italian (%)
Ancestries Reported - Lithuanian (%)
Ancestries Reported - Norwegian (%)
Ancestries Reported - Polish (%)
Ancestries Reported - Portuguese (%)
Ancestries Reported - Russian (%)
Ancestries Reported - Scotch-Irish (%)
Ancestries Reported - Scottish (%)
Ancestries Reported - Slovak (%)
Ancestries Reported - Subsaharan African (%)
Ancestries Reported - Swedish (%)
Ancestries Reported - Swiss (%)
Ancestries Reported - Ukrainian (%)
Ancestries Reported - United States (%)
Ancestries Reported - Welsh (%)
Ancestries Reported - West Indian (%)
Ancestries Reported - Other (%)
Educational Attainment - No schooling completed (%)
Educational Attainment - Less than high school (%)
Educational Attainment - High school or equivalent (%)
Educational Attainment - Less than 1 year of college (%)
Educational Attainment - 1 or more years of college (%)
Educational Attainment - Associate degree (%)
Educational Attainment - Bachelor's degree (%)
Educational Attainment - Master's degree (%)
Educational Attainment - Professional school degree (%)
Educational Attainment - Doctorate degree (%)
School Enrollment - Nursery, preschool (%)
School Enrollment - Kindergarten (%)
School Enrollment - Grade 1 to 4 (%)
School Enrollment - Grade 5 to 8 (%)
School Enrollment - Grade 9 to 12 (%)
School Enrollment - College undergrad (%)
School Enrollment - Graduate or professional (%)
School Enrollment - Not enrolled in school (%)
School enrollment - Public schools (%)
School enrollment - Private schools (%)
School enrollment - Not enrolled (%)
Median number of rooms in houses and condos
Median number of rooms in apartments
Housing units lacking complete plumbing facilities (%)
Housing units lacking complete kitchen facilities (%)
Density of houses
Urban houses (%)
Rural houses (%)
Households with people 60 years and over (%)
Households with people 65 years and over (%)
Households with people 75 years and over (%)
Households with one or more nonrelatives (%)
Households with no nonrelatives (%)
Population in households (%)
Family households (%)
Nonfamily households (%)
Population in families (%)
Family households with own children (%)
Median number of bedrooms in owner occupied houses
Mean number of bedrooms in owner occupied houses
Median number of bedrooms in renter occupied houses
Mean number of bedrooms in renter occupied houses
Median number of vehichles in owner occupied houses
Mean number of vehichles in owner occupied houses
Median number of vehichles in renter occupied houses
Mean number of vehichles in renter occupied houses
Mortgage status - with mortgage (%)
Mortgage status - with second mortgage (%)
Mortgage status - with home equity loan (%)
Mortgage status - with both second mortgage and home equity loan (%)
Mortgage status - without a mortgage (%)
Average family size
Average family size - White
Average family size - Black or African American
Average family size - Asian
Average family size - Hispanic or Latino
Average family size - American Indian and Alaska Native
Average family size - Multirace
Average family size - Other Race
Geographical mobility - Same house 1 year ago (%)
Geographical mobility - Moved within same county (%)
Geographical mobility - Moved from different county within same state (%)
Geographical mobility - Moved from different state (%)
Geographical mobility - Moved from abroad (%)
Place of birth - Born in state of residence (%)
Place of birth - Born in other state (%)
Place of birth - Native, outside of US (%)
Place of birth - Foreign born (%)
Housing units in structures - 1, detached (%)
Housing units in structures - 1, attached (%)
Housing units in structures - 2 (%)
Housing units in structures - 3 or 4 (%)
Housing units in structures - 5 to 9 (%)
Housing units in structures - 10 to 19 (%)
Housing units in structures - 20 to 49 (%)
Housing units in structures - 50 or more (%)
Housing units in structures - Mobile home (%)
Housing units in structures - Boat, RV, van, etc. (%)
House/condo owner moved in on average (years ago)
Renter moved in on average (years ago)
Year householder moved into unit - Moved in 1999 to March 2000 (%)
Year householder moved into unit - Moved in 1995 to 1998 (%)
Year householder moved into unit - Moved in 1990 to 1994 (%)
Year householder moved into unit - Moved in 1980 to 1989 (%)
Year householder moved into unit - Moved in 1970 to 1979 (%)
Year householder moved into unit - Moved in 1969 or earlier (%)
Means of transportation to work - Drove car alone (%)
Means of transportation to work - Carpooled (%)
Means of transportation to work - Public transportation (%)
Means of transportation to work - Bus or trolley bus (%)
Means of transportation to work - Streetcar or trolley car (%)
Means of transportation to work - Subway or elevated (%)
Means of transportation to work - Railroad (%)
Means of transportation to work - Ferryboat (%)
Means of transportation to work - Taxicab (%)
Means of transportation to work - Motorcycle (%)
Means of transportation to work - Bicycle (%)
Means of transportation to work - Walked (%)
Means of transportation to work - Other means (%)
Working at home (%)
Industry diversity
Most Common Industries - Agriculture, forestry, fishing and hunting, and mining (%)
Most Common Industries - Agriculture, forestry, fishing and hunting (%)
Most Common Industries - Mining, quarrying, and oil and gas extraction (%)
Most Common Industries - Construction (%)
Most Common Industries - Manufacturing (%)
Most Common Industries - Wholesale trade (%)
Most Common Industries - Retail trade (%)
Most Common Industries - Transportation and warehousing, and utilities (%)
Most Common Industries - Transportation and warehousing (%)
Most Common Industries - Utilities (%)
Most Common Industries - Information (%)
Most Common Industries - Finance and insurance, and real estate and rental and leasing (%)
Most Common Industries - Finance and insurance (%)
Most Common Industries - Real estate and rental and leasing (%)
Most Common Industries - Professional, scientific, and management, and administrative and waste management services (%)
Most Common Industries - Professional, scientific, and technical services (%)
Most Common Industries - Management of companies and enterprises (%)
Most Common Industries - Administrative and support and waste management services (%)
Most Common Industries - Educational services, and health care and social assistance (%)
Most Common Industries - Educational services (%)
Most Common Industries - Health care and social assistance (%)
Most Common Industries - Arts, entertainment, and recreation, and accommodation and food services (%)
Most Common Industries - Arts, entertainment, and recreation (%)
Most Common Industries - Accommodation and food services (%)
Most Common Industries - Other services, except public administration (%)
Most Common Industries - Public administration (%)
Occupation diversity
Most Common Occupations - Management, business, science, and arts occupations (%)
Most Common Occupations - Management, business, and financial occupations (%)
Most Common Occupations - Management occupations (%)
Most Common Occupations - Business and financial operations occupations (%)
Most Common Occupations - Computer, engineering, and science occupations (%)
Most Common Occupations - Computer and mathematical occupations (%)
Most Common Occupations - Architecture and engineering occupations (%)
Most Common Occupations - Life, physical, and social science occupations (%)
Most Common Occupations - Education, legal, community service, arts, and media occupations (%)
Most Common Occupations - Community and social service occupations (%)
Most Common Occupations - Legal occupations (%)
Most Common Occupations - Education, training, and library occupations (%)
Most Common Occupations - Arts, design, entertainment, sports, and media occupations (%)
Most Common Occupations - Healthcare practitioners and technical occupations (%)
Most Common Occupations - Health diagnosing and treating practitioners and other technical occupations (%)
Most Common Occupations - Health technologists and technicians (%)
Most Common Occupations - Service occupations (%)
Most Common Occupations - Healthcare support occupations (%)
Most Common Occupations - Protective service occupations (%)
Most Common Occupations - Fire fighting and prevention, and other protective service workers including supervisors (%)
Most Common Occupations - Law enforcement workers including supervisors (%)
Most Common Occupations - Food preparation and serving related occupations (%)
Most Common Occupations - Building and grounds cleaning and maintenance occupations (%)
Most Common Occupations - Personal care and service occupations (%)
Most Common Occupations - Sales and office occupations (%)
Most Common Occupations - Sales and related occupations (%)
Most Common Occupations - Office and administrative support occupations (%)
Most Common Occupations - Natural resources, construction, and maintenance occupations (%)
Most Common Occupations - Farming, fishing, and forestry occupations (%)
Most Common Occupations - Construction and extraction occupations (%)
Most Common Occupations - Installation, maintenance, and repair occupations (%)
Most Common Occupations - Production, transportation, and material moving occupations (%)
Most Common Occupations - Production occupations (%)
Most Common Occupations - Transportation occupations (%)
Most Common Occupations - Material moving occupations (%)
People in Group quarters - Institutionalized population (%)
People in Group quarters - Correctional institutions (%)
People in Group quarters - Federal prisons and detention centers (%)
People in Group quarters - Halfway houses (%)
People in Group quarters - Local jails and other confinement facilities (including police lockups) (%)
People in Group quarters - Military disciplinary barracks (%)
People in Group quarters - State prisons (%)
People in Group quarters - Other types of correctional institutions (%)
People in Group quarters - Nursing homes (%)
People in Group quarters - Hospitals/wards, hospices, and schools for the handicapped (%)
People in Group quarters - Hospitals/wards and hospices for chronically ill (%)
People in Group quarters - Hospices or homes for chronically ill (%)
People in Group quarters - Military hospitals or wards for chronically ill (%)
People in Group quarters - Other hospitals or wards for chronically ill (%)
People in Group quarters - Hospitals or wards for drug/alcohol abuse (%)
People in Group quarters - Mental (Psychiatric) hospitals or wards (%)
People in Group quarters - Schools, hospitals, or wards for the mentally retarded (%)
People in Group quarters - Schools, hospitals, or wards for the physically handicapped (%)
People in Group quarters - Institutions for the deaf (%)
People in Group quarters - Institutions for the blind (%)
People in Group quarters - Orthopedic wards and institutions for the physically handicapped (%)
People in Group quarters - Wards in general hospitals for patients who have no usual home elsewhere (%)
People in Group quarters - Wards in military hospitals for patients who have no usual home elsewhere (%)
People in Group quarters - Juvenile institutions (%)
People in Group quarters - Long-term care (%)
People in Group quarters - Homes for abused, dependent, and neglected children (%)
People in Group quarters - Residential treatment centers for emotionally disturbed children (%)
People in Group quarters - Training schools for juvenile delinquents (%)
People in Group quarters - Short-term care, detention or diagnostic centers for delinquent children (%)
People in Group quarters - Type of juvenile institution unknown (%)
People in Group quarters - Noninstitutionalized population (%)
People in Group quarters - College dormitories (includes college quarters off campus) (%)
People in Group quarters - Military quarters (%)
People in Group quarters - On base (%)
People in Group quarters - Barracks, unaccompanied personnel housing (UPH), (Enlisted/Officer), ;and similar group living quarters for military personnel (%)
People in Group quarters - Transient quarters for temporary residents (%)
People in Group quarters - Military ships (%)
People in Group quarters - Group homes (%)
People in Group quarters - Homes or halfway houses for drug/alcohol abuse (%)
People in Group quarters - Homes for the mentally ill (%)
People in Group quarters - Homes for the mentally retarded (%)
People in Group quarters - Homes for the physically handicapped (%)
People in Group quarters - Other group homes (%)
People in Group quarters - Religious group quarters (%)
People in Group quarters - Dormitories (%)
People in Group quarters - Agriculture workers' dormitories on farms (%)
People in Group quarters - Job Corps and vocational training facilities (%)
People in Group quarters - Other workers' dormitories (%)
People in Group quarters - Crews of maritime vessels (%)
People in Group quarters - Other nonhousehold living situations (%)
People in Group quarters - Other noninstitutional group quarters (%)
Residents speaking English at home (%)
Residents speaking English at home - Born in the United States (%)
Residents speaking English at home - Native, born elsewhere (%)
Residents speaking English at home - Foreign born (%)
Residents speaking Spanish at home (%)
Residents speaking Spanish at home - Born in the United States (%)
Residents speaking Spanish at home - Native, born elsewhere (%)
Residents speaking Spanish at home - Foreign born (%)
Residents speaking other language at home (%)
Residents speaking other language at home - Born in the United States (%)
Residents speaking other language at home - Native, born elsewhere (%)
Residents speaking other language at home - Foreign born (%)
Class of Workers - Employee of private company (%)
Class of Workers - Self-employed in own incorporated business (%)
Class of Workers - Private not-for-profit wage and salary workers (%)
Class of Workers - Local government workers (%)
Class of Workers - State government workers (%)
Class of Workers - Federal government workers (%)
Class of Workers - Self-employed workers in own not incorporated business and Unpaid family workers (%)
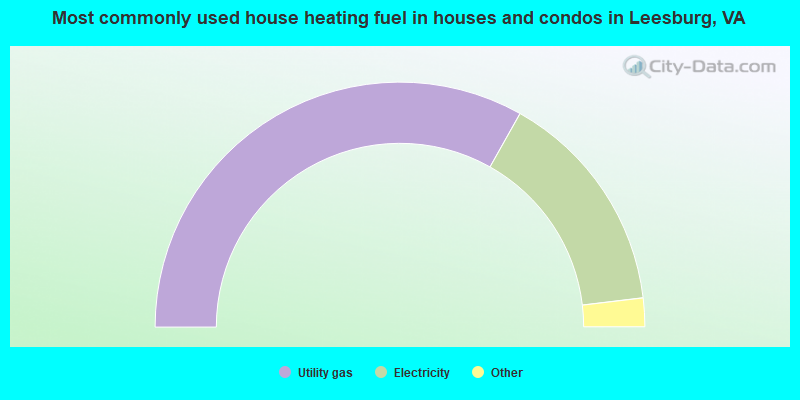
House heating fuel used in houses and condos - Utility gas (%)
House heating fuel used in houses and condos - Bottled, tank, or LP gas (%)
House heating fuel used in houses and condos - Electricity (%)
House heating fuel used in houses and condos - Fuel oil, kerosene, etc. (%)
House heating fuel used in houses and condos - Coal or coke (%)
House heating fuel used in houses and condos - Wood (%)
House heating fuel used in houses and condos - Solar energy (%)
House heating fuel used in houses and condos - Other fuel (%)
House heating fuel used in houses and condos - No fuel used (%)
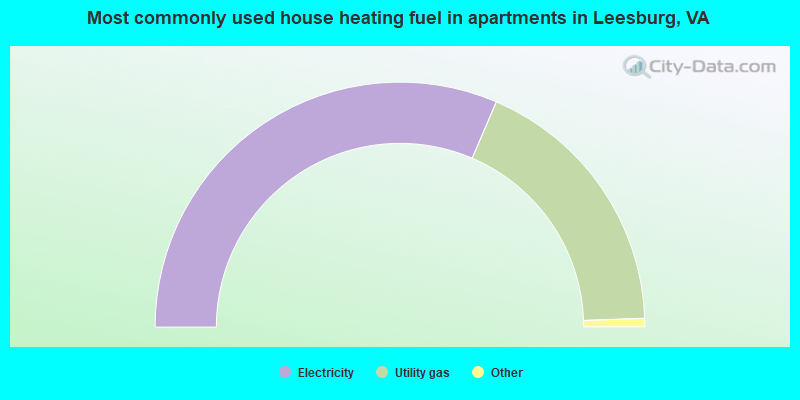
House heating fuel used in apartments - Utility gas (%)
House heating fuel used in apartments - Bottled, tank, or LP gas (%)
House heating fuel used in apartments - Electricity (%)
House heating fuel used in apartments - Fuel oil, kerosene, etc. (%)
House heating fuel used in apartments - Coal or coke (%)
House heating fuel used in apartments - Wood (%)
House heating fuel used in apartments - Solar energy (%)
House heating fuel used in apartments - Other fuel (%)
House heating fuel used in apartments - No fuel used (%)
Armed forces status - In Armed Forces (%)
Armed forces status - Civilian (%)
Armed forces status - Civilian - Veteran (%)
Armed forces status - Civilian - Nonveteran (%)
Fatal accidents locations in years 2005-2021
Fatal accidents locations in 2005
Fatal accidents locations in 2006
Fatal accidents locations in 2007
Fatal accidents locations in 2008
Fatal accidents locations in 2009
Fatal accidents locations in 2010
Fatal accidents locations in 2011
Fatal accidents locations in 2012
Fatal accidents locations in 2013
Fatal accidents locations in 2014
Fatal accidents locations in 2015
Fatal accidents locations in 2016
Fatal accidents locations in 2017
Fatal accidents locations in 2018
Fatal accidents locations in 2019
Fatal accidents locations in 2020
Fatal accidents locations in 2021
Alcohol use - People drinking some alcohol every month (%)
Alcohol use - People not drinking at all (%)
Alcohol use - Average days/month drinking alcohol
Alcohol use - Average drinks/week
Alcohol use - Average days/year people drink much
Audiometry - Average condition of hearing (%)
Audiometry - People that can hear a whisper from across a quiet room (%)
Audiometry - People that can hear normal voice from across a quiet room (%)
Audiometry - Ears ringing, roaring, buzzing (%)
Audiometry - Had a job exposure to loud noise (%)
Audiometry - Had off-work exposure to loud noise (%)
Blood Pressure & Cholesterol - Has high blood pressure (%)
Blood Pressure & Cholesterol - Checking blood pressure at home (%)
Blood Pressure & Cholesterol - Frequently checking blood cholesterol (%)
Blood Pressure & Cholesterol - Has high cholesterol level (%)
Consumer Behavior - Money monthly spent on food at supermarket/grocery store
Consumer Behavior - Money monthly spent on food at other stores
Consumer Behavior - Money monthly spent on eating out
Consumer Behavior - Money monthly spent on carryout/delivered foods
Consumer Behavior - Income spent on food at supermarket/grocery store (%)
Consumer Behavior - Income spent on food at other stores (%)
Consumer Behavior - Income spent on eating out (%)
Consumer Behavior - Income spent on carryout/delivered foods (%)
Current Health Status - General health condition (%)
Current Health Status - Blood donors (%)
Current Health Status - Has blood ever tested for HIV virus (%)
Current Health Status - Left-handed people (%)
Dermatology - People using sunscreen (%)
Diabetes - Diabetics (%)
Diabetes - Had a blood test for high blood sugar (%)
Diabetes - People taking insulin (%)
Diet Behavior & Nutrition - Diet health (%)
Diet Behavior & Nutrition - Milk product consumption (# of products/month)
Diet Behavior & Nutrition - Meals not home prepared (#/week)
Diet Behavior & Nutrition - Meals from fast food or pizza place (#/week)
Diet Behavior & Nutrition - Ready-to-eat foods (#/month)
Diet Behavior & Nutrition - Frozen meals/pizza (#/month)
Drug Use - People that ever used marijuana or hashish (%)
Drug Use - Ever used hard drugs (%)
Drug Use - Ever used any form of cocaine (%)
Drug Use - Ever used heroin (%)
Drug Use - Ever used methamphetamine (%)
Health Insurance - People covered by health insurance (%)
Kidney Conditions-Urology - Avg. # of times urinating at night
Medical Conditions - People with asthma (%)
Medical Conditions - People with anemia (%)
Medical Conditions - People with psoriasis (%)
Medical Conditions - People with overweight (%)
Medical Conditions - Elderly people having difficulties in thinking or remembering (%)
Medical Conditions - People who ever received blood transfusion (%)
Medical Conditions - People having trouble seeing even with glass/contacts (%)
Medical Conditions - People with arthritis (%)
Medical Conditions - People with gout (%)
Medical Conditions - People with congestive heart failure (%)
Medical Conditions - People with coronary heart disease (%)
Medical Conditions - People with angina pectoris (%)
Medical Conditions - People who ever had heart attack (%)
Medical Conditions - People who ever had stroke (%)
Medical Conditions - People with emphysema (%)
Medical Conditions - People with thyroid problem (%)
Medical Conditions - People with chronic bronchitis (%)
Medical Conditions - People with any liver condition (%)
Medical Conditions - People who ever had cancer or malignancy (%)
Mental Health - People who have little interest in doing things (%)
Mental Health - People feeling down, depressed, or hopeless (%)
Mental Health - People who have trouble sleeping or sleeping too much (%)
Mental Health - People feeling tired or having little energy (%)
Mental Health - People with poor appetite or overeating (%)
Mental Health - People feeling bad about themself (%)
Mental Health - People who have trouble concentrating on things (%)
Mental Health - People moving or speaking slowly or too fast (%)
Mental Health - People having thoughts they would be better off dead (%)
Oral Health - Average years since last visit a dentist
Oral Health - People embarrassed because of mouth (%)
Oral Health - People with gum disease (%)
Oral Health - General health of teeth and gums (%)
Oral Health - Average days a week using dental floss/device
Oral Health - Average days a week using mouthwash for dental problem
Oral Health - Average number of teeth
Pesticide Use - Households using pesticides to control insects (%)
Pesticide Use - Households using pesticides to kill weeds (%)
Physical Activity - People doing vigorous-intensity work activities (%)
Physical Activity - People doing moderate-intensity work activities (%)
Physical Activity - People walking or bicycling (%)
Physical Activity - People doing vigorous-intensity recreational activities (%)
Physical Activity - People doing moderate-intensity recreational activities (%)
Physical Activity - Average hours a day doing sedentary activities
Physical Activity - Average hours a day watching TV or videos
Physical Activity - Average hours a day using computer
Physical Functioning - People having limitations keeping them from working (%)
Physical Functioning - People limited in amount of work they can do (%)
Physical Functioning - People that need special equipment to walk (%)
Physical Functioning - People experiencing confusion/memory problems (%)
Physical Functioning - People requiring special healthcare equipment (%)
Prescription Medications - Average number of prescription medicines taking
Preventive Aspirin Use - Adults 40+ taking low-dose aspirin (%)
Reproductive Health - Vaginal deliveries (%)
Reproductive Health - Cesarean deliveries (%)
Reproductive Health - Deliveries resulted in a live birth (%)
Reproductive Health - Pregnancies resulted in a delivery (%)
Reproductive Health - Women breastfeeding newborns (%)
Reproductive Health - Women that had a hysterectomy (%)
Reproductive Health - Women that had both ovaries removed (%)
Reproductive Health - Women that have ever taken birth control pills (%)
Reproductive Health - Women taking birth control pills (%)
Reproductive Health - Women that have ever used Depo-Provera or injectables (%)
Reproductive Health - Women that have ever used female hormones (%)
Sexual Behavior - People 18+ that ever had sex (vaginal, anal, or oral) (%)
Sexual Behavior - Males 18+ that ever had vaginal sex with a woman (%)
Sexual Behavior - Males 18+ that ever performed oral sex on a woman (%)
Sexual Behavior - Males 18+ that ever had anal sex with a woman (%)
Sexual Behavior - Males 18+ that ever had any sex with a man (%)
Sexual Behavior - Females 18+ that ever had vaginal sex with a man (%)
Sexual Behavior - Females 18+ that ever performed oral sex on a man (%)
Sexual Behavior - Females 18+ that ever had anal sex with a man (%)
Sexual Behavior - Females 18+ that ever had any kind of sex with a woman (%)
Sexual Behavior - Average age people first had sex
Sexual Behavior - Average number of female sex partners in lifetime (males 18+)
Sexual Behavior - Average number of female vaginal sex partners in lifetime (males 18+)
Sexual Behavior - Average age people first performed oral sex on a woman (18+)
Sexual Behavior - Average number of woman performed oral sex on in lifetime (18+)
Sexual Behavior - Average number of male sex partners in lifetime (males 18+)
Sexual Behavior - Average number of male anal sex partners in lifetime (males 18+)
Sexual Behavior - Average age people first performed oral sex on a man (18+)
Sexual Behavior - Average number of male oral sex partners in lifetime (18+)
Sexual Behavior - People using protection when performing oral sex (%)
Sexual Behavior - Average number of times people have vaginal or anal sex a year
Sexual Behavior - People having sex without condom (%)
Sexual Behavior - Average number of male sex partners in lifetime (females 18+)
Sexual Behavior - Average number of male vaginal sex partners in lifetime (females 18+)
Sexual Behavior - Average number of female sex partners in lifetime (females 18+)
Sexual Behavior - Circumcised males 18+ (%)
Sleep Disorders - Average hours sleeping at night
Sleep Disorders - People that has trouble sleeping (%)
Smoking-Cigarette Use - People smoking cigarettes (%)
Taste & Smell - People 40+ having problems with smell (%)
Taste & Smell - People 40+ having problems with taste (%)
Taste & Smell - People 40+ that ever had wisdom teeth removed (%)
Taste & Smell - People 40+ that ever had tonsils teeth removed (%)
Taste & Smell - People 40+ that ever had a loss of consciousness because of a head injury (%)
Taste & Smell - People 40+ that ever had a broken nose or other serious injury to face or skull (%)
Taste & Smell - People 40+ that ever had two or more sinus infections (%)
Weight - Average height (inches)
Weight - Average weight (pounds)
Weight - Average BMI
Weight - People that are obese (%)
Weight - People that ever were obese (%)
Weight - People trying to lose weight (%)
According to our research of Virginia and other state lists, there were 73 registered sex offenders living in Leesburg, Virginia as of April 27, 2024 . The ratio of all residents to sex offenders in Leesburg is 721 to 1.The ratio of registered sex offenders to all residents in this city is lower than the state average.
Officers per 1,000 residents here:
1.36Virginia average:
2.24
Latest news from Leesburg, VA collected exclusively by city-data.com from local newspapers, TV, and radio stations
Leesburg, VA City Guides: Ancestries: European (8.8%), American (7.6%), English (6.5%), Irish (5.8%), German (5.5%), African (2.1%).
Current Local Time:
Land area: 11.6 square miles.
Population density: 4,221 people per square mile (average).
9,164 residents are foreign born (7.2% Latin America , 6.7% Asia , 3.0% Africa ).
This town:
18.4%Virginia:
12.6%
Median real estate property taxes paid for housing units with mortgages in 2022: $5,497 (0.9%)Median real estate property taxes paid for housing units with no mortgage in 2022: $5,067 (0.9%)
Nearest city with pop. 50,000+: Reston, VA
Nearest city with pop. 200,000+: Washington, DC
Nearest city with pop. 1,000,000+: Philadelphia, PA
Nearest cities:
Moorefield Station, VA (2.9 miles)
Latitude: 39.11 N, Longitude: 77.56 W
Daytime population change due to commuting: +3,164 (+6.4%)Workers who live and work in this town: 13,891 (48.8%)
Single-family new house construction building permits:
2022: 143 buildings , average cost: $214,9002021: 109 buildings , average cost: $221,5002020: 186 buildings , average cost: $232,0002019: 149 buildings , average cost: $196,5002018: 117 buildings , average cost: $212,0002017: 22 buildings , average cost: $244,000Unemployment in December 2023:
Population change in the 1990s: +11,922 (+72.7%).
Most common occupations in Leesburg, VA (%)
Both Males Females
Computer specialists (7.8%)
Other management occupations, except farmers and farm managers (6.5%)
Other office and administrative support workers, including supervisors (4.2%)
Other sales and related occupations, including supervisors (4.1%)
Retail sales workers, except cashiers (3.1%)
Sales representatives, services, wholesale and manufacturing (2.8%)
Operations specialties managers, except financial managers (2.8%)
Computer specialists (11.2%)
Other management occupations, except farmers and farm managers (7.0%)
Engineers (3.9%)
Top executives (3.5%)
Other sales and related occupations, including supervisors (3.4%)
Operations specialties managers, except financial managers (3.1%)
Sales representatives, services, wholesale and manufacturing (3.1%)
Other management occupations, except farmers and farm managers (5.8%)
Other office and administrative support workers, including supervisors (5.8%)
Secretaries and administrative assistants (5.4%)
Other sales and related occupations, including supervisors (4.9%)
Preschool, kindergarten, elementary, and middle school teachers (4.1%)
Computer specialists (4.0%)
Retail sales workers, except cashiers (3.6%)
Tornado activity:
Leesburg-area historical tornado activity is above Virginia state average. It is 4% greater than the overall U.S. average.
On 9/24/2001, a category F4 (max. wind speeds 207-260 mph) tornado 30.6 miles away from the Leesburg town center injured 2 people and caused $2 million in damages.
On 9/5/1979, a category F3 (max. wind speeds 158-206 mph) tornado 17.2 miles away from the town center killed one person and injured 6 people and caused between $500,000 and $5,000,000 in damages.
Earthquake activity:
Leesburg-area historical earthquake activity is significantly above Virginia state average. It is 55% smaller than the overall U.S. average. On 8/23/2011 at 17:51:04, a magnitude 5.8 (5.8 MW, Depth: 3.7 mi, Class: Moderate, Intensity: VI - VII) earthquake occurred 85.5 miles away from the city center On 9/25/1998 at 19:52:52, a magnitude 5.2 (4.8 MB, 4.3 MS, 5.2 LG, 4.5 MW, Depth: 3.1 mi) earthquake occurred 222.6 miles away from the city center On 8/25/2011 at 05:07:52, a magnitude 4.5 (4.5 ML, Depth: 4.2 mi, Class: Light, Intensity: IV - V) earthquake occurred 83.4 miles away from the city center On 1/16/1994 at 01:49:16, a magnitude 4.6 (4.6 MB, 4.6 LG, Depth: 3.1 mi) earthquake occurred 116.9 miles away from the city center On 12/9/2003 at 20:59:18, a magnitude 4.5 (4.5 ML, Depth: 6.2 mi) earthquake occurred 96.9 miles away from Leesburg center On 12/9/2003 at 20:59:14, a magnitude 4.5 (4.5 MB, 4.5 LG) earthquake occurred 106.9 miles away from the city center Magnitude types: regional Lg-wave magnitude (LG), body-wave magnitude (MB), local magnitude (ML), surface-wave magnitude (MS), moment magnitude (MW) Natural disasters: The number of natural disasters in Loudoun County (11) is smaller than the US average (15).Major Disasters (Presidential) Declared: 8Emergencies Declared: 3Winter Storms: 4, Hurricanes: 3, Snowstorms: 2, Blizzard: 1, Flood: 1, Tropical Storm: 1, Other: 1 (Note: some incidents may be assigned to more than one category). Hospitals and medical centers in Leesburg: INOVA LOUDOUN HOSPITAL (Voluntary non-profit - Private, provides emergency services, 44045 RIVERSIDE PARKWAY) PIEDMONT BEHAVIORAL HEALTH CENTER (42009 VICTORY LANE) HERITAGE HALL NRSG AND REHAB (122 MORVEN PARK ROAD NW)
LOUDOUN MEM HOSP (224 CORNWALL STR NW)
LOUDOUN NURSING AND REHAB CNTR (235 OLD WATERFORD ROAD, NORTHWEST)
LEESBURG VIRGINIA DIALYSIS (224-D CORNWALL ST STE 100)
ACTUAL CARE HOME HEALTH SERVICES (19455 DEERFIELD AVE SUITE 310)
CAPITAL HOME HEALTH CARE INC (211 GIBSON STREET, NW, SUITE 207)
Amtrak stations near Leesburg: 13 miles: DULLES INTERNATIONAL AP'T (HERNDON, DULLES INTERNATIONAL AIRPORT) - Bus Station Services: enclosed waiting area, public restrooms, public payphones, full-service food facilities, paid short-term parking, paid long-term parking, car rental agency, taxi stand, public transit connection.
18 miles: HARPERS FERRY (POTOMAC ST.) Services: enclosed waiting area, public restrooms, public payphones, free short-term parking, free long-term parking, public transit connection.
Colleges/universities with over 2000 students nearest to Leesburg:
American Public University System (about 21 miles; Charles Town, WV ; Full-time enrollment: 43,829)
Stratford University (about 21 miles; Fairfax, VA ; FT enrollment: 2,570)
Montgomery College (about 22 miles; Rockville, MD ; FT enrollment: 17,999)
George Mason University (about 24 miles; Fairfax, VA ; FT enrollment: 26,002)
Frederick Community College (about 25 miles; Frederick, MD ; FT enrollment: 3,798)
Northern Virginia Community College (about 26 miles; Annandale, VA ; FT enrollment: 35,721)
Shepherd University (about 27 miles; Shepherdstown, WV ; FT enrollment: 3,745)
Public high schools in Leesburg: LOUDOUN COUNTY HIGH Students: 1,372, Location: 415 DRY MILL RD SW, Grades: 9-12)HERITAGE HIGH Location: 520 EVERGREEN MILL RD. SE, Grades: PK-12)
TUSCARORA HIGH Location: 801 NORTH KING STREET, Grades: PK-12)
Private high schools in Leesburg: LEESBURG CHRISTIAN SCHOOL Students: 140, Location: 21336 EVERGREEN MILLS RD, Grades: PK-12)
NORTH SPRING BEHAVIORAL HEALTHCARE Students: 74, Location: 42009 VICTORY LN, Grades: 5-12)
GRAYDON MANOR Students: 32, Location: 801 CHILDRENS CENTER RD SW, Grades: 5-12)
Biggest public elementary/middle schools in Leesburg: BELMONT RIDGE MIDDLE Students: 1,072, Location: 19045 UPPER BELMONT PLACE, Grades: 6-8)SELDENS LANDING ELEM Students: 1,051, Location: 43345 COTON COMMONS DR., Grades: PK-5)JOHN W. TOLBERT JR. ELEM Students: 920, Location: 691 POTOMAC STATION DR NE, Grades: PK-5)SMART'S MILL MIDDLE Students: 897, Location: 850 N. KING ST., Grades: 6-8)J. LUPTON SIMPSON MIDDLE Students: 809, Location: 490 EVERGREEN MILL RD SE, Grades: 6-8)FRANCES HAZEL REID ELEM Students: 805, Location: 800 N. KING ST., Grades: PK-5)HARPER PARK MIDDLE Students: 800, Location: 701 POTOMAC STATION DR NE, Grades: 6-8)COOL SPRING ELEM Students: 744, Location: 501 TAVISTOCK DR SE, Grades: PK-5)BALL'S BLUFF ELEM Students: 664, Location: 821 BATTLEFIELD PKWY NE, Grades: PK-5)EVERGREEN MILL ELEM Students: 589, Location: 491 EVERGREEN MILL RD SE, Grades: PK-5)Private elementary/middle schools in Leesburg: LOUDOUN COUNTRY DAY SCHOOL Students: 296, Location: 20600 RED CEDAR DR, Grades: PK-8)
DOMINION ACADEMY Students: 257, Location: 835 LEE AVE SW, Grades: PK-8)
See full list of schools located in Leesburg Library in Leesburg: LOUDOUN COUNTY PUBLIC LIBRARY Operating income: $12,176,931; Location: 908A TRAILVIEW BLVD., S.E.; 443,377 books ; 47,052 e-books ; 38,637 audio materials ; 52,869 video materials ; 48 local licensed databases ; 18 state licensed databases ; 970 print serial subscriptions )
User-submitted facts and corrections:
Northern Virginia Community College - Loudoun Campus - is approximately 14 miles from Leesburg. added by Paul
Add to Public Schools: Smarts Mill Middle School 850 North King Street Leesburg, Virginia 20176 703-669-1480 http://www.loudoun.k12.va.us/schools/smarts/ (opens in the fall 2004)
Notable locations in Leesburg: (A) , Westpark Golf Club (B) , Waverly Business Park (C) , Tuscarora Business Park (D) , Leesburg Country Club (E) , Cardinal Industrial Park (F) , Balls Bluff Battlefield (G) , AirCare 3 Base 3 (H) , Loudoun County Volunteer Rescue Squad Company 13 (I) , Loudoun County Department of Fire Rescue and Emergency Management Administration (J) , Thomas Balch Library (K) , Loudoun Museum (L) , Loudoun County Jail (M) , Loudoun County Courthouse (N) , Loudoun County Volunteer Rescue Squad Company 13 (O) , Loudoun County Fire and Rescue Leesburg Volunteer Fire Station 20 (P) , Loudoun County Fire and Rescue Leesburg Volunteer Fire Station 1 (Q) , Loudoun County Public Library (R) , Loudoun County Government Center (S) , Douglass Community Center (T) . Display/hide their locations on the map
Shopping Centers: (1) , Toll House Shopping Center (2) , Market Station Shopping Center (3) , Leesburg Plaza Shopping Center (4) , Battlefield Shopping Center (5) . Display/hide their locations on the map
Churches in Leesburg include: (A) , Leesburg Presbyterian Church (B) , Leesburg Seventh Day Adventist Church (C) , Mount Olive Baptist Church (D) , Mount Zion Methodist Episcopal Church (E) , Old Stone Church (F) , Providence Baptist Church (G) , Saint James Episcopal Church (H) , Saint John The Apostle Roman Catholic Church (I) . Display/hide their locations on the map
Cemeteries: (1) , Old Stone Church Cemetery (2) , Old Saint James Cemetery (3) , Balls Bluff National Cemetery (4) . Display/hide their locations on the map
Streams, rivers, and creeks: (A) , Dry Mill Branch (B) . Display/hide their locations on the map
Parks in Leesburg include: (1) , Smithsonian Naturalist Center (2) , Ida Lee Park and Recreation Center (3) , Stone House at Harper Park (4) , Balls Bluff Regional Park (5) , Leesburg Historic District (6) , Plaza Street Park (7) , Robinson Park (8) , Rotary Park (9) . Display/hide their locations on the map
Tourist attractions:
Hotels:
Birthplace of: Frank W. Johnson - Co-commander of the Texian Army, Philip St. George Cooke - Union Army general, William Temple Thomson Mason - Planter, Billy Hurley III - Professional golfer, Jacob Doyle - Baseball player, Stephen Eaton - College football player (Virginia Cavaliers), Toby Atwell - Baseball player.
Loudoun County has a predicted average indoor radon screening level between 2 and 4 pCi/L (pico curies per liter) - Moderate Potential Drinking water stations with addresses in Leesburg and their reported violations in the past:
RIO VISTA PLAZA MOBILE HOME PARK (Serves MD, Population served: 150, Groundwater):
Past monitoring violations:
Lead Consumer Notice - In JAN-01-2013, Contaminant: Lead and Copper Rule. Follow-up actions: St Violation/Reminder Notice (JUL-24-2012)
Population served: 50, Groundwater):
Past monitoring violations:
One routine major monitoring violation
Population served: 30, Groundwater):
Past monitoring violations:
7 routine major monitoring violations
One minor monitoring violation
Population served: 26, Groundwater):
Past health violations:
MCL, Monthly (TCR) - In APR-2011, Contaminant: Coliform. Follow-up actions: St Public Notif requested (APR-19-2011), St Boil Water Order (APR-19-2011), St Formal NOV issued (APR-19-2011), St Public Notif received (MAY-04-2011), St Compliance achieved (JUN-02-2011)
MCL, Acute (TCR) - In APR-2011, Contaminant: Coliform. Follow-up actions: St Public Notif requested (MAY-03-2011), St Boil Water Order (MAY-03-2011), St Formal NOV issued (MAY-03-2011), St Public Notif received (MAY-04-2011), St Compliance achieved (JUN-02-2011)
MCL, Acute (TCR) - In MAR-2011, Contaminant: Coliform. Follow-up actions: St Public Notif requested (MAR-25-2011), St Boil Water Order (MAR-25-2011), St Formal NOV issued (MAR-25-2011), St Public Notif received (APR-04-2011), St Compliance achieved (JUN-02-2011)
MCL, Monthly (TCR) - In MAR-2011, Contaminant: Coliform. Follow-up actions: St Public Notif requested (MAR-25-2011), St Boil Water Order (MAR-25-2011), St Formal NOV issued (MAR-25-2011), St Public Notif received (APR-04-2011), St Compliance achieved (JUN-02-2011)
MCL, Acute (TCR) - Between OCT-2008 and DEC-2008, Contaminant: Coliform. Follow-up actions: St Public Notif requested (NOV-10-2008), St Boil Water Order (NOV-10-2008), St Formal NOV issued (NOV-10-2008), St Public Notif received (NOV-14-2008), St Compliance achieved (JAN-26-2009)
MCL, Monthly (TCR) - In JUL-2006, Contaminant: Coliform. Follow-up actions: St Formal NOV issued (AUG-24-2006), St Public Notif requested (AUG-24-2006), St Public Notif received (SEP-13-2006)
Past monitoring violations:
3 routine major monitoring violations
2 minor monitoring violations
Population served: 25, Groundwater):
Past monitoring violations:
2 routine major monitoring violations
Population served: 25, Groundwater):
Past monitoring violations:
2 routine major monitoring violations
Drinking water stations with addresses in Leesburg that have no violations reported:
WDF COMFORT STATION (Population served: 25, Primary Water Source Type: Groundwater)
Average household size: This town:
2.9 peopleVirginia:
2.5 people
Percentage of family households: This town:
72.9%Whole state:
67.0%
Percentage of households with unmarried partners: This town:
5.8%Whole state:
5.7%
Likely homosexual households (counted as self-reported same-sex unmarried-partner households)
Lesbian couples: 0.3% of all households Gay men: 0.3% of all households
People in group quarters in Leesburg in 2010:
247 people in nursing facilities/skilled-nursing facilities
5 people in other noninstitutional facilities
4 people in group homes intended for adults
People in group quarters in Leesburg in 2000:
324 people in nursing homes
140 people in local jails and other confinement facilities (including police lockups)
20 people in other noninstitutional group quarters
19 people in short-term care, detention or diagnostic centers for delinquent children
12 people in homes for abused, dependent, and neglected children
3 people in homes for the mentally retarded
Banks with most branches in Leesburg (2011 data):
Wells Fargo Bank, National Association: Prosperity Centre Branch, Leesburg Main Branch, The Village At Leesburg Branch. Info updated 2011/04/05: Bank assets: $1,161,490.0 mil, Deposits: $905,653.0 mil, headquarters in Sioux Falls, SD, positive income , 6395 total offices , Holding Company: Wells Fargo & Company
Capital One, National Association: 607 Potomac Station Drive, Lansdowne Branch, 1 Catoctin Circle Branch. Info updated 2011/07/01: Bank assets: $133,477.8 mil, Deposits: $97,063.7 mil, headquarters in Mclean, VA, positive income , 984 total offices , Holding Company: Capital One Financial Corporation
Bank of America, National Association: Battlefield Parkway Branch at 554 Fort Evans Road, branch established on 2008/06/30; Leesburg East End Branch at 505 East Market Street, branch established on 1963/01/10. Info updated 2009/11/18: Bank assets: $1,451,969.3 mil, Deposits: $1,077,176.8 mil, headquarters in Charlotte, NC, positive income , 5782 total offices , Holding Company: Bank Of America Corporation
PNC Bank, National Association: Leesburg Office at 606 S. King Street, branch established on 2001/04/11; Leesburg Branch at 61 Catoctin Circle, N.E., branch established on 2010/10/13. Info updated 2012/03/20: Bank assets: $263,309.6 mil, Deposits: $197,343.0 mil, headquarters in Wilmington, DE, positive income , Commercial Lending Specialization, 3085 total offices , Holding Company: Pnc Financial Services Group, Inc., The
Sandy Spring Bank: Pbov Lansdowne Branch at 19460 Golf Vista Plaza, branch established on 2007/02/10; Leesburg Office #007 at 1 Catoctin Circle Ne, branch established on 2009/12/07. Info updated 2007/07/17: Bank assets: $3,709.4 mil, Deposits: $2,664.0 mil, headquarters in Olney, MD, positive income , Commercial Lending Specialization, 43 total offices , Holding Company: Sandy Spring Bancorp, Inc.
SunTrust Bank: Lansdowne Branch at 19391 Lansdowne Boulevard, branch established on 2005/12/12; Battlefield Branch at 1007 Edwards Ferry Road, N.E., branch established on 1992/02/18. Info updated 2010/05/27: Bank assets: $171,291.7 mil, Deposits: $129,833.2 mil, headquarters in Atlanta, GA, positive income , Commercial Lending Specialization, 1716 total offices , Holding Company: Suntrust Banks, Inc.
Branch Banking and Trust Company: Leesburg Main Branch at 101 Catoctin Circle Se, branch established on 1986/03/12; Market Street Branch at 7 West Market Street, branch established on 1983/04/07. Info updated 2010/03/29: Bank assets: $168,867.6 mil, Deposits: $127,549.5 mil, headquarters in Winston Salem, NC, positive income , Commercial Lending Specialization, 1793 total offices , Holding Company: Bb&T Corporation
The Middleburg Bank: Leesburg Branch at 102 Catoctin Circle Southeast, branch established on 1996/01/29; Fort Evans Branch at 538 Fort Evans Rd. Ne, branch established on 2002/07/29. Info updated 2008/09/23: Bank assets: $1,186.8 mil, Deposits: $931.5 mil, headquarters in Middleburg, VA, positive income , Commercial Lending Specialization, 10 total offices , Holding Company: Middleburg Financial Corporation
Citibank, National Association: Leesburg Branch at 504 E Market St, branch established on 2006/10/01. Info updated 2012/01/10: Bank assets: $1,288,658.0 mil, Deposits: $882,541.0 mil, headquarters in Sioux Falls, SD, positive income , International Specialization, 1048 total offices , Holding Company: Citigroup Inc.
11 other banks with 11 local branches
For population 15 years and over in Leesburg:
Never married: 30.2%Now married: 53.7%Separated: 1.5%Widowed: 3.6%Divorced: 10.9% For population 25 years and over in Leesburg:
High school or higher: 93.0%Bachelor's degree or higher: 56.1%Graduate or professional degree: 21.3%Unemployed: 2.1%Mean travel time to work (commute): 18.8 minutes
Education Gini index (Inequality in education) Here:
10.7Virginia average:
12.1
Religion statistics for Leesburg, VA (based on Loudoun County data)
Religion Adherents Congregations Catholic 45,687 6 Other 34,241 31 Mainline Protestant 22,080 51 Evangelical Protestant 17,314 84 Orthodox 300 2 Black Protestant 199 2 None 192,490 -
Source: Clifford Grammich, Kirk Hadaway, Richard Houseal, Dale E.Jones, Alexei Krindatch, Richie Stanley and Richard H.Taylor. 2012. 2010 U.S.Religion Census: Religious Congregations & Membership Study. Association of Statisticians of American Religious Bodies. Jones, Dale E., et al. 2002. Congregations and Membership in the United States 2000. Nashville, TN: Glenmary Research Center. Graphs represent county-level data
Food Environment Statistics: Number of grocery stores : 48Here :
1.73 / 10,000 pop.State :
2.03 / 10,000 pop.
Number of supercenters and club stores : 3Loudoun County :
0.11 / 10,000 pop.Virginia :
0.17 / 10,000 pop.
Number of convenience stores (no gas) : 28This county :
1.01 / 10,000 pop.Virginia :
1.43 / 10,000 pop.
Number of convenience stores (with gas) : 52Loudoun County :
1.87 / 10,000 pop.Virginia :
4.03 / 10,000 pop.
Number of full-service restaurants : 189This county :
6.81 / 10,000 pop.State :
7.65 / 10,000 pop.
Adult diabetes rate : Loudoun County :
6.0%Virginia :
9.3%
Adult obesity rate : Loudoun County :
23.0%State :
26.7%
Low-income preschool obesity rate : This county :
19.2%Virginia :
18.6%
Health and Nutrition: Healthy diet rate : This city:
49.3%Virginia:
50.6%
Average overall health of teeth and gums : This city:
47.7%State:
48.6%
Average BMI : Leesburg:
28.5Virginia:
28.6
People feeling badly about themselves : This city:
21.0%Virginia:
20.2%
People not drinking alcohol at all : Leesburg:
9.1%Virginia:
10.5%
Average hours sleeping at night : This city:
6.8Virginia:
6.8
Overweight people : This city:
32.4%Virginia:
33.5%
General health condition : This city:
58.2%Virginia:
57.4%
Average condition of hearing : Leesburg:
81.5%Virginia:
80.5%
More about Health and Nutrition of Leesburg, VA Residents
Local government employment and payroll (March 2022)
Function
Full-time employees
Monthly full-time payroll
Average yearly full-time wage
Part-time employees
Monthly part-time payroll
Police Protection - Officers
73 $571,694 $93,977 0 $0 Streets and Highways
58 $402,554 $83,287 1 $2,518 Other and Unallocable
49 $413,726 $101,321 10 $23,991 Water Supply
37 $260,780 $84,577 1 $2,939 Parks and Recreation
32 $201,822 $75,683 158 $158,421 Financial Administration
27 $225,078 $100,035 1 $2,638 Sewerage
27 $186,109 $82,715 1 $2,914 Other Government Administration
25 $202,508 $97,204 0 $0 Police - Other
16 $111,595 $83,696 0 $0 Judicial and Legal
5 $53,826 $129,182 0 $0 Airports
3 $20,892 $83,568 1 $2,271 Local Libraries
3 $22,844 $91,376 6 $4,907
Totals for Government
355 $2,673,427 $90,369 179 $200,600
Leesburg government finances - Expenditure in 2021 (per resident):
Construction - Regular Highways: $3,304,000 ($67.46)
Central Staff Services: $3,236,000 ($66.08)Water Utilities: $1,435,000 ($29.30)Natural Resources - Other: $1,386,000 ($28.30)Sewerage: $761,000 ($15.54)Air Transportation: $341,000 ($6.96)Parks and Recreation: $180,000 ($3.68)Current Operations - Police Protection: $12,915,000 ($263.71)
Sewerage: $12,727,000 ($259.87)Water Utilities: $10,039,000 ($204.99)Regular Highways: $6,320,000 ($129.05)Parks and Recreation: $5,940,000 ($121.29)Protective Inspection and Regulation - Other: $4,169,000 ($85.13)General - Other: $3,835,000 ($78.31)Solid Waste Management: $3,306,000 ($67.51)Financial Administration: $2,895,000 ($59.11)General Public Buildings: $2,136,000 ($43.61)Central Staff Services: $1,867,000 ($38.12)Housing and Community Development: $1,672,000 ($34.14)Judicial and Legal Services: $889,000 ($18.15)Air Transportation: $738,000 ($15.07)Libraries: $510,000 ($10.41)Local Fire Protection: $329,000 ($6.72)Parking Facilities: $43,000 ($0.88)General - Interest on Debt: $4,566,000 ($93.23)
Intergovernmental to State - Regular Highways: $2,469,000 ($50.41)
Other Capital Outlay - Police Protection: $1,488,000 ($30.38)
Parks and Recreation: $179,000 ($3.66)General Public Building: $123,000 ($2.51)Regular Highways: $104,000 ($2.12)General - Other: $50,000 ($1.02)Air Transportation: $37,000 ($0.76)Financial Administration: $5,000 ($0.10)Sewerage: $2,000 ($0.04)Total Salaries and Wages: $31,835,000 ($650.04)
Leesburg government finances - Revenue in 2021 (per resident):
Charges - Sewerage: $12,216,000 ($249.44)
Parks and Recreation: $3,173,000 ($64.79)Air Transportation: $1,334,000 ($27.24)Parking Facilities: $124,000 ($2.53)Federal Intergovernmental - Air Transportation: $141,000 ($2.88)
Highways: $37,000 ($0.76)Local Intergovernmental - Highways: $2,644,000 ($53.99)
General Local Government Support: $97,000 ($1.98)Miscellaneous - General Revenue - Other: $3,125,000 ($63.81)
Rents: $323,000 ($6.60)Fines and Forfeits: $259,000 ($5.29)Interest Earnings: $206,000 ($4.21)Sale of Property: $168,000 ($3.43)Donations From Private Sources: $54,000 ($1.10)Revenue - Water Utilities: $16,085,000 ($328.44)
State Intergovernmental - Highways: $5,174,000 ($105.65)
General Local Government Support: $1,469,000 ($30.00)Other: $113,000 ($2.31)Tax - Property: $18,814,000 ($384.16)
Occupation and Business License - Other: $5,733,000 ($117.06)Public Utilities Sales: $3,301,000 ($67.40)Other Selective Sales: $3,301,000 ($67.40)Other License: $1,476,000 ($30.14)Motor Vehicle License: $1,052,000 ($21.48)Tobacco Products Sales: $616,000 ($12.58)Amusements License: $2,000 ($0.04)
Leesburg government finances - Debt in 2021 (per resident):
Long Term Debt - Outstanding Unspecified Public Purpose: $115,483,000 ($2358.05)
Beginning Outstanding - Unspecified Public Purpose: $114,169,000 ($2331.22)Issue, Unspecified Public Purpose: $22,789,000 ($465.33)Retired Unspecified Public Purpose: $21,476,000 ($438.52)
Leesburg government finances - Cash and Securities in 2021 (per resident):
Other Funds - Cash and Securities: $120,120,000 ($2452.73)
Sinking Funds - Cash and Securities: $9,754,000 ($199.17)
9.26% of this county's 2021 resident taxpayers lived in other counties in 2020 ($110,277 average adjusted gross income )
Here:
9.26%Virginia average:
10.16%
0.24% of residents moved from foreign countries ($3,796 average AGI )Loudoun County:
0.24%Virginia average:
0.12%
Top counties from which taxpayers relocated into this county between 2020 and 2021:
8.87% of this county's 2020 resident taxpayers moved to other counties in 2021 ($118,167 average adjusted gross income )
Here:
8.87%Virginia average:
10.20%
0.20% of residents moved to foreign countries ($3,395 average AGI )Loudoun County:
0.20%Virginia average:
0.09%
Top counties to which taxpayers relocated from this county between 2020 and 2021:
Businesses in Leesburg, VA
Name Count Name Count
7-Eleven 5 JoS. A. Bank 1 AT&T 2 Jones New York 2 Advance Auto Parts 1 Juicy Couture 1 Aeropostale 1 Kohl's 1 Aerosoles 1 LA Fitness 1 Ann Taylor 2 Levi Strauss & Co. 1 Arby's 1 Little Caesars Pizza 1 Banana Republic 1 Marshalls 1 Baskin-Robbins 1 MasterBrand Cabinets 1 Bed Bath & Beyond 1 McDonald's 2 Best Western 1 Motherhood Maternity 1 Blockbuster 1 New Balance 1 Brooks Brothers 1 Nike 5 Buffalo Wild Wings 1 Office Depot 1 Burger King 2 Old Navy 1 CVS 1 Pac Sun 1 Charlotte Russe 1 Panera Bread 2 Chevrolet 1 Papa John's Pizza 1 Chico's 1 Penske 1 Clarks 1 PetSmart 1 Cold Stone Creamery 1 Pier 1 Imports 1 Coldwater Creek 1 Pizza Hut 2 Comfort Suites 1 Popeyes 1 Costco 1 Pottery Barn 1 Cricket Wireless 3 Pottery Barn Kids 1 Curves 1 Quiznos 2 DHL 1 RadioShack 1 Days Inn 1 Rite Aid 1 Domino's Pizza 1 Ruby Tuesday 1 DressBarn 1 Safeway 1 Dressbarn 1 Skechers USA 1 Dunkin Donuts 1 Sprint Nextel 1 Eddie Bauer 1 Staples 1 Famous Footwear 2 Starbucks 4 FedEx 14 Subaru 1 Ford 1 Subway 2 GNC 1 T-Mobile 3 GameStop 1 T.G.I. Driday's 1 Gap 1 Taco Bell 1 Giant 2 Talbots 1 Gymboree 1 Target 1 H&R Block 1 The Room Place 1 Haagen-Dazs 1 Toyota 1 Hilton 1 U-Haul 1 Holiday Inn 1 UPS 14 Home Depot 1 Verizon Wireless 2 Hyundai 1 Vons 1 IHOP 1 Walgreens 2 IZOD 1 Walmart 1 J.Crew 1 Wendy's 1 Jimmy Jazz 1
Strongest AM radio stations in Leesburg:
WAGE (1200 AM; 5 kW; LEESBURG, VA; Owner: RADIO WAGE, INC.)
WMET (1150 AM; 50 kW; GAITHERSBURG, MD; Owner: BELTWAY ACQUISITION CORPORATION)
WTRI (1520 AM; daytime; 17 kW; BRUNSWICK, MD; Owner: JMK COMMUNICATIONS, INC.)
WKCW (1420 AM; 50 kW; WARRENTON, VA; Owner: WAY BROADCASTING, INC.)
WTEM (980 AM; 50 kW; WASHINGTON, DC; Owner: AMFM RADIO LICENSES, L.L.C.)
WTOP (1500 AM; 50 kW; WASHINGTON, DC; Owner: BONNEVILLE HOLDING COMPANY)
WCBM (680 AM; 50 kW; BALTIMORE, MD; Owner: WCBM MARYLAND, INC.)
WUST (1120 AM; daytime; 20 kW; WASHINGTON, DC)
WBAL (1090 AM; 50 kW; BALTIMORE, MD; Owner: HEARST RADIO, INC.)
WPGC (1580 AM; 50 kW; MORNINGSIDE, MD; Owner: INFINITY WPGC(AM), INC.)
WGOP (700 AM; daytime; 25 kW; WALKERSVILLE, MD; Owner: BIRACH BROADCASTING CORPORATION)
WTNT (570 AM; 5 kW; BETHESDA, MD; Owner: AMFM RADIO LICENSES, L.L.C.)
WWGB (1030 AM; daytime; 50 kW; INDIAN HEAD, MD; Owner: GOOD BODY MEDIA, LLC)
Strongest FM radio stations in Leesburg:
W228BA (93.5 FM; LEESBURG, VA; Owner: CSN INTERNATIONAL)
WINC-FM (92.5 FM; WINCHESTER, VA; Owner: MID ATLANTIC NETWORK, INC.)
WFRE (99.9 FM; FREDERICK, MD; Owner: CAPSTAR TX LIMITED PARTNERSHIP)
W219BX (91.7 FM; FREDERICK, MD; Owner: CEDAR RIDGE CHILDREN'S HOME & SCHOOL, INC)
WWVZ (103.9 FM; BRADDOCK HEIGHTS, MD; Owner: BONNEVILLE HOLDING COMPANY)
WPER (89.9 FM; CULPEPER, VA; Owner: POSITIVE ALTERNATIVE RADIO INC.)
WJFK-FM (106.7 FM; MANASSAS, VA; Owner: INFINITY BROADCASTING CORP. OF WASHINGTON, DC)
WARX (106.9 FM; HAGERSTOWN, MD; Owner: MANNING BROADCASTING INC.)
WAFY (103.1 FM; MIDDLETOWN, MD; Owner: FREDERICK BROADCASTING LLC)
WAYZ-FM (104.7 FM; HAGERSTOWN, MD; Owner: HJV LIMITED PARTNERSHIP)
WARW (94.7 FM; BETHESDA, MD; Owner: INFINITY BROADCASTING OPERATIONS, INC.)
WIHT (99.5 FM; WASHINGTON, DC; Owner: AMFM RADIO LICENSES, L.L.C.)
WETH (89.1 FM; HAGERSTOWN, MD; Owner: GREATER WASHINGTON EDUCATIONAL TELECOMMUNICATIONS ASSN.)
WRQX (107.3 FM; WASHINGTON, DC; Owner: WMAL, INC.)
WASH (97.1 FM; WASHINGTON, DC; Owner: AMFM RADIO LICENSES, L.L.C.)
WHUR-FM (96.3 FM; WASHINGTON, DC; Owner: THE HOWARD UNIVERSITY)
WJZW (105.9 FM; WOODBRIDGE, VA; Owner: WMAL, INC.)
WWDC-FM (101.1 FM; WASHINGTON, DC; Owner: AMFM RADIO LICENSES, L.L.C.)
W243AF (96.5 FM; FLINT HILL, VA; Owner: CSN INTERNATIONAL)
WTRM (91.3 FM; WINCHESTER, VA; Owner: TIMBER RIDGE MINISTRIES, INC.)
TV broadcast stations around Leesburg:
WFPT (Channel 62; FREDERICK, MD; Owner: MARYLAND PUBLIC BROADCASTING COMMISSION)
WTTG (Channel 5; WASHINGTON, DC; Owner: FOX TELEVISION STATIONS, INC.)
WJLA-TV (Channel 7; WASHINGTON, DC; Owner: ACC LICENSEE, INC.)
WUSA (Channel 9; WASHINGTON, DC; Owner: THE DETROIT NEWS, INC.)
WETA-TV (Channel 26; WASHINGTON, DC; Owner: THE GREATER WASHINGTON ED TELECOMM. ASSOC)
WDCA (Channel 20; WASHINGTON, DC; Owner: FOX TELEVISION STATIONS, INC.)
WNVC (Channel 56; FAIRFAX, VA; Owner: COMMONWEALTH PUBLIC BROADCASTING CORPORATION)
WHUT-TV (Channel 32; WASHINGTON, DC; Owner: HOWARD UNIVERSITY)
WBDC-TV (Channel 50; WASHINGTON, DC; Owner: WBDC BROADCASTING, INC.)
WRC-TV (Channel 4; WASHINGTON, DC; Owner: NBC SUBSIDIARY (WRC-TV), INC.)
W52AS (Channel 52; FREDERICK, MD; Owner: THREE ANGELS BROADCASTING NETWORK)
WPXW (Channel 66; MANASSAS, VA; Owner: PAXSON WASHINGTON LICENSE, INC.)
WNVT (Channel 53; GOLDVEIN, VA; Owner: COMMONWEALTH PUBLIC BROADCASTING CORPORATION)
W28BY (Channel 63; BALTIMORE, MD; Owner: INFORMATION SUPER STATION, L.L.C.)
W42BE (Channel 42; FAIRFAX, VA; Owner: FAIRFAX LOW POWER CO.)
National Bridge Inventory (NBI) Statistics 111 Number of bridges1,106ft / 337m Total length $5,558,000 Total costs1,350,593 Total average daily traffic29,818 Total average daily truck traffic
New bridges - historical statistics
1 Before 1900 1 1910-1919 2 1930-1939 3 1950-1959 4 1960-1969 28 1970-1979 7 1980-1989 30 1990-1999 22 2000-2009 10 2010-2019 3 2020-2022
See full National Bridge Inventory statistics for Leesburg, VA
Home Mortgage Disclosure Act Aggregated Statistics For Year 2009(Based on 5 partial tracts) A) FHA, FSA/RHS & VA B) Conventional C) Refinancings D) Home Improvement Loans F) Non-occupant Loans on G) Loans On Manufactured Number Average Value Number Average Value Number Average Value Number Average Value Number Average Value Number Average Value
LOANS ORIGINATED 260 $278,526 179 $277,324 747 $306,874 21 $148,634 49 $178,332 0 $0 APPLICATIONS APPROVED, NOT ACCEPTED 13 $274,861 15 $249,193 58 $279,957 2 $126,915 8 $167,965 0 $0 APPLICATIONS DENIED 28 $251,889 18 $285,807 215 $322,458 7 $72,587 13 $240,328 1 $20,930 APPLICATIONS WITHDRAWN 33 $252,366 28 $263,873 153 $336,534 5 $139,858 12 $142,250 0 $0 FILES CLOSED FOR INCOMPLETENESS 6 $171,242 4 $244,020 42 $290,305 1 $16,770 1 $274,900 0 $0
Aggregated Statistics For Year 2008(Based on 5 partial tracts) A) FHA, FSA/RHS & VA B) Conventional C) Refinancings D) Home Improvement Loans E) Loans on Dwellings For 5+ Families F) Non-occupant Loans on G) Loans On Manufactured Number Average Value Number Average Value Number Average Value Number Average Value Number Average Value Number Average Value Number Average Value
LOANS ORIGINATED 222 $265,095 271 $274,733 322 $280,069 32 $128,077 2 $3,079,220 65 $168,179 0 $0 APPLICATIONS APPROVED, NOT ACCEPTED 16 $242,151 33 $239,318 64 $346,856 7 $74,466 0 $0 11 $136,976 0 $0 APPLICATIONS DENIED 28 $225,477 60 $223,395 206 $303,606 25 $78,540 0 $0 15 $156,085 2 $68,855 APPLICATIONS WITHDRAWN 30 $255,319 42 $286,813 105 $349,227 6 $170,663 0 $0 13 $176,030 1 $49,840 FILES CLOSED FOR INCOMPLETENESS 3 $241,123 11 $274,825 16 $313,021 1 $992,210 0 $0 4 $216,500 0 $0
Aggregated Statistics For Year 2007(Based on 5 partial tracts) A) FHA, FSA/RHS & VA B) Conventional C) Refinancings D) Home Improvement Loans F) Non-occupant Loans on G) Loans On Manufactured Number Average Value Number Average Value Number Average Value Number Average Value Number Average Value Number Average Value
LOANS ORIGINATED 17 $326,722 674 $294,826 477 $276,330 60 $115,082 84 $221,354 0 $0 APPLICATIONS APPROVED, NOT ACCEPTED 0 $0 72 $262,878 123 $281,018 11 $131,753 11 $237,270 0 $0 APPLICATIONS DENIED 2 $224,360 118 $267,683 337 $317,333 42 $133,016 33 $227,741 1 $169,960 APPLICATIONS WITHDRAWN 2 $322,055 91 $307,279 175 $308,031 6 $189,653 20 $184,564 0 $0 FILES CLOSED FOR INCOMPLETENESS 0 $0 21 $334,984 47 $330,450 1 $121,850 2 $312,605 0 $0
Aggregated Statistics For Year 2006(Based on 5 partial tracts) A) FHA, FSA/RHS & VA B) Conventional C) Refinancings D) Home Improvement Loans F) Non-occupant Loans on G) Loans On Manufactured Number Average Value Number Average Value Number Average Value Number Average Value Number Average Value Number Average Value
LOANS ORIGINATED 10 $275,614 1,009 $284,086 815 $286,654 105 $112,938 109 $233,047 0 $0 APPLICATIONS APPROVED, NOT ACCEPTED 0 $0 90 $327,678 145 $250,396 19 $112,889 17 $242,978 0 $0 APPLICATIONS DENIED 0 $0 161 $277,622 345 $303,351 43 $164,690 26 $288,472 1 $122,660 APPLICATIONS WITHDRAWN 1 $238,090 113 $294,716 279 $303,972 17 $170,541 23 $250,253 0 $0 FILES CLOSED FOR INCOMPLETENESS 0 $0 17 $272,592 53 $279,644 6 $215,643 6 $231,405 0 $0
Aggregated Statistics For Year 2005(Based on 5 partial tracts) A) FHA, FSA/RHS & VA B) Conventional C) Refinancings D) Home Improvement Loans E) Loans on Dwellings For 5+ Families F) Non-occupant Loans on G) Loans On Manufactured Number Average Value Number Average Value Number Average Value Number Average Value Number Average Value Number Average Value Number Average Value
LOANS ORIGINATED 11 $267,177 1,362 $296,468 1,243 $288,900 121 $132,868 2 $30,093,000 220 $233,928 2 $126,330 APPLICATIONS APPROVED, NOT ACCEPTED 1 $247,990 91 $318,426 144 $276,679 19 $157,167 0 $0 18 $201,832 1 $85,820 APPLICATIONS DENIED 1 $233,350 181 $276,005 311 $278,067 46 $109,367 0 $0 22 $215,579 4 $46,305 APPLICATIONS WITHDRAWN 1 $266,900 99 $329,107 245 $285,791 34 $169,039 0 $0 24 $236,324 0 $0 FILES CLOSED FOR INCOMPLETENESS 0 $0 32 $322,583 47 $267,581 7 $186,039 0 $0 5 $248,296 0 $0
Aggregated Statistics For Year 2004(Based on 5 partial tracts) A) FHA, FSA/RHS & VA B) Conventional C) Refinancings D) Home Improvement Loans E) Loans on Dwellings For 5+ Families F) Non-occupant Loans on G) Loans On Manufactured Number Average Value Number Average Value Number Average Value Number Average Value Number Average Value Number Average Value Number Average Value
LOANS ORIGINATED 47 $211,627 1,324 $265,886 1,296 $243,694 91 $102,457 1 $485,110 164 $180,660 0 $0 APPLICATIONS APPROVED, NOT ACCEPTED 0 $0 83 $234,906 135 $223,819 21 $75,217 0 $0 15 $144,207 1 $53,310 APPLICATIONS DENIED 3 $177,297 114 $238,545 294 $219,552 49 $94,980 1 $191,060 24 $142,990 5 $53,342 APPLICATIONS WITHDRAWN 2 $197,535 90 $282,405 217 $236,154 29 $134,381 0 $0 14 $178,754 0 $0 FILES CLOSED FOR INCOMPLETENESS 1 $320,540 21 $310,898 59 $245,518 10 $64,785 0 $0 5 $153,048 0 $0
Aggregated Statistics For Year 2003(Based on 5 partial tracts) A) FHA, FSA/RHS & VA B) Conventional C) Refinancings D) Home Improvement Loans F) Non-occupant Loans on Number Average Value Number Average Value Number Average Value Number Average Value Number Average Value
LOANS ORIGINATED 142 $185,604 1,134 $225,631 2,528 $216,913 40 $64,688 165 $138,705 APPLICATIONS APPROVED, NOT ACCEPTED 4 $195,318 86 $203,468 287 $204,906 21 $36,671 17 $115,131 APPLICATIONS DENIED 9 $176,242 80 $192,404 328 $203,126 36 $24,029 22 $143,422 APPLICATIONS WITHDRAWN 5 $164,438 129 $248,901 267 $208,457 14 $39,584 12 $121,723 FILES CLOSED FOR INCOMPLETENESS 2 $158,165 12 $234,733 77 $213,700 4 $44,650 4 $98,485
Aggregated Statistics For Year 2002(Based on 1 partial tract) A) FHA, FSA/RHS & VA B) Conventional C) Refinancings D) Home Improvement Loans F) Non-occupant Loans on Number Average Value Number Average Value Number Average Value Number Average Value Number Average Value
LOANS ORIGINATED 4 $194,802 37 $301,560 106 $225,319 2 $27,175 5 $263,656 APPLICATIONS APPROVED, NOT ACCEPTED 0 $0 2 $266,070 7 $168,639 0 $0 0 $0 APPLICATIONS DENIED 0 $0 3 $186,623 5 $262,214 0 $0 0 $0 APPLICATIONS WITHDRAWN 0 $0 3 $298,743 11 $231,520 1 $103,710 1 $163,330 FILES CLOSED FOR INCOMPLETENESS 0 $0 1 $265,380 2 $271,615 0 $0 0 $0
Aggregated Statistics For Year 2001(Based on 1 partial tract) A) FHA, FSA/RHS & VA B) Conventional C) Refinancings D) Home Improvement Loans F) Non-occupant Loans on Number Average Value Number Average Value Number Average Value Number Average Value Number Average Value
LOANS ORIGINATED 4 $181,285 44 $209,948 71 $199,297 5 $46,364 2 $93,035 APPLICATIONS APPROVED, NOT ACCEPTED 0 $0 4 $202,845 6 $168,182 3 $31,333 1 $60,450 APPLICATIONS DENIED 1 $109,530 2 $58,095 4 $105,235 1 $11,650 0 $0 APPLICATIONS WITHDRAWN 0 $0 4 $351,130 6 $175,670 1 $60,450 0 $0 FILES CLOSED FOR INCOMPLETENESS 0 $0 1 $225,440 2 $138,790 0 $0 0 $0
Aggregated Statistics For Year 2000(Based on 1 partial tract) A) FHA, FSA/RHS & VA B) Conventional C) Refinancings D) Home Improvement Loans F) Non-occupant Loans on Number Average Value Number Average Value Number Average Value Number Average Value Number Average Value
LOANS ORIGINATED 6 $154,087 48 $197,877 9 $142,286 5 $71,598 1 $63,220 APPLICATIONS APPROVED, NOT ACCEPTED 0 $0 3 $171,003 1 $187,730 1 $64,610 0 $0 APPLICATIONS DENIED 0 $0 2 $205,755 4 $141,352 2 $24,680 0 $0 APPLICATIONS WITHDRAWN 1 $173,310 2 $173,590 2 $55,185 0 $0 0 $0 FILES CLOSED FOR INCOMPLETENESS 0 $0 2 $194,110 1 $52,960 0 $0 0 $0
Aggregated Statistics For Year 1999(Based on 3 partial tracts) A) FHA, FSA/RHS & VA B) Conventional C) Refinancings D) Home Improvement Loans F) Non-occupant Loans on Number Average Value Number Average Value Number Average Value Number Average Value Number Average Value
LOANS ORIGINATED 117 $132,180 540 $169,751 233 $137,033 43 $20,692 30 $93,634 APPLICATIONS APPROVED, NOT ACCEPTED 1 $144,520 32 $164,070 25 $133,374 10 $26,964 6 $95,053 APPLICATIONS DENIED 9 $129,348 29 $159,691 55 $98,211 23 $20,961 4 $103,502 APPLICATIONS WITHDRAWN 13 $136,603 51 $190,111 46 $125,953 12 $80,183 5 $101,918 FILES CLOSED FOR INCOMPLETENESS 1 $130,560 9 $183,986 9 $121,844 1 $36,760 1 $75,780
Detailed HMDA statistics for the following Tracts:
6104.00
, 6105.01 , 6105.02 , 6106.01 , 6106.02
Private Mortgage Insurance Companies Aggregated Statistics For Year 2009(Based on 5 partial tracts) A) Conventional B) Refinancings C) Non-occupant Loans on Number Average Value Number Average Value Number Average Value
LOANS ORIGINATED 31 $293,278 10 $369,548 0 $0 APPLICATIONS APPROVED, NOT ACCEPTED 6 $305,122 4 $379,972 1 $102,810 APPLICATIONS DENIED 3 $243,877 3 $363,553 0 $0 APPLICATIONS WITHDRAWN 2 $340,750 2 $295,475 0 $0 FILES CLOSED FOR INCOMPLETENESS 1 $358,770 0 $0 0 $0
Aggregated Statistics For Year 2008(Based on 5 partial tracts) A) Conventional B) Refinancings C) Non-occupant Loans on Number Average Value Number Average Value Number Average Value
LOANS ORIGINATED 77 $293,782 15 $269,973 4 $240,700 APPLICATIONS APPROVED, NOT ACCEPTED 16 $277,404 14 $331,450 3 $220,660 APPLICATIONS DENIED 6 $290,637 3 $291,000 2 $170,730 APPLICATIONS WITHDRAWN 4 $408,218 2 $363,240 0 $0 FILES CLOSED FOR INCOMPLETENESS 3 $214,220 1 $244,360 0 $0
Aggregated Statistics For Year 2007(Based on 5 partial tracts) A) Conventional B) Refinancings C) Non-occupant Loans on Number Average Value Number Average Value Number Average Value
LOANS ORIGINATED 95 $316,735 21 $361,220 3 $228,617 APPLICATIONS APPROVED, NOT ACCEPTED 12 $291,722 10 $347,839 1 $152,850 APPLICATIONS DENIED 2 $268,880 0 $0 1 $192,130 APPLICATIONS WITHDRAWN 4 $354,468 3 $312,983 0 $0 FILES CLOSED FOR INCOMPLETENESS 0 $0 1 $351,180 0 $0
Aggregated Statistics For Year 2006(Based on 5 partial tracts) A) Conventional B) Refinancings C) Non-occupant Loans on Number Average Value Number Average Value Number Average Value
LOANS ORIGINATED 37 $337,932 14 $398,685 2 $262,815 APPLICATIONS APPROVED, NOT ACCEPTED 5 $288,132 4 $322,465 0 $0 APPLICATIONS DENIED 0 $0 1 $548,430 0 $0 APPLICATIONS WITHDRAWN 1 $524,620 2 $296,600 1 $94,280 FILES CLOSED FOR INCOMPLETENESS 0 $0 0 $0 0 $0
Aggregated Statistics For Year 2005(Based on 5 partial tracts) A) Conventional B) Refinancings C) Non-occupant Loans on D) Loans On Manufactured Number Average Value Number Average Value Number Average Value Number Average Value
LOANS ORIGINATED 67 $284,602 17 $319,262 17 $207,705 0 $0 APPLICATIONS APPROVED, NOT ACCEPTED 11 $282,135 7 $293,100 2 $349,500 1 $233,870 APPLICATIONS DENIED 2 $412,250 0 $0 1 $168,310 0 $0 APPLICATIONS WITHDRAWN 9 $310,936 1 $323,610 3 $244,140 0 $0 FILES CLOSED FOR INCOMPLETENESS 0 $0 1 $182,870 0 $0 0 $0
Aggregated Statistics For Year 2004(Based on 5 partial tracts) A) Conventional B) Refinancings C) Non-occupant Loans on Number Average Value Number Average Value Number Average Value
LOANS ORIGINATED 118 $252,172 33 $239,729 18 $186,192 APPLICATIONS APPROVED, NOT ACCEPTED 19 $218,201 11 $266,897 5 $106,520 APPLICATIONS DENIED 0 $0 0 $0 0 $0 APPLICATIONS WITHDRAWN 5 $291,324 6 $214,897 0 $0 FILES CLOSED FOR INCOMPLETENESS 1 $262,090 1 $171,310 0 $0
Aggregated Statistics For Year 2003(Based on 5 partial tracts) A) Conventional B) Refinancings C) Non-occupant Loans on Number Average Value Number Average Value Number Average Value
LOANS ORIGINATED 140 $234,019 104 $217,988 16 $188,595 APPLICATIONS APPROVED, NOT ACCEPTED 20 $233,309 37 $252,685 1 $107,740 APPLICATIONS DENIED 5 $321,116 3 $188,273 3 $172,470 APPLICATIONS WITHDRAWN 18 $205,727 9 $188,311 5 $140,620 FILES CLOSED FOR INCOMPLETENESS 1 $248,380 1 $211,280 1 $85,520
Aggregated Statistics For Year 2002(Based on 1 partial tract) A) Conventional B) Refinancings Number Average Value Number Average Value
LOANS ORIGINATED 4 $257,335 4 $267,110 APPLICATIONS APPROVED, NOT ACCEPTED 0 $0 1 $207,700 APPLICATIONS DENIED 0 $0 0 $0 APPLICATIONS WITHDRAWN 0 $0 0 $0 FILES CLOSED FOR INCOMPLETENESS 0 $0 0 $0
Aggregated Statistics For Year 2001(Based on 1 partial tract) A) Conventional B) Refinancings Number Average Value Number Average Value
LOANS ORIGINATED 5 $242,638 2 $215,185 APPLICATIONS APPROVED, NOT ACCEPTED 0 $0 1 $85,960 APPLICATIONS DENIED 0 $0 0 $0 APPLICATIONS WITHDRAWN 0 $0 0 $0 FILES CLOSED FOR INCOMPLETENESS 0 $0 0 $0
Aggregated Statistics For Year 2000(Based on 1 partial tract) A) Conventional B) Refinancings Number Average Value Number Average Value
LOANS ORIGINATED 5 $207,698 2 $168,180 APPLICATIONS APPROVED, NOT ACCEPTED 2 $207,005 0 $0 APPLICATIONS DENIED 0 $0 1 $216,850 APPLICATIONS WITHDRAWN 0 $0 0 $0 FILES CLOSED FOR INCOMPLETENESS 0 $0 0 $0
Aggregated Statistics For Year 1999(Based on 3 partial tracts) A) Conventional B) Refinancings C) Non-occupant Loans on Number Average Value Number Average Value Number Average Value
LOANS ORIGINATED 96 $192,773 41 $167,657 2 $147,905 APPLICATIONS APPROVED, NOT ACCEPTED 9 $234,664 10 $199,375 0 $0 APPLICATIONS DENIED 5 $205,682 3 $159,477 0 $0 APPLICATIONS WITHDRAWN 3 $216,400 2 $169,050 0 $0 FILES CLOSED FOR INCOMPLETENESS 2 $109,065 1 $75,680 0 $0
Detailed PMIC statistics for the following Tracts:
6104.00
, 6105.01 , 6105.02 , 6106.01 , 6106.02 Fire-safe hotels and motels in Leesburg, Virginia:
Best Western Leesburg Hotel & Conference Center, 726 E Market St, Leesburg, Virginia 20176 Phone: (703) 777-9400, Fax: (703) 777-5537
Clarion Inn Leesburg, 1500 E Market St, Leesburg, Virginia 27176 Phone: (703) 771-9200, Fax: (703) 771-1575
The National Conference Center, 18980 Uppr Belmont Pl, Leesburg, Virginia 20176 Phone: (703) 729-8000, Fax: (703) 729-5382
Norris House Inn, 108 Loudoun St SW, Leesburg, Virginia 20175 Phone: (703) 777-1806
Comfort Suites, 80 Prosperity Ave, Leesburg, Virginia 20175 Phone: (703) 669-1650, Fax: (703) 669-0687
Homewood Suites By Hilton, Leesburg, 115 Ft Evans Rd NE, Leesburg, Virginia 20176 Phone: (571) 258-1068, Fax: (571) 258-1031
Days Inn Leesburg, 721 E Market St, Leesburg, Virginia 20176 Phone: (703) 777-6622, Fax: (703) 777-4119
Clarion Inn Leesburg, 1500 E Market St, Leesburg, Virginia 20176 Phone: (703) 771-9200, Fax: (703) 771-1575
All 8 fire-safe hotels and motels in Leesburg, Virginia
Most common first names in Leesburg, VA among deceased individuals Name Count Lived (average)
Mary 66 81.8 years John 63 76.1 years Robert 59 73.5 years William 50 76.5 years James 50 75.9 years Charles 35 77.7 years Margaret 33 84.4 years Helen 30 84.3 years Frances 27 84.4 years Richard 26 76.1 years
Most common last names in Leesburg, VA among deceased individuals Last name Count Lived (average)
Brown 19 80.1 years Jones 14 74.7 years Frye 14 78.9 years Smith 14 73.1 years Miller 13 73.4 years Williams 13 79.6 years Carter 12 72.7 years Thompson 12 72.3 years Johnson 11 73.5 years Jackson 10 77.2 years
Leesburg compared to Virginia state average:
Median household income above state average. Median house value above state average. Unemployed percentage significantly below state average. Hispanic race population percentage above state average. Foreign-born population percentage significantly above state average. Length of stay since moving in significantly above state average. House age below state average. Percentage of population with a bachelor's degree or higher above state average.
#89 on the list of "Top 101 cities with the most residents born in Afghanistan (population 500+)"
#90 on the list of "Top 100 cities with highest median household income and median resident age less than 35"
#4 on the list of "Top 101 counties with the largest number of children under 18 without health insurance coverage in 2000 (pop. 50,000+)"
#13 on the list of "Top 101 counties with the largest decrease in the number of births per 1000 residents 2000-2006 to 2007-2013 (pop 50,000+)"
#24 on the list of "Top 101 counties with the lowest number of deaths per 1000 residents 2007-2013"
#25 on the list of "Top 101 counties with the largest number of people without health insurance coverage in 2000 (pop. 50,000+)"
#32 on the list of "Top 101 counties with the highest percentage of residents relocating to foreign countries in 2011 (pop. 50,000+)"
Top Patent Applicants
Shumeet Baluja (43)
Scott Lightner (33)
Robert Dunham Short, Iii (30)
Joel Halpern (28)
Robert C. Lovell, Jr. (23)
James Gould (18)
Andrew T.s. Pomerene (17)
Rudolf O. Ernst (16)
Allison Beach (16)
Kevin R. Strauss (14)
Total of 1101 patent applications in 2008-2024.

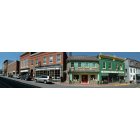
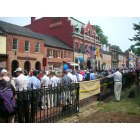


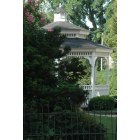
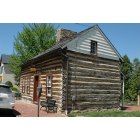


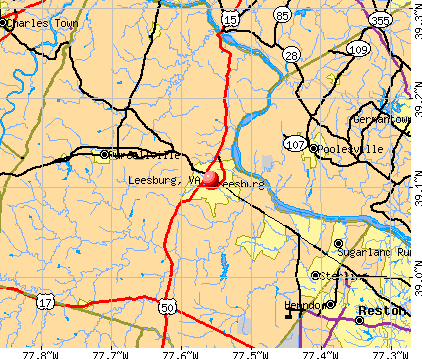


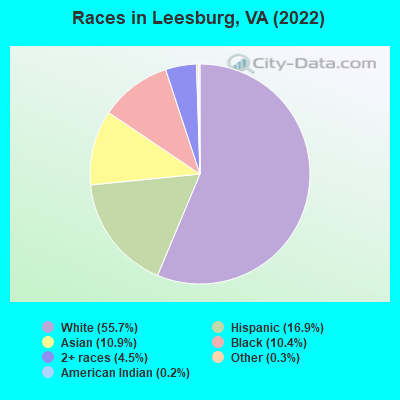
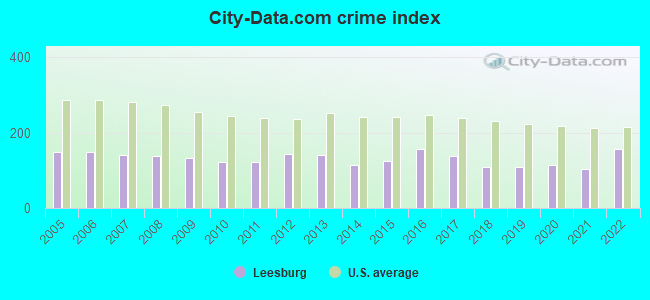
 Recent articles from our blog. Our writers, many of them Ph.D. graduates or candidates, create easy-to-read articles on a wide variety of topics.

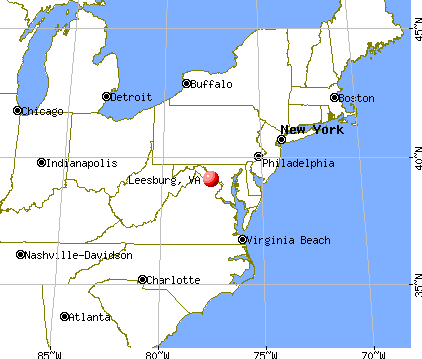
 (15.6 miles
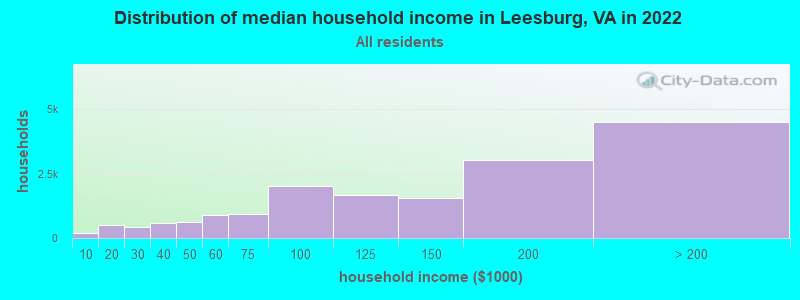
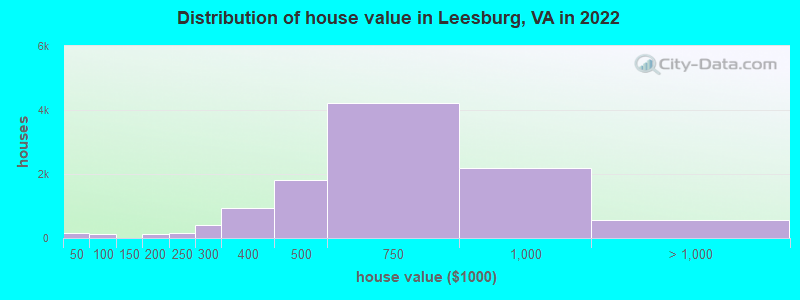
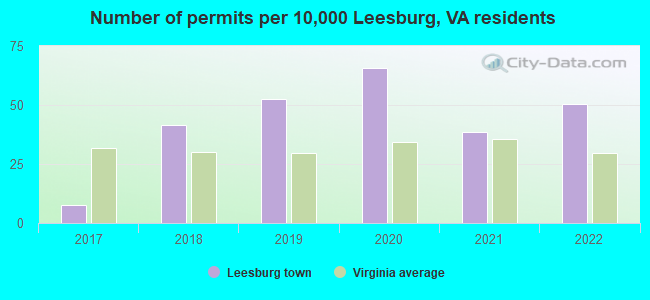
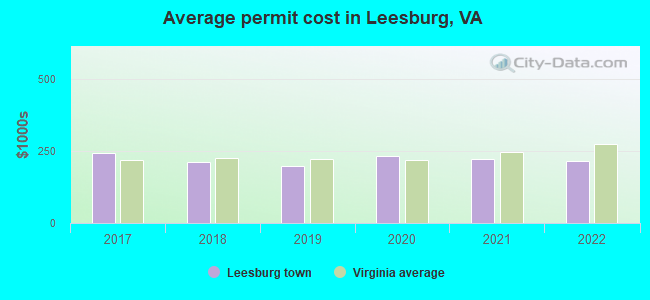
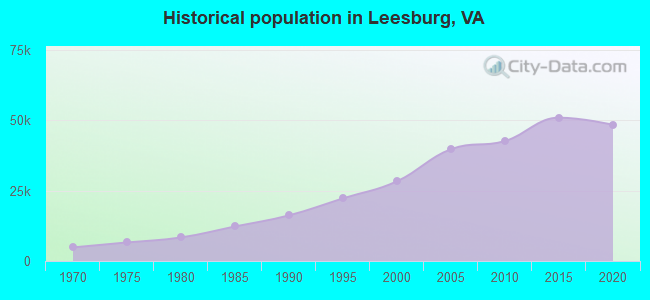
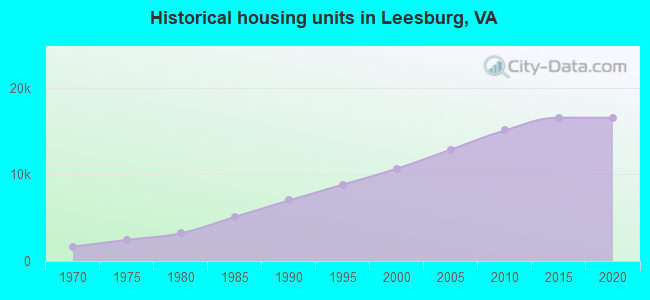
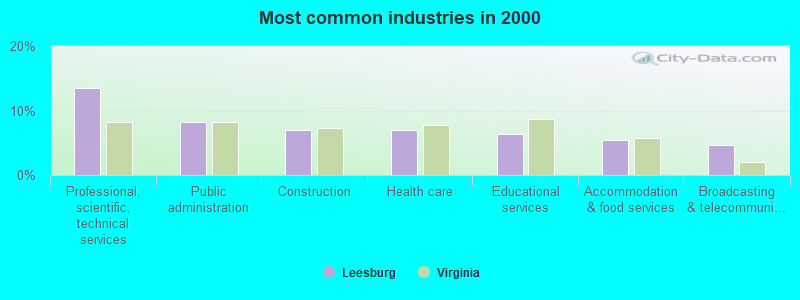
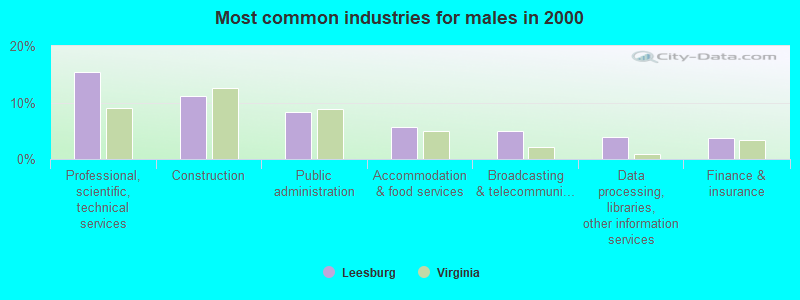
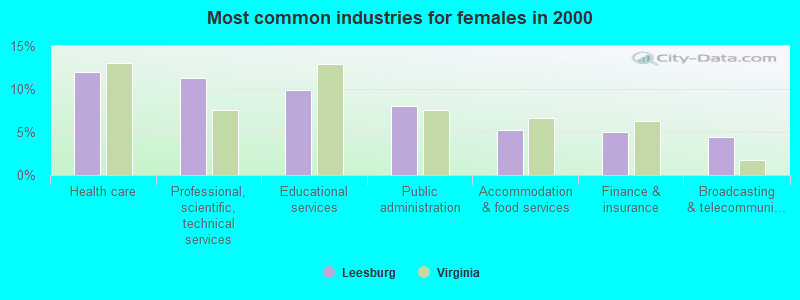
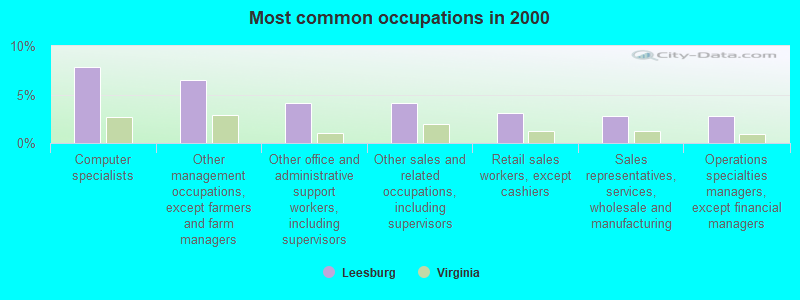
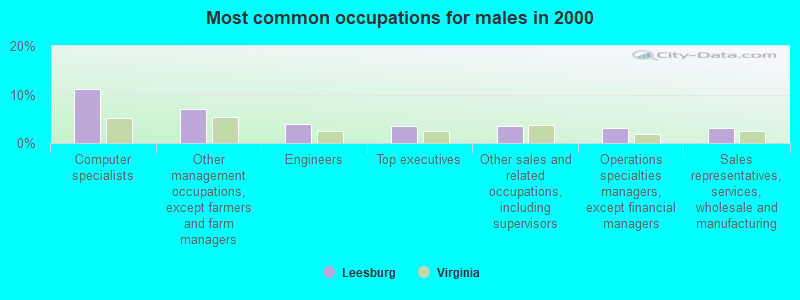
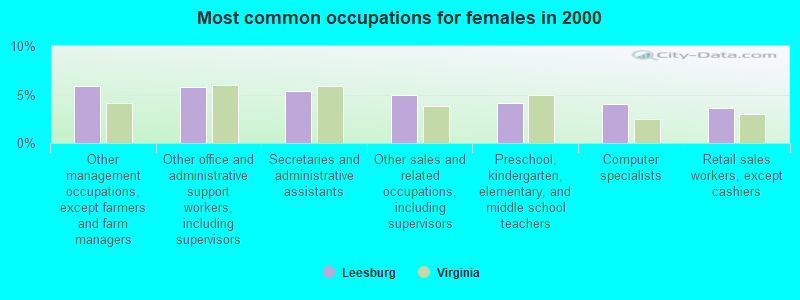
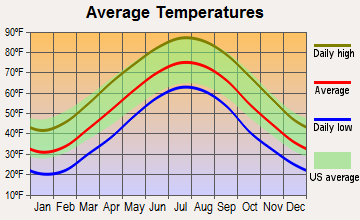
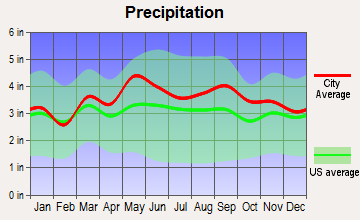
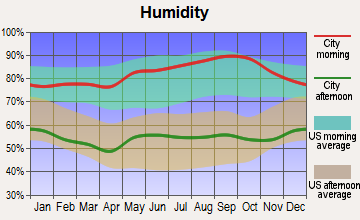
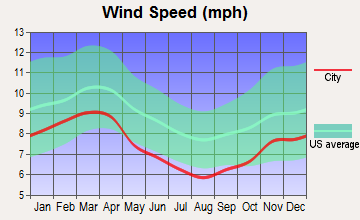
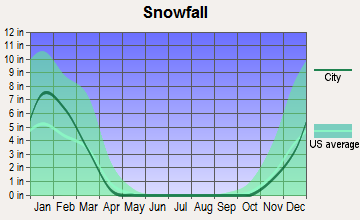
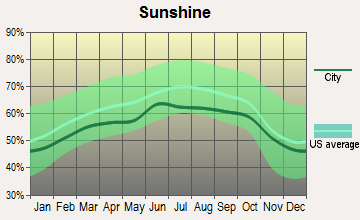
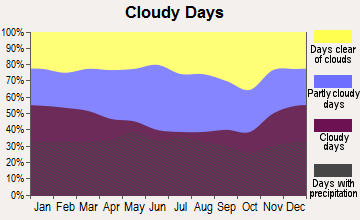
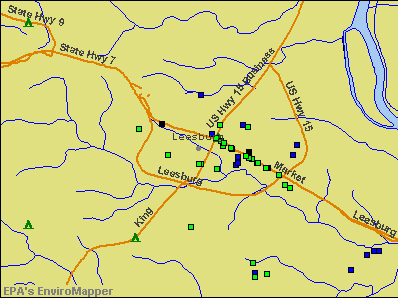

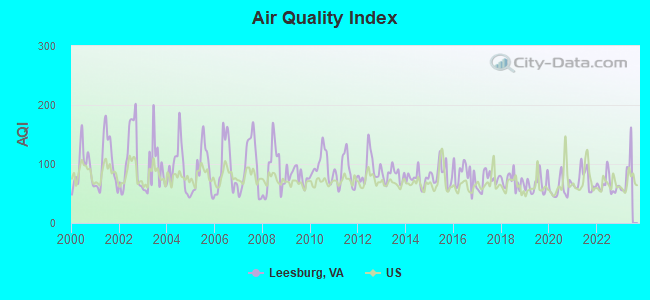
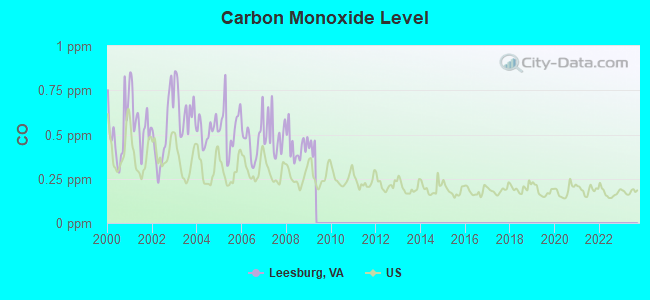
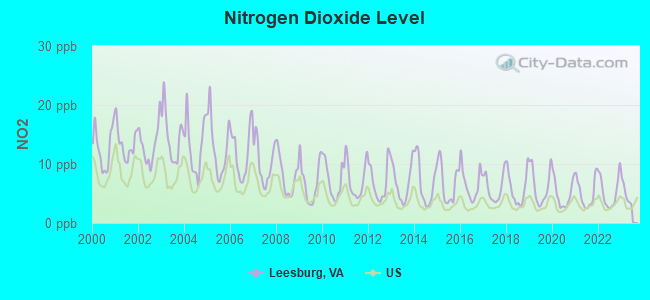
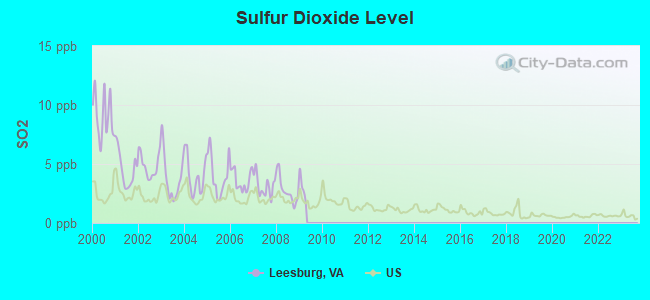
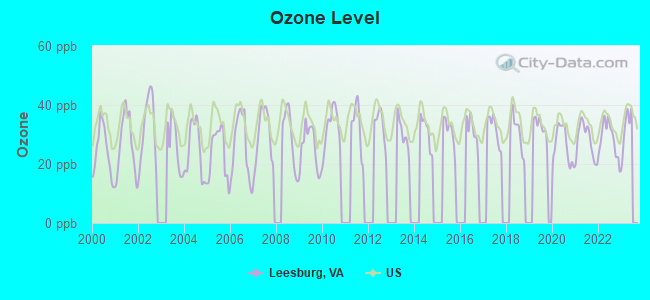
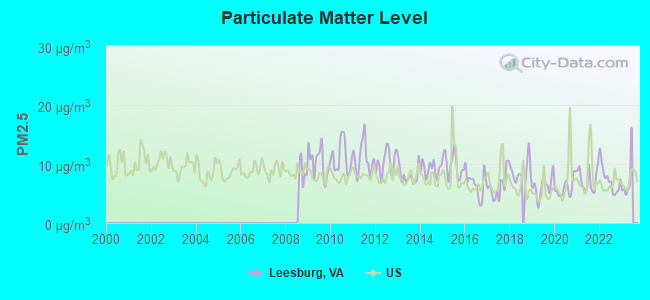
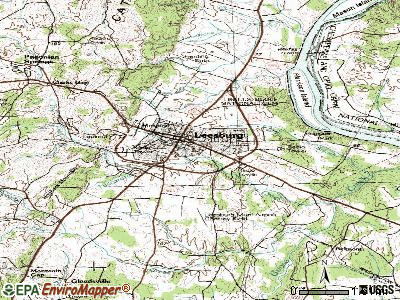
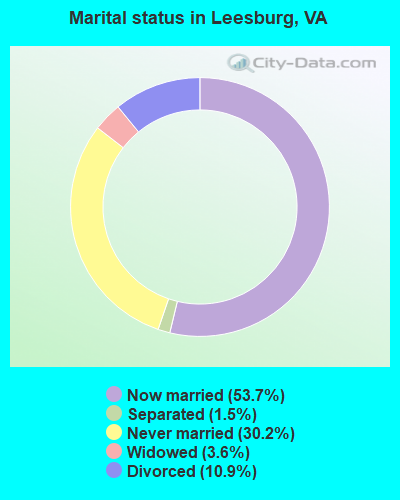
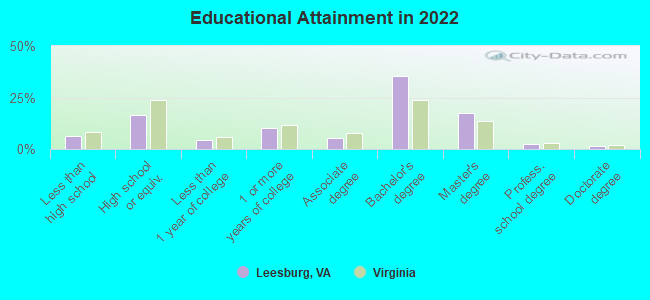
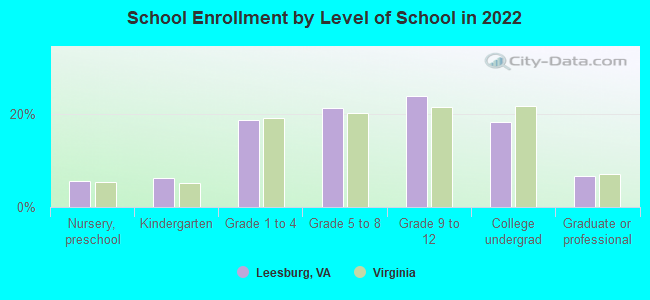
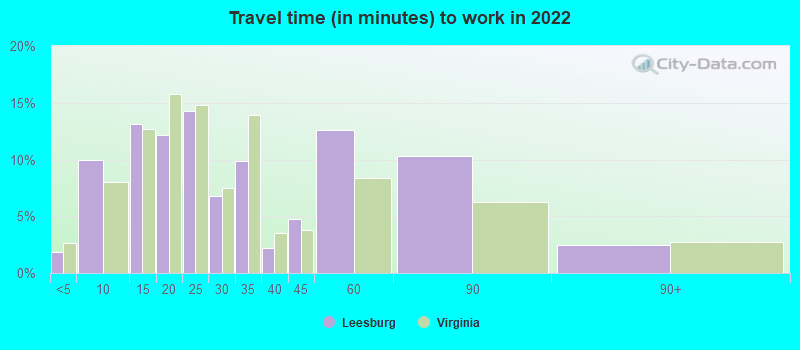
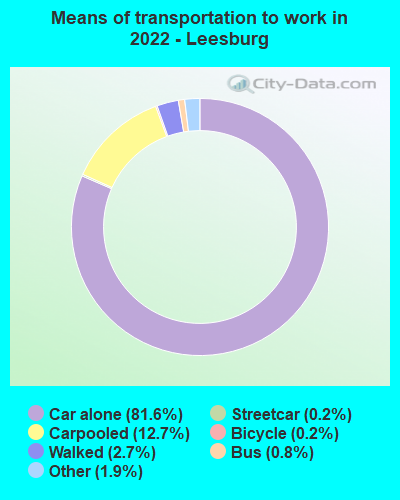
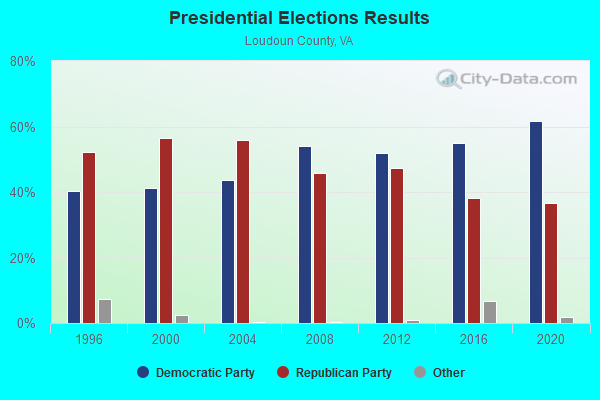
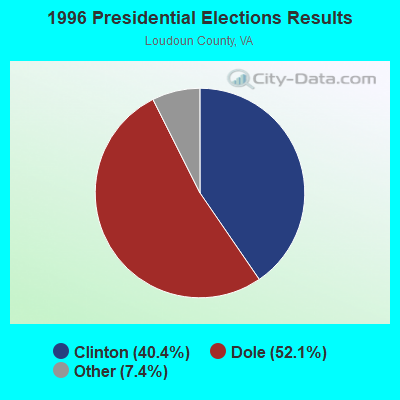
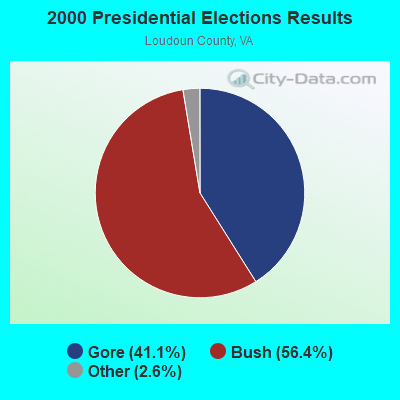
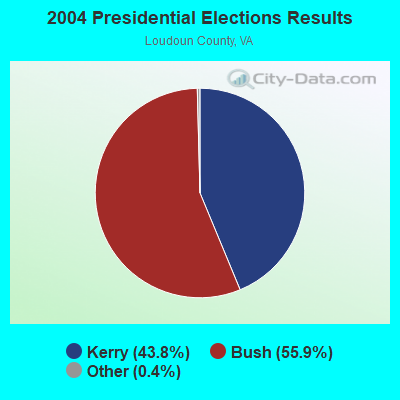
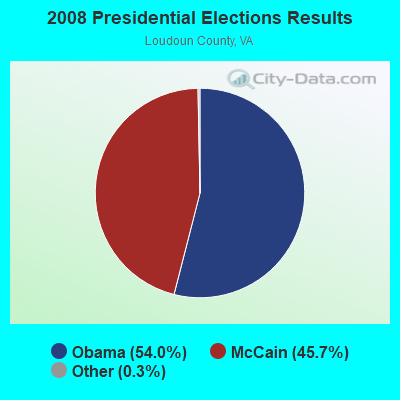
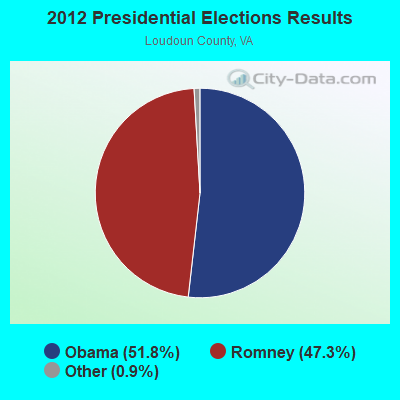
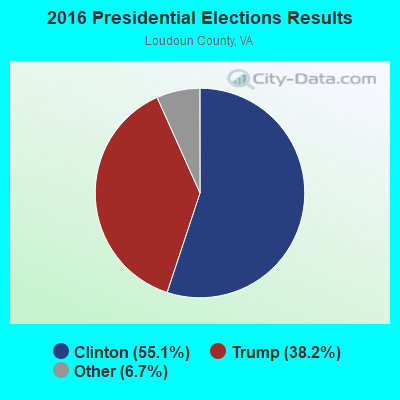
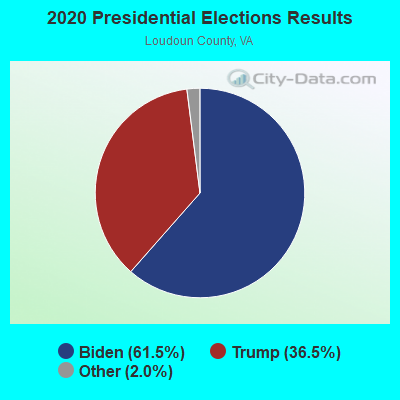
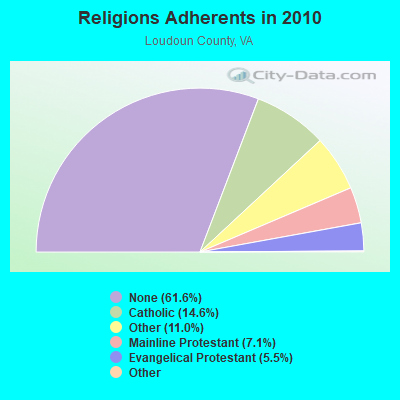
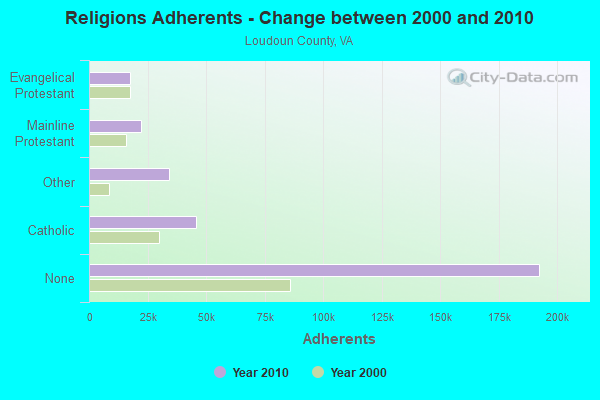
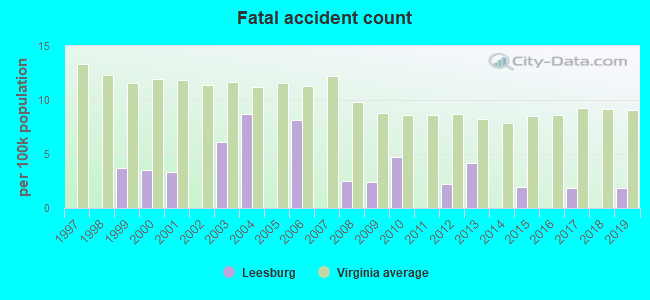
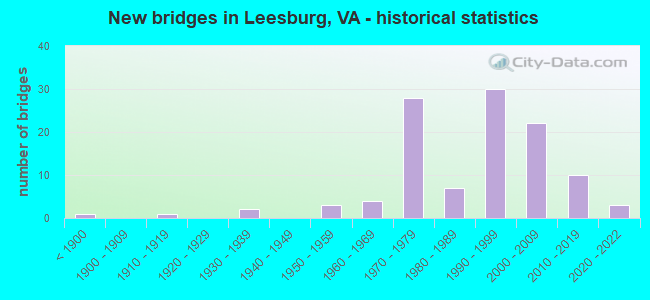
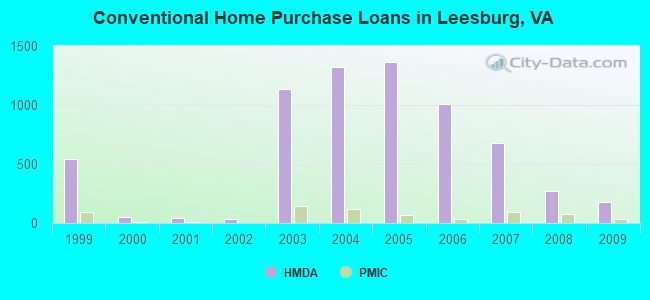
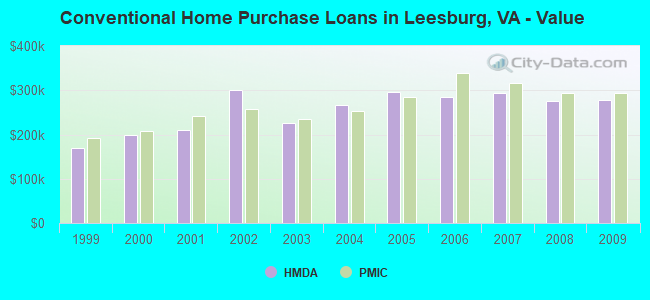
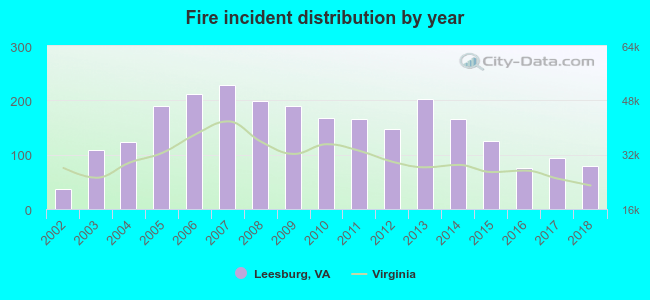 According to the data from the years 2002 - 2018 the average number of fire incidents per year is 148. The highest number of fire incidents - 229 took place in 2007, and the least - 36 in 2002. The data has a growing trend.
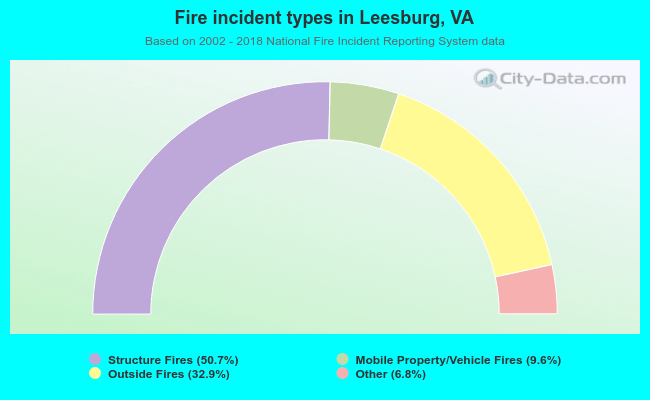 When looking into fire subcategories, the most incidents belonged to: Structure Fires (50.7%), and Outside Fires (32.9%).