Leominster, Massachusetts Submit your own pictures of this city and show them to the world
OSM Map
General Map
Google Map
MSN Map
OSM Map
General Map
Google Map
MSN Map
OSM Map
General Map
Google Map
MSN Map
OSM Map
General Map
Google Map
MSN Map
Please wait while loading the map...
Population in 2022: 43,646 (98% urban, 2% rural). Population change since 2000: +5.7%Males: 22,250 Females: 21,396
March 2022 cost of living index in Leominster: 127.0 (high, U.S. average is 100) Percentage of residents living in poverty in 2022: 9.1%for White Non-Hispanic residents , 8.4% for Black residents , 13.0% for Hispanic or Latino residents , 20.1% for other race residents , 6.1% for two or more races residents )
Profiles of local businesses
Business Search - 14 Million verified businesses
Data:
Median household income ($)
Median household income (% change since 2000)
Household income diversity
Ratio of average income to average house value (%)
Ratio of average income to average rent
Median household income ($) - White
Median household income ($) - Black or African American
Median household income ($) - Asian
Median household income ($) - Hispanic or Latino
Median household income ($) - American Indian and Alaska Native
Median household income ($) - Multirace
Median household income ($) - Other Race
Median household income for houses/condos with a mortgage ($)
Median household income for apartments without a mortgage ($)
Races - White alone (%)
Races - White alone (% change since 2000)
Races - Black alone (%)
Races - Black alone (% change since 2000)
Races - American Indian alone (%)
Races - American Indian alone (% change since 2000)
Races - Asian alone (%)
Races - Asian alone (% change since 2000)
Races - Hispanic (%)
Races - Hispanic (% change since 2000)
Races - Native Hawaiian and Other Pacific Islander alone (%)
Races - Native Hawaiian and Other Pacific Islander alone (% change since 2000)
Races - Two or more races (%)
Races - Two or more races (% change since 2000)
Races - Other race alone (%)
Races - Other race alone (% change since 2000)
Racial diversity
Unemployment (%)
Unemployment (% change since 2000)
Unemployment (%) - White
Unemployment (%) - Black or African American
Unemployment (%) - Asian
Unemployment (%) - Hispanic or Latino
Unemployment (%) - American Indian and Alaska Native
Unemployment (%) - Multirace
Unemployment (%) - Other Race
Population density (people per square mile)
Population - Males (%)
Population - Females (%)
Population - Males (%) - White
Population - Males (%) - Black or African American
Population - Males (%) - Asian
Population - Males (%) - Hispanic or Latino
Population - Males (%) - American Indian and Alaska Native
Population - Males (%) - Multirace
Population - Males (%) - Other Race
Population - Females (%) - White
Population - Females (%) - Black or African American
Population - Females (%) - Asian
Population - Females (%) - Hispanic or Latino
Population - Females (%) - American Indian and Alaska Native
Population - Females (%) - Multirace
Population - Females (%) - Other Race
Coronavirus confirmed cases (Apr 27, 2024)
Deaths caused by coronavirus (Apr 27, 2024)
Coronavirus confirmed cases (per 100k population) (Apr 27, 2024)
Deaths caused by coronavirus (per 100k population) (Apr 27, 2024)
Daily increase in number of cases (Apr 27, 2024)
Weekly increase in number of cases (Apr 27, 2024)
Cases doubled (in days) (Apr 27, 2024)
Hospitalized patients (Apr 18, 2022)
Negative test results (Apr 18, 2022)
Total test results (Apr 18, 2022)
COVID Vaccine doses distributed (per 100k population) (Sep 19, 2023)
COVID Vaccine doses administered (per 100k population) (Sep 19, 2023)
COVID Vaccine doses distributed (Sep 19, 2023)
COVID Vaccine doses administered (Sep 19, 2023)
Likely homosexual households (%)
Likely homosexual households (% change since 2000)
Likely homosexual households - Lesbian couples (%)
Likely homosexual households - Lesbian couples (% change since 2000)
Likely homosexual households - Gay men (%)
Likely homosexual households - Gay men (% change since 2000)
Cost of living index
Median gross rent ($)
Median contract rent ($)
Median monthly housing costs ($)
Median house or condo value ($)
Median house or condo value ($ change since 2000)
Mean house or condo value by units in structure - 1, detached ($)
Mean house or condo value by units in structure - 1, attached ($)
Mean house or condo value by units in structure - 2 ($)
Mean house or condo value by units in structure by units in structure - 3 or 4 ($)
Mean house or condo value by units in structure - 5 or more ($)
Mean house or condo value by units in structure - Boat, RV, van, etc. ($)
Mean house or condo value by units in structure - Mobile home ($)
Median house or condo value ($) - White
Median house or condo value ($) - Black or African American
Median house or condo value ($) - Asian
Median house or condo value ($) - Hispanic or Latino
Median house or condo value ($) - American Indian and Alaska Native
Median house or condo value ($) - Multirace
Median house or condo value ($) - Other Race
Median resident age
Resident age diversity
Median resident age - Males
Median resident age - Females
Median resident age - White
Median resident age - Black or African American
Median resident age - Asian
Median resident age - Hispanic or Latino
Median resident age - American Indian and Alaska Native
Median resident age - Multirace
Median resident age - Other Race
Median resident age - Males - White
Median resident age - Males - Black or African American
Median resident age - Males - Asian
Median resident age - Males - Hispanic or Latino
Median resident age - Males - American Indian and Alaska Native
Median resident age - Males - Multirace
Median resident age - Males - Other Race
Median resident age - Females - White
Median resident age - Females - Black or African American
Median resident age - Females - Asian
Median resident age - Females - Hispanic or Latino
Median resident age - Females - American Indian and Alaska Native
Median resident age - Females - Multirace
Median resident age - Females - Other Race
Commute - mean travel time to work (minutes)
Travel time to work - Less than 5 minutes (%)
Travel time to work - Less than 5 minutes (% change since 2000)
Travel time to work - 5 to 9 minutes (%)
Travel time to work - 5 to 9 minutes (% change since 2000)
Travel time to work - 10 to 19 minutes (%)
Travel time to work - 10 to 19 minutes (% change since 2000)
Travel time to work - 20 to 29 minutes (%)
Travel time to work - 20 to 29 minutes (% change since 2000)
Travel time to work - 30 to 39 minutes (%)
Travel time to work - 30 to 39 minutes (% change since 2000)
Travel time to work - 40 to 59 minutes (%)
Travel time to work - 40 to 59 minutes (% change since 2000)
Travel time to work - 60 to 89 minutes (%)
Travel time to work - 60 to 89 minutes (% change since 2000)
Travel time to work - 90 or more minutes (%)
Travel time to work - 90 or more minutes (% change since 2000)
Marital status - Never married (%)
Marital status - Now married (%)
Marital status - Separated (%)
Marital status - Widowed (%)
Marital status - Divorced (%)
Median family income ($)
Median family income (% change since 2000)
Median non-family income ($)
Median non-family income (% change since 2000)
Median per capita income ($)
Median per capita income (% change since 2000)
Median family income ($) - White
Median family income ($) - Black or African American
Median family income ($) - Asian
Median family income ($) - Hispanic or Latino
Median family income ($) - American Indian and Alaska Native
Median family income ($) - Multirace
Median family income ($) - Other Race
Median year house/condo built
Median year apartment built
Year house built - Built 2005 or later (%)
Year house built - Built 2000 to 2004 (%)
Year house built - Built 1990 to 1999 (%)
Year house built - Built 1980 to 1989 (%)
Year house built - Built 1970 to 1979 (%)
Year house built - Built 1960 to 1969 (%)
Year house built - Built 1950 to 1959 (%)
Year house built - Built 1940 to 1949 (%)
Year house built - Built 1939 or earlier (%)
Average household size
Household density (households per square mile)
Average household size - White
Average household size - Black or African American
Average household size - Asian
Average household size - Hispanic or Latino
Average household size - American Indian and Alaska Native
Average household size - Multirace
Average household size - Other Race
Occupied housing units (%)
Vacant housing units (%)
Owner occupied housing units (%)
Renter occupied housing units (%)
Vacancy status - For rent (%)
Vacancy status - For sale only (%)
Vacancy status - Rented or sold, not occupied (%)
Vacancy status - For seasonal, recreational, or occasional use (%)
Vacancy status - For migrant workers (%)
Vacancy status - Other vacant (%)
Residents with income below the poverty level (%)
Residents with income below 50% of the poverty level (%)
Children below poverty level (%)
Poor families by family type - Married-couple family (%)
Poor families by family type - Male, no wife present (%)
Poor families by family type - Female, no husband present (%)
Poverty status for native-born residents (%)
Poverty status for foreign-born residents (%)
Poverty among high school graduates not in families (%)
Poverty among people who did not graduate high school not in families (%)
Residents with income below the poverty level (%) - White
Residents with income below the poverty level (%) - Black or African American
Residents with income below the poverty level (%) - Asian
Residents with income below the poverty level (%) - Hispanic or Latino
Residents with income below the poverty level (%) - American Indian and Alaska Native
Residents with income below the poverty level (%) - Multirace
Residents with income below the poverty level (%) - Other Race
Air pollution - Air Quality Index (AQI)
Air pollution - CO
Air pollution - NO2
Air pollution - SO2
Air pollution - Ozone
Air pollution - PM10
Air pollution - PM25
Air pollution - Pb
Crime - Murders per 100,000 population
Crime - Rapes per 100,000 population
Crime - Robberies per 100,000 population
Crime - Assaults per 100,000 population
Crime - Burglaries per 100,000 population
Crime - Thefts per 100,000 population
Crime - Auto thefts per 100,000 population
Crime - Arson per 100,000 population
Crime - City-data.com crime index
Crime - Violent crime index
Crime - Property crime index
Crime - Murders per 100,000 population (5 year average)
Crime - Rapes per 100,000 population (5 year average)
Crime - Robberies per 100,000 population (5 year average)
Crime - Assaults per 100,000 population (5 year average)
Crime - Burglaries per 100,000 population (5 year average)
Crime - Thefts per 100,000 population (5 year average)
Crime - Auto thefts per 100,000 population (5 year average)
Crime - Arson per 100,000 population (5 year average)
Crime - City-data.com crime index (5 year average)
Crime - Violent crime index (5 year average)
Crime - Property crime index (5 year average)
1996 Presidential Elections Results (%) - Democratic Party (Clinton)
1996 Presidential Elections Results (%) - Republican Party (Dole)
1996 Presidential Elections Results (%) - Other
2000 Presidential Elections Results (%) - Democratic Party (Gore)
2000 Presidential Elections Results (%) - Republican Party (Bush)
2000 Presidential Elections Results (%) - Other
2004 Presidential Elections Results (%) - Democratic Party (Kerry)
2004 Presidential Elections Results (%) - Republican Party (Bush)
2004 Presidential Elections Results (%) - Other
2008 Presidential Elections Results (%) - Democratic Party (Obama)
2008 Presidential Elections Results (%) - Republican Party (McCain)
2008 Presidential Elections Results (%) - Other
2012 Presidential Elections Results (%) - Democratic Party (Obama)
2012 Presidential Elections Results (%) - Republican Party (Romney)
2012 Presidential Elections Results (%) - Other
2016 Presidential Elections Results (%) - Democratic Party (Clinton)
2016 Presidential Elections Results (%) - Republican Party (Trump)
2016 Presidential Elections Results (%) - Other
2020 Presidential Elections Results (%) - Democratic Party (Biden)
2020 Presidential Elections Results (%) - Republican Party (Trump)
2020 Presidential Elections Results (%) - Other
Ancestries Reported - Arab (%)
Ancestries Reported - Czech (%)
Ancestries Reported - Danish (%)
Ancestries Reported - Dutch (%)
Ancestries Reported - English (%)
Ancestries Reported - French (%)
Ancestries Reported - French Canadian (%)
Ancestries Reported - German (%)
Ancestries Reported - Greek (%)
Ancestries Reported - Hungarian (%)
Ancestries Reported - Irish (%)
Ancestries Reported - Italian (%)
Ancestries Reported - Lithuanian (%)
Ancestries Reported - Norwegian (%)
Ancestries Reported - Polish (%)
Ancestries Reported - Portuguese (%)
Ancestries Reported - Russian (%)
Ancestries Reported - Scotch-Irish (%)
Ancestries Reported - Scottish (%)
Ancestries Reported - Slovak (%)
Ancestries Reported - Subsaharan African (%)
Ancestries Reported - Swedish (%)
Ancestries Reported - Swiss (%)
Ancestries Reported - Ukrainian (%)
Ancestries Reported - United States (%)
Ancestries Reported - Welsh (%)
Ancestries Reported - West Indian (%)
Ancestries Reported - Other (%)
Educational Attainment - No schooling completed (%)
Educational Attainment - Less than high school (%)
Educational Attainment - High school or equivalent (%)
Educational Attainment - Less than 1 year of college (%)
Educational Attainment - 1 or more years of college (%)
Educational Attainment - Associate degree (%)
Educational Attainment - Bachelor's degree (%)
Educational Attainment - Master's degree (%)
Educational Attainment - Professional school degree (%)
Educational Attainment - Doctorate degree (%)
School Enrollment - Nursery, preschool (%)
School Enrollment - Kindergarten (%)
School Enrollment - Grade 1 to 4 (%)
School Enrollment - Grade 5 to 8 (%)
School Enrollment - Grade 9 to 12 (%)
School Enrollment - College undergrad (%)
School Enrollment - Graduate or professional (%)
School Enrollment - Not enrolled in school (%)
School enrollment - Public schools (%)
School enrollment - Private schools (%)
School enrollment - Not enrolled (%)
Median number of rooms in houses and condos
Median number of rooms in apartments
Housing units lacking complete plumbing facilities (%)
Housing units lacking complete kitchen facilities (%)
Density of houses
Urban houses (%)
Rural houses (%)
Households with people 60 years and over (%)
Households with people 65 years and over (%)
Households with people 75 years and over (%)
Households with one or more nonrelatives (%)
Households with no nonrelatives (%)
Population in households (%)
Family households (%)
Nonfamily households (%)
Population in families (%)
Family households with own children (%)
Median number of bedrooms in owner occupied houses
Mean number of bedrooms in owner occupied houses
Median number of bedrooms in renter occupied houses
Mean number of bedrooms in renter occupied houses
Median number of vehichles in owner occupied houses
Mean number of vehichles in owner occupied houses
Median number of vehichles in renter occupied houses
Mean number of vehichles in renter occupied houses
Mortgage status - with mortgage (%)
Mortgage status - with second mortgage (%)
Mortgage status - with home equity loan (%)
Mortgage status - with both second mortgage and home equity loan (%)
Mortgage status - without a mortgage (%)
Average family size
Average family size - White
Average family size - Black or African American
Average family size - Asian
Average family size - Hispanic or Latino
Average family size - American Indian and Alaska Native
Average family size - Multirace
Average family size - Other Race
Geographical mobility - Same house 1 year ago (%)
Geographical mobility - Moved within same county (%)
Geographical mobility - Moved from different county within same state (%)
Geographical mobility - Moved from different state (%)
Geographical mobility - Moved from abroad (%)
Place of birth - Born in state of residence (%)
Place of birth - Born in other state (%)
Place of birth - Native, outside of US (%)
Place of birth - Foreign born (%)
Housing units in structures - 1, detached (%)
Housing units in structures - 1, attached (%)
Housing units in structures - 2 (%)
Housing units in structures - 3 or 4 (%)
Housing units in structures - 5 to 9 (%)
Housing units in structures - 10 to 19 (%)
Housing units in structures - 20 to 49 (%)
Housing units in structures - 50 or more (%)
Housing units in structures - Mobile home (%)
Housing units in structures - Boat, RV, van, etc. (%)
House/condo owner moved in on average (years ago)
Renter moved in on average (years ago)
Year householder moved into unit - Moved in 1999 to March 2000 (%)
Year householder moved into unit - Moved in 1995 to 1998 (%)
Year householder moved into unit - Moved in 1990 to 1994 (%)
Year householder moved into unit - Moved in 1980 to 1989 (%)
Year householder moved into unit - Moved in 1970 to 1979 (%)
Year householder moved into unit - Moved in 1969 or earlier (%)
Means of transportation to work - Drove car alone (%)
Means of transportation to work - Carpooled (%)
Means of transportation to work - Public transportation (%)
Means of transportation to work - Bus or trolley bus (%)
Means of transportation to work - Streetcar or trolley car (%)
Means of transportation to work - Subway or elevated (%)
Means of transportation to work - Railroad (%)
Means of transportation to work - Ferryboat (%)
Means of transportation to work - Taxicab (%)
Means of transportation to work - Motorcycle (%)
Means of transportation to work - Bicycle (%)
Means of transportation to work - Walked (%)
Means of transportation to work - Other means (%)
Working at home (%)
Industry diversity
Most Common Industries - Agriculture, forestry, fishing and hunting, and mining (%)
Most Common Industries - Agriculture, forestry, fishing and hunting (%)
Most Common Industries - Mining, quarrying, and oil and gas extraction (%)
Most Common Industries - Construction (%)
Most Common Industries - Manufacturing (%)
Most Common Industries - Wholesale trade (%)
Most Common Industries - Retail trade (%)
Most Common Industries - Transportation and warehousing, and utilities (%)
Most Common Industries - Transportation and warehousing (%)
Most Common Industries - Utilities (%)
Most Common Industries - Information (%)
Most Common Industries - Finance and insurance, and real estate and rental and leasing (%)
Most Common Industries - Finance and insurance (%)
Most Common Industries - Real estate and rental and leasing (%)
Most Common Industries - Professional, scientific, and management, and administrative and waste management services (%)
Most Common Industries - Professional, scientific, and technical services (%)
Most Common Industries - Management of companies and enterprises (%)
Most Common Industries - Administrative and support and waste management services (%)
Most Common Industries - Educational services, and health care and social assistance (%)
Most Common Industries - Educational services (%)
Most Common Industries - Health care and social assistance (%)
Most Common Industries - Arts, entertainment, and recreation, and accommodation and food services (%)
Most Common Industries - Arts, entertainment, and recreation (%)
Most Common Industries - Accommodation and food services (%)
Most Common Industries - Other services, except public administration (%)
Most Common Industries - Public administration (%)
Occupation diversity
Most Common Occupations - Management, business, science, and arts occupations (%)
Most Common Occupations - Management, business, and financial occupations (%)
Most Common Occupations - Management occupations (%)
Most Common Occupations - Business and financial operations occupations (%)
Most Common Occupations - Computer, engineering, and science occupations (%)
Most Common Occupations - Computer and mathematical occupations (%)
Most Common Occupations - Architecture and engineering occupations (%)
Most Common Occupations - Life, physical, and social science occupations (%)
Most Common Occupations - Education, legal, community service, arts, and media occupations (%)
Most Common Occupations - Community and social service occupations (%)
Most Common Occupations - Legal occupations (%)
Most Common Occupations - Education, training, and library occupations (%)
Most Common Occupations - Arts, design, entertainment, sports, and media occupations (%)
Most Common Occupations - Healthcare practitioners and technical occupations (%)
Most Common Occupations - Health diagnosing and treating practitioners and other technical occupations (%)
Most Common Occupations - Health technologists and technicians (%)
Most Common Occupations - Service occupations (%)
Most Common Occupations - Healthcare support occupations (%)
Most Common Occupations - Protective service occupations (%)
Most Common Occupations - Fire fighting and prevention, and other protective service workers including supervisors (%)
Most Common Occupations - Law enforcement workers including supervisors (%)
Most Common Occupations - Food preparation and serving related occupations (%)
Most Common Occupations - Building and grounds cleaning and maintenance occupations (%)
Most Common Occupations - Personal care and service occupations (%)
Most Common Occupations - Sales and office occupations (%)
Most Common Occupations - Sales and related occupations (%)
Most Common Occupations - Office and administrative support occupations (%)
Most Common Occupations - Natural resources, construction, and maintenance occupations (%)
Most Common Occupations - Farming, fishing, and forestry occupations (%)
Most Common Occupations - Construction and extraction occupations (%)
Most Common Occupations - Installation, maintenance, and repair occupations (%)
Most Common Occupations - Production, transportation, and material moving occupations (%)
Most Common Occupations - Production occupations (%)
Most Common Occupations - Transportation occupations (%)
Most Common Occupations - Material moving occupations (%)
People in Group quarters - Institutionalized population (%)
People in Group quarters - Correctional institutions (%)
People in Group quarters - Federal prisons and detention centers (%)
People in Group quarters - Halfway houses (%)
People in Group quarters - Local jails and other confinement facilities (including police lockups) (%)
People in Group quarters - Military disciplinary barracks (%)
People in Group quarters - State prisons (%)
People in Group quarters - Other types of correctional institutions (%)
People in Group quarters - Nursing homes (%)
People in Group quarters - Hospitals/wards, hospices, and schools for the handicapped (%)
People in Group quarters - Hospitals/wards and hospices for chronically ill (%)
People in Group quarters - Hospices or homes for chronically ill (%)
People in Group quarters - Military hospitals or wards for chronically ill (%)
People in Group quarters - Other hospitals or wards for chronically ill (%)
People in Group quarters - Hospitals or wards for drug/alcohol abuse (%)
People in Group quarters - Mental (Psychiatric) hospitals or wards (%)
People in Group quarters - Schools, hospitals, or wards for the mentally retarded (%)
People in Group quarters - Schools, hospitals, or wards for the physically handicapped (%)
People in Group quarters - Institutions for the deaf (%)
People in Group quarters - Institutions for the blind (%)
People in Group quarters - Orthopedic wards and institutions for the physically handicapped (%)
People in Group quarters - Wards in general hospitals for patients who have no usual home elsewhere (%)
People in Group quarters - Wards in military hospitals for patients who have no usual home elsewhere (%)
People in Group quarters - Juvenile institutions (%)
People in Group quarters - Long-term care (%)
People in Group quarters - Homes for abused, dependent, and neglected children (%)
People in Group quarters - Residential treatment centers for emotionally disturbed children (%)
People in Group quarters - Training schools for juvenile delinquents (%)
People in Group quarters - Short-term care, detention or diagnostic centers for delinquent children (%)
People in Group quarters - Type of juvenile institution unknown (%)
People in Group quarters - Noninstitutionalized population (%)
People in Group quarters - College dormitories (includes college quarters off campus) (%)
People in Group quarters - Military quarters (%)
People in Group quarters - On base (%)
People in Group quarters - Barracks, unaccompanied personnel housing (UPH), (Enlisted/Officer), ;and similar group living quarters for military personnel (%)
People in Group quarters - Transient quarters for temporary residents (%)
People in Group quarters - Military ships (%)
People in Group quarters - Group homes (%)
People in Group quarters - Homes or halfway houses for drug/alcohol abuse (%)
People in Group quarters - Homes for the mentally ill (%)
People in Group quarters - Homes for the mentally retarded (%)
People in Group quarters - Homes for the physically handicapped (%)
People in Group quarters - Other group homes (%)
People in Group quarters - Religious group quarters (%)
People in Group quarters - Dormitories (%)
People in Group quarters - Agriculture workers' dormitories on farms (%)
People in Group quarters - Job Corps and vocational training facilities (%)
People in Group quarters - Other workers' dormitories (%)
People in Group quarters - Crews of maritime vessels (%)
People in Group quarters - Other nonhousehold living situations (%)
People in Group quarters - Other noninstitutional group quarters (%)
Residents speaking English at home (%)
Residents speaking English at home - Born in the United States (%)
Residents speaking English at home - Native, born elsewhere (%)
Residents speaking English at home - Foreign born (%)
Residents speaking Spanish at home (%)
Residents speaking Spanish at home - Born in the United States (%)
Residents speaking Spanish at home - Native, born elsewhere (%)
Residents speaking Spanish at home - Foreign born (%)
Residents speaking other language at home (%)
Residents speaking other language at home - Born in the United States (%)
Residents speaking other language at home - Native, born elsewhere (%)
Residents speaking other language at home - Foreign born (%)
Class of Workers - Employee of private company (%)
Class of Workers - Self-employed in own incorporated business (%)
Class of Workers - Private not-for-profit wage and salary workers (%)
Class of Workers - Local government workers (%)
Class of Workers - State government workers (%)
Class of Workers - Federal government workers (%)
Class of Workers - Self-employed workers in own not incorporated business and Unpaid family workers (%)
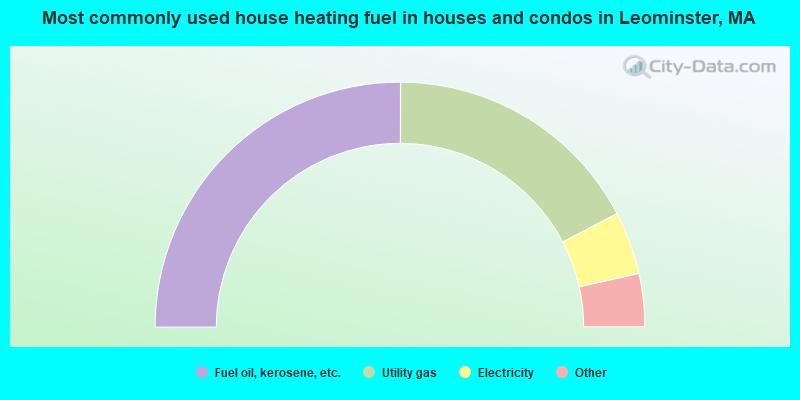
House heating fuel used in houses and condos - Utility gas (%)
House heating fuel used in houses and condos - Bottled, tank, or LP gas (%)
House heating fuel used in houses and condos - Electricity (%)
House heating fuel used in houses and condos - Fuel oil, kerosene, etc. (%)
House heating fuel used in houses and condos - Coal or coke (%)
House heating fuel used in houses and condos - Wood (%)
House heating fuel used in houses and condos - Solar energy (%)
House heating fuel used in houses and condos - Other fuel (%)
House heating fuel used in houses and condos - No fuel used (%)
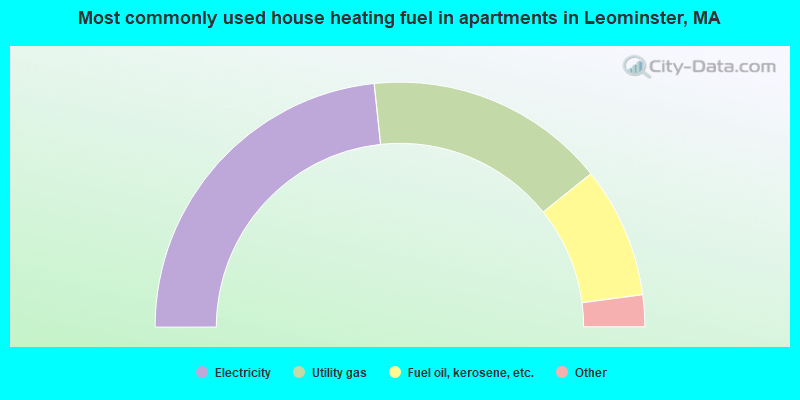
House heating fuel used in apartments - Utility gas (%)
House heating fuel used in apartments - Bottled, tank, or LP gas (%)
House heating fuel used in apartments - Electricity (%)
House heating fuel used in apartments - Fuel oil, kerosene, etc. (%)
House heating fuel used in apartments - Coal or coke (%)
House heating fuel used in apartments - Wood (%)
House heating fuel used in apartments - Solar energy (%)
House heating fuel used in apartments - Other fuel (%)
House heating fuel used in apartments - No fuel used (%)
Armed forces status - In Armed Forces (%)
Armed forces status - Civilian (%)
Armed forces status - Civilian - Veteran (%)
Armed forces status - Civilian - Nonveteran (%)
Fatal accidents locations in years 2005-2021
Fatal accidents locations in 2005
Fatal accidents locations in 2006
Fatal accidents locations in 2007
Fatal accidents locations in 2008
Fatal accidents locations in 2009
Fatal accidents locations in 2010
Fatal accidents locations in 2011
Fatal accidents locations in 2012
Fatal accidents locations in 2013
Fatal accidents locations in 2014
Fatal accidents locations in 2015
Fatal accidents locations in 2016
Fatal accidents locations in 2017
Fatal accidents locations in 2018
Fatal accidents locations in 2019
Fatal accidents locations in 2020
Fatal accidents locations in 2021
Alcohol use - People drinking some alcohol every month (%)
Alcohol use - People not drinking at all (%)
Alcohol use - Average days/month drinking alcohol
Alcohol use - Average drinks/week
Alcohol use - Average days/year people drink much
Audiometry - Average condition of hearing (%)
Audiometry - People that can hear a whisper from across a quiet room (%)
Audiometry - People that can hear normal voice from across a quiet room (%)
Audiometry - Ears ringing, roaring, buzzing (%)
Audiometry - Had a job exposure to loud noise (%)
Audiometry - Had off-work exposure to loud noise (%)
Blood Pressure & Cholesterol - Has high blood pressure (%)
Blood Pressure & Cholesterol - Checking blood pressure at home (%)
Blood Pressure & Cholesterol - Frequently checking blood cholesterol (%)
Blood Pressure & Cholesterol - Has high cholesterol level (%)
Consumer Behavior - Money monthly spent on food at supermarket/grocery store
Consumer Behavior - Money monthly spent on food at other stores
Consumer Behavior - Money monthly spent on eating out
Consumer Behavior - Money monthly spent on carryout/delivered foods
Consumer Behavior - Income spent on food at supermarket/grocery store (%)
Consumer Behavior - Income spent on food at other stores (%)
Consumer Behavior - Income spent on eating out (%)
Consumer Behavior - Income spent on carryout/delivered foods (%)
Current Health Status - General health condition (%)
Current Health Status - Blood donors (%)
Current Health Status - Has blood ever tested for HIV virus (%)
Current Health Status - Left-handed people (%)
Dermatology - People using sunscreen (%)
Diabetes - Diabetics (%)
Diabetes - Had a blood test for high blood sugar (%)
Diabetes - People taking insulin (%)
Diet Behavior & Nutrition - Diet health (%)
Diet Behavior & Nutrition - Milk product consumption (# of products/month)
Diet Behavior & Nutrition - Meals not home prepared (#/week)
Diet Behavior & Nutrition - Meals from fast food or pizza place (#/week)
Diet Behavior & Nutrition - Ready-to-eat foods (#/month)
Diet Behavior & Nutrition - Frozen meals/pizza (#/month)
Drug Use - People that ever used marijuana or hashish (%)
Drug Use - Ever used hard drugs (%)
Drug Use - Ever used any form of cocaine (%)
Drug Use - Ever used heroin (%)
Drug Use - Ever used methamphetamine (%)
Health Insurance - People covered by health insurance (%)
Kidney Conditions-Urology - Avg. # of times urinating at night
Medical Conditions - People with asthma (%)
Medical Conditions - People with anemia (%)
Medical Conditions - People with psoriasis (%)
Medical Conditions - People with overweight (%)
Medical Conditions - Elderly people having difficulties in thinking or remembering (%)
Medical Conditions - People who ever received blood transfusion (%)
Medical Conditions - People having trouble seeing even with glass/contacts (%)
Medical Conditions - People with arthritis (%)
Medical Conditions - People with gout (%)
Medical Conditions - People with congestive heart failure (%)
Medical Conditions - People with coronary heart disease (%)
Medical Conditions - People with angina pectoris (%)
Medical Conditions - People who ever had heart attack (%)
Medical Conditions - People who ever had stroke (%)
Medical Conditions - People with emphysema (%)
Medical Conditions - People with thyroid problem (%)
Medical Conditions - People with chronic bronchitis (%)
Medical Conditions - People with any liver condition (%)
Medical Conditions - People who ever had cancer or malignancy (%)
Mental Health - People who have little interest in doing things (%)
Mental Health - People feeling down, depressed, or hopeless (%)
Mental Health - People who have trouble sleeping or sleeping too much (%)
Mental Health - People feeling tired or having little energy (%)
Mental Health - People with poor appetite or overeating (%)
Mental Health - People feeling bad about themself (%)
Mental Health - People who have trouble concentrating on things (%)
Mental Health - People moving or speaking slowly or too fast (%)
Mental Health - People having thoughts they would be better off dead (%)
Oral Health - Average years since last visit a dentist
Oral Health - People embarrassed because of mouth (%)
Oral Health - People with gum disease (%)
Oral Health - General health of teeth and gums (%)
Oral Health - Average days a week using dental floss/device
Oral Health - Average days a week using mouthwash for dental problem
Oral Health - Average number of teeth
Pesticide Use - Households using pesticides to control insects (%)
Pesticide Use - Households using pesticides to kill weeds (%)
Physical Activity - People doing vigorous-intensity work activities (%)
Physical Activity - People doing moderate-intensity work activities (%)
Physical Activity - People walking or bicycling (%)
Physical Activity - People doing vigorous-intensity recreational activities (%)
Physical Activity - People doing moderate-intensity recreational activities (%)
Physical Activity - Average hours a day doing sedentary activities
Physical Activity - Average hours a day watching TV or videos
Physical Activity - Average hours a day using computer
Physical Functioning - People having limitations keeping them from working (%)
Physical Functioning - People limited in amount of work they can do (%)
Physical Functioning - People that need special equipment to walk (%)
Physical Functioning - People experiencing confusion/memory problems (%)
Physical Functioning - People requiring special healthcare equipment (%)
Prescription Medications - Average number of prescription medicines taking
Preventive Aspirin Use - Adults 40+ taking low-dose aspirin (%)
Reproductive Health - Vaginal deliveries (%)
Reproductive Health - Cesarean deliveries (%)
Reproductive Health - Deliveries resulted in a live birth (%)
Reproductive Health - Pregnancies resulted in a delivery (%)
Reproductive Health - Women breastfeeding newborns (%)
Reproductive Health - Women that had a hysterectomy (%)
Reproductive Health - Women that had both ovaries removed (%)
Reproductive Health - Women that have ever taken birth control pills (%)
Reproductive Health - Women taking birth control pills (%)
Reproductive Health - Women that have ever used Depo-Provera or injectables (%)
Reproductive Health - Women that have ever used female hormones (%)
Sexual Behavior - People 18+ that ever had sex (vaginal, anal, or oral) (%)
Sexual Behavior - Males 18+ that ever had vaginal sex with a woman (%)
Sexual Behavior - Males 18+ that ever performed oral sex on a woman (%)
Sexual Behavior - Males 18+ that ever had anal sex with a woman (%)
Sexual Behavior - Males 18+ that ever had any sex with a man (%)
Sexual Behavior - Females 18+ that ever had vaginal sex with a man (%)
Sexual Behavior - Females 18+ that ever performed oral sex on a man (%)
Sexual Behavior - Females 18+ that ever had anal sex with a man (%)
Sexual Behavior - Females 18+ that ever had any kind of sex with a woman (%)
Sexual Behavior - Average age people first had sex
Sexual Behavior - Average number of female sex partners in lifetime (males 18+)
Sexual Behavior - Average number of female vaginal sex partners in lifetime (males 18+)
Sexual Behavior - Average age people first performed oral sex on a woman (18+)
Sexual Behavior - Average number of woman performed oral sex on in lifetime (18+)
Sexual Behavior - Average number of male sex partners in lifetime (males 18+)
Sexual Behavior - Average number of male anal sex partners in lifetime (males 18+)
Sexual Behavior - Average age people first performed oral sex on a man (18+)
Sexual Behavior - Average number of male oral sex partners in lifetime (18+)
Sexual Behavior - People using protection when performing oral sex (%)
Sexual Behavior - Average number of times people have vaginal or anal sex a year
Sexual Behavior - People having sex without condom (%)
Sexual Behavior - Average number of male sex partners in lifetime (females 18+)
Sexual Behavior - Average number of male vaginal sex partners in lifetime (females 18+)
Sexual Behavior - Average number of female sex partners in lifetime (females 18+)
Sexual Behavior - Circumcised males 18+ (%)
Sleep Disorders - Average hours sleeping at night
Sleep Disorders - People that has trouble sleeping (%)
Smoking-Cigarette Use - People smoking cigarettes (%)
Taste & Smell - People 40+ having problems with smell (%)
Taste & Smell - People 40+ having problems with taste (%)
Taste & Smell - People 40+ that ever had wisdom teeth removed (%)
Taste & Smell - People 40+ that ever had tonsils teeth removed (%)
Taste & Smell - People 40+ that ever had a loss of consciousness because of a head injury (%)
Taste & Smell - People 40+ that ever had a broken nose or other serious injury to face or skull (%)
Taste & Smell - People 40+ that ever had two or more sinus infections (%)
Weight - Average height (inches)
Weight - Average weight (pounds)
Weight - Average BMI
Weight - People that are obese (%)
Weight - People that ever were obese (%)
Weight - People trying to lose weight (%)
Officers per 1,000 residents here:
1.67Massachusetts average:
2.53
Latest news from Leominster, MA collected exclusively by city-data.com from local newspapers, TV, and radio stations
Leominster, MA City Guides: Ancestries: Italian (10.3%), American (9.6%), French Canadian (8.4%), Irish (8.2%), English (5.0%), French (4.8%).
Current Local Time:
Land area: 28.9 square miles.
Population density: 1,511 people per square mile (low).
6,563 residents are foreign born (6.5% Latin America , 3.0% Africa , 2.0% Asia , 1.9% Europe ).
This city:
15.0%Massachusetts:
17.6%
Median real estate property taxes paid for housing units with mortgages in 2022: $4,912 (1.4%)Median real estate property taxes paid for housing units with no mortgage in 2022: $4,826 (1.5%)
Nearest city with pop. 50,000+: Worcester, MA
Nearest city with pop. 200,000+: Boston, MA
Nearest city with pop. 1,000,000+: Bronx, NY
Nearest cities:
Latitude: 42.53 N, Longitude: 71.75 W
Daytime population change due to commuting: -727 (-1.7%)Workers who live and work in this city: 7,380 (32.5%)
Leominster tourist attractions:
Single-family new house construction building permits:
2022: 12 buildings , average cost: $298,7002021: 12 buildings , average cost: $280,3002020: 14 buildings , average cost: $282,0002019: 14 buildings , average cost: $282,0002018: 14 buildings , average cost: $282,0002017: 37 buildings , average cost: $281,1002016: 41 buildings , average cost: $257,0002015: 41 buildings , average cost: $241,6002014: 44 buildings , average cost: $317,2002013: 39 buildings , average cost: $173,1002012: 35 buildings , average cost: $248,9002011: 30 buildings , average cost: $252,7002010: 19 buildings , average cost: $206,8002009: 11 buildings , average cost: $269,7002008: 12 buildings , average cost: $299,2002007: 43 buildings , average cost: $191,3002006: 50 buildings , average cost: $192,6002005: 44 buildings , average cost: $193,7002004: 73 buildings , average cost: $181,2002003: 105 buildings , average cost: $165,5002002: 58 buildings , average cost: $218,0002001: 58 buildings , average cost: $112,5002000: 61 buildings , average cost: $112,6001999: 67 buildings , average cost: $112,2001998: 109 buildings , average cost: $93,6001997: 91 buildings , average cost: $97,300Unemployment in December 2023: Here:
3.9%Massachusetts:
3.5%
Population change in the 1990s: +3,398 (+9.0%).
Most common occupations in Leominster, MA (%)
Both Males Females
Other production occupations, including supervisors (5.6%)
Other office and administrative support workers, including supervisors (4.0%)
Metal workers and plastic workers (3.8%)
Other management occupations, except farmers and farm managers (3.7%)
Material recording, scheduling, dispatching, and distributing workers (3.5%)
Other sales and related occupations, including supervisors (3.3%)
Secretaries and administrative assistants (3.0%)
Other production occupations, including supervisors (7.0%)
Material recording, scheduling, dispatching, and distributing workers (4.8%)
Metal workers and plastic workers (4.5%)
Electrical equipment mechanics and other installation, maintenance, and repair workers, including supervisors (4.4%)
Computer specialists (4.0%)
Other management occupations, except farmers and farm managers (3.9%)
Building and grounds cleaning and maintenance occupations (3.5%)
Secretaries and administrative assistants (6.1%)
Other office and administrative support workers, including supervisors (5.8%)
Preschool, kindergarten, elementary, and middle school teachers (5.2%)
Other production occupations, including supervisors (4.2%)
Information and record clerks, except customer service representatives (3.8%)
Registered nurses (3.7%)
Other management occupations, except farmers and farm managers (3.5%)
Tornado activity:
Leominster-area historical tornado activity is slightly above Massachusetts state average. It is 20% smaller than the overall U.S. average.
On 6/9/1953, a category F4 (max. wind speeds 207-260 mph) tornado 19.7 miles away from the Leominster city center killed 90 people and injured 1228 people and caused between $50,000,000 and $500,000,000 in damages.
On 6/22/1981, a category F3 (max. wind speeds 158-206 mph) tornado 7.6 miles away from the city center injured 3 people and caused between $5000 and $50,000 in damages.
Earthquake activity:
Leominster-area historical earthquake activity is significantly above Massachusetts state average. It is 71% smaller than the overall U.S. average. On 10/7/1983 at 10:18:46, a magnitude 5.3 (5.1 MB, 5.3 LG, 5.1 ML, Class: Moderate, Intensity: VI - VII) earthquake occurred 163.5 miles away from the city center On 4/20/2002 at 10:50:47, a magnitude 5.3 (5.3 ML, Depth: 3.0 mi) earthquake occurred 168.4 miles away from Leominster center On 4/20/2002 at 10:50:47, a magnitude 5.2 (5.2 MB, 4.2 MS, 5.2 MW, 5.0 MW) earthquake occurred 167.6 miles away from the city center On 1/19/1982 at 00:14:42, a magnitude 4.7 (4.5 MB, 4.7 MD, 4.5 LG, Class: Light, Intensity: IV - V) earthquake occurred 67.8 miles away from the city center On 10/16/2012 at 23:12:25, a magnitude 4.7 (4.7 ML, Depth: 10.0 mi) earthquake occurred 92.5 miles away from the city center On 10/2/1994 at 11:27:22, a magnitude 3.7 (3.5 LG, 3.7 LG, Depth: 6.2 mi, Class: Light, Intensity: II - III) earthquake occurred 29.5 miles away from Leominster center Magnitude types: regional Lg-wave magnitude (LG), body-wave magnitude (MB), duration magnitude (MD), local magnitude (ML), surface-wave magnitude (MS), moment magnitude (MW) Natural disasters: The number of natural disasters in Worcester County (27) is a lot greater than the US average (15).Major Disasters (Presidential) Declared: 15Emergencies Declared: 12Floods: 9, Storms: 8, Hurricanes: 6, Snowstorms: 5, Winter Storms: 4, Blizzards: 2, Snows: 2, Fire: 1, Heavy Rain: 1, Snowfall: 1, Tornado: 1, Wind: 1 (Note: some incidents may be assigned to more than one category). Hospitals and medical centers in Leominster: DIVERSIFIED HOME SERVICES HOSPICE PROGRAM (25 TUCKER DRIVE) HEALTH ALLIANCE HOSP LEOMINSTER CAMPUS (provides emergency services, 60 HOSPITAL ROAD) HEALTHALLIANCE HOSPITALS, INC (Voluntary non-profit - Other, provides emergency services, 60 HOSPITAL ROAD) HEALTHALLIANCE HOME HEALTH AND HOSPICE (25 TUCKER DRIVE)
FAIRLAWN N H (370 WEST ST)
KEYSTONE CENTER (44 KEYSTONE DRIVE)
KEYSTONE NURSING AND REHAB CENTER (KEYSTONE DR)
LIFE CARE CENTER OF LEOMINSTER (370 WEST STREET)
PRESENTATION HEALTH CARE CENTER (99 CHURCH STREET)
Amtrak station near Leominster: 19 miles: WORCESTER (WORCHESTER, 45 SHREWSBURY ST.) Services: ticket office, fully wheelchair accessible, enclosed waiting area, public restrooms, public payphones, vending machines, free short-term parking, free long-term parking, call for taxi service, public transit connection.
Colleges/universities with over 2000 students nearest to Leominster:
Fitchburg State University (about 5 miles; Fitchburg, MA ; Full-time enrollment: 5,010)
Mount Wachusett Community College (about 13 miles; Gardner, MA ; FT enrollment: 3,143)
Quinsigamond Community College (about 15 miles; Worcester, MA ; FT enrollment: 5,877)
Assumption College (about 17 miles; Worcester, MA ; FT enrollment: 2,580)
Worcester Polytechnic Institute (about 18 miles; Worcester, MA ; FT enrollment: 3,930)
Worcester State University (about 19 miles; Worcester, MA ; FT enrollment: 5,426)
Clark University (about 20 miles; Worcester, MA ; FT enrollment: 3,687)
Public high schools in Leominster: LEOMINSTER HIGH SCHOOL Students: 1,196, Location: 122 GRANITE STREET, Grades: 9-12)CENTER FOR TECHNICAL EDUCATION INNOVATION Location: 122 GRANITE STREET, Grades: 9-12)
LEOMINSTER CENTER FOR EXCELLENCE Location: 464 ABBOT AVENUE, Grades: 10-11)
Public elementary/middle schools in Leominster: JOHNNY APPLESEED Students: 678, Location: 845 MAIN STREET, Grades: KG-5)SKY VIEW MIDDLE SCHOOL Students: 674, Location: 500 KENNEDY WAY, Grades: 6-8)NORTHWEST Students: 647, Location: 45 STEARNS AVENUE, Grades: KG-5)SAMOSET SCHOOL Students: 636, Location: 100 DECICCO DR, Grades: 6-8)FALL BROOK Students: 569, Location: 25 DECICCO DR, Grades: KG-5)SOUTHEAST SCHOOL Students: 564, Location: 95 VISCOLOID AVE, Grades: KG-5)Private elementary/middle schools in Leominster: ST LEO SCHOOL Students: 265, Location: 120 MAIN ST, Grades: PK-8)
ST ANNA SCHOOL Students: 187, Location: 213 LANCASTER ST, Grades: PK-8)
See full list of schools located in Leominster Library in Leominster: LEOMINSTER PUBLIC LIBRARY Operating income: $1,245,987; Location: 30 WEST ST.; 108,607 books ; 948 e-books ; 9,151 audio materials ; 8,081 video materials ; 11 local licensed databases ; 34 state licensed databases ; 188 print serial subscriptions )
User-submitted facts and corrections:
Johnny Appleseed was born in Leominster.
Notable locations in Leominster: (A) , Sholan Farms (B) , Monoosnock Country Club (C) , Grand View Country Club (D) , Victory Northgate Plaza (E) , Mid-City Searstown (F) , Monoosnock Country Club (G) , MedStar Ambulance (H) , Leominster Fire Department Station 2 (I) , Leominster Fire Department Station 3 (J) , Leominster Fire Department Station 1 Headquarters (K) , Fall Brook Elementary School Library (L) , Mary Crowley Media Center (M) , Johnny Appleseed School Library (N) , Masonic Hall (O) , Leominster Public Library (P) , Leominster Chamber Office (Q) , Health Alliance Hospital Library (R) . Display/hide their locations on the map
Shopping Centers: (1) , Market Basket Plaza Shopping Center (2) , Searstown Mall Shopping Center (3) , Victory Northgate Plaza Shopping Center (4) . Display/hide their locations on the map
Churches in Leominster include: (A) , Saint Anns Parish Church (B) , Pilgrim Congregational Church (C) , Leominster United Methodist Church (D) , Leominster Spanish Seventh Day Church (E) , Kingdom Hall of Jehovahs Witnesses (F) , First Baptist Church (G) , Congregation Church of Christ (H) , Congregation Agudas Achim (I) . Display/hide their locations on the map
Cemeteries: (1) , Pine Grove Cemetery (2) , Evergreen Cemetery (3) , Saint Leo Cemetery (4) . Display/hide their locations on the map
Lakes, reservoirs, and swamps: (A) , Colburns Reservoir (B) , Simonds Pond (C) , Lake Samoset (D) , Barrett Pond (E) , Fall Brook Reservoir (F) , Bartlett Pond (G) , Sumond Pond (H) . Display/hide their locations on the map
Streams, rivers, and creeks: (A) , Fall Brook (B) . Display/hide their locations on the map
Parks in Leominster include: (1) , Monument Square Historic District (2) , Fournier Park (3) , Desantis Field (4) . Display/hide their locations on the map
Tourist attractions: (1) , Blondie Jo (Arcades & Amusements; 42C Meadow Pond Drive) (2) . Display/hide their approximate locations on the map
Hotels: (1) , Four Points By Sheraton Leominster (99 Erdman Way) (2) , Four Points Sheraton (99 Erdman Way) (3) . Display/hide their approximate locations on the map
Birthplace of: Cliff Boro - Chief executive officer, David I. Walsh - Senator, R. A. Salvatore - Fantasy writer, Johnny Appleseed - (1774-1847), Samuel Gardner Wilder - Hawaiian politician, Donald Featherstone (artist) - Artist, Frank Novak (American football) - Football coach, Harold Stephen Black - Electrical engineer, Lenny LeBlanc - Male singer-songwriter, Robert Cormier - Children's writer.
Worcester County has a predicted average indoor radon screening level greater than 4 pCi/L (pico curies per liter) - Highest Potential Drinking water stations with addresses in Leominster and their reported violations in the past:
LEOMINSTER WATER DIVISION (Population served: 40,490, Surface water):
Past health violations:
MCL, Monthly (TCR) - In JUL-2012, Contaminant: Coliform. Follow-up actions: St AO (w/o penalty) issued (SEP-15-2012), St Compliance achieved (SEP-15-2012)
MCL, Monthly (TCR) - In AUG-2008, Contaminant: Coliform. Follow-up actions: St AO (w/o penalty) issued (SEP-30-2008), St Compliance achieved (SEP-30-2008)
MCL, Average - Between JUL-2007 and SEP-2007, Contaminant: TTHM. Follow-up actions: St AO (w/o penalty) issued (2 times from JUL-18-2006 to NOV-30-2007)
MCL, Average - Between APR-2007 and JUN-2007, Contaminant: TTHM. Follow-up actions: St AO (w/o penalty) issued (2 times from JUL-18-2006 to AUG-09-2007)
MCL, Average - Between JAN-2007 and MAR-2007, Contaminant: TTHM. Follow-up actions: St AO (w/o penalty) issued (2 times from JUL-18-2006 to APR-25-2007)
MCL, Average - Between OCT-2006 and DEC-2006, Contaminant: TTHM. Follow-up actions: St AO (w/o penalty) issued (JUL-18-2006), St Compliance achieved (FEB-12-2007), St AO (w/o penalty) issued (FEB-12-2007)
2 other older health violations
Past monitoring violations:
Monitoring of Treatment (SWTR-Unfilt/GWR) - In DEC-2005. Follow-up actions: St AO (w/o penalty) issued (JAN-30-2006), St Compliance achieved (JUL-18-2006), St AO (w/o penalty) issued (JUL-18-2006)
Monitoring of Treatment (SWTR-Unfilt/GWR) - In NOV-2005. Follow-up actions: St AO (w/o penalty) issued (JAN-30-2006), St Compliance achieved (JUL-18-2006), St AO (w/o penalty) issued (JUL-18-2006)
Monitoring of Treatment (SWTR-Filter) - In OCT-2005. Follow-up actions: St AO (w/o penalty) issued (JAN-30-2006), St Compliance achieved (JUL-18-2006), St AO (w/o penalty) issued (JUL-18-2006)
Monitoring of Treatment (SWTR-Unfilt/GWR) - In OCT-2005. Follow-up actions: St AO (w/o penalty) issued (JAN-30-2006), St Compliance achieved (JUL-18-2006), St AO (w/o penalty) issued (JUL-18-2006)
Monitoring of Treatment (SWTR-Filter) - In SEP-2005. Follow-up actions: St AO (w/o penalty) issued (JAN-30-2006), St Compliance achieved (JUL-18-2006), St AO (w/o penalty) issued (JUL-18-2006)
17 other older monitoring violations
Population served: 75, Groundwater):
Past monitoring violations:
Follow-up Or Routine LCR Tap M/R - In JUL-01-2009, Contaminant: Lead and Copper Rule. Follow-up actions: St AO (w/o penalty) issued (MAR-01-2010), St Compliance achieved (SEP-28-2011)
13 regular monitoring violations
Serves NH, Population served: 50, Groundwater):
Past health violations:
MCL, Monthly (TCR) - In MAY-2011, Contaminant: Coliform. Follow-up actions: St Public Notif requested (MAY-23-2011), St Violation/Reminder Notice (MAY-23-2011), St Public Notif received (MAY-26-2011), St Compliance achieved (NOV-30-2011)
Average household size: This city:
2.4 peopleMassachusetts:
2.5 people
Percentage of family households: This city:
63.0%Whole state:
63.0%
Percentage of households with unmarried partners: This city:
7.6%Whole state:
7.0%
Likely homosexual households (counted as self-reported same-sex unmarried-partner households)
Lesbian couples: 0.6% of all households Gay men: 0.2% of all households
People in group quarters in Leominster in 2010:
224 people in nursing facilities/skilled-nursing facilities
35 people in group homes intended for adults
23 people in correctional facilities intended for juveniles
19 people in other noninstitutional facilities
16 people in emergency and transitional shelters (with sleeping facilities) for people experiencing homelessness
6 people in residential treatment centers for adults
4 people in group homes for juveniles (non-correctional)
People in group quarters in Leominster in 2000:
296 people in nursing homes
34 people in homes or halfway houses for drug/alcohol abuse
21 people in homes for the mentally retarded
20 people in religious group quarters
14 people in homes for the physically handicapped
9 people in homes for the mentally ill
Banks with most branches in Leominster (2011 data):
Fidelity Co-operative Bank: Www.Fideltybankdirect.com Branch, Leominster Connector Branch, Leominster Branch. Info updated 2006/10/24: Bank assets: $517.5 mil, Deposits: $398.9 mil, headquarters in Fitchburg, MA, positive income , Commercial Lending Specialization, 8 total offices , Holding Company: Fidelity Mutual Holding Company
Rollstone Bank & Trust: Leominster Branch at Mill Street, branch established on 1995/03/16; Central Street Branch at 721 Central Street, branch established on 2003/10/01. Info updated 2011/07/21: Bank assets: $532.9 mil, Deposits: $299.5 mil, headquarters in Fitchburg, MA, positive income , Commercial Lending Specialization, 7 total offices
TD Bank, National Association: Water Tower Plaza Branch at 25 Water Tower Pl, branch established on 1994/02/14; Monument Square Branch at 15 Monument Square, branch established on 1865/03/26. Info updated 2010/10/04: Bank assets: $188,912.6 mil, Deposits: $153,149.8 mil, headquarters in Wilmington, DE, positive income , 1314 total offices , Holding Company: Toronto-Dominion Bank, The
Commerce Bank & Trust Company: Leominster Branch at 565 Main Street, branch established on 2002/02/07. Info updated 2006/10/06: Bank assets: $1,410.8 mil, Deposits: $1,187.6 mil, headquarters in Worcester, MA, positive income , Commercial Lending Specialization, 14 total offices , Holding Company: Commerce Bancshares Corp.
Avidia Bank: Leominster Branch at 470 Lancaster Street, branch established on 2005/06/30. Info updated 2010/01/04: Bank assets: $1,026.2 mil, Deposits: $801.2 mil, headquarters in Hudson, MA, positive income , Commercial Lending Specialization, 10 total offices , Holding Company: Assabet Valley Bancorp
Enterprise Bank and Trust Company: Leominster Branch at 4 Central Street, branch established on 1995/09/25. Info updated 2006/11/03: Bank assets: $1,488.4 mil, Deposits: $1,333.6 mil, headquarters in Lowell, MA, positive income , Commercial Lending Specialization, 20 total offices , Holding Company: Enterprise Bancorp, Inc.
Bank of America, National Association: Leominster/Merchants Branch at 1 Main Street, branch established on 1911/07/31. Info updated 2009/11/18: Bank assets: $1,451,969.3 mil, Deposits: $1,077,176.8 mil, headquarters in Charlotte, NC, positive income , 5782 total offices , Holding Company: Bank Of America Corporation
People's United Bank: Leominster Branch at 75 North Main Street, branch established on 1995/06/14. Info updated 2012/02/16: Bank assets: $27,319.3 mil, Deposits: $20,835.4 mil, headquarters in Bridgeport, CT, positive income , Commercial Lending Specialization, 374 total offices
Sovereign Bank, National Association: Leominster Branch at 11 Park Street, branch established on 1959/11/02. Info updated 2012/01/31: Bank assets: $78,146.9 mil, Deposits: $48,042.9 mil, headquarters in Wilmington, DE, positive income , Commercial Lending Specialization, 718 total offices , Holding Company: Banco Santander, S.A.
For population 15 years and over in Leominster:
Never married: 34.1%Now married: 45.8%Separated: 1.7%Widowed: 6.3%Divorced: 12.2% For population 25 years and over in Leominster:
High school or higher: 90.3%Bachelor's degree or higher: 33.1%Graduate or professional degree: 11.9%Unemployed: 4.0%Mean travel time to work (commute): 23.1 minutes
Education Gini index (Inequality in education) Here:
12.0Massachusetts average:
13.0
Religion statistics for Leominster, MA (based on Worcester County data)
Religion Adherents Congregations Catholic 306,925 118 Mainline Protestant 43,326 171 Evangelical Protestant 37,511 203 Other 18,931 69 Orthodox 7,935 15 Black Protestant 497 6 None 383,427 -
Source: Clifford Grammich, Kirk Hadaway, Richard Houseal, Dale E.Jones, Alexei Krindatch, Richie Stanley and Richard H.Taylor. 2012. 2010 U.S.Religion Census: Religious Congregations & Membership Study. Association of Statisticians of American Religious Bodies. Jones, Dale E., et al. 2002. Congregations and Membership in the United States 2000. Nashville, TN: Glenmary Research Center. Graphs represent county-level data
Food Environment Statistics: Number of grocery stores : 135Here :
1.73 / 10,000 pop.Massachusetts :
1.98 / 10,000 pop.
Number of supercenters and club stores : 4This county :
0.05 / 10,000 pop.State :
0.05 / 10,000 pop.
Number of convenience stores (no gas) : 140Worcester County :
1.79 / 10,000 pop.State :
2.22 / 10,000 pop.
Number of convenience stores (with gas) : 174This county :
2.22 / 10,000 pop.Massachusetts :
1.77 / 10,000 pop.
Number of full-service restaurants : 569Worcester County :
7.27 / 10,000 pop.Massachusetts :
8.76 / 10,000 pop.
Adult diabetes rate : Worcester County :
8.0%Massachusetts :
8.1%
Adult obesity rate : Here :
24.0%Massachusetts :
22.5%
Low-income preschool obesity rate : Worcester County :
16.6%Massachusetts :
16.5%
Health and Nutrition: Healthy diet rate : Leominster:
49.5%Massachusetts:
50.5%
Average overall health of teeth and gums : Here:
46.9%Massachusetts:
48.0%
Average BMI : Leominster:
28.6Massachusetts:
28.4
People feeling badly about themselves : Leominster:
21.4%Massachusetts:
20.7%
People not drinking alcohol at all : Here:
10.3%Massachusetts:
10.4%
Average hours sleeping at night : General health condition : Leominster:
56.2%State:
57.1%
Average condition of hearing : Leominster:
78.8%Massachusetts:
79.2%
More about Health and Nutrition of Leominster, MA Residents
Local government employment and payroll (March 2022)
Function
Full-time employees
Monthly full-time payroll
Average yearly full-time wage
Part-time employees
Monthly part-time payroll
Elementary and Secondary - Instruction
741 $4,219,100 $68,326 52 $93,359 Elementary and Secondary - Other Total
150 $553,370 $44,270 15 $16,323 Firefighters
85 $760,076 $107,305 0 $0 Police Protection - Officers
62 $575,480 $111,383 0 $0 Streets and Highways
38 $224,985 $71,048 0 $0 Financial Administration
28 $106,910 $45,819 0 $0 Local Libraries
14 $79,037 $67,746 11 $10,775 Police - Other
13 $66,885 $61,740 2 $3,919 Sewerage
11 $50,331 $54,907 0 $0 Other and Unallocable
7 $63,736 $109,262 0 $0 Housing and Community Development (Local)
6 $35,057 $70,114 0 $0 Health
5 $31,686 $76,046 0 $0 Welfare
5 $28,095 $67,428 1 $1,714 Parks and Recreation
4 $38,604 $115,812 4 $3,302 Other Government Administration
4 $23,764 $71,292 0 $0 Natural Resources
3 $22,723 $90,892 0 $0 Fire - Other
2 $8,423 $50,538 0 $0
Totals for Government
1,178 $6,888,260 $70,169 85 $129,392
Leominster government finances - Expenditure in 2021 (per resident):
Current Operations - Elementary and Secondary Education: $87,954,000 ($2015.17)
General - Other: $14,935,000 ($342.18)Local Fire Protection: $9,910,000 ($227.05)Police Protection: $8,505,000 ($194.86)Water Utilities: $4,700,000 ($107.68)Sewerage: $4,077,000 ($93.41)Regular Highways: $3,064,000 ($70.20)Solid Waste Management: $2,663,000 ($61.01)Financial Administration: $2,195,000 ($50.29)Parks and Recreation: $1,651,000 ($37.83)Libraries: $1,516,000 ($34.73)Protective Inspection and Regulation - Other: $1,465,000 ($33.57)Housing and Community Development: $718,000 ($16.45)Central Staff Services: $650,000 ($14.89)Public Welfare - Other: $535,000 ($12.26)General Public Buildings: $435,000 ($9.97)Health - Other: $387,000 ($8.87)Judicial and Legal Services: $103,000 ($2.36)Natural Resources - Other: $84,000 ($1.92)Parking Facilities: $6,000 ($0.14)General - Interest on Debt: $739,000 ($16.93)
Intergovernmental to Local - Other - Elementary and Secondary Education: $4,539,000 ($104.00)
Other - Health - Other: $107,000 ($2.45)Intergovernmental to State - Transit Utilities: $771,000 ($17.66)
General - Other: $64,000 ($1.47)Other Capital Outlay - Water Utilities: $2,935,000 ($67.25)
General - Other: $1,820,000 ($41.70)Elementary and Secondary Education: $519,000 ($11.89)Total Salaries and Wages: $50,910,000 ($1166.43)
Water Utilities - Interest on Debt: $724,000 ($16.59)
Leominster government finances - Revenue in 2021 (per resident):
Charges - Sewerage: $6,772,000 ($155.16)
Other: $1,818,000 ($41.65)Elementary and Secondary Education School Lunch: $1,399,000 ($32.05)Elementary and Secondary Education School Tuition and Transportation: $249,000 ($5.70)Elementary and Secondary Education - Other: $95,000 ($2.18)Federal Intergovernmental - Other: $9,704,000 ($222.33)
Housing and Community Development: $332,000 ($7.61)Local Intergovernmental - Education: $1,289,000 ($29.53)
Miscellaneous - General Revenue - Other: $726,000 ($16.63)
Donations From Private Sources: $569,000 ($13.04)Interest Earnings: $225,000 ($5.16)Fines and Forfeits: $99,000 ($2.27)Revenue - Water Utilities: $7,086,000 ($162.35)
State Intergovernmental - Education: $60,911,000 ($1395.57)
General Local Government Support: $6,426,000 ($147.23)Other: $2,458,000 ($56.32)Highways: $500,000 ($11.46)Public Welfare: $247,000 ($5.66)Tax - Property: $83,115,000 ($1904.30)
Other License: $1,419,000 ($32.51)Other Selective Sales: $759,000 ($17.39)
Leominster government finances - Debt in 2021 (per resident):
Long Term Debt - Beginning Outstanding - Unspecified Public Purpose: $36,558,000 ($837.60)
Outstanding Unspecified Public Purpose: $32,554,000 ($745.86)Retired Unspecified Public Purpose: $4,003,000 ($91.72)Short Term Debt Outstanding - End of Fiscal Year: $6,435,000 ($147.44)
Beginning: $1,675,000 ($38.38)
Leominster government finances - Cash and Securities in 2021 (per resident):
Bond Funds - Cash and Securities: $2,108,000 ($48.30)
Other Funds - Cash and Securities: $42,023,000 ($962.81)
4.71% of this county's 2021 resident taxpayers lived in other counties in 2020 ($76,229 average adjusted gross income )
Here:
4.71%Massachusetts average:
6.35%
0.02% of residents moved from foreign countries ($100 average AGI )Worcester County:
0.02%Massachusetts average:
0.01%
Top counties from which taxpayers relocated into this county between 2020 and 2021:
4.84% of this county's 2020 resident taxpayers moved to other counties in 2021 ($87,252 average adjusted gross income )
Here:
4.84%Massachusetts average:
7.18%
0.03% of residents moved to foreign countries ($199 average AGI )Worcester County:
0.03%Massachusetts average:
0.02%
Top counties to which taxpayers relocated from this county between 2020 and 2021:
Businesses in Leominster, MA
Name Count Name Count
AT&T 3 Marshalls 1 Advance Auto Parts 1 MasterBrand Cabinets 11 Aeropostale 1 McDonald's 2 American Eagle Outfitters 1 Men's Wearhouse 1 Applebee's 1 Motel 6 1 AutoZone 1 Motherhood Maternity 1 Barnes & Noble 1 New Balance 1 Bath & Body Works 1 Nike 11 Bed Bath & Beyond 1 OfficeMax 1 Blockbuster 1 Old Navy 1 Burger King 2 Olive Garden 1 CVS 1 Outback 1 Chuck E. Cheese's 1 Outback Steakhouse 1 Cold Stone Creamery 1 Pac Sun 1 Curves 1 Panera Bread 1 Dairy Queen 1 Papa John's Pizza 1 Decora Cabinetry 3 Payless 3 Dennys 1 PetSmart 1 Domino's Pizza 1 Pier 1 Imports 1 DressBarn 1 Pizza Hut 1 Dressbarn 1 Quiznos 1 Dunkin Donuts 7 RadioShack 2 Famous Footwear 1 Sears 2 FedEx 7 Shaw's 1 Finish Line 1 Spencer Gifts 1 Firestone Complete Auto Care 1 Sprint Nextel 1 Foot Locker 1 Staples 1 GNC 1 Starbucks 2 GameStop 2 Subway 2 H&R Block 1 Super 8 1 Home Depot 1 T-Mobile 5 Hot Topic 1 T.G.I. Driday's 1 Hyundai 1 T.J.Maxx 1 JCPenney 1 Taco Bell 1 Jones New York 5 Target 1 Journeys 1 Toys"R"Us 2 Justice 1 U-Haul 2 KFC 1 UPS 8 Kohl's 1 Vans 1 La-Z-Boy 1 Verizon Wireless 2 Lane Bryant 1 Victoria's Secret 1 LensCrafters 1 Walgreens 1 Lowe's 1 Walmart 1 Macy's 1 Wendy's 1
Strongest AM radio stations in Leominster:
WCMX (1000 AM; daytime; 1 kW; LEOMINSTER, MA; Owner: TWIN CITY BAPTIST TEMPLE, INC.)
WCRN (830 AM; 50 kW; WORCESTER, MA; Owner: CARTER BROADCASTING CORPORATION)
WEIM (1280 AM; 5 kW; FITCHBURG, MA; Owner: LIVEAIR COMMUNICATIONS, INC.)
WRKO (680 AM; 50 kW; BOSTON, MA; Owner: ENTERCOM BOSTON LICENSE, LLC)
WKOX (1200 AM; 50 kW; FRAMINGHAM, MA; Owner: CAPSTAR TX LIMITED PARTNERSHIP)
WFGL (960 AM; 2 kW; FITCHBURG, MA; Owner: CSN INTERNATIONAL)
WBIX (1060 AM; 40 kW; NATICK, MA; Owner: LANGER BROADCASTING CORPORATION)
WEEI (850 AM; 50 kW; BOSTON, MA; Owner: ENTERCOM BOSTON LICENSE, LLC)
WVNE (760 AM; daytime; 25 kW; LEICESTER, MA; Owner: BLOUNT MASSCOM, INC.)
WTAG (580 AM; 5 kW; WORCESTER, MA; Owner: CAPSTAR TX LIMITED PARTNERSHIP)
WAMG (890 AM; 25 kW; DEDHAM, MA; Owner: MEGA COMMUNICATIONS OF DEDHAM LICENSEE, LLC)
WWZN (1510 AM; 50 kW; BOSTON, MA; Owner: ROSE CITY RADIO CORPORATION)
WAZN (1470 AM; 7 kW; MARLBOROUGH, MA; Owner: MULTICULTURAL RADIO BROADCASTING, INC.)
Strongest FM radio stations in Leominster:
WXLO (104.5 FM; FITCHBURG, MA; Owner: CITADEL BROADCASTING COMPANY)
WAAF (107.3 FM; WORCESTER, MA; Owner: ENTERCOM BOSTON LICENSE, LLC)
WFEX (92.1 FM; PETERBOROUGH, NH; Owner: FNX BROADCASTING OF NEW HAMPSHIRE LLC)
WSRS (96.1 FM; WORCESTER, MA; Owner: CAPSTAR TX LIMITED PARTNERSHIP)
WBMX (98.5 FM; BOSTON, MA; Owner: INFINITY RADIO OPERATIONS INC.)
WJMN (94.5 FM; BOSTON, MA; Owner: AMFM RADIO LICENSES, L.L.C.)
WCRB (102.5 FM; WALTHAM, MA; Owner: CHARLES RIVER BROADCASTING WCRB LICE)
WTKK (96.9 FM; BOSTON, MA; Owner: GREATER BOSTON RADIO, INC.)
WROR-FM (105.7 FM; FRAMINGHAM, MA; Owner: GREATER BOSTON RADIO, INC.)
WBOS (92.9 FM; BROOKLINE, MA; Owner: GREATER BOSTON RADIO, INC.)
WGBH (89.7 FM; BOSTON, MA; Owner: WGBH EDUCATIONAL FOUNDATION)
WBUR-FM (90.9 FM; BOSTON, MA; Owner: TRUSTEES OF BOSTON UNIVERSITY)
WXKS-FM (107.9 FM; MEDFORD, MA; Owner: AMFM RADIO LICENSES, L.L.C.)
WGIR-FM (101.1 FM; MANCHESTER, NH; Owner: CAPSTAR TX LIMITED PARTNERSHIP)
WMJX (106.7 FM; BOSTON, MA; Owner: GREATER BOSTON RADIO, INC.)
WQLL (96.5 FM; BEDFORD, NH; Owner: SAGA COMMUNICATIONS OF NEW ENGLAND, LLC)
WLMW (90.7 FM; MANCHESTER, NH; Owner: KNOWLEDGE FOR LIFE)
WODS (103.3 FM; BOSTON, MA; Owner: INFINITY BROADCASTING OPERATIONS, INC.)
WZID (95.7 FM; MANCHESTER, NH; Owner: SAGA COMMUNICATIONS OF NEW ENGLAND, LLC)
WINQ (97.7 FM; WINCHENDON, MA; Owner: SAGA COMMUNICATIONS OF NEW ENGLAND, LLC)
TV broadcast stations around Leominster:
WUNI (Channel 27; WORCESTER, MA; Owner: ENTRAVISION HOLDINGS, LLC)
WUTF (Channel 66; MARLBOROUGH, MA; Owner: TELEFUTURA BOSTON LLC)
WCVB-TV (Channel 5; BOSTON, MA; Owner: WCVB HEARST-ARGYLE TV, INC.)
WGBH-TV (Channel 2; BOSTON, MA; Owner: WGBH EDUCATIONAL FOUNDATION)
WHDH-TV (Channel 7; BOSTON, MA; Owner: WHDH-TV)
WMFP (Channel 62; LAWRENCE, MA; Owner: WSAH LICENSE, INC.)
WBZ-TV (Channel 4; BOSTON, MA; Owner: VIACOM INC.)
WGBX-TV (Channel 44; BOSTON, MA; Owner: WGBH EDUCATIONAL FOUNDATION)
WSBK-TV (Channel 38; BOSTON, MA; Owner: VIACOM INC.)
WLVI-TV (Channel 56; CAMBRIDGE, MA; Owner: WLVI, INC.)
WFXT (Channel 25; BOSTON, MA; Owner: FOX TELEVISION STATIONS INC.)
WYDN (Channel 48; WORCESTER, MA; Owner: EDUCATIONAL PUBLIC TV CORPORATION)
W40BO (Channel 40; BOSTON, MA; Owner: PAXSON COMMUNICATIONS LPTV, INC.)
WBPX (Channel 68; BOSTON, MA; Owner: PAXSON BOSTON-68 LICENSE, INC.)
WFXZ-CA (Channel 24; BOSTON, MA; Owner: BOSTON BROADCASTING CORP.)
WNDS (Channel 50; DERRY, NH; Owner: CTV OF DERRY, INC)
WTMU-LP (Channel 32; BOSTON, MA; Owner: ZGS BOSTON, INC.)
WCEA-LP (Channel 58; BOSTON, MA; Owner: CHANNEL 19 TV CORPORATION)
WCRN-LP (Channel 34; LEICESTER, MA; Owner: CARTER BROADCASTING CORPORATION)
National Bridge Inventory (NBI) Statistics 48 Number of bridges427ft / 130m Total length $96,375,000 Total costs702,208 Total average daily traffic42,222 Total average daily truck traffic
New bridges - historical statistics
4 Before 1900 3 1900-1909 3 1930-1939 10 1940-1949 5 1950-1959 1 1960-1969 15 1970-1979 2 1980-1989 1 1990-1999 2 2000-2009 2 2010-2019
See full National Bridge Inventory statistics for Leominster, MA
Home Mortgage Disclosure Act Aggregated Statistics For Year 2009(Based on 8 full tracts) A) FHA, FSA/RHS & VA B) Conventional C) Refinancings D) Home Improvement Loans E) Loans on Dwellings For 5+ Families F) Non-occupant Loans on G) Loans On Manufactured Number Average Value Number Average Value Number Average Value Number Average Value Number Average Value Number Average Value Number Average Value
LOANS ORIGINATED 144 $190,986 185 $141,816 798 $179,990 79 $63,468 6 $3,778,167 34 $140,794 6 $79,500 APPLICATIONS APPROVED, NOT ACCEPTED 5 $161,400 14 $143,214 38 $194,842 11 $16,000 0 $0 2 $85,500 3 $51,667 APPLICATIONS DENIED 19 $195,000 25 $138,080 268 $204,996 25 $73,480 1 $7,000,000 19 $138,421 2 $54,000 APPLICATIONS WITHDRAWN 14 $216,214 22 $180,045 155 $192,323 1 $10,000 0 $0 11 $163,909 2 $110,000 FILES CLOSED FOR INCOMPLETENESS 4 $213,750 7 $151,857 76 $202,829 3 $25,000 0 $0 5 $168,200 0 $0
Aggregated Statistics For Year 2008(Based on 8 full tracts) A) FHA, FSA/RHS & VA B) Conventional C) Refinancings D) Home Improvement Loans E) Loans on Dwellings For 5+ Families F) Non-occupant Loans on G) Loans On Manufactured Number Average Value Number Average Value Number Average Value Number Average Value Number Average Value Number Average Value Number Average Value
LOANS ORIGINATED 108 $199,722 219 $176,005 405 $184,173 92 $52,533 6 $476,833 63 $184,492 11 $51,818 APPLICATIONS APPROVED, NOT ACCEPTED 12 $184,917 21 $176,524 47 $163,660 21 $67,333 0 $0 6 $128,833 2 $60,000 APPLICATIONS DENIED 29 $206,931 37 $177,459 224 $209,067 46 $46,391 1 $520,000 18 $143,722 3 $40,000 APPLICATIONS WITHDRAWN 11 $187,182 27 $156,296 103 $204,214 6 $92,667 0 $0 3 $184,000 0 $0 FILES CLOSED FOR INCOMPLETENESS 2 $154,000 11 $189,182 55 $208,218 3 $239,333 0 $0 2 $255,000 0 $0
Aggregated Statistics For Year 2007(Based on 8 full tracts) A) FHA, FSA/RHS & VA B) Conventional C) Refinancings D) Home Improvement Loans E) Loans on Dwellings For 5+ Families F) Non-occupant Loans on G) Loans On Manufactured Number Average Value Number Average Value Number Average Value Number Average Value Number Average Value Number Average Value Number Average Value
LOANS ORIGINATED 22 $218,364 440 $163,450 597 $174,437 157 $70,038 23 $291,913 54 $166,056 10 $61,200 APPLICATIONS APPROVED, NOT ACCEPTED 1 $320,000 38 $170,237 91 $194,187 39 $68,436 1 $1,600,000 7 $225,286 4 $35,000 APPLICATIONS DENIED 5 $218,800 65 $161,108 472 $212,184 73 $78,726 2 $355,000 26 $163,423 2 $33,500 APPLICATIONS WITHDRAWN 4 $283,500 49 $169,918 218 $183,482 9 $155,000 1 $345,000 16 $130,625 2 $135,500 FILES CLOSED FOR INCOMPLETENESS 0 $0 9 $175,667 75 $201,307 4 $114,500 2 $388,000 2 $223,000 1 $61,000
Aggregated Statistics For Year 2006(Based on 8 full tracts) A) FHA, FSA/RHS & VA B) Conventional C) Refinancings D) Home Improvement Loans E) Loans on Dwellings For 5+ Families F) Non-occupant Loans on G) Loans On Manufactured Number Average Value Number Average Value Number Average Value Number Average Value Number Average Value Number Average Value Number Average Value
LOANS ORIGINATED 15 $246,133 545 $160,284 956 $174,698 212 $79,863 15 $587,533 84 $165,345 7 $50,000 APPLICATIONS APPROVED, NOT ACCEPTED 0 $0 53 $156,019 152 $172,079 26 $57,654 5 $581,600 8 $188,625 2 $37,000 APPLICATIONS DENIED 3 $273,000 150 $142,327 566 $203,574 121 $89,826 3 $348,667 39 $125,821 3 $40,667 APPLICATIONS WITHDRAWN 0 $0 64 $182,125 368 $203,166 20 $98,450 4 $622,250 15 $158,133 2 $42,500 FILES CLOSED FOR INCOMPLETENESS 0 $0 20 $156,400 122 $219,221 7 $93,429 1 $800,000 4 $135,750 0 $0
Aggregated Statistics For Year 2005(Based on 8 full tracts) A) FHA, FSA/RHS & VA B) Conventional C) Refinancings D) Home Improvement Loans E) Loans on Dwellings For 5+ Families F) Non-occupant Loans on G) Loans On Manufactured Number Average Value Number Average Value Number Average Value Number Average Value Number Average Value Number Average Value Number Average Value
LOANS ORIGINATED 39 $237,667 798 $163,277 1,173 $182,086 165 $100,642 13 $251,846 93 $171,075 12 $74,500 APPLICATIONS APPROVED, NOT ACCEPTED 2 $202,500 68 $160,721 115 $175,357 13 $53,154 1 $319,000 5 $154,400 4 $42,750 APPLICATIONS DENIED 4 $206,750 131 $140,183 489 $196,644 69 $83,087 1 $1,460,000 26 $170,385 7 $92,000 APPLICATIONS WITHDRAWN 1 $341,000 113 $149,027 423 $187,983 55 $183,291 5 $282,600 15 $188,267 0 $0 FILES CLOSED FOR INCOMPLETENESS 0 $0 61 $174,885 176 $206,591 4 $162,500 0 $0 12 $256,500 1 $70,000
Aggregated Statistics For Year 2004(Based on 8 full tracts) A) FHA, FSA/RHS & VA B) Conventional C) Refinancings D) Home Improvement Loans E) Loans on Dwellings For 5+ Families F) Non-occupant Loans on G) Loans On Manufactured Number Average Value Number Average Value Number Average Value Number Average Value Number Average Value Number Average Value Number Average Value
LOANS ORIGINATED 45 $218,244 735 $168,773 1,150 $175,227 173 $93,514 15 $780,000 98 $158,286 11 $68,455 APPLICATIONS APPROVED, NOT ACCEPTED 4 $217,000 61 $172,738 170 $179,988 24 $50,375 2 $312,500 12 $177,583 8 $68,375 APPLICATIONS DENIED 9 $236,667 117 $155,385 396 $175,995 95 $54,716 3 $126,667 21 $186,286 10 $62,500 APPLICATIONS WITHDRAWN 2 $186,000 64 $165,422 390 $174,090 29 $68,103 3 $2,652,000 15 $148,667 0 $0 FILES CLOSED FOR INCOMPLETENESS 0 $0 25 $139,960 225 $187,791 13 $144,692 0 $0 10 $146,000 1 $158,000
Aggregated Statistics For Year 2003(Based on 8 full tracts) A) FHA, FSA/RHS & VA B) Conventional C) Refinancings D) Home Improvement Loans E) Loans on Dwellings For 5+ Families F) Non-occupant Loans on Number Average Value Number Average Value Number Average Value Number Average Value Number Average Value Number Average Value
LOANS ORIGINATED 75 $200,413 645 $167,442 2,920 $144,273 71 $41,155 11 $290,455 106 $145,349 APPLICATIONS APPROVED, NOT ACCEPTED 0 $0 55 $170,236 268 $154,955 24 $39,833 1 $160,000 9 $141,111 APPLICATIONS DENIED 11 $208,727 61 $151,295 558 $158,125 58 $25,379 2 $154,000 29 $138,621 APPLICATIONS WITHDRAWN 6 $170,833 61 $173,164 409 $147,093 23 $39,391 1 $255,000 9 $118,556 FILES CLOSED FOR INCOMPLETENESS 4 $211,000 13 $144,692 66 $152,091 0 $0 0 $0 2 $90,000
Aggregated Statistics For Year 2002(Based on 6 full tracts) A) FHA, FSA/RHS & VA B) Conventional C) Refinancings D) Home Improvement Loans E) Loans on Dwellings For 5+ Families F) Non-occupant Loans on Number Average Value Number Average Value Number Average Value Number Average Value Number Average Value Number Average Value
LOANS ORIGINATED 73 $161,493 525 $136,156 1,520 $146,611 89 $33,472 6 $215,167 73 $116,384 APPLICATIONS APPROVED, NOT ACCEPTED 7 $139,000 37 $143,297 155 $129,548 23 $27,565 0 $0 4 $85,000 APPLICATIONS DENIED 11 $165,909 28 $126,036 238 $124,080 38 $29,921 0 $0 11 $79,818 APPLICATIONS WITHDRAWN 8 $173,625 47 $166,213 234 $126,423 17 $45,529 1 $112,000 5 $132,800 FILES CLOSED FOR INCOMPLETENESS 0 $0 5 $185,800 43 $129,256 2 $25,000 0 $0 1 $125,000
Aggregated Statistics For Year 2001(Based on 6 full tracts) A) FHA, FSA/RHS & VA B) Conventional C) Refinancings D) Home Improvement Loans E) Loans on Dwellings For 5+ Families F) Non-occupant Loans on Number Average Value Number Average Value Number Average Value Number Average Value Number Average Value Number Average Value
LOANS ORIGINATED 120 $139,508 432 $140,132 1,231 $128,902 79 $32,886 4 $589,750 42 $107,048 APPLICATIONS APPROVED, NOT ACCEPTED 7 $120,571 60 $97,717 113 $115,460 24 $31,000 0 $0 12 $85,500 APPLICATIONS DENIED 6 $155,500 46 $114,435 241 $106,436 59 $24,051 3 $258,333 6 $89,333 APPLICATIONS WITHDRAWN 9 $139,667 27 $130,519 230 $113,183 32 $29,062 4 $571,500 4 $135,000 FILES CLOSED FOR INCOMPLETENESS 0 $0 4 $130,500 30 $118,467 1 $71,000 0 $0 2 $179,000
Aggregated Statistics For Year 2000(Based on 6 full tracts) A) FHA, FSA/RHS & VA B) Conventional C) Refinancings D) Home Improvement Loans E) Loans on Dwellings For 5+ Families F) Non-occupant Loans on Number Average Value Number Average Value Number Average Value Number Average Value Number Average Value Number Average Value
LOANS ORIGINATED 114 $124,211 389 $116,123 268 $102,332 87 $22,862 2 $162,500 25 $109,040 APPLICATIONS APPROVED, NOT ACCEPTED 5 $131,000 34 $115,353 58 $83,190 31 $29,645 1 $180,000 1 $92,000 APPLICATIONS DENIED 8 $115,250 37 $104,865 132 $76,394 72 $28,125 0 $0 3 $67,000 APPLICATIONS WITHDRAWN 8 $117,375 18 $103,778 132 $84,886 10 $43,500 0 $0 6 $120,500 FILES CLOSED FOR INCOMPLETENESS 2 $91,500 5 $110,800 17 $98,588 1 $7,000 0 $0 0 $0
Aggregated Statistics For Year 1999(Based on 8 full tracts) A) FHA, FSA/RHS & VA B) Conventional C) Refinancings D) Home Improvement Loans E) Loans on Dwellings For 5+ Families F) Non-occupant Loans on Number Average Value Number Average Value Number Average Value Number Average Value Number Average Value Number Average Value
LOANS ORIGINATED 148 $113,752 449 $112,887 673 $92,296 89 $19,843 6 $2,211,220 41 $80,999 APPLICATIONS APPROVED, NOT ACCEPTED 11 $106,672 27 $111,138 90 $96,005 20 $12,988 0 $0 6 $103,117 APPLICATIONS DENIED 14 $116,462 53 $102,894 189 $79,896 69 $28,087 0 $0 13 $72,799 APPLICATIONS WITHDRAWN 9 $108,869 33 $102,004 205 $88,013 20 $64,582 1 $103,680 2 $77,915 FILES CLOSED FOR INCOMPLETENESS 2 $95,670 7 $112,009 41 $107,491 4 $16,208 0 $0 1 $61,650
Detailed HMDA statistics for the following Tracts:
7091.00
, 7092.01 , 7092.02 , 7094.00 , 7095.00 , 7096.00 , 7097.01 , 7097.02
Private Mortgage Insurance Companies Aggregated Statistics For Year 2009(Based on 8 full tracts) A) Conventional B) Refinancings Number Average Value Number Average Value
LOANS ORIGINATED 26 $181,308 19 $232,579 APPLICATIONS APPROVED, NOT ACCEPTED 10 $173,700 15 $233,133 APPLICATIONS DENIED 4 $98,500 10 $281,100 APPLICATIONS WITHDRAWN 1 $152,000 2 $228,000 FILES CLOSED FOR INCOMPLETENESS 0 $0 0 $0
Aggregated Statistics For Year 2008(Based on 8 full tracts) A) Conventional B) Refinancings C) Non-occupant Loans on Number Average Value Number Average Value Number Average Value
LOANS ORIGINATED 80 $205,725 41 $248,659 1 $140,000 APPLICATIONS APPROVED, NOT ACCEPTED 18 $189,778 33 $249,515 0 $0 APPLICATIONS DENIED 10 $182,700 17 $232,294 4 $244,000 APPLICATIONS WITHDRAWN 3 $226,667 5 $255,800 0 $0 FILES CLOSED FOR INCOMPLETENESS 0 $0 1 $175,000 0 $0
Aggregated Statistics For Year 2007(Based on 8 full tracts) A) Conventional B) Refinancings C) Non-occupant Loans on Number Average Value Number Average Value Number Average Value
LOANS ORIGINATED 113 $219,354 74 $234,527 0 $0 APPLICATIONS APPROVED, NOT ACCEPTED 13 $191,615 17 $275,882 1 $68,000 APPLICATIONS DENIED 1 $220,000 0 $0 0 $0 APPLICATIONS WITHDRAWN 2 $146,500 11 $280,273 2 $198,000 FILES CLOSED FOR INCOMPLETENESS 0 $0 1 $207,000 0 $0
Aggregated Statistics For Year 2006(Based on 8 full tracts) A) Conventional B) Refinancings C) Non-occupant Loans on Number Average Value Number Average Value Number Average Value
LOANS ORIGINATED 76 $214,395 39 $253,641 4 $219,000 APPLICATIONS APPROVED, NOT ACCEPTED 10 $190,700 13 $270,385 3 $213,667 APPLICATIONS DENIED 1 $194,000 2 $227,000 0 $0 APPLICATIONS WITHDRAWN 3 $209,667 2 $236,500 0 $0 FILES CLOSED FOR INCOMPLETENESS 1 $295,000 0 $0 0 $0
Aggregated Statistics For Year 2005(Based on 8 full tracts) A) Conventional B) Refinancings C) Non-occupant Loans on Number Average Value Number Average Value Number Average Value
LOANS ORIGINATED 119 $210,521 51 $228,922 8 $226,500 APPLICATIONS APPROVED, NOT ACCEPTED 17 $225,353 16 $237,562 2 $176,000 APPLICATIONS DENIED 2 $182,500 1 $190,000 0 $0 APPLICATIONS WITHDRAWN 2 $187,500 2 $212,500 0 $0 FILES CLOSED FOR INCOMPLETENESS 4 $255,000 0 $0 1 $238,000
Aggregated Statistics For Year 2004(Based on 8 full tracts) A) Conventional B) Refinancings C) Non-occupant Loans on Number Average Value Number Average Value Number Average Value
LOANS ORIGINATED 122 $209,885 49 $210,755 4 $276,000 APPLICATIONS APPROVED, NOT ACCEPTED 34 $191,824 23 $209,783 0 $0 APPLICATIONS DENIED 3 $273,000 3 $189,667 0 $0 APPLICATIONS WITHDRAWN 5 $161,200 4 $154,500 0 $0 FILES CLOSED FOR INCOMPLETENESS 1 $356,000 1 $270,000 0 $0
Aggregated Statistics For Year 2003(Based on 8 full tracts) A) Conventional B) Refinancings C) Non-occupant Loans on Number Average Value Number Average Value Number Average Value
LOANS ORIGINATED 176 $186,625 100 $189,030 4 $180,000 APPLICATIONS APPROVED, NOT ACCEPTED 23 $180,391 40 $184,025 2 $159,500 APPLICATIONS DENIED 6 $137,667 0 $0 1 $76,000 APPLICATIONS WITHDRAWN 8 $169,375 6 $186,333 0 $0 FILES CLOSED FOR INCOMPLETENESS 0 $0 2 $202,500 0 $0
Aggregated Statistics For Year 2002(Based on 6 full tracts) A) Conventional B) Refinancings C) Non-occupant Loans on Number Average Value Number Average Value Number Average Value
LOANS ORIGINATED 185 $157,622 55 $178,527 12 $150,833 APPLICATIONS APPROVED, NOT ACCEPTED 34 $128,824 28 $145,500 1 $122,000 APPLICATIONS DENIED 3 $165,333 2 $197,500 0 $0 APPLICATIONS WITHDRAWN 3 $138,667 3 $210,000 0 $0 FILES CLOSED FOR INCOMPLETENESS 0 $0 0 $0 0 $0
Aggregated Statistics For Year 2001(Based on 6 full tracts) A) Conventional B) Refinancings C) Non-occupant Loans on Number Average Value Number Average Value Number Average Value
LOANS ORIGINATED 177 $148,198 86 $147,686 11 $118,818 APPLICATIONS APPROVED, NOT ACCEPTED 22 $149,773 19 $143,684 0 $0 APPLICATIONS DENIED 3 $248,667 2 $149,000 0 $0 APPLICATIONS WITHDRAWN 2 $156,500 2 $148,500 0 $0 FILES CLOSED FOR INCOMPLETENESS 0 $0 0 $0 0 $0
Aggregated Statistics For Year 2000(Based on 6 full tracts) A) Conventional B) Refinancings C) Non-occupant Loans on Number Average Value Number Average Value Number Average Value
LOANS ORIGINATED 144 $132,806 19 $129,789 6 $100,167 APPLICATIONS APPROVED, NOT ACCEPTED 14 $130,143 4 $105,750 0 $0 APPLICATIONS DENIED 3 $89,667 0 $0 1 $99,000 APPLICATIONS WITHDRAWN 5 $147,400 1 $154,000 1 $104,000 FILES CLOSED FOR INCOMPLETENESS 1 $84,000 0 $0 0 $0
Aggregated Statistics For Year 1999(Based on 8 full tracts) A) Conventional B) Refinancings C) Non-occupant Loans on Number Average Value Number Average Value Number Average Value
LOANS ORIGINATED 177 $125,127 67 $117,020 4 $97,348 APPLICATIONS APPROVED, NOT ACCEPTED 15 $128,379 15 $119,461 1 $97,000 APPLICATIONS DENIED 8 $120,870 4 $117,838 2 $113,480 APPLICATIONS WITHDRAWN 7 $123,994 3 $110,850 2 $113,480 FILES CLOSED FOR INCOMPLETENESS 3 $162,197 0 $0 0 $0
Detailed PMIC statistics for the following Tracts:
7091.00
, 7092.01 , 7092.02 , 7094.00 , 7095.00 , 7096.00 , 7097.01 , 7097.02 Leominster compared to Massachusetts state average:
Median house value below state average. Unemployed percentage significantly below state average. Length of stay since moving in significantly above state average. Leominster on our top lists :
#70 on the list of "Top 101 cities with the most residents born in Other Central America (population 500+)"
#83 (01453) on the list of "Top 101 zip codes with the largest percentage of French Canadian first ancestries (pop 5,000+)"
#4 on the list of "Top 101 counties with the highest carbon monoxide air pollution readings in 2012 (ppm)"
#5 on the list of "Top 101 counties with the most Catholic congregations"
#12 on the list of "Top 101 counties with the highest surface withdrawal of fresh water for public supply"
#16 on the list of "Top 101 counties with the highest total withdrawal of fresh water for public supply"
#23 on the list of "Top 101 counties with the highest Sulfur Oxides Annual air pollution readings in 2012 (µg/m3 )"
Top Patent Applicants
Robert Charles Uschold (21)
Matthew C. Bromberg (20)
Thomas Parsons (12)
Jeffrey M. Peters (10)
Robert J. Krupa (9)
John C. Barnwell, Iii (8)
Stephen Craig Weldon (7)
Joseph D. Antocci (6)
Kevin Beverage (6)
William T. Clark (6)
Total of 289 patent applications in 2008-2024.
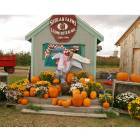
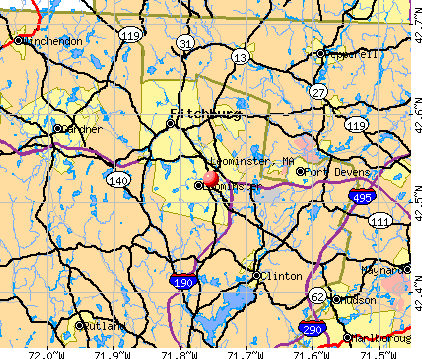


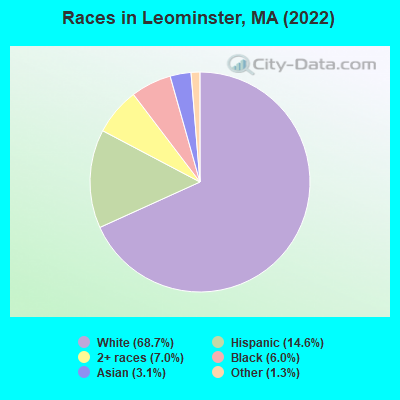
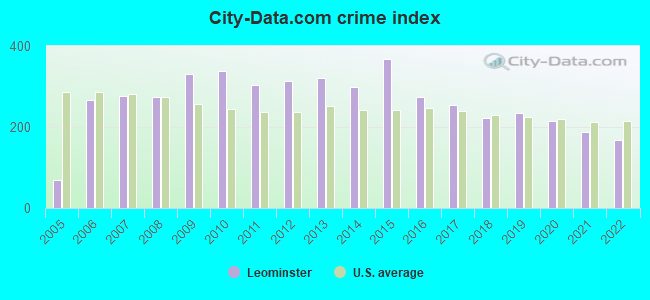
 Recent articles from our blog. Our writers, many of them Ph.D. graduates or candidates, create easy-to-read articles on a wide variety of topics.

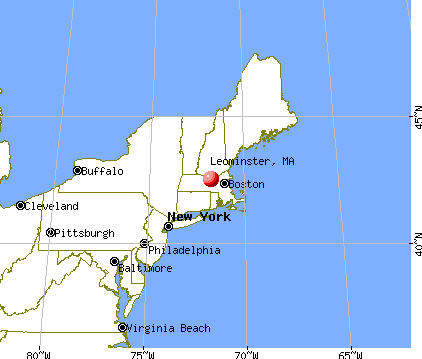
 (18.0 miles
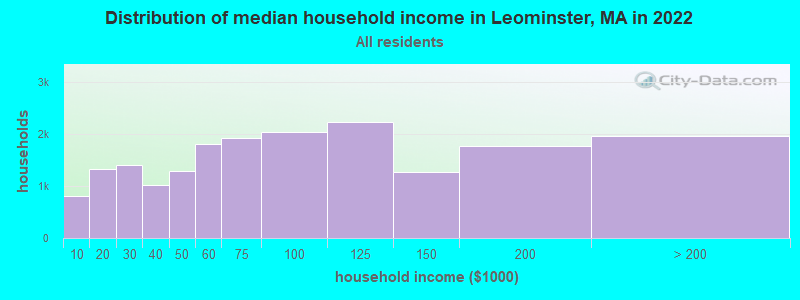
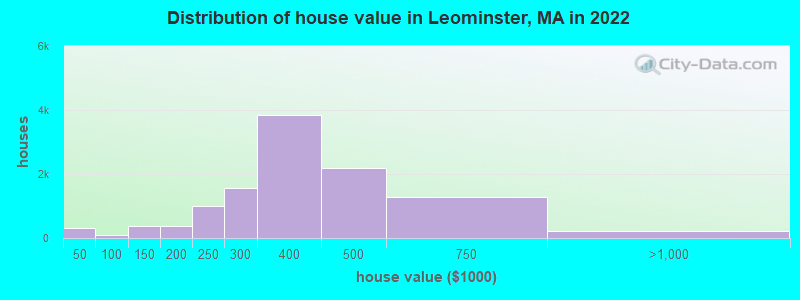
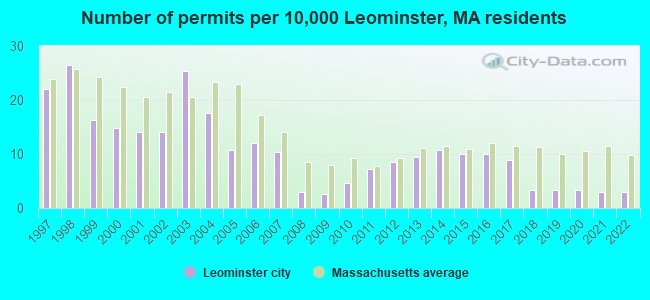
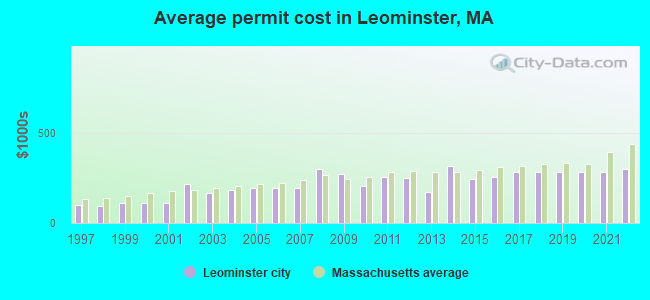
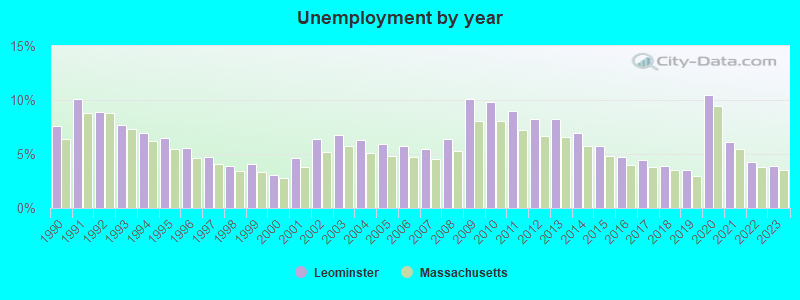
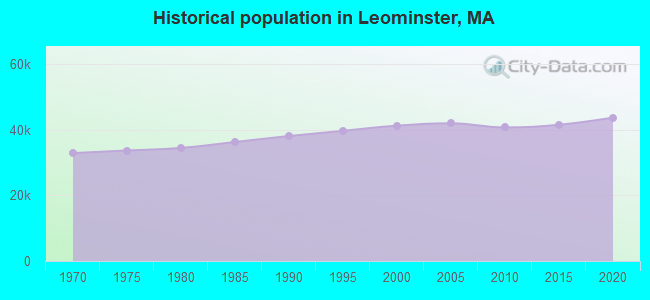
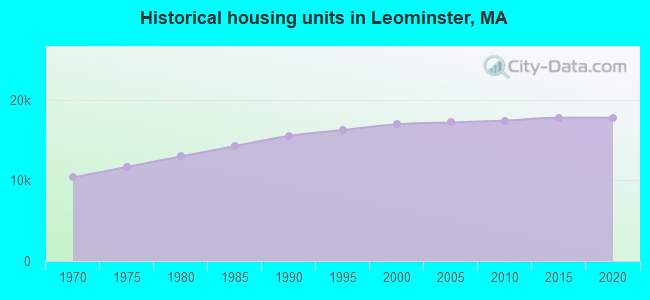
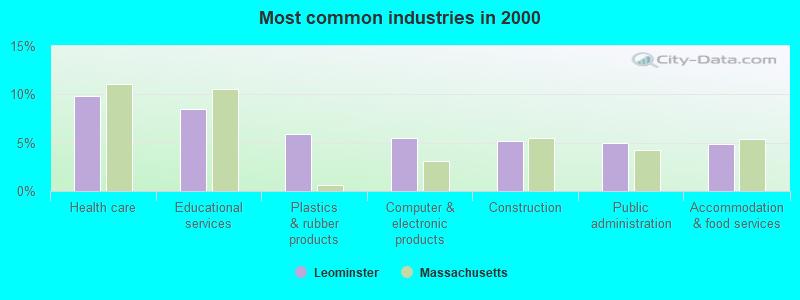
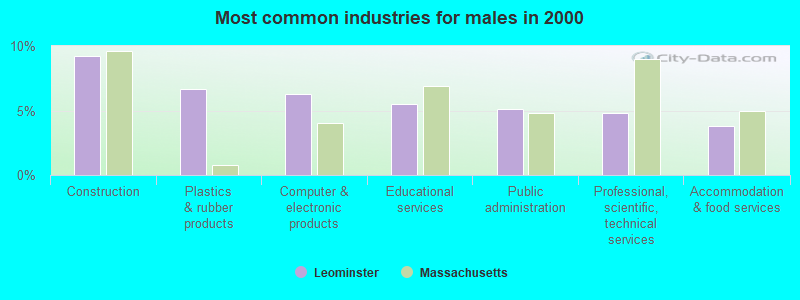
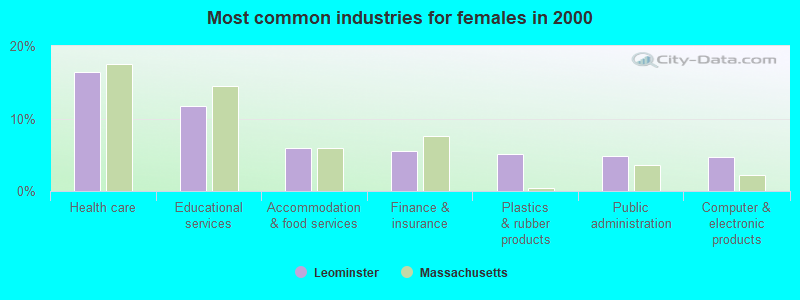
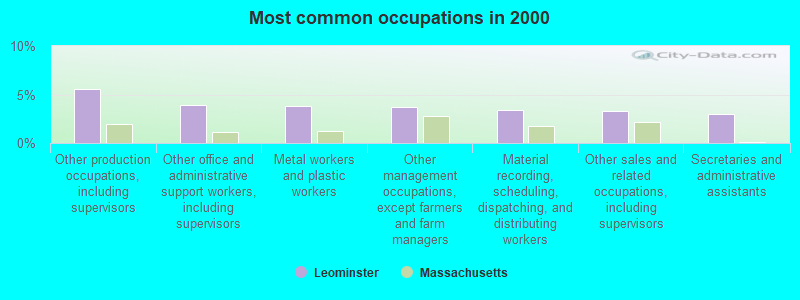
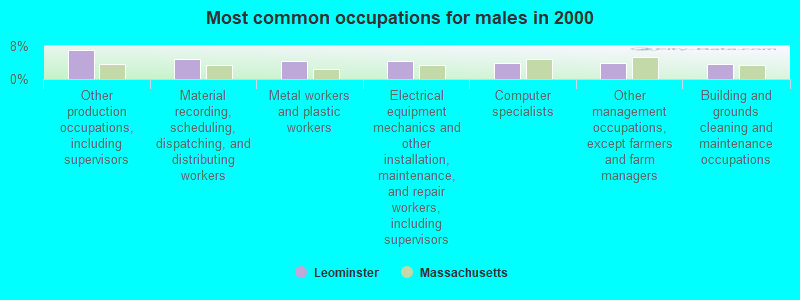
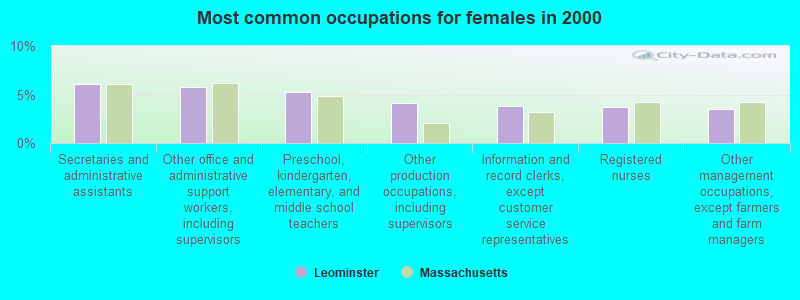
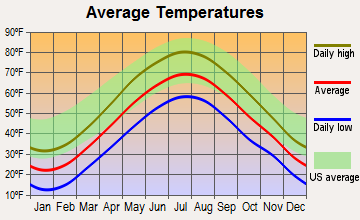
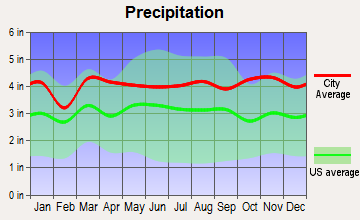
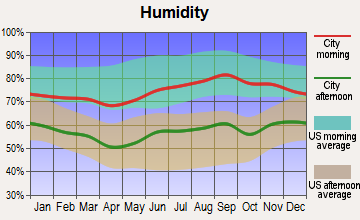
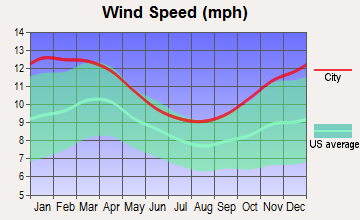
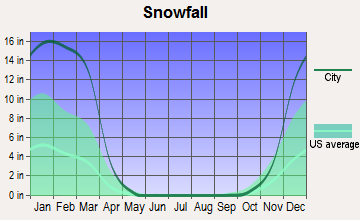
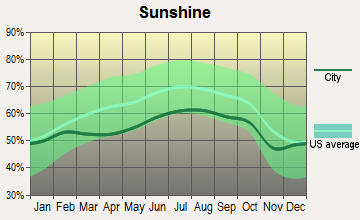
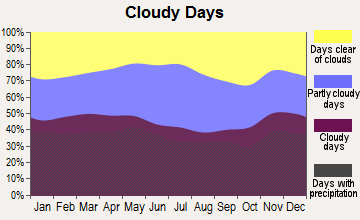
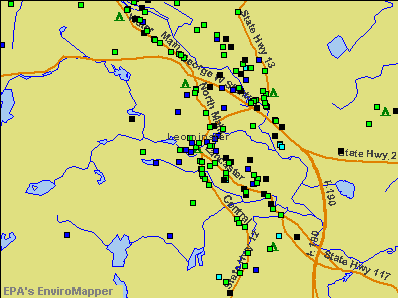

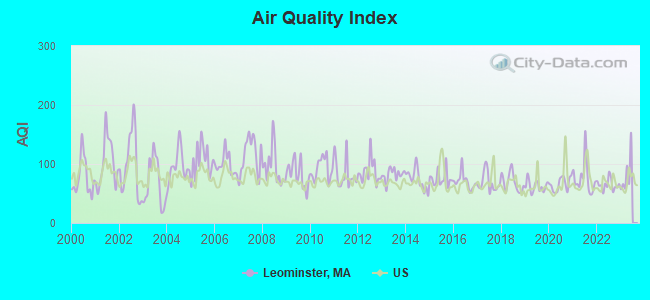
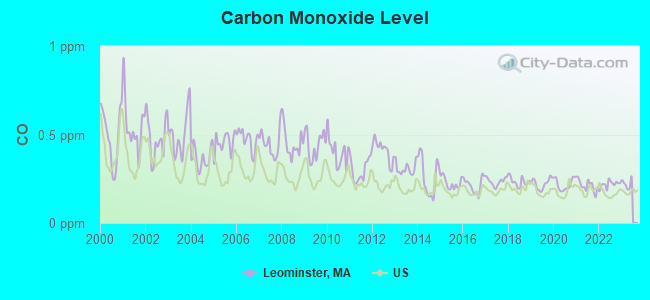
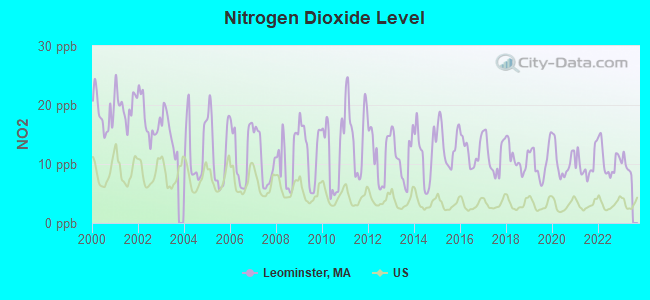
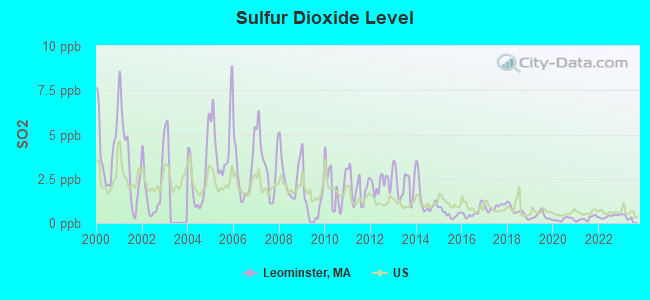
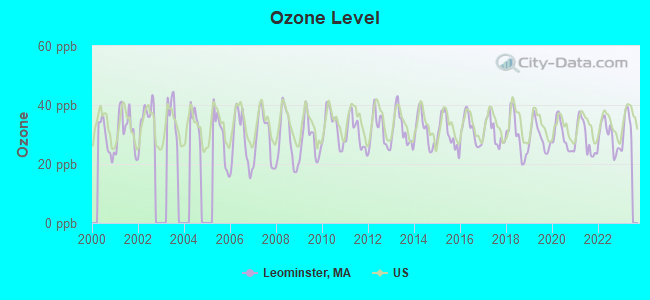
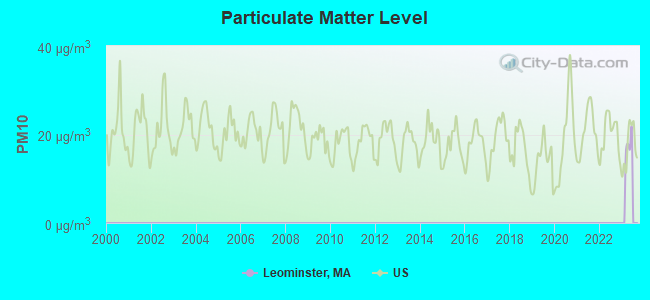
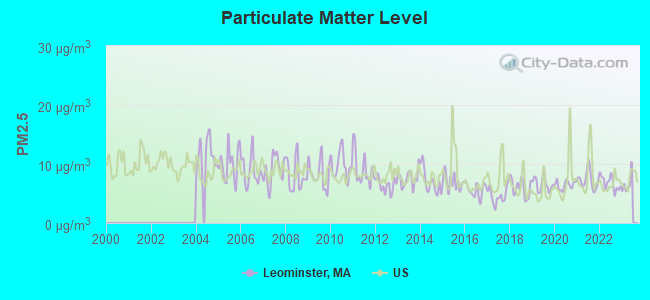
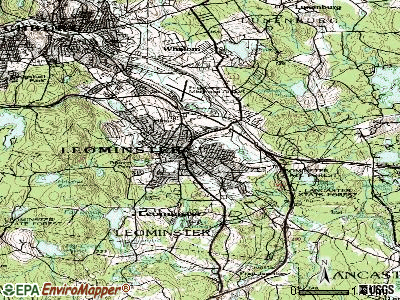
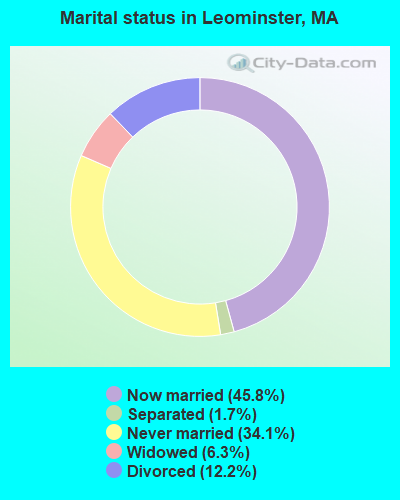
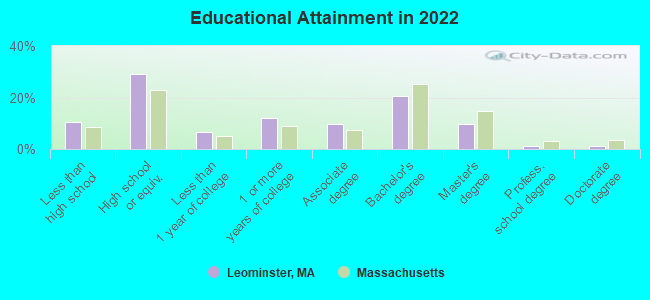
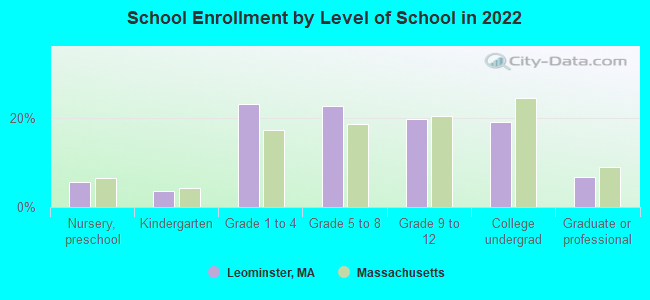
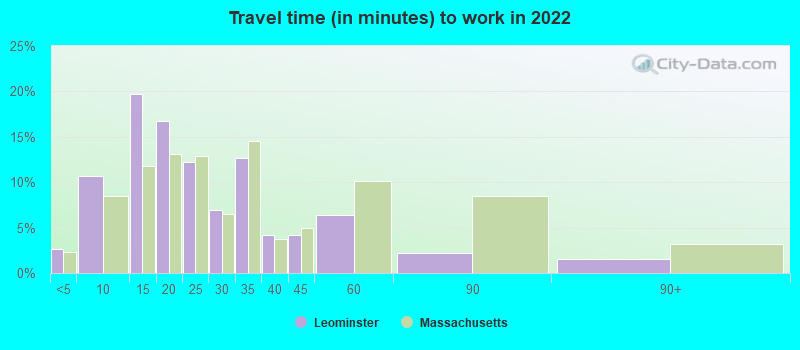
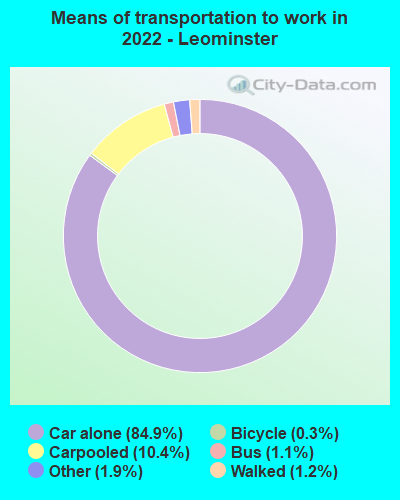
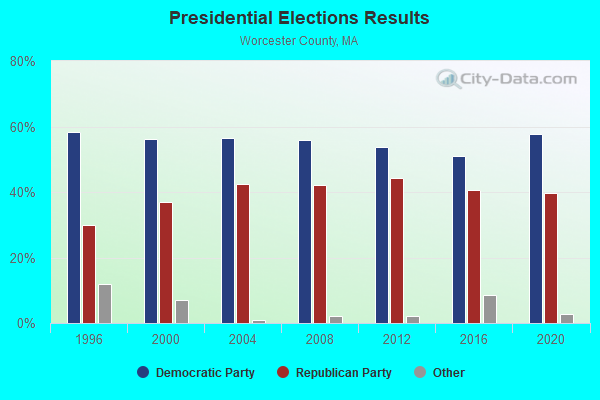
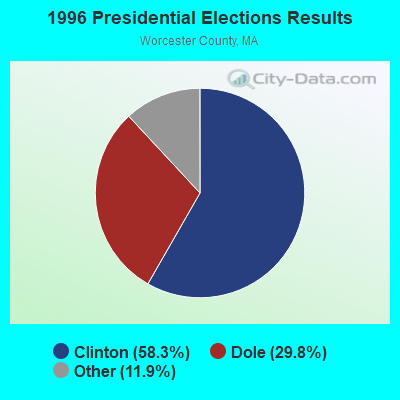
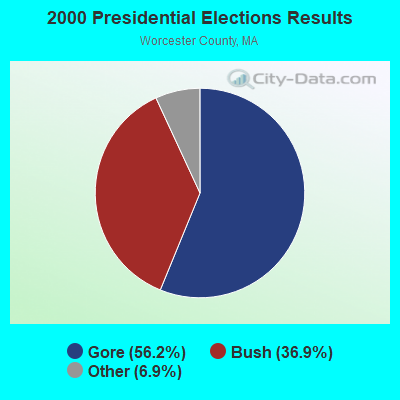
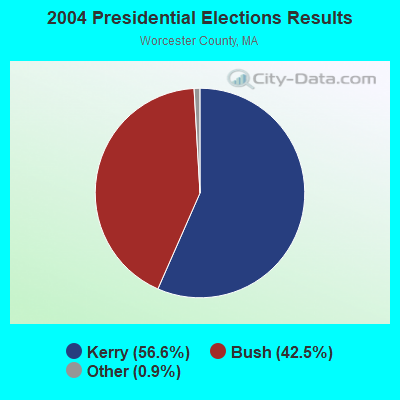

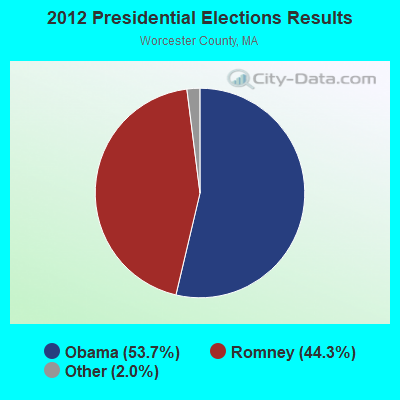
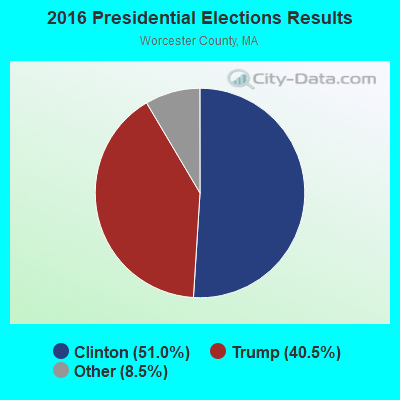
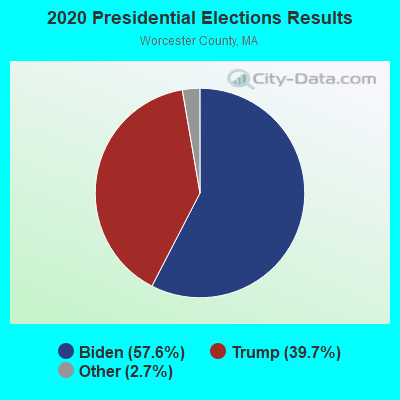
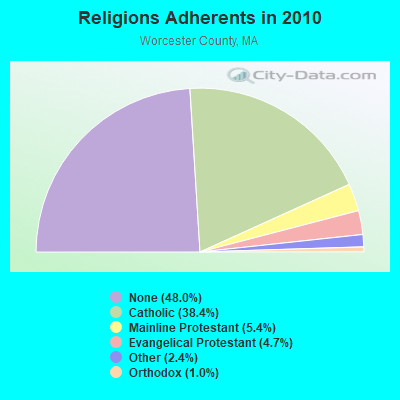
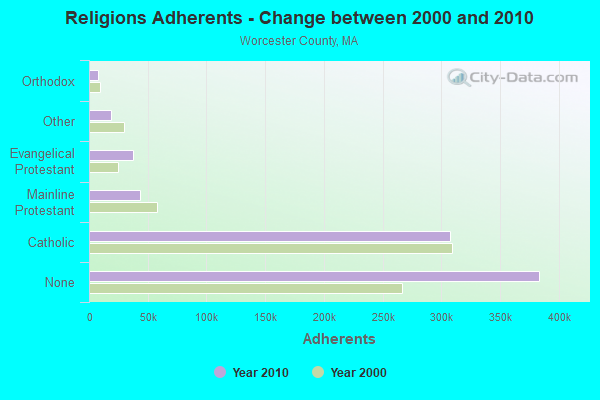
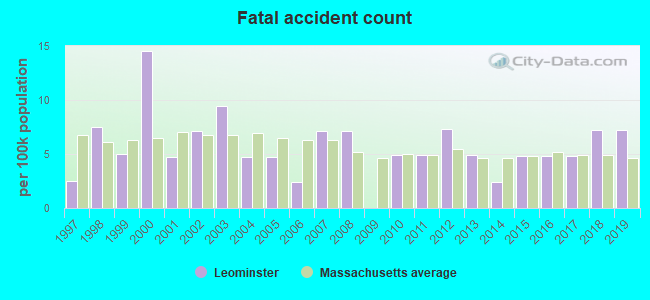
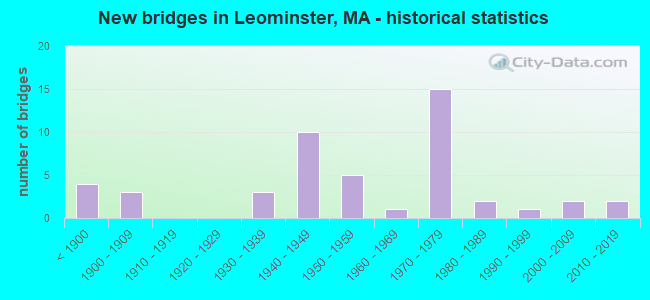
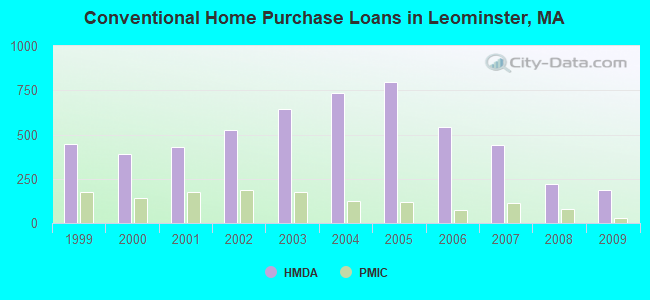
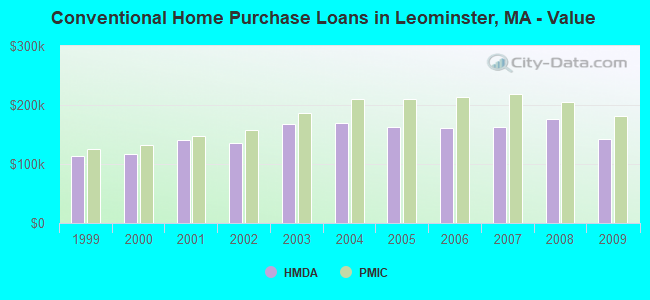
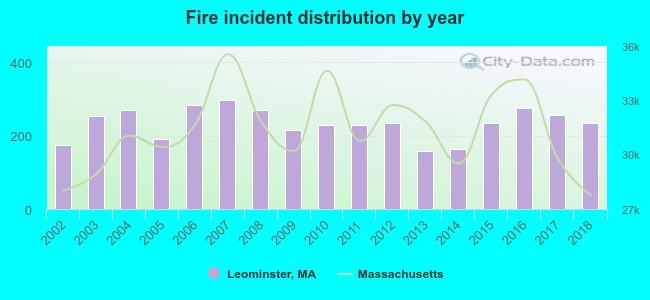 Based on the data from the years 2002 - 2018 the average number of fires per year is 233. The highest number of fire incidents - 296 took place in 2007, and the least - 157 in 2013. The data has a growing trend.
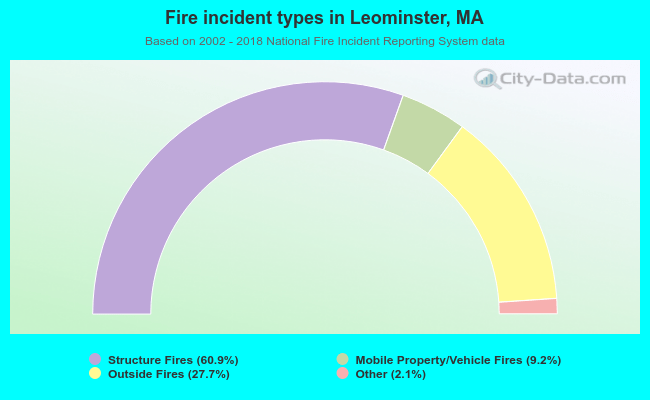 When looking into fire subcategories, the most reports belonged to: Structure Fires (60.9%), and Outside Fires (27.7%).