Lincolnton, North Carolina

Lincolnton: on the lake

Lincolnton: Linconton NC, Sunset

Lincolnton: have you every seen gold at the end of the rainbow?

Lincolnton: Linconton NC, Sunset

Lincolnton: Linconton NC, Sunset

Lincolnton: Downtown Lincolnton - Winter carriage rides

Lincolnton: on the lake
- add
your
Submit your own pictures of this city and show them to the world
- OSM Map
- General Map
- Google Map
- MSN Map
Population change since 2000: +18.6%
 |
| Males: 5,890 | |
| Females: 5,928 |
| Median resident age: | 36.0 years |
| North Carolina median age: | 39.2 years |
Zip codes: 28092.
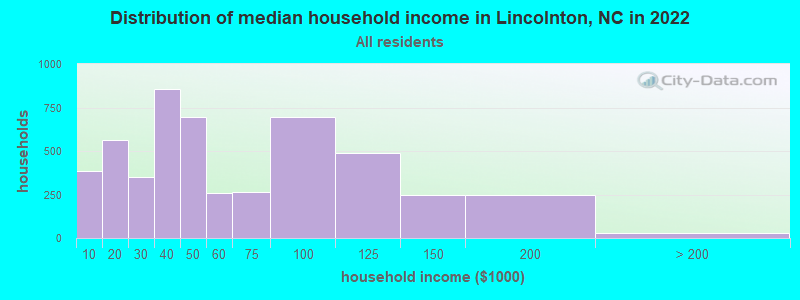
| Lincolnton: | $43,446 |
| NC: | $67,481 |
Estimated per capita income in 2022: $26,650 (it was $16,667 in 2000)
Lincolnton city income, earnings, and wages data
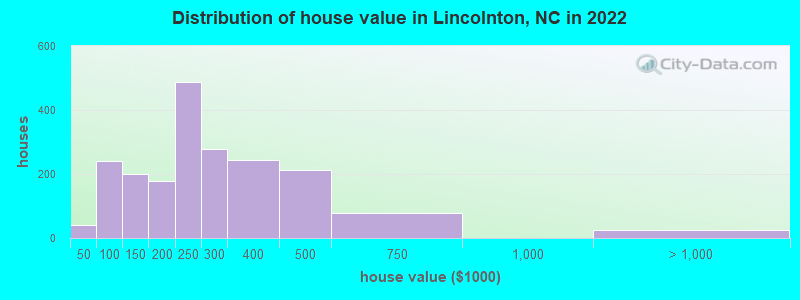
Estimated median house or condo value in 2022: $243,476 (it was $87,200 in 2000)
| Lincolnton: | $243,476 |
| NC: | $280,600 |
Median gross rent in 2022: $914.
(11.2% for White Non-Hispanic residents, 47.2% for Black residents, 10.3% for Hispanic or Latino residents, 3.0% for other race residents, 17.4% for two or more races residents)
Detailed information about poverty and poor residents in Lincolnton, NC


- 6,65658.0%White alone
- 2,30820.1%Black alone
- 1,99817.4%Hispanic
- 4383.8%Two or more races
- 520.5%Native Hawaiian and Other
Pacific Islander alone - 400.3%Asian alone
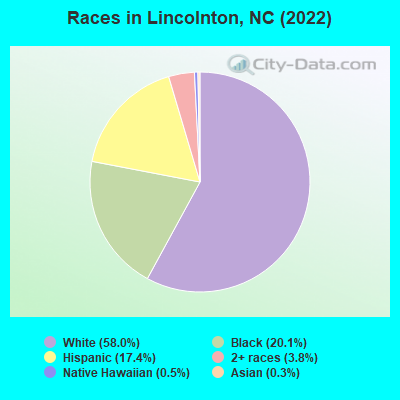
Races in Lincolnton detailed stats: ancestries, foreign born residents, place of birth
According to our research of North Carolina and other state lists, there were 103 registered sex offenders living in Lincolnton, North Carolina as of April 27, 2024.
The ratio of all residents to sex offenders in Lincolnton is 105 to 1.
Type |
2009 |
2010 |
2011 |
2012 |
2013 |
2014 |
2015 |
2016 |
2017 |
2018 |
2019 |
2020 |
2021 |
2022 |
|---|---|---|---|---|---|---|---|---|---|---|---|---|---|---|
| Murders (per 100,000) | 0 (0.0) | 0 (0.0) | 1 (9.4) | 3 (28.1) | 0 (0.0) | 1 (9.3) | 0 (0.0) | 0 (0.0) | 0 (0.0) | 2 (18.5) | 0 (0.0) | 1 (8.8) | 0 (0.0) | 1 (8.6) |
| Rapes (per 100,000) | 0 (0.0) | 0 (0.0) | 2 (18.8) | 1 (9.4) | 5 (46.8) | 6 (55.5) | 3 (27.8) | 1 (9.1) | 2 (18.5) | 2 (18.5) | 3 (27.2) | 5 (44.2) | 5 (43.0) | 7 (60.1) |
| Robberies (per 100,000) | 11 (100.5) | 14 (133.5) | 8 (75.3) | 11 (103.0) | 8 (74.9) | 8 (74.1) | 9 (83.4) | 7 (63.7) | 9 (83.2) | 6 (55.4) | 4 (36.3) | 2 (17.7) | 3 (25.8) | 4 (34.3) |
| Assaults (per 100,000) | 34 (310.7) | 16 (152.6) | 37 (348.4) | 23 (215.5) | 39 (365.0) | 36 (333.2) | 28 (259.5) | 27 (245.9) | 37 (341.9) | 21 (193.7) | 39 (353.8) | 48 (424.8) | 46 (395.2) | 32 (274.7) |
| Burglaries (per 100,000) | 164 (1,499) | 81 (772.5) | 107 (1,008) | 105 (983.6) | 71 (664.4) | 76 (703.5) | 51 (472.7) | 46 (418.9) | 48 (443.5) | 32 (295.2) | 53 (480.9) | 51 (451.3) | 61 (524.0) | 64 (549.3) |
| Thefts (per 100,000) | 478 (4,368) | 452 (4,311) | 442 (4,162) | 435 (4,075) | 449 (4,202) | 387 (3,582) | 336 (3,114) | 329 (2,996) | 304 (2,809) | 219 (2,020) | 281 (2,549) | 390 (3,451) | 387 (3,324) | 327 (2,807) |
| Auto thefts (per 100,000) | 13 (118.8) | 8 (76.3) | 13 (122.4) | 18 (168.6) | 12 (112.3) | 14 (129.6) | 19 (176.1) | 22 (200.3) | 17 (157.1) | 18 (166.1) | 21 (190.5) | 34 (300.9) | 48 (412.3) | 33 (283.2) |
| Arson (per 100,000) | 4 (36.5) | 0 (0.0) | 1 (9.4) | 6 (56.2) | 1 (9.4) | 3 (27.8) | 1 (9.3) | 5 (45.5) | 4 (37.0) | 2 (18.5) | 0 (0.0) | 1 (8.8) | 1 (8.6) | 4 (34.3) |
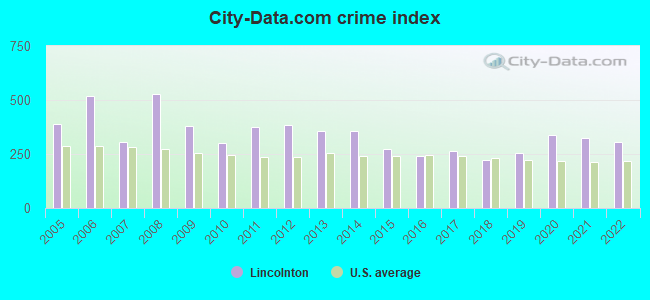
| City-Data.com crime index | 381.4 | 303.2 | 373.0 | 383.0 | 356.4 | 354.7 | 270.9 | 240.8 | 264.1 | 221.8 | 254.3 | 337.1 | 323.8 | 303.8 |
The City-Data.com crime index weighs serious crimes and violent crimes more heavily. Higher means more crime, U.S. average is 246.1. It adjusts for the number of visitors and daily workers commuting into cities.
Crime rate in Lincolnton detailed stats: murders, rapes, robberies, assaults, burglaries, thefts, arson
Full-time law enforcement employees in 2021, including police officers: 34 (31 officers - 26 male; 5 female).
| Officers per 1,000 residents here: | 2.66 |
| North Carolina average: | 2.27 |
 Recent articles from our blog. Our writers, many of them Ph.D. graduates or candidates, create easy-to-read articles on a wide variety of topics.

 | Water quality in Lincolnton NC - Fluoride? (2 replies) |
| Possible job opportunity in Lincolnton, NC (12 replies) |
| Mooresville, Gastonia, Pineville, Lincolnton, Monroe ranked most redneck (34 replies) |
| Please help us decide between Statesville & Lincolnton (17 replies) |
| US-74 Shelby Bypass (124 replies) |
| Looking for country living near Charlotte NC (15 replies) |
Latest news from Lincolnton, NC collected exclusively by city-data.com from local newspapers, TV, and radio stations
Lincolnton, NC City Guides:
Ancestries: English (7.9%), American (7.3%), German (6.2%), Swedish (4.3%), Irish (3.9%), Yugoslavian (3.5%).
Current Local Time: EST time zone
Elevation: 840 feet
Land area: 8.17 square miles.
Population density: 1,446 people per square mile (low).
933 residents are foreign born (6.6% Latin America, 0.9% Europe).
| This city: | 7.9% |
| North Carolina: | 8.3% |
Median real estate property taxes paid for housing units with mortgages in 2022: $1,889 (0.8%)
Median real estate property taxes paid for housing units with no mortgage in 2022: $1,846 (0.7%)
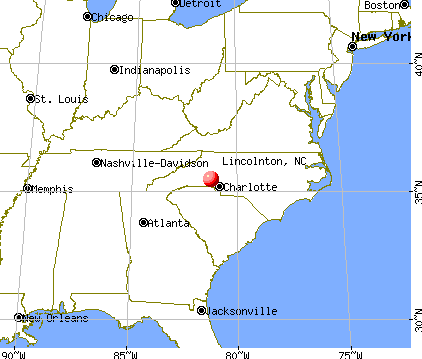
Nearest city with pop. 50,000+: Gastonia, NC  (15.5 miles , pop. 66,277).
Nearest city with pop. 200,000+: Charlotte, NC (29.8 miles , pop. 540,828).
Nearest city with pop. 1,000,000+: Philadelphia, PA (457.1 miles , pop. 1,517,550).
Nearest cities:
), ), ), ), Latitude: 35.47 N, Longitude: 81.24 W
Daytime population change due to commuting: +5,057 (+42.6%)
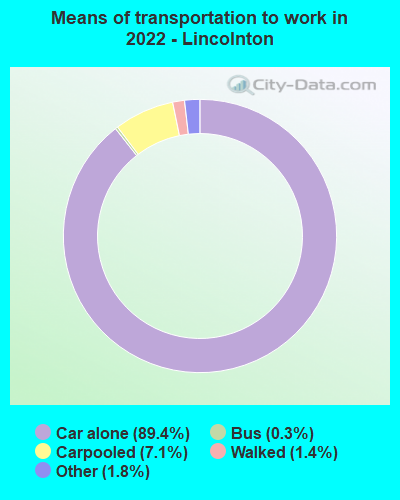
Workers who live and work in this city: 2,926 (59.6%)
Area codes: 704, 980
| Here: | 2.8% |
| North Carolina: | 3.2% |
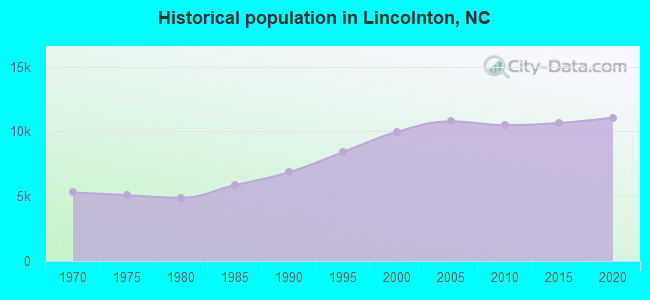
Population change in the 1990s: +561 (+6.0%).
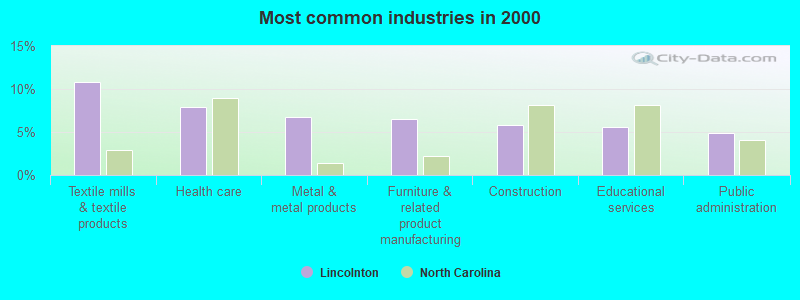
- Textile mills & textile products (10.8%)
- Health care (7.9%)
- Metal & metal products (6.7%)
- Furniture & related product manufacturing (6.5%)
- Construction (5.8%)
- Educational services (5.6%)
- Public administration (4.9%)
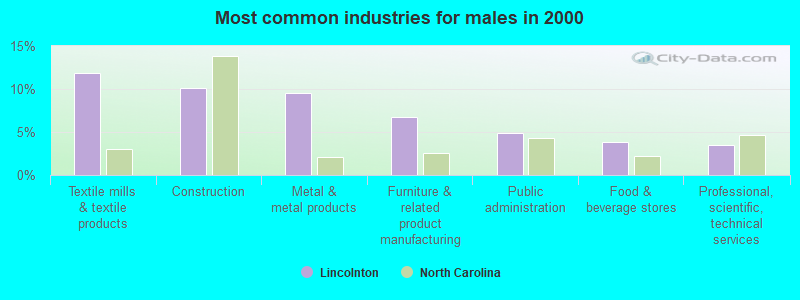
- Textile mills & textile products (11.8%)
- Construction (10.2%)
- Metal & metal products (9.5%)
- Furniture & related product manufacturing (6.7%)
- Public administration (4.9%)
- Food & beverage stores (3.8%)
- Professional, scientific, technical services (3.5%)
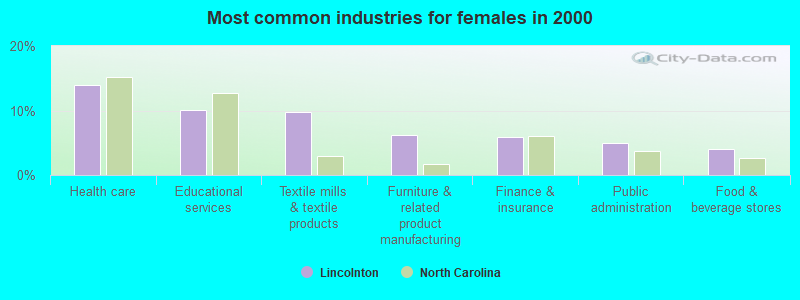
- Health care (14.0%)
- Educational services (10.1%)
- Textile mills & textile products (9.7%)
- Furniture & related product manufacturing (6.2%)
- Finance & insurance (5.9%)
- Public administration (4.9%)
- Food & beverage stores (4.0%)
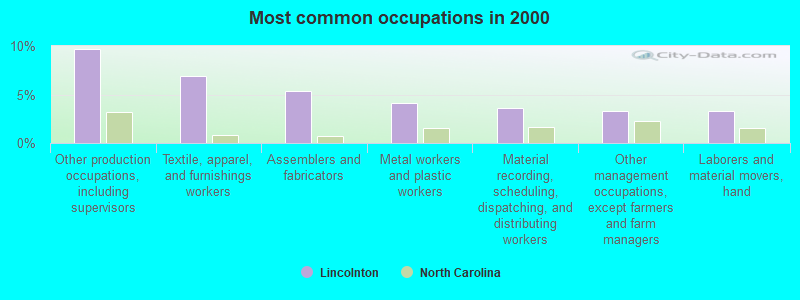
- Other production occupations, including supervisors (9.7%)
- Textile, apparel, and furnishings workers (6.9%)
- Assemblers and fabricators (5.4%)
- Metal workers and plastic workers (4.2%)
- Material recording, scheduling, dispatching, and distributing workers (3.6%)
- Other management occupations, except farmers and farm managers (3.3%)
- Laborers and material movers, hand (3.3%)
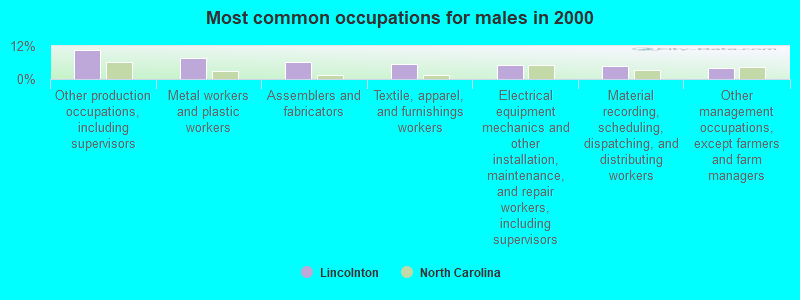
- Other production occupations, including supervisors (10.5%)
- Metal workers and plastic workers (7.5%)
- Assemblers and fabricators (6.2%)
- Textile, apparel, and furnishings workers (5.4%)
- Electrical equipment mechanics and other installation, maintenance, and repair workers, including supervisors (5.1%)
- Material recording, scheduling, dispatching, and distributing workers (4.8%)
- Other management occupations, except farmers and farm managers (4.1%)
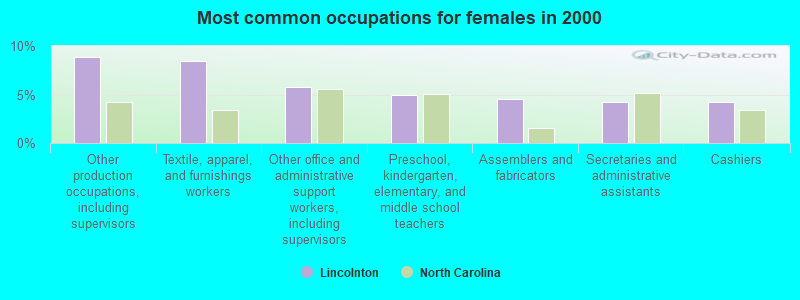
- Other production occupations, including supervisors (8.9%)
- Textile, apparel, and furnishings workers (8.4%)
- Other office and administrative support workers, including supervisors (5.8%)
- Preschool, kindergarten, elementary, and middle school teachers (4.9%)
- Assemblers and fabricators (4.5%)
- Secretaries and administrative assistants (4.2%)
- Cashiers (4.2%)
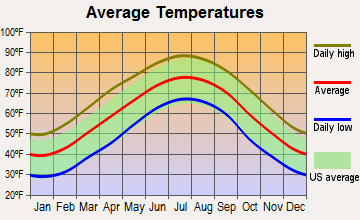
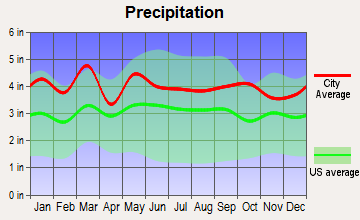
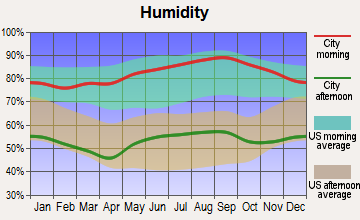
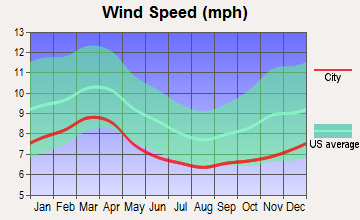
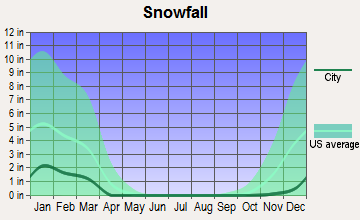
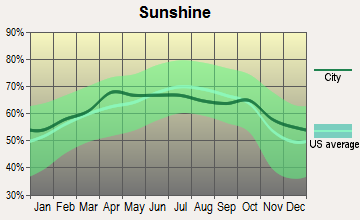
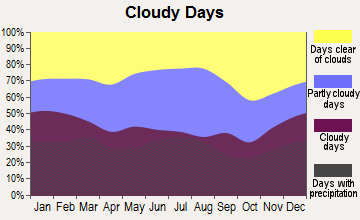
Average climate in Lincolnton, North Carolina
Based on data reported by over 4,000 weather stations
|
|


(lower is better)
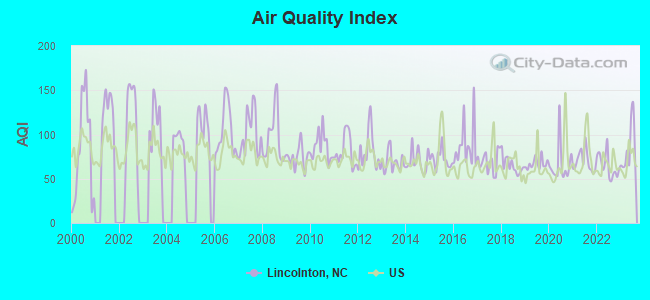
Air Quality Index (AQI) level in 2023 was 84.2. This is about average.
| City: | 84.2 |
| U.S.: | 72.6 |
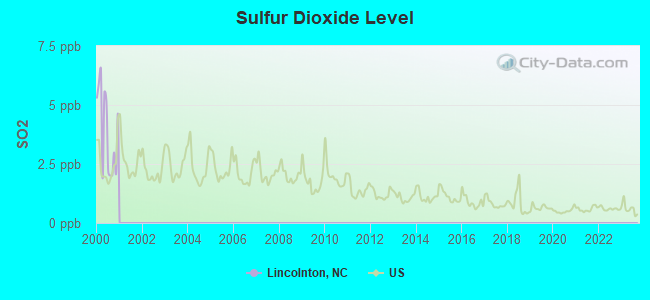
Sulfur Dioxide (SO2) [ppb] level in 2000 was 3.86. This is significantly worse than average. Closest monitor was 0.9 miles away from the city center.
| City: | 3.86 |
| U.S.: | 1.51 |
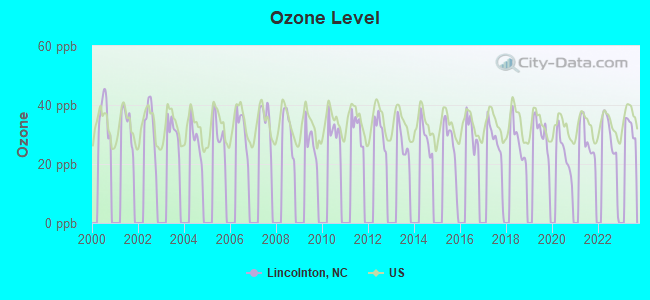
Ozone [ppb] level in 2022 was 27.7. This is better than average. Closest monitor was 3.1 miles away from the city center.
| City: | 27.7 |
| U.S.: | 33.3 |
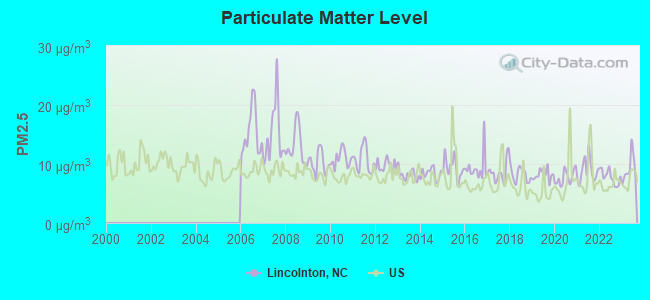
Particulate Matter (PM2.5) [µg/m3] level in 2023 was 9.19. This is about average. Closest monitor was 12.3 miles away from the city center.
| City: | 9.19 |
| U.S.: | 8.11 |
Tornado activity:
Lincolnton-area historical tornado activity is near North Carolina state average. It is 5% smaller than the overall U.S. average.
On 5/5/1989, a category F4 (max. wind speeds 207-260 mph) tornado 17.4 miles away from the Lincolnton city center killed 4 people and injured 52 people and caused between $5,000,000 and $50,000,000 in damages.
On 5/7/1998, a category F4 tornado 27.7 miles away from the city center injured 2 people and caused $1 million in damages.
Earthquake activity:
Lincolnton-area historical earthquake activity is significantly above North Carolina state average. It is 11% smaller than the overall U.S. average.On 8/9/2020 at 12:07:37, a magnitude 5.1 (5.1 MW, Depth: 4.7 mi, Class: Moderate, Intensity: VI - VII) earthquake occurred 69.8 miles away from Lincolnton center
On 8/23/2011 at 17:51:04, a magnitude 5.8 (5.8 MW, Depth: 3.7 mi) earthquake occurred 249.0 miles away from the city center
On 8/2/1974 at 08:52:09, a magnitude 4.9 (4.3 MB, 4.9 LG, Class: Light, Intensity: IV - V) earthquake occurred 131.5 miles away from Lincolnton center
On 7/27/1980 at 18:52:21, a magnitude 5.2 (5.1 MB, 4.7 MS, 5.0 UK, 5.2 UK) earthquake occurred 240.8 miles away from Lincolnton center
On 11/30/1973 at 07:48:41, a magnitude 4.7 (4.7 MB, 4.6 ML) earthquake occurred 154.5 miles away from Lincolnton center
On 11/22/1974 at 05:25:55, a magnitude 4.7 (4.7 MB) earthquake occurred 188.8 miles away from Lincolnton center
Magnitude types: regional Lg-wave magnitude (LG), body-wave magnitude (MB), local magnitude (ML), surface-wave magnitude (MS), moment magnitude (MW)
Natural disasters:
The number of natural disasters in Lincoln County (13) is near the US average (15).Major Disasters (Presidential) Declared: 8
Emergencies Declared: 4
Causes of natural disasters: Droughts: 2, Floods: 2, Hurricanes: 2, Storms: 2, Tornadoes: 2, Blizzard: 1, Freeze: 1, Ice Storm: 1, Landslide: 1, Mudslide: 1, Snowfall: 1, Tropical Storm: 1, Winter Storm: 1, Other: 1 (Note: some incidents may be assigned to more than one category).
Hospitals in Lincolnton:
- BROOKWOOD HOME (1254 BROOKHAVEN DR)
- CAROLINAS MEDICAL CENTER-LINCOLN (Government - Hospital District or Authority, provides emergency services, 433 MCALISTER RD)
- HOSPICE OF LINCOLN CTY INC (107 N CEDAR STREET)
- LINOAK GROUP HOME (3175 BANK ROAD)
- RIVERVIEW HOME (1793 RIVERVIEW ROAD)
- SUNNY HILL II (279 SUNNY HILL DRIVE)
Nursing Homes in Lincolnton:
- BRIAN CTR HLTH AND RET/LINCOLNTON (515 S GENERALS BLVD)
- CARDINAL HEALTHCARE AND REHAB (931 N ASPEN ST)
- KINDRED NURSING AND REHABILITATION-LINCOLN (1410 EAST GASTON ST)
- LINCOLN COUNTY HOSPITAL-SNF (GAMBLE DRIVE BOX 677)
Dialysis Facilities in Lincolnton:
Home Health Centers in Lincolnton:
Airports and heliports located in Lincolnton:
- Lincolnton-Lincoln County Regional Airport (IPJ) (Runways: 1, Itinerant Ops: 17,900, Local Ops: 15,300, Military Ops: 900)
- Carolinas Medical Center Lincolnton Heliport (43NR)
Colleges/universities with over 2000 students nearest to Lincolnton:
- Gaston College (about 12 miles; Dallas, NC; Full-time enrollment: 4,385)
- Catawba Valley Community College (about 16 miles; Hickory, NC; FT enrollment: 3,785)
- Cleveland Community College (about 20 miles; Shelby, NC; FT enrollment: 2,541)
- NASCAR Technical Institute (about 24 miles; Mooresville, NC; FT enrollment: 2,350)
- Johnson & Wales University-Charlotte (about 28 miles; Charlotte, NC; FT enrollment: 2,518)
- Gardner-Webb University (about 29 miles; Boiling Springs, NC; FT enrollment: 4,241)
- Mitchell Community College (about 29 miles; Statesville, NC; FT enrollment: 2,458)
Public high schools in Lincolnton:
- LINCOLNTON HIGH (Location: 803 N ASPEN ST, Grades: 9-12)
- WEST LINCOLN HIGH (Location: 172 SHOAL RD, Grades: 9-12)
- ASBURY SCHOOL (Location: 221 SALEM CHURCH ROAD, Grades: 7-12)
- NORTH LINCOLN HIGH (Location: 2737 LEE LAWING ROAD, Grades: 9-12)
Private high school in Lincolnton:
Biggest public elementary/middle schools in Lincolnton:
- BATTLEGROUND ELEMENTARY (Location: 201 JEB SEAGLE DR, Grades: PK-3)
- GE MASSEY ELEMENTARY (Location: 130 NEWBOLD ST, Grades: PK-3)
- LINCOLNTON MIDDLE (Location: 2361 STARTOWN ROAD, Grades: 6-8)
- LOVE MEMORIAL ELEMENTARY (Location: 1463 LOVE MEMORIAL SCH RD, Grades: PK-5)
- S RAY LOWDER ELEMENTARY (Location: 350 KENNEDY DR, Grades: PK-3)
- WEST LINCOLN MIDDLE (Location: 260 SHOAL RD, Grades: 6-8)
- PUMPKIN CENTER PRIMARY (Location: 3970 KING WILKINSON ROAD, Grades: KG-2)
- CHILDERS ELEMENTARY (Location: 2595 ROCK DAM ROAD, Grades: PK-5)
- KISER INTERMEDIATE (Location: 301 JEB SEAGLE DRIVE, Grades: 4-5)
- PUMPKIN CENTER INTERMEDIATE (Location: 3980 KING WILKINSON ROAD, Grades: 3-5)
User-submitted facts and corrections:
- Please change the Private School listing in Lincolnton, NC to Lincolnton Christian Academy - NEW LIFE BAPTIST ACADEMY IS NO LONGER IN EXISTENCE
- Famous person - Bradley Davis, independent film actor, viewed at Sundance Flim Festival
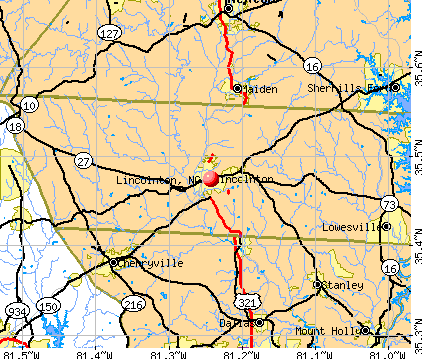
Points of interest:
Notable locations in Lincolnton: Lincolnton Plaza (A), Lincoln Country Club (B), Baptist Church Fellowship Building (C), Lincoln County Health Center (D). Display/hide their locations on the map
Shopping Center: Midland Shopping Center (1). Display/hide its location on the map
Churches in Lincolnton include: Herndon Church (A), Victory Grove Church (B), Bethel Church (C), David Memorial Church (D), Saint Lukes Lutheran Church (E), Church of God (F), Saint Dorothys Catholic Church (G), First Wesleyan Church (H), First Presbyterian Church (I). Display/hide their locations on the map
Cemetery: Hollybrook Cemetery (1). Display/hide its location on the map
Streams, rivers, and creeks: Lithia Branch (A), Walker Branch (B). Display/hide their locations on the map
Tourist attractions: Lincoln County Museum of History (403 East Main Street), Beaver Larry Sign Company (Amusement & Theme Parks; 1421 Daniels Road), Fun Time Go KART Rides (Amusement & Theme Parks; 1421 Daniels Road), Concerts For Christ (Arcades & Amusements; 3059 Brady Hoffman Road), G & S Tours & Charters (Tours & Charters; 1330 Davis Road).
Hotels: Carolina Motel (306 North Generals Boulevard), Days Inn (614 Clark Drive), Comfort Inn of Lincolnton (1550 East Main Street), Comfort Inn (1550 East Main Street), Days Inn Lincolnton (614 Clark Dr), Comfort Inn Lincolnton (1550 East Main Street).
Birthplace of: Candace Newmaker - Children, Drew Droege - Actor, Robert Hoke - Confederate Army general, Stephen Dodson Ramseur - Army officer, Barclay Radebaugh - Basketball player-coach, Jim Cleamons - Basketball player-coach, William H. Forney - Confederate Army general and politician, Devon Lowery - Baseball player, Dick Smith (AL outfielder) - Baseball player, Eric Wilson - College basketball player (Western Carolina Catamounts).
Drinking water stations with addresses in Lincolnton and their reported violations in the past:
ST DOROTHY`S CATHOLIC CHURCH (Population served: 600, Groundwater):Past monitoring violations:NEW VISION MINISTRIES (Population served: 200, Groundwater):
- Monitoring, Repeat Major (TCR) - In JUN-2005, Contaminant: Coliform (TCR). Follow-up actions: St Public Notif requested (AUG-09-2005), St Formal NOV issued (AUG-09-2005), St Public Notif received (JUL-27-2006), St Compliance achieved (JUN-11-2010), St Intentional no-action (JUN-11-2010)
- 2 routine major monitoring violations
Past monitoring violations:GAINSVILLE BAPTIST CHURCH (Population served: 175, Groundwater):
- Follow-up Or Routine LCR Tap M/R - In OCT-01-2005, Contaminant: Lead and Copper Rule. Follow-up actions: St Public Notif requested (JUL-20-2006), St Formal NOV issued (JUL-20-2006), St Compliance achieved (AUG-01-2008)
- 21 regular monitoring violations
Past monitoring violations:LEONARD`S FORK BAPT CHURCH (Population served: 150, Groundwater):
- 2 routine major monitoring violations
- One regular monitoring violation
Past health violations:MARVIN UNITED METHODIST CHURCH (Population served: 100, Groundwater):
- MCL, Monthly (TCR) - Between JUL-2012 and SEP-2012, Contaminant: Coliform. Follow-up actions: St Public Notif requested (JUL-16-2012), St Formal NOV issued (JUL-16-2012), St AO (w/o penalty) issued (JUL-16-2012), St Public Notif received (AUG-02-2012), St Compliance achieved (AUG-31-2012)
Past monitoring violations:IGLESIA DE DIOS HISPANA CHURCH (Population served: 80, Groundwater):
- One routine major monitoring violation
Past monitoring violations:MT CALVARY BAPTIST CHURCH (Population served: 75, Groundwater):
- One regular monitoring violation
Past monitoring violations:PLEASANT GROVE UNITED METH CH (Population served: 60, Groundwater):
- 3 routine major monitoring violations
Past health violations:Past monitoring violations:
- MCL, Monthly (TCR) - Between JUL-2011 and SEP-2011, Contaminant: Coliform. Follow-up actions: St Public Notif requested (JUL-20-2011), St Formal NOV issued (JUL-20-2011), St AO (w/o penalty) issued (JUL-20-2011), St Public Notif received (AUG-01-2011), St Compliance achieved (MAR-31-2012)
- 2 routine major monitoring violations
Drinking water stations with addresses in Lincolnton that have no violations reported:
- ZION HILL BAPTIST CHURCH (Population served: 100, Primary Water Source Type: Groundwater)
- FELLOWSHIP BAPTIST CHURCH (Population served: 65, Primary Water Source Type: Groundwater)
- SHADY REST GRILL & GROCERY (Population served: 25, Primary Water Source Type: Groundwater)
| This city: | 2.4 people |
| North Carolina: | 2.5 people |
| This city: | 62.2% |
| Whole state: | 66.7% |
| This city: | 6.8% |
| Whole state: | 5.9% |
Likely homosexual households (counted as self-reported same-sex unmarried-partner households)
- Lesbian couples: 0.3% of all households
- Gay men: 0.4% of all households
People in group quarters in Lincolnton in 2010:
- 319 people in nursing facilities/skilled-nursing facilities
- 97 people in group homes intended for adults
- 29 people in other noninstitutional facilities
- 10 people in emergency and transitional shelters (with sleeping facilities) for people experiencing homelessness
People in group quarters in Lincolnton in 2000:
- 318 people in nursing homes
- 41 people in other noninstitutional group quarters
- 40 people in local jails and other confinement facilities (including police lockups)
- 19 people in homes for the mentally retarded
- 13 people in agriculture workers' dormitories on farms
- 6 people in other nonhousehold living situations
- 3 people in homes or halfway houses for drug/alcohol abuse
- 2 people in homes for the mentally ill
Banks with most branches in Lincolnton (2011 data):
- Carolina Trust Bank: West Branch, Boger City Branch, at 901 East Main Street. Info updated 2009/11/30: Bank assets: $266.2 mil, Deposits: $224.2 mil, local headquarters, negative income in the last year, Commercial Lending Specialization, 6 total offices
- First-Citizens Bank & Trust Company: Boger City Branch at 2480 East Main Street, branch established on 1967/01/12; Lincolnton Main Office Branch at 425 East Main Street, branch established on 1984/05/08. Info updated 2011/10/11: Bank assets: $20,566.4 mil, Deposits: $17,596.8 mil, headquarters in Raleigh, NC, positive income, Commercial Lending Specialization, 433 total offices, Holding Company: First Citizens Bancshares, Inc.
- Bank of America, National Association: Lincolnton Main Branch at 213 S. Aspen Street, branch established on 2001/10/24; Boger City Branch at 2604 East Main Street, branch established on 1971/10/25. Info updated 2009/11/18: Bank assets: $1,451,969.3 mil, Deposits: $1,077,176.8 mil, headquarters in Charlotte, NC, positive income, 5782 total offices, Holding Company: Bank Of America Corporation
- Fifth Third Bank: Boger City Branch at 2586 East Main Street, branch established on 1985/09/04; Lincolnton Main at 402 East Main Street, branch established on 1983/06/08. Info updated 2009/10/05: Bank assets: $114,540.4 mil, Deposits: $89,689.1 mil, headquarters in Cincinnati, OH, positive income, Commercial Lending Specialization, 1378 total offices, Holding Company: Fifth Third Bancorp
- Peoples Bank: West Lincoln Branch at 760 Hwy 27 W, branch established on 2002/09/30; Lincolnton Branch at 1910 E Main Street, branch established on 2001/02/01. Info updated 2006/11/03: Bank assets: $1,064.6 mil, Deposits: $842.9 mil, headquarters in Newton, NC, positive income, Commercial Lending Specialization, 24 total offices, Holding Company: Peoples Bancorp Of North Carolina, Inc.
- First Federal Savings Bank of Lincolnton: First Federal Savings Bank Of Lincol at 320 E Main St, branch established on 1940/01/01; Boger City Branch at 2763 East Highway 27, branch established on 2002/02/08. Info updated 2011/07/21: Bank assets: $320.6 mil, Deposits: $275.1 mil, local headquarters, positive income, Mortgage Lending Specialization, 3 total offices
- Carter Bank & Trust: Lincolnton Branch at 341 East Main Street, branch established on 2005/03/21. Info updated 2007/02/23: Bank assets: $3,970.4 mil, Deposits: $3,610.0 mil, headquarters in Martinsville, VA, positive income, Commercial Lending Specialization, 123 total offices
- Branch Banking and Trust Company: Lincolnton Main Branch at 813 East Main Street, branch established on 1986/06/30. Info updated 2010/03/29: Bank assets: $168,867.6 mil, Deposits: $127,549.5 mil, headquarters in Winston Salem, NC, positive income, Commercial Lending Specialization, 1793 total offices, Holding Company: Bb&T Corporation
- The First National Bank of Shelby: Lincolnton Branch at 2317 East Main Street, branch established on 2008/08/08. Info updated 2006/11/03: Bank assets: $898.1 mil, Deposits: $666.4 mil, headquarters in Shelby, NC, negative income in the last year, Commercial Lending Specialization, 15 total offices
For population 15 years and over in Lincolnton:
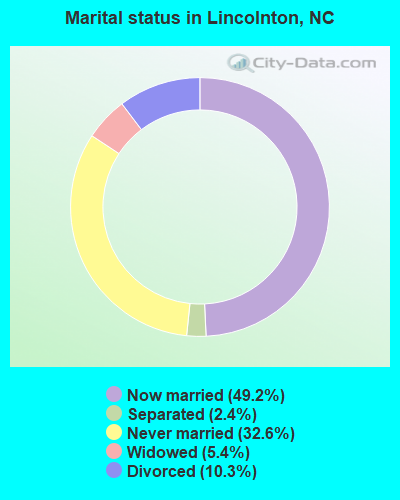
- Never married: 32.6%
- Now married: 49.2%
- Separated: 2.4%
- Widowed: 5.4%
- Divorced: 10.3%
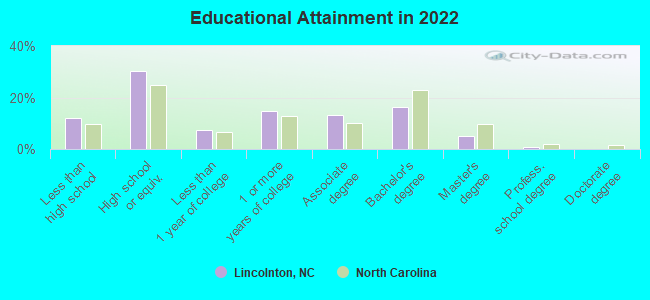
For population 25 years and over in Lincolnton:
- High school or higher: 85.1%
- Bachelor's degree or higher: 18.4%
- Graduate or professional degree: 6.0%
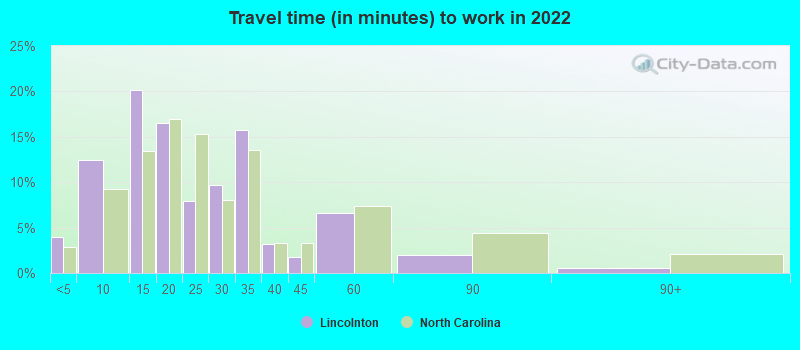
- Unemployed: 5.0%
- Mean travel time to work (commute): 21.1 minutes
| Here: | 10.3 |
| North Carolina average: | 11.7 |
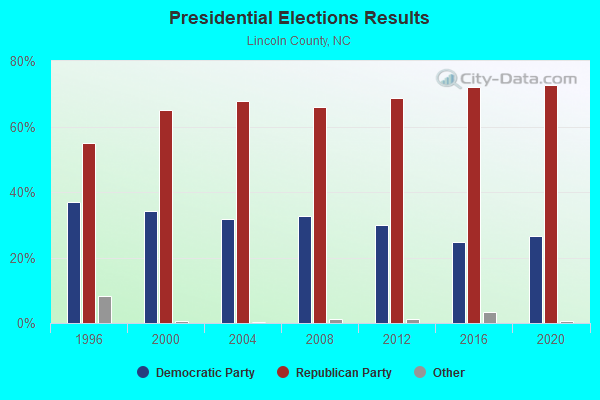
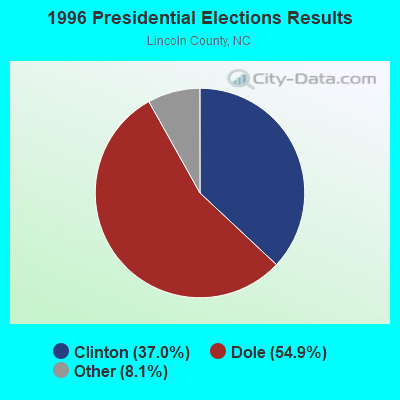
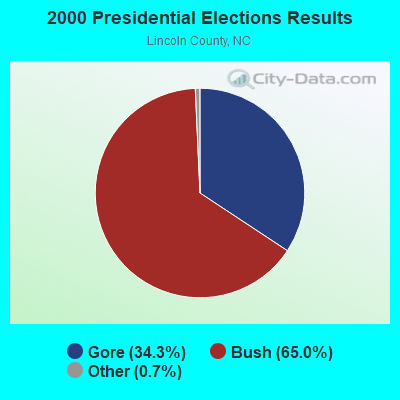

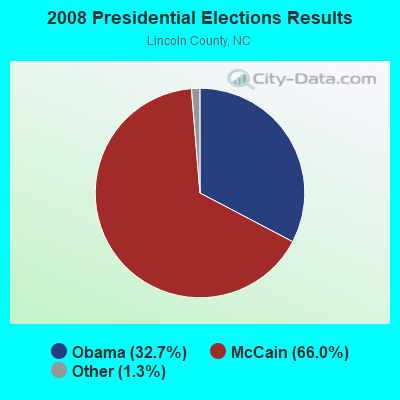
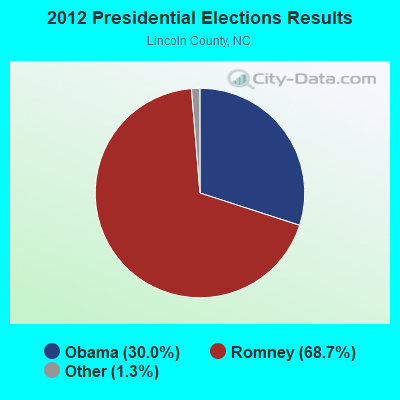
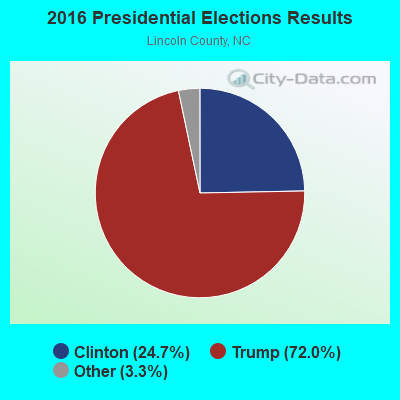

Graphs represent county-level data. Detailed 2008 Election Results
Religion statistics for Lincolnton, NC (based on Lincoln County data)
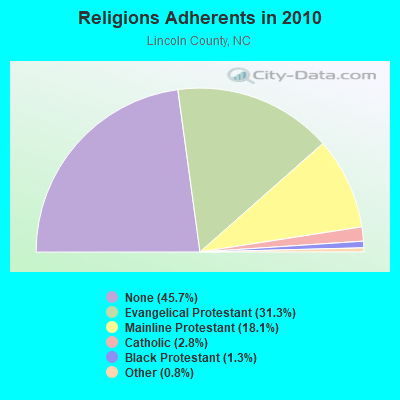
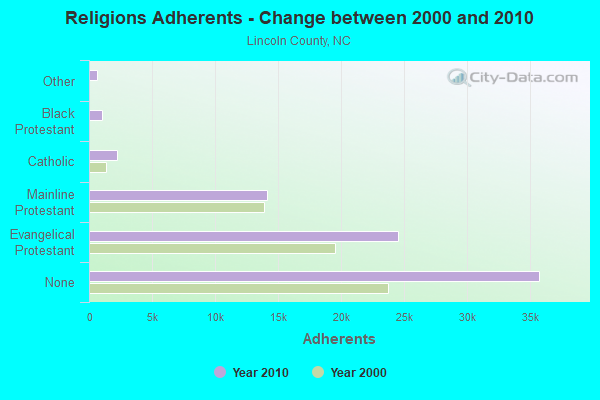
| Religion | Adherents | Congregations |
|---|---|---|
| Evangelical Protestant | 24,519 | 96 |
| Mainline Protestant | 14,131 | 53 |
| Catholic | 2,203 | 2 |
| Black Protestant | 1,000 | 7 |
| Other | 653 | 2 |
| None | 35,759 | - |
Food Environment Statistics:
| Lincoln County: | 1.92 / 10,000 pop. |
| State: | 2.05 / 10,000 pop. |
| Lincoln County: | 0.69 / 10,000 pop. |
| North Carolina: | 0.92 / 10,000 pop. |
| Here: | 6.60 / 10,000 pop. |
| State: | 4.75 / 10,000 pop. |
| Lincoln County: | 5.36 / 10,000 pop. |
| State: | 7.57 / 10,000 pop. |
| Lincoln County: | 11.2% |
| North Carolina: | 9.8% |
| This county: | 28.4% |
| North Carolina: | 28.3% |
| Lincoln County: | 11.1% |
| North Carolina: | 15.6% |
Health and Nutrition:
| Lincolnton: | 48.9% |
| State: | 48.9% |
| This city: | 45.7% |
| North Carolina: | 46.1% |
| Lincolnton: | 28.7 |
| North Carolina: | 28.8 |
| Lincolnton: | 20.8% |
| North Carolina: | 20.7% |
| This city: | 11.1% |
| North Carolina: | 10.7% |
| Lincolnton: | 6.9 |
| North Carolina: | 6.8 |
| This city: | 34.1% |
| North Carolina: | 33.7% |
| Lincolnton: | 54.6% |
| State: | 55.8% |
| This city: | 77.8% |
| North Carolina: | 79.7% |
More about Health and Nutrition of Lincolnton, NC Residents
| Local government employment and payroll (March 2022) | |||||
| Function | Full-time employees | Monthly full-time payroll | Average yearly full-time wage | Part-time employees | Monthly part-time payroll |
|---|---|---|---|---|---|
| Firefighters | 37 | $167,247 | $54,242 | 11 | $7,440 |
| Police Protection - Officers | 32 | $153,492 | $57,560 | 3 | $4,641 |
| Sewerage | 20 | $79,814 | $47,888 | 0 | $0 |
| Other Government Administration | 15 | $53,611 | $42,889 | 2 | $610 |
| Streets and Highways | 11 | $31,695 | $34,576 | 0 | $0 |
| Financial Administration | 10 | $46,553 | $55,864 | 0 | $0 |
| Water Supply | 10 | $38,766 | $46,519 | 0 | $0 |
| Other and Unallocable | 9 | $31,481 | $41,975 | 17 | $18,184 |
| Solid Waste Management | 8 | $27,581 | $41,372 | 0 | $0 |
| Electric Power | 7 | $31,624 | $54,213 | 0 | $0 |
| Parks and Recreation | 6 | $26,547 | $53,094 | 20 | $14,231 |
| Police - Other | 3 | $8,944 | $35,776 | 0 | $0 |
| Fire - Other | 1 | $5,841 | $70,092 | 0 | $0 |
| Totals for Government | 169 | $703,197 | $49,931 | 53 | $45,106 |
Lincolnton government finances - Expenditure in 2021 (per resident):
- Construction - Police Protection: $684,000 ($57.88)
Housing and Community Development: $495,000 ($41.89)
Water Utilities: $257,000 ($21.75)
Central Staff Services: $60,000 ($5.08)
- Current Operations - Electric Utilities: $7,083,000 ($599.34)
Water Utilities: $3,120,000 ($264.00)
Local Fire Protection: $3,103,000 ($262.57)
Police Protection: $3,088,000 ($261.30)
Liquor Stores: $2,599,000 ($219.92)
Sewerage: $1,840,000 ($155.69)
Central Staff Services: $1,682,000 ($142.33)
Regular Highways: $1,147,000 ($97.06)
Parks and Recreation: $831,000 ($70.32)
Housing and Community Development: $483,000 ($40.87)
Solid Waste Management: $482,000 ($40.79)
Transit Utilities: $240,000 ($20.31)
Financial Administration: $186,000 ($15.74)
Air Transportation: $16,000 ($1.35)
Health - Other: $12,000 ($1.02)
- General - Interest on Debt: $43,000 ($3.64)
- Intergovernmental to Local - Other - Health - Other: $12,000 ($1.02)
- Other Capital Outlay - Local Fire Protection: $740,000 ($62.62)
Electric Utilities: $617,000 ($52.21)
Water Utilities: $504,000 ($42.65)
Solid Waste Management: $159,000 ($13.45)
Parks and Recreation: $144,000 ($12.18)
Central Staff Services: $120,000 ($10.15)
Police Protection: $101,000 ($8.55)
- Total Salaries and Wages: $637,000 ($53.90)
- Water Utilities - Interest on Debt: $132,000 ($11.17)
Lincolnton government finances - Revenue in 2021 (per resident):
- Charges - Sewerage: $4,043,000 ($342.11)
Miscellaneous Commercial Activities: $87,000 ($7.36)
Parks and Recreation: $41,000 ($3.47)
Other: $19,000 ($1.61)
Solid Waste Management: $8,000 ($0.68)
Parking Facilities: $1,000 ($0.08)
- Federal Intergovernmental - Other: $218,000 ($18.45)
General Local Government Support: $42,000 ($3.55)
- Local Intergovernmental - General Local Government Support: $991,000 ($83.86)
- Miscellaneous - Donations From Private Sources: $401,000 ($33.93)
General Revenue - Other: $197,000 ($16.67)
Interest Earnings: $130,000 ($11.00)
Sale of Property: $79,000 ($6.68)
Rents: $49,000 ($4.15)
- Revenue - Electric Utilities: $8,895,000 ($752.67)
Water Utilities: $3,483,000 ($294.72)
Liquor Stores: $2,866,000 ($242.51)
- State Intergovernmental - General Local Government Support: $867,000 ($73.36)
Highways: $292,000 ($24.71)
Other: $1,000 ($0.08)
- Tax - Property: $5,606,000 ($474.36)
General Sales and Gross Receipts: $4,185,000 ($354.12)
Motor Vehicle License: $218,000 ($18.45)
Alcoholic Beverage Sales: $107,000 ($9.05)
Occupation and Business License - Other: $12,000 ($1.02)
Lincolnton government finances - Debt in 2021 (per resident):
- Long Term Debt - Beginning Outstanding - Unspecified Public Purpose: $3,748,000 ($317.14)
Retired Unspecified Public Purpose: $2,390,000 ($202.23)
Outstanding Unspecified Public Purpose: $1,358,000 ($114.91)
| Businesses in Lincolnton, NC | ||||
| Name | Count | Name | Count | |
|---|---|---|---|---|
| ALDI | 1 | New Balance | 2 | |
| Ace Hardware | 1 | Papa John's Pizza | 1 | |
| Advance Auto Parts | 1 | Pizza Hut | 1 | |
| Arby's | 1 | RadioShack | 1 | |
| AutoZone | 1 | Ryan's Grill | 1 | |
| CVS | 1 | SONIC Drive-In | 1 | |
| Chevrolet | 1 | Sears | 1 | |
| Comfort Inn | 1 | Staples | 1 | |
| Dairy Queen | 1 | Subway | 3 | |
| Days Inn | 1 | T-Mobile | 2 | |
| Domino's Pizza | 1 | Taco Bell | 1 | |
| FedEx | 4 | U-Haul | 3 | |
| GNC | 1 | UPS | 4 | |
| H&R Block | 1 | Waffle House | 1 | |
| KFC | 1 | Walgreens | 1 | |
| Kincaid | 1 | Walmart | 1 | |
| Little Caesars Pizza | 1 | Wendy's | 1 | |
| Lowe's | 1 | YMCA | 1 | |
| McDonald's | 1 | |||
Strongest AM radio stations in Lincolnton:
- WLON (1050 AM; 1 kW; LINCOLNTON, NC; Owner: KTC BROADCASTING, INC.)
- WHKY (1290 AM; 50 kW; HICKORY, NC; Owner: LONG COMMUNICATIONS, LLC.)
- WLTC (1370 AM; 20 kW; GASTONIA, NC)
- WBT (1110 AM; 50 kW; CHARLOTTE, NC; Owner: JEFFERSON-PILOT COMMUNICATNS CO. OF NORTH CAROLINA)
- WCGC (1270 AM; 10 kW; BELMONT, NC; Owner: WHVN, INC.)
- WCXN (1170 AM; daytime; 8 kW; CLAREMONT, NC; Owner: WCXN, INC.)
- WFNZ (610 AM; 5 kW; CHARLOTTE, NC; Owner: INFINITY RADIO SUBSIDIARY OPERATIONS INC.)
- WAGL (1560 AM; daytime; 50 kW; LANCASTER, SC; Owner: PALMETTO BROADCASTING SYSTEM, INC.)
- WFGW (1010 AM; 50 kW; BLACK MOUNTAIN, NC; Owner: BLUE RIDGE BROADCASTING CORP.)
- WGFY (1480 AM; 10 kW; CHARLOTTE, NC; Owner: ABC, INC.)
- WLFJ (660 AM; daytime; 50 kW; GREENVILLE, SC; Owner: CLEAR CHANNEL BROADCASTING LICENSES, INC.)
- WBCU (1460 AM; 50 kW; UNION, SC)
- WTRU (830 AM; 50 kW; KERNERSVILLE, NC; Owner: TRUTH BROADCASTING CORPORATION)
Strongest FM radio stations in Lincolnton:
- WLYT (102.9 FM; HICKORY, NC; Owner: CAPSTAR TX LIMITED PARTNERSHIP)
- WPEG (97.9 FM; CONCORD, NC; Owner: INFINITY RADIO SUBSIDIARY OPERATIONS INC.)
- WNKS (95.1 FM; CHARLOTTE, NC; Owner: INFINITY RADIO SUBSIDIARY OPERATIONS INC.)
- WLNK (107.9 FM; CHARLOTTE, NC; Owner: JEFFERSON-PILOT COMMUNICATIONS COMPANY OF NORTH CAROLINA)
- WXRC (95.7 FM; HICKORY, NC; Owner: PACIFIC BROADCASTING GROUP, INC.)
- WBAV-FM (101.9 FM; GASTONIA, NC; Owner: INFINITY RADIO SUBSIDIARY OPERATIONS INC.)
- WSGE (91.7 FM; DALLAS, NC; Owner: GASTON COLLEGE)
- WWMG (96.1 FM; SHELBY, NC; Owner: CLEAR CHANNEL BROADCASTING LICENSES, INC.)
- WFHE (90.3 FM; HICKORY, NC; Owner: UNIVERSITY RADIO FOUNDATION, INC.)
- WKKT (96.9 FM; STATESVILLE, NC; Owner: CAPSTAR TX LIMITED PARTNERSHIP)
- WAGI-FM (105.3 FM; GAFFNEY, SC; Owner: GAFFNEY BROADCASTING, INC.)
- WTHZ (94.1 FM; LEXINGTON, NC; Owner: DAVIDSON COUNTY BROADCASTING CO, INC)
- WSOC-FM (103.7 FM; CHARLOTTE, NC; Owner: INFINITY RADIO SUBSIDIARY OPERATIONS INC.)
- WMIT (106.9 FM; BLACK MOUNTAIN, NC; Owner: BLUE RIDGE BROADCASTING CORPORATION)
- WNCW (88.7 FM; SPINDALE, NC; Owner: ISOTHERMAL COMMUNITY COLLEGE)
- WDAV (89.9 FM; DAVIDSON, NC; Owner: THE TRUSTEES OF DAVIDSON COLLEGE)
- WRFX-FM (99.7 FM; KANNAPOLIS, NC; Owner: CAPSTAR TX LIMITED PARTNERSHIP)
- WFMX (105.7 FM; STATESVILLE, NC; Owner: MERCURY BROADCASTING COMPANY, INC.)
- WSSS (104.7 FM; CHARLOTTE, NC; Owner: INFINITY RADIO SUBSIDIARY OPERATIONS INC.)
- WFAE (90.7 FM; CHARLOTTE, NC; Owner: UNIVERSITY RADIO FOUNDATION, INC.)
TV broadcast stations around Lincolnton:
- WBTV (Channel 3; CHARLOTTE, NC; Owner: JEFFERSON-PILOT COMMUNICATIONS/WBTV, INC.)
- WJZY (Channel 46; BELMONT, NC; Owner: WJZY-TV, INC.)
- WWWB (Channel 55; ROCK HILL, SC; Owner: WWWB-TV, INC.)
- WCNC-TV (Channel 36; CHARLOTTE, NC; Owner: WCNC-TV, INC.)
- W38CN (Channel 38; CHARLOTTE, NC; Owner: NATIONAL MINORITY T.V., INC.)
- WAFF (Channel 48; HUNTSVILLE, AL; Owner: RAYCOM AMERICA, INC.)
- WSOC-TV (Channel 9; CHARLOTTE, NC; Owner: WSOC-TV HOLDINGS, INC.)
- WUNG-TV (Channel 58; CONCORD, NC; Owner: UNIVERSITY OF NORTH CAROLINA)
- WAXN (Channel 64; KANNAPOLIS, NC; Owner: WSOC-TV HOLDINGS, INC.)
- WGTB-LP (Channel 28; CHARLOTTE, NC; Owner: VICTORY CHRISTIAN CENTER, INC.)
- WTVI (Channel 42; CHARLOTTE, NC; Owner: CHARLOTTE-MECKLENBURG PUBLIC BROADCASTING AUTHORITY)
- WCCB (Channel 18; CHARLOTTE, NC; Owner: NORTH CAROLINA BROADCASTING PARTNERS)
- WHKY-TV (Channel 14; HICKORY, NC; Owner: LONG COMMUNICATIONS, LLC.)
- W25BR (Channel 25; CHARLOTTE, NC; Owner: WORD OF GOD FELLOWSHIP, INC.)
- W34BN (Channel 34; CHARLOTTE, NC; Owner: THREE ANGELS BROADCASTING NETWORK)
- W52CW (Channel 52; CHARLOTTE, NC; Owner: TRINITY BROADCASTING NETWORK)
Medal of Honor Recipients
Medal of Honor Recipient born in Lincolnton: Rufus Zenas Johnston.
- National Bridge Inventory (NBI) Statistics
- 72Number of bridges
- 833ft / 254mTotal length
- 768,180Total average daily traffic
- 82,583Total average daily truck traffic
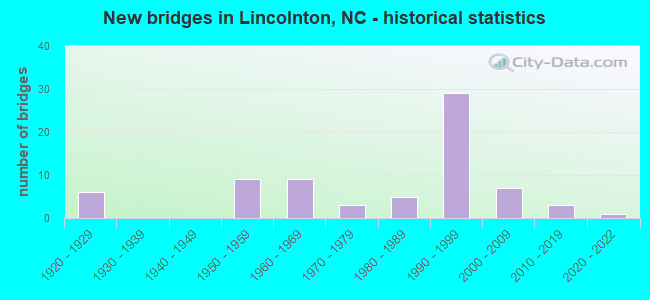
- New bridges - historical statistics
- 61920-1929
- 91950-1959
- 91960-1969
- 31970-1979
- 51980-1989
- 291990-1999
- 72000-2009
- 32010-2019
- 12020-2022
FCC Registered Antenna Towers: 193 (See the full list of FCC Registered Antenna Towers)
FCC Registered Commercial Land Mobile Towers: 1 (See the full list of FCC Registered Commercial Land Mobile Towers in Lincolnton, NC)
FCC Registered Broadcast Land Mobile Towers: 39 (See the full list of FCC Registered Broadcast Land Mobile Towers)
FCC Registered Microwave Towers: 12 (See the full list of FCC Registered Microwave Towers in this town)
FCC Registered Paging Towers: 1 (See the full list of FCC Registered Paging Towers)
FCC Registered Maritime Coast & Aviation Ground Towers: 4 (See the full list of FCC Registered Maritime Coast & Aviation Ground Towers)
FCC Registered Amateur Radio Licenses: 173 (See the full list of FCC Registered Amateur Radio Licenses in Lincolnton)
FAA Registered Aircraft: 24 (See the full list of FAA Registered Aircraft in Lincolnton)
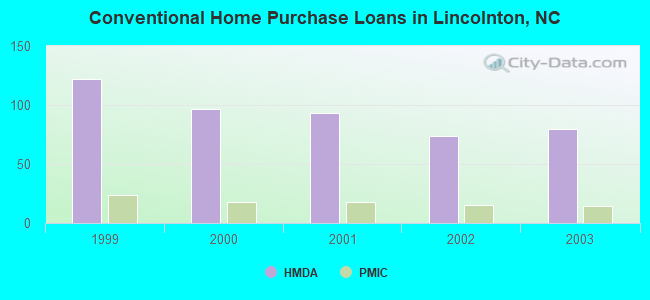
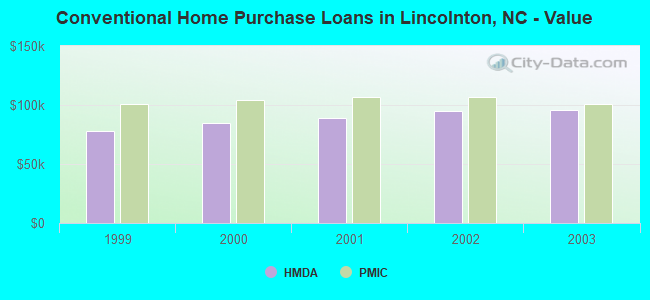
| Home Mortgage Disclosure Act Aggregated Statistics For Year 2003 (Based on 5 partial tracts) | ||||||||||
| A) FHA, FSA/RHS & VA Home Purchase Loans | B) Conventional Home Purchase Loans | C) Refinancings | D) Home Improvement Loans | F) Non-occupant Loans on < 5 Family Dwellings (A B C & D) | ||||||
|---|---|---|---|---|---|---|---|---|---|---|
| Number | Average Value | Number | Average Value | Number | Average Value | Number | Average Value | Number | Average Value | |
| LOANS ORIGINATED | 4 | $87,765 | 80 | $95,852 | 255 | $92,398 | 13 | $17,050 | 31 | $54,964 |
| APPLICATIONS APPROVED, NOT ACCEPTED | 1 | $25,540 | 6 | $77,780 | 23 | $104,377 | 3 | $9,783 | 1 | $54,040 |
| APPLICATIONS DENIED | 1 | $111,950 | 38 | $73,839 | 107 | $96,842 | 10 | $21,202 | 5 | $59,922 |
| APPLICATIONS WITHDRAWN | 1 | $108,070 | 22 | $104,283 | 60 | $108,709 | 1 | $55,640 | 2 | $95,800 |
| FILES CLOSED FOR INCOMPLETENESS | 0 | $0 | 4 | $121,088 | 20 | $116,162 | 1 | $25,540 | 0 | $0 |
Detailed HMDA statistics for the following Tracts: 0701.00 , 0702.00, 0703.00, 0708.00
| Private Mortgage Insurance Companies Aggregated Statistics For Year 2003 (Based on 5 partial tracts) | ||||
| A) Conventional Home Purchase Loans | B) Refinancings | |||
|---|---|---|---|---|
| Number | Average Value | Number | Average Value | |
| LOANS ORIGINATED | 14 | $100,485 | 31 | $104,201 |
| APPLICATIONS APPROVED, NOT ACCEPTED | 6 | $110,085 | 11 | $106,303 |
| APPLICATIONS DENIED | 0 | $0 | 4 | $149,362 |
| APPLICATIONS WITHDRAWN | 1 | $138,970 | 1 | $103,020 |
| FILES CLOSED FOR INCOMPLETENESS | 0 | $0 | 0 | $0 |
Detailed PMIC statistics for the following Tracts: 0701.00 , 0702.00, 0703.00, 0708.00
2002 - 2018 National Fire Incident Reporting System (NFIRS) incidents
- Fire incident types reported to NFIRS in Lincolnton, NC
- 2,11850.7%Structure Fires
- 1,44534.6%Outside Fires
- 41610.0%Mobile Property/Vehicle Fires
- 2004.8%Other
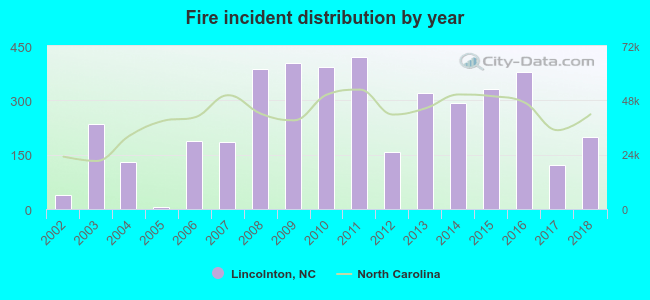 Based on the data from the years 2002 - 2018 the average number of fire incidents per year is 246. The highest number of fire incidents - 419 took place in 2011, and the least - 5 in 2005. The data has a rising trend.
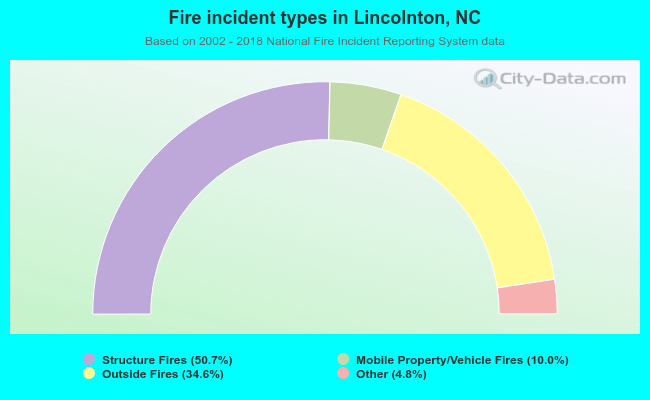 When looking into fire subcategories, the most incidents belonged to: Structure Fires (50.7%), and Outside Fires (34.6%).
Fire-safe hotels and motels in Lincolnton, North Carolina:
- Comfort Inn, 1550 E Main St, Lincolnton, North Carolina 28092 , Phone: (704) 732-0011, Fax: (704) 732-4872
- Hampton Inn, 129 Roper Dr, Lincolnton, North Carolina 28092 , Phone: (704) 736-2000, Fax: (704) 736-2687
| Most common first names in Lincolnton, NC among deceased individuals | ||
| Name | Count | Lived (average) |
|---|---|---|
| Mary | 225 | 77.4 years |
| James | 224 | 70.4 years |
| John | 200 | 73.5 years |
| William | 180 | 73.1 years |
| Robert | 148 | 70.7 years |
| Charles | 96 | 70.4 years |
| Ruth | 89 | 77.6 years |
| Margaret | 83 | 77.4 years |
| George | 82 | 70.9 years |
| Annie | 74 | 80.3 years |
| Most common last names in Lincolnton, NC among deceased individuals | ||
| Last name | Count | Lived (average) |
|---|---|---|
| Carpenter | 137 | 75.9 years |
| Smith | 135 | 75.1 years |
| Dellinger | 76 | 78.0 years |
| Rhyne | 64 | 77.4 years |
| Heavner | 60 | 78.1 years |
| Brown | 53 | 73.3 years |
| Beal | 53 | 70.6 years |
| Kiser | 52 | 76.0 years |
| Keener | 51 | 76.9 years |
| Davis | 51 | 75.5 years |
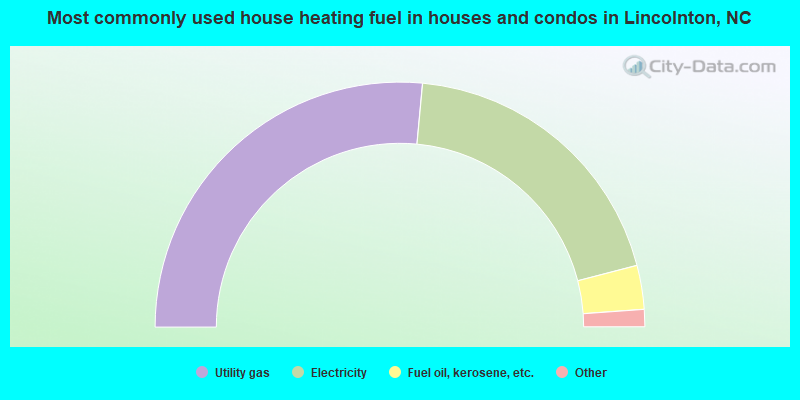
- 53.0%Utility gas
- 39.0%Electricity
- 5.8%Fuel oil, kerosene, etc.
- 1.9%Bottled, tank, or LP gas
- 0.3%Wood
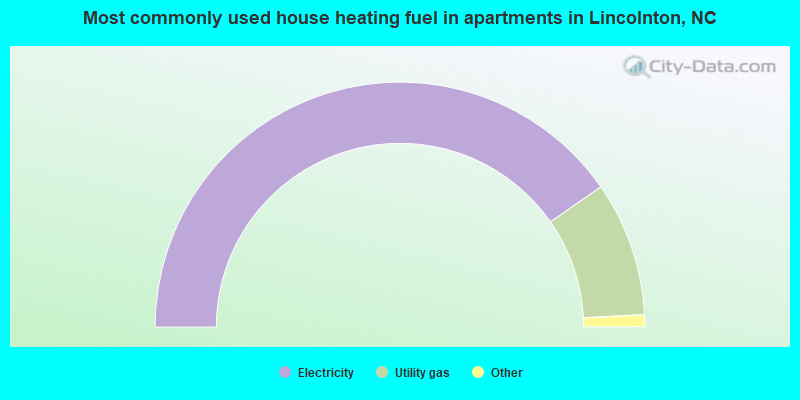
- 80.7%Electricity
- 17.8%Utility gas
- 1.3%Bottled, tank, or LP gas
- 0.3%Fuel oil, kerosene, etc.
Lincolnton compared to North Carolina state average:
- Median household income below state average.
- Unemployed percentage below state average.
- Hispanic race population percentage above state average.
- Median age below state average.
- Renting percentage above state average.
- House age significantly above state average.
- Institutionalized population percentage above state average.
Lincolnton on our top lists:
- #9 on the list of "Top 101 cities with the most residents born in Costa Rica (population 500+)"
- #76 on the list of "Top 101 cities with the highest number of murders per 100,000 residents, excludes tourist destinations and others with a lot of outsiders visiting based on city industries data (population 5,000+)"
- #18 on the list of "Top 101 counties with the lowest ground withdrawal of fresh water for public supply (pop. 50,000+)"

|
|
Total of 137 patent applications in 2008-2024.