Matteson, Illinois
Submit your own pictures of this village and show them to the world
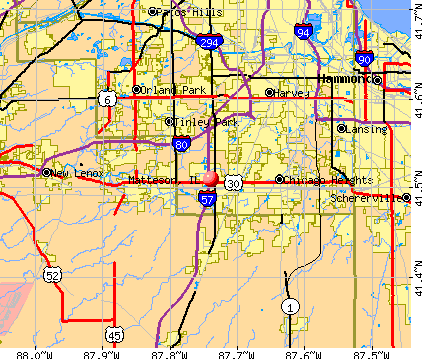
- OSM Map
- General Map
- Google Map
- MSN Map
Population change since 2000: +42.6%
| Males: 8,185 | |
| Females: 10,254 |
| Median resident age: | 44.5 years |
| Illinois median age: | 39.1 years |
Zip codes: 60471.
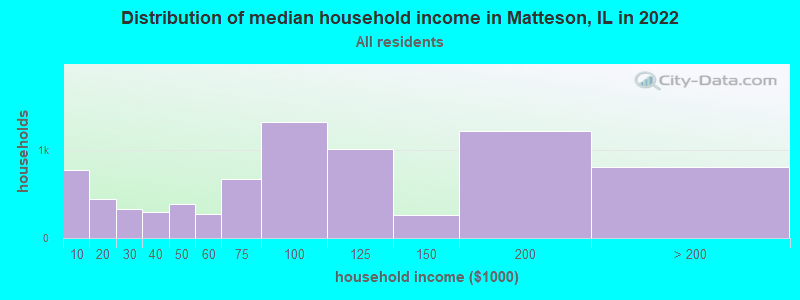
| Matteson: | $86,699 |
| IL: | $76,708 |
Estimated per capita income in 2022: $42,731 (it was $25,024 in 2000)
Matteson village income, earnings, and wages data
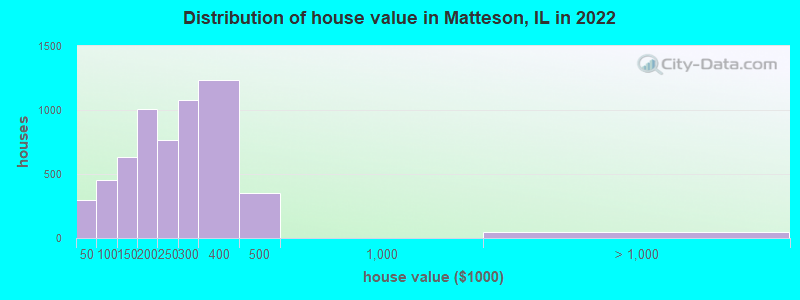
Estimated median house or condo value in 2022: $231,925 (it was $132,100 in 2000)
| Matteson: | $231,925 |
| IL: | $251,600 |
Mean prices in 2022: all housing units: $375,299; detached houses: $398,817; townhouses or other attached units: $348,645; in 2-unit structures: $310,273; in 3-to-4-unit structures: $366,192; in 5-or-more-unit structures: $341,015; mobile homes: $69,289; occupied boats, rvs, vans, etc.: $126,496
Median gross rent in 2022: $1,413.
(22.6% for White Non-Hispanic residents, 9.1% for Black residents, 0.6% for Hispanic or Latino residents, 6.7% for other race residents, 9.5% for two or more races residents)
Detailed information about poverty and poor residents in Matteson, IL


Compare current foreclosures in Matteson, IL:
| Photo | Address | Area | Beds / Baths | Price | Details |
|---|---|---|---|---|---|

|
#1
Cedarwood Ln
Matteson, IL 60443
|
2,227 sq. feet
|
2 baths 4 beds |
show details | |

|
#2
218th St
Matteson, IL 60443
|
1,104 sq. feet
|
2 baths 4 beds |
show details | |

|
#3
Sumter Ct
Matteson, IL 60443
|
1,808 sq. feet
|
2 baths 4 beds |
show details | |

|
#4
Providence Dr
Matteson, IL 60443
|
3,052 sq. feet
|
3 baths 4 beds |
show details | |

|
#5
Willow Rd
Matteson, IL 60443
|
1,868 sq. feet
|
2 baths 4 beds |
show details | |

|
#6
Cornfield Rd
Matteson, IL 60443
|
3,140 sq. feet
|
2 baths 5 beds |
show details | |

|
#7
Elm Ln
Matteson, IL 60443
|
1,354 sq. feet
|
1 baths - beds |
show details | |

|
#8
Aspen Ln
Matteson, IL 60443
|
1,294 sq. feet
|
2 baths - beds |
show details | |

|
#9
Sumter Dr
Matteson, IL 60443
|
1,350 sq. feet
|
1 baths - beds |
show details | |

|
#10
Shannon Ave
Matteson, IL 60443
|
2,987 sq. feet
|
2 baths - beds |
show details |
| Photo | Address | Area | Beds / Baths | Price | Details |
|---|---|---|---|---|---|

|
#11
Southwick Ct
Matteson, IL 60443
|
1,184 sq. feet
|
2 baths - beds |
show details | |

|
#12
214th St
Matteson, IL 60443
|
1,419 sq. feet
|
1 baths - beds |
show details | |

|
#13
Notre Dame Dr
Matteson, IL 60443
|
1,650 sq. feet
|
2 baths - beds |
show details | |

|
#14
Christina Dr
Matteson, IL 60443
|
3,340 sq. feet
|
2 baths - beds |
show details | |

|
#15
Treehouse Rd
Matteson, IL 60443
|
2,342 sq. feet
|
2 baths - beds |
show details | |

|
#16
212th Pl
Matteson, IL 60443
|
1,360 sq. feet
|
2 baths - beds |
show details | |

|
#17
Huntingwood Rd
Matteson, IL 60443
|
1,735 sq. feet
|
1 baths - beds |
show details | |

|
#18
White Oaks Rd
Matteson, IL 60443
|
1,529 sq. feet
|
1 baths - beds |
show details | |

|
#19
213th Pl
Matteson, IL 60443
|
1,067 sq. feet
|
2 baths - beds |
show details | |

|
#20
Central Ave
Matteson, IL 60443
|
1,815 sq. feet
|
2 baths - beds |
show details |
| Photo | Address | Area | Beds / Baths | Price | Details |
|---|---|---|---|---|---|

|
#21
Pond View Dr
Matteson, IL 60443
|
2,033 sq. feet
|
2 baths - beds |
show details | |

|
#22
Pasture Side Trl
Matteson, IL 60443
|
2,933 sq. feet
|
3 baths - beds |
show details | |

|
#23
Maryview Pkwy
Matteson, IL 60443
|
3,173 sq. feet
|
2 baths - beds |
show details | |

|
#24
Holden Cir
Matteson, IL 60443
|
1,887 sq. feet
|
2 baths - beds |
show details | |

|
#25
Oriole Rd
Matteson, IL 60443
|
1,596 sq. feet
|
2 baths - beds |
show details | |

|
#26
Willow Rd
Matteson, IL 60443
|
3,245 sq. feet
|
2 baths - beds |
show details | |

|
#27
Sophia Dr
Matteson, IL 60443
|
3,341 sq. feet
|
2 baths - beds |
show details | |

|
#28
Christina Dr
Matteson, IL 60443
|
3,224 sq. feet
|
3 baths - beds |
show details | |

|
#29
Shannon Ave
Matteson, IL 60443
|
3,142 sq. feet
|
2 baths - beds |
show details | |

|
#30
217th St
Matteson, IL 60443
|
764 sq. feet
|
1 baths - beds |
show details |
| Photo | Address | Area | Beds / Baths | Price | Details |
|---|---|---|---|---|---|

|
#31
Amherst Pl
Matteson, IL 60443
|
2,856 sq. feet
|
2 baths - beds |
show details | |

|
#32
216th Pl
Matteson, IL 60443
|
1,140 sq. feet
|
1 baths - beds |
show details | |

|
#33
Kildare Ave
Matteson, IL 60443
|
1,664 sq. feet
|
2 baths - beds |
show details | |

|
#34
Woodgate Dr
Matteson, IL 60443
|
1,593 sq. feet
|
2 baths - beds |
show details | |

|
#35
Highland Rd
Matteson, IL 60443
|
2,262 sq. feet
|
2 baths - beds |
show details | |

|
#36
Butterfield Pkwy
Matteson, IL 60443
|
2,484 sq. feet
|
2 baths - beds |
show details | |

|
#37
213th Pl
Matteson, IL 60443
|
1,397 sq. feet
|
1 baths - beds |
show details | |

|
#38
Feathercreek Rd
Matteson, IL 60443
|
2,633 sq. feet
|
2 baths - beds |
show details | |

|
#39
Oakwood Ln
Matteson, IL 60443
|
2,791 sq. feet
|
3 baths - beds |
show details | |

|
#40
Carnation Ln
Matteson, IL 60443
|
1,376 sq. feet
|
1 baths - beds |
show details |
| Photo | Address | Area | Beds / Baths | Price | Details |
|---|---|---|---|---|---|

|
#41
Heritage Blvd
Matteson, IL 60443
|
1,794 sq. feet
|
2 baths - beds |
show details | |

|
#42
Bradley Ave
Matteson, IL 60443
|
1,136 sq. feet
|
2 baths - beds |
show details | |

|
#43
Bridle Path Dr
Matteson, IL 60443
|
2,712 sq. feet
|
2 baths - beds |
show details | |

|
#44
Bloomsbury Ln
Matteson, IL 60443
|
1,254 sq. feet
|
1 baths - beds |
show details | |

|
#45
Maple Ave
Matteson, IL 60443
|
2,540 sq. feet
|
2 baths - beds |
show details | |

|
#46
Wildflower Rd
Matteson, IL 60443
|
- sq. feet
|
2 baths 2 beds |
show details | |

|
#47
203rd St
Matteson, IL 60443
|
1,014 sq. feet
|
1 baths - beds |
show details | |

|
#48
Old Meadow Rd
Matteson, IL 60443
|
1,515 sq. feet
|
1 baths - beds |
show details | |

|
#49
Woodgate Dr
Matteson, IL 60443
|
1,731 sq. feet
|
1 baths - beds |
show details | |

|
Check over 1 million property listings on Foreclosure.com!
|
browse all offers | |||


- 14,42078.0%Black alone
- 2,14911.6%White alone
- 7293.9%Two or more races
- 5903.2%Asian alone
- 3281.8%Hispanic
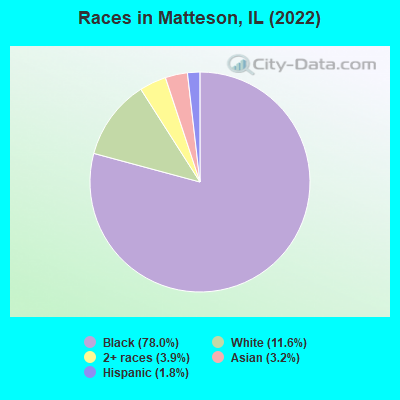
Races in Matteson detailed stats: ancestries, foreign born residents, place of birth
According to our research of Illinois and other state lists, there were 22 registered sex offenders living in Matteson, Illinois as of April 27, 2024.
The ratio of all residents to sex offenders in Matteson is 866 to 1.
The ratio of registered sex offenders to all residents in this city is near the state average.
Type |
2010 |
2011 |
2012 |
2013 |
2014 |
2015 |
2016 |
2017 |
2018 |
2019 |
2020 |
|---|---|---|---|---|---|---|---|---|---|---|---|
| Murders (per 100,000) | 1 (5.3) | 1 (5.2) | 0 (0.0) | 0 (0.0) | 0 (0.0) | 0 (0.0) | 0 (0.0) | 0 (0.0) | 4 (20.5) | 2 (10.2) | 1 (5.1) |
| Rapes (per 100,000) | 0 (0.0) | 1 (5.2) | 0 (0.0) | 8 (41.7) | 13 (67.8) | 4 (20.8) | 6 (31.2) | 12 (62.8) | 8 (41.1) | 18 (92.2) | 7 (35.9) |
| Robberies (per 100,000) | 18 (94.7) | 22 (115.4) | 23 (120.4) | 44 (229.3) | 26 (135.5) | 28 (145.9) | 18 (93.6) | 19 (99.4) | 12 (61.6) | 19 (97.4) | 7 (35.9) |
| Assaults (per 100,000) | 19 (100.0) | 14 (73.4) | 12 (62.8) | 21 (109.4) | 17 (88.6) | 19 (99.0) | 47 (244.5) | 129 (675.1) | 234 (1,202) | 214 (1,096) | 170 (872.1) |
| Burglaries (per 100,000) | 76 (399.8) | 104 (545.5) | 103 (539.2) | 60 (312.7) | 69 (359.7) | 71 (370.0) | 54 (280.9) | 52 (272.2) | 94 (482.7) | 48 (245.9) | 50 (256.5) |
| Thefts (per 100,000) | 633 (3,330) | 572 (3,000) | 617 (3,230) | 768 (4,003) | 772 (4,025) | 486 (2,533) | 457 (2,377) | 429 (2,245) | 491 (2,522) | 424 (2,172) | 325 (1,667) |
| Auto thefts (per 100,000) | 70 (368.2) | 54 (283.2) | 55 (287.9) | 51 (265.8) | 63 (328.4) | 40 (208.4) | 64 (332.9) | 37 (193.6) | 125 (641.9) | 74 (379.2) | 89 (456.6) |
| Arson (per 100,000) | 4 (21.0) | 4 (21.0) | 0 (0.0) | 0 (0.0) | 1 (5.2) | 0 (0.0) | 0 (0.0) | 0 (0.0) | 1 (5.1) | 2 (10.2) | 2 (10.3) |
| City-Data.com crime index | 249.6 | 244.8 | 238.7 | 327.3 | 325.0 | 224.1 | 243.3 | 339.5 | 518.8 | 477.2 | 345.3 |
The City-Data.com crime index weighs serious crimes and violent crimes more heavily. Higher means more crime, U.S. average is 246.1. It adjusts for the number of visitors and daily workers commuting into cities.
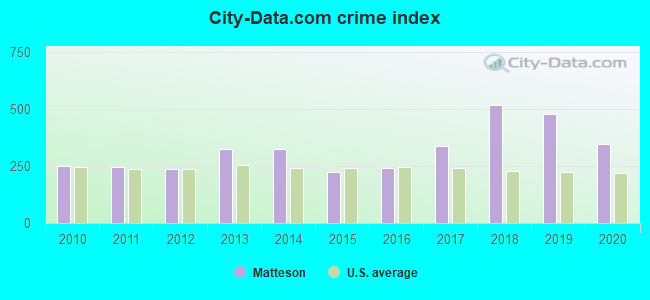
Crime rate in Matteson detailed stats: murders, rapes, robberies, assaults, burglaries, thefts, arson
Full-time law enforcement employees in 2020, including police officers: 54 (36 officers - 31 male; 5 female).
| Officers per 1,000 residents here: | 1.85 |
| Illinois average: | 3.04 |
 Recent articles from our blog. Our writers, many of them Ph.D. graduates or candidates, create easy-to-read articles on a wide variety of topics.

 | Flossmoor and the New Amazon Fulfillment Center in Matteson (8 replies) |
| Steger in 2021 (8 replies) |
| Park Forest real estate taxes (11 replies) |
| Maximizing Rural feel vs distance from city (19 replies) |
| Matteson (25 replies) |
| Commuting to Chicago and NW Indiana? (17 replies) |
Latest news from Matteson, IL collected exclusively by city-data.com from local newspapers, TV, and radio stations
Ancestries: German (3.3%), Nigerian (2.0%).
Current Local Time: CST time zone
Incorporated on 07/20/1894
Elevation: 693 feet
Land area: 7.14 square miles.
Population density: 2,583 people per square mile (average).
975 residents are foreign born (3.1% Asia, 1.1% Africa, 0.5% Latin America).
| This village: | 5.3% |
| Illinois: | 14.1% |
Median real estate property taxes paid for housing units with mortgages in 2022: $7,880 (3.2%)
Median real estate property taxes paid for housing units with no mortgage in 2022: $4,872 (3.1%)
Nearest city with pop. 50,000+: Orland Park, IL  (9.2 miles , pop. 51,077).
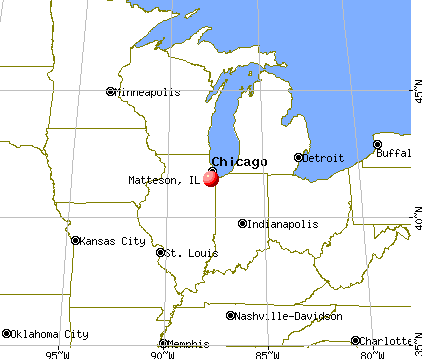
Nearest city with pop. 200,000+: Chicago, IL (23.1 miles , pop. 2,896,016).
Nearest cities:
), Latitude: 41.51 N, Longitude: 87.74 W
Daytime population change due to commuting: -1,709 (-9.2%)
Workers who live and work in this village: 1,798 (20.7%)
Area code commonly used in this area: 708
Matteson tourist attractions:
Matteson, Illinois accommodation & food services, waste management - Economy and Business Data
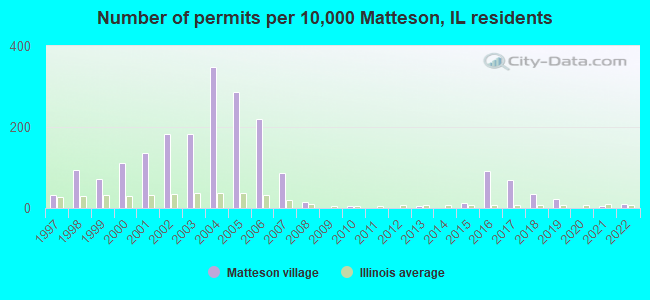
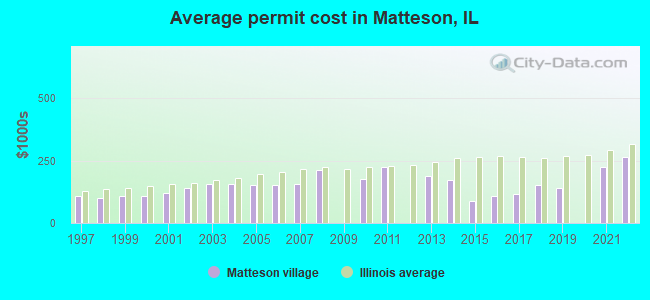
Single-family new house construction building permits:
- 2022: 11 buildings, average cost: $264,900
- 2021: 6 buildings, average cost: $223,300
- 2019: 30 buildings, average cost: $141,800
- 2018: 45 buildings, average cost: $152,800
- 2017: 91 buildings, average cost: $115,900
- 2016: 118 buildings, average cost: $109,400
- 2015: 16 buildings, average cost: $90,300
- 2014: 1 building, cost: $173,300
- 2013: 6 buildings, average cost: $186,800
- 2011: 1 building, cost: $226,000
- 2010: 7 buildings, average cost: $176,900
- 2008: 19 buildings, average cost: $212,000
- 2007: 112 buildings, average cost: $157,300
- 2006: 283 buildings, average cost: $153,600
- 2005: 370 buildings, average cost: $151,600
- 2004: 451 buildings, average cost: $157,500
- 2003: 236 buildings, average cost: $158,000
- 2002: 235 buildings, average cost: $141,700
- 2001: 177 buildings, average cost: $120,900
- 2000: 145 buildings, average cost: $106,600
- 1999: 93 buildings, average cost: $107,800
- 1998: 123 buildings, average cost: $101,800
- 1997: 43 buildings, average cost: $109,700
| Here: | 4.0% |
| Illinois: | 4.2% |
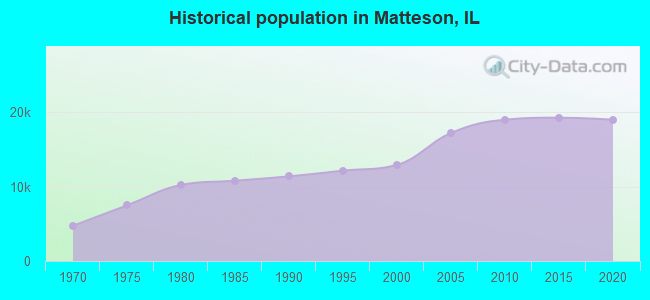
Population change in the 1990s: +1,306 (+11.2%).
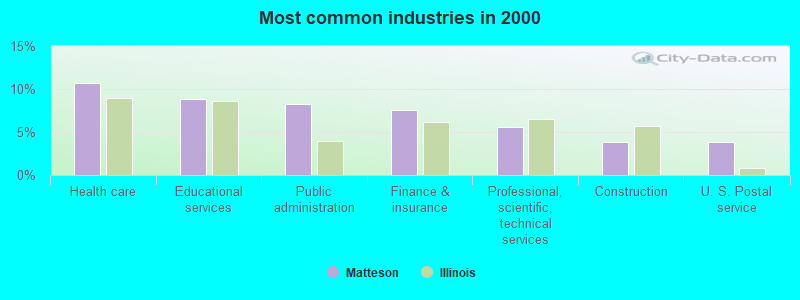
- Health care (10.7%)
- Educational services (8.8%)
- Public administration (8.3%)
- Finance & insurance (7.6%)
- Professional, scientific, technical services (5.6%)
- Construction (3.8%)
- U. S. Postal service (3.8%)
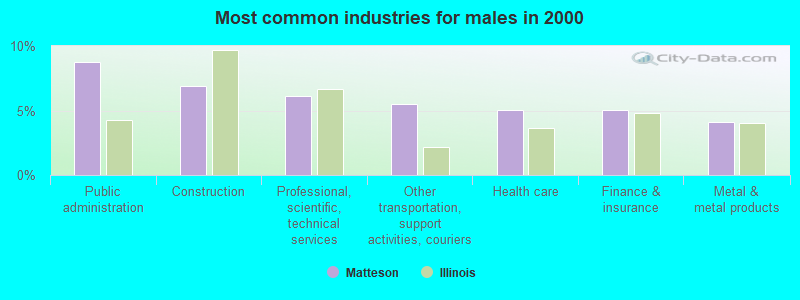
- Public administration (8.8%)
- Construction (6.9%)
- Professional, scientific, technical services (6.1%)
- Other transportation, support activities, couriers (5.5%)
- Health care (5.0%)
- Finance & insurance (5.0%)
- Metal & metal products (4.1%)
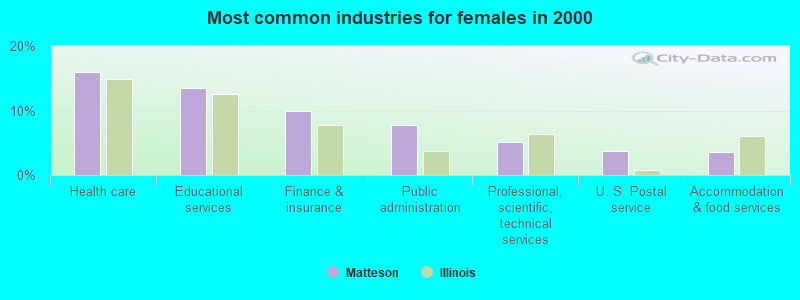
- Health care (15.9%)
- Educational services (13.5%)
- Finance & insurance (10.0%)
- Public administration (7.8%)
- Professional, scientific, technical services (5.1%)
- U. S. Postal service (3.7%)
- Accommodation & food services (3.6%)
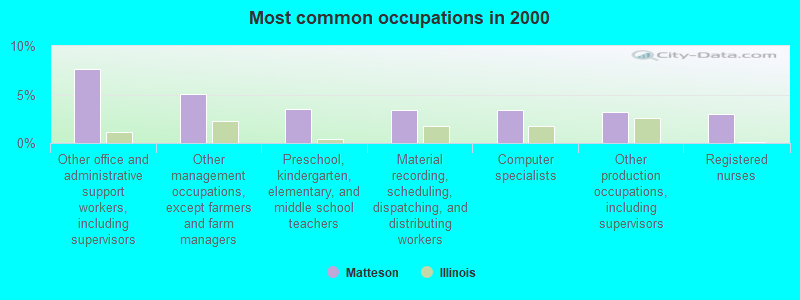
- Other office and administrative support workers, including supervisors (7.6%)
- Other management occupations, except farmers and farm managers (5.1%)
- Preschool, kindergarten, elementary, and middle school teachers (3.6%)
- Material recording, scheduling, dispatching, and distributing workers (3.4%)
- Computer specialists (3.4%)
- Other production occupations, including supervisors (3.2%)
- Registered nurses (3.0%)
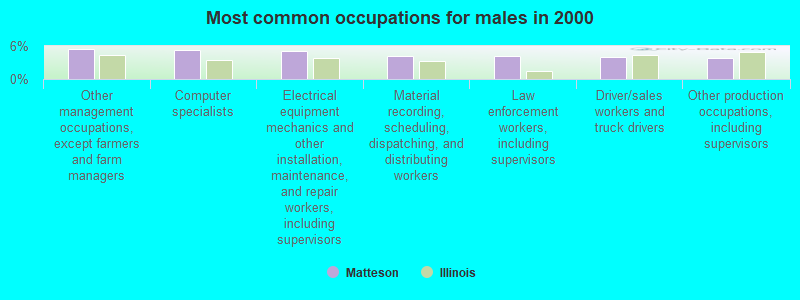
- Other management occupations, except farmers and farm managers (5.4%)
- Computer specialists (5.2%)
- Electrical equipment mechanics and other installation, maintenance, and repair workers, including supervisors (5.1%)
- Material recording, scheduling, dispatching, and distributing workers (4.1%)
- Law enforcement workers, including supervisors (4.1%)
- Driver/sales workers and truck drivers (4.1%)
- Other production occupations, including supervisors (3.9%)
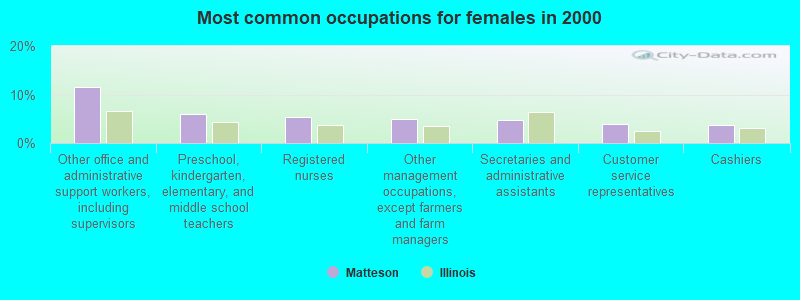
- Other office and administrative support workers, including supervisors (11.5%)
- Preschool, kindergarten, elementary, and middle school teachers (6.0%)
- Registered nurses (5.4%)
- Other management occupations, except farmers and farm managers (4.8%)
- Secretaries and administrative assistants (4.8%)
- Customer service representatives (3.9%)
- Cashiers (3.7%)
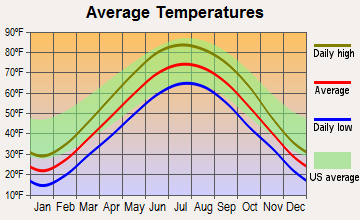
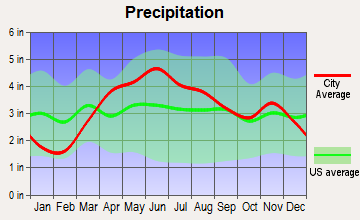
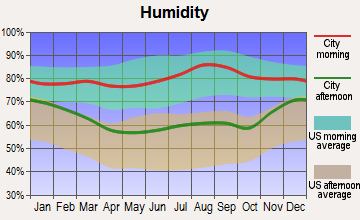
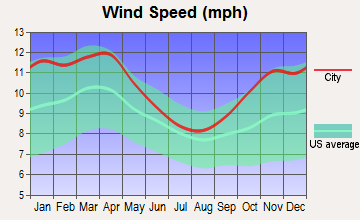
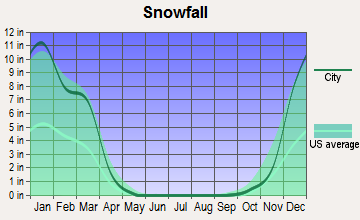
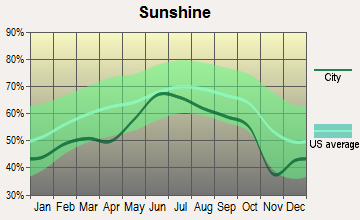
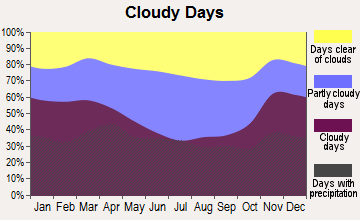
Average climate in Matteson, Illinois
Based on data reported by over 4,000 weather stations
|
|


(lower is better)
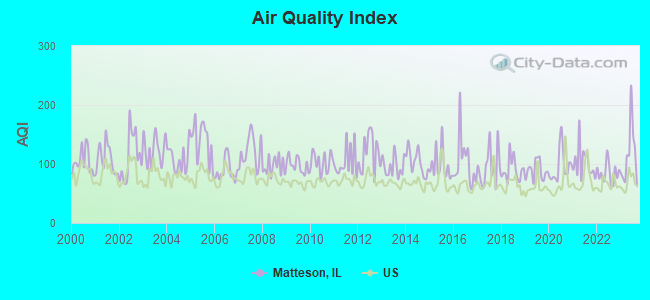
Air Quality Index (AQI) level in 2023 was 115. This is significantly worse than average.
| City: | 115 |
| U.S.: | 73 |
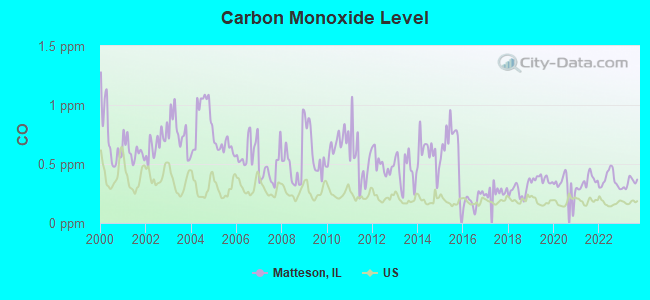
Carbon Monoxide (CO) [ppm] level in 2023 was 0.339. This is worse than average. Closest monitor was 4.9 miles away from the city center.
| City: | 0.339 |
| U.S.: | 0.251 |
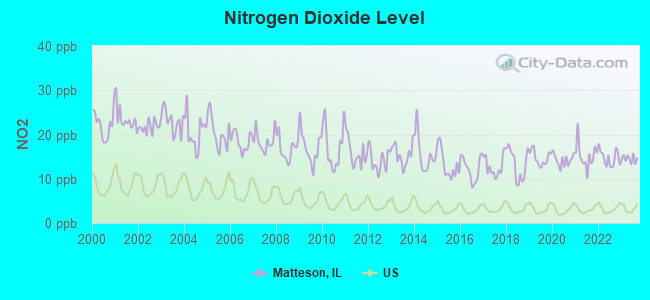
Nitrogen Dioxide (NO2) [ppb] level in 2023 was 14.5. This is significantly worse than average. Closest monitor was 3.0 miles away from the city center.
| City: | 14.5 |
| U.S.: | 5.1 |
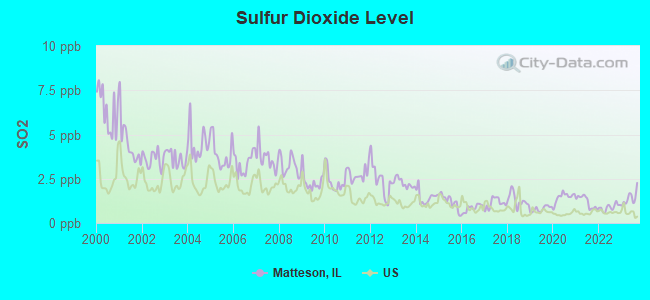
Sulfur Dioxide (SO2) [ppb] level in 2023 was 1.40. This is about average. Closest monitor was 3.0 miles away from the city center.
| City: | 1.40 |
| U.S.: | 1.51 |
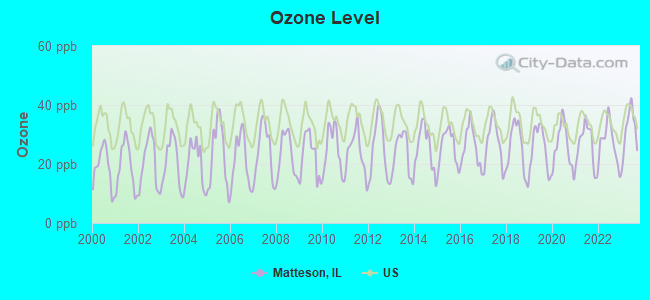
Ozone [ppb] level in 2023 was 31.3. This is about average. Closest monitor was 4.9 miles away from the city center.
| City: | 31.3 |
| U.S.: | 33.3 |
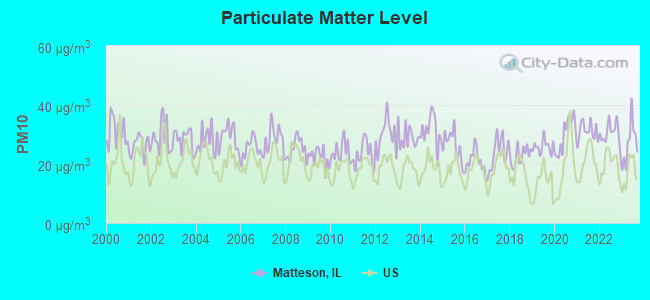
Particulate Matter (PM10) [µg/m3] level in 2023 was 27.0. This is significantly worse than average. Closest monitor was 7.4 miles away from the city center.
| City: | 27.0 |
| U.S.: | 19.2 |
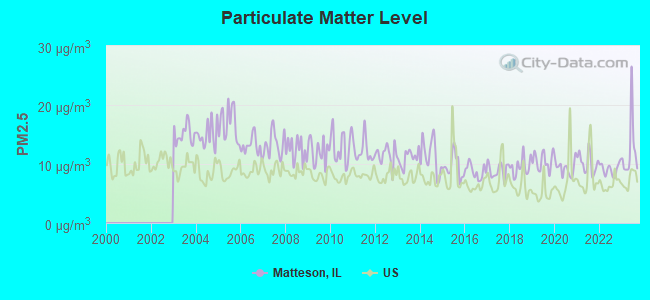
Particulate Matter (PM2.5) [µg/m3] level in 2023 was 12.3. This is significantly worse than average. Closest monitor was 10.5 miles away from the city center.
| City: | 12.3 |
| U.S.: | 8.1 |
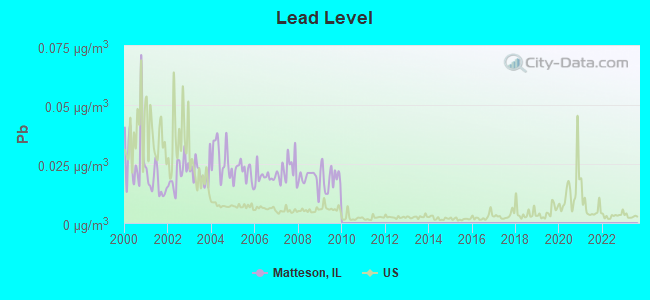
Lead (Pb) [µg/m3] level in 2009 was 0.0190. This is significantly worse than average. Closest monitor was 3.0 miles away from the city center.
| City: | 0.0190 |
| U.S.: | 0.0093 |
Tornado activity:
Matteson-area historical tornado activity is near Illinois state average. It is 63% greater than the overall U.S. average.
On 8/28/1990, a category F5 (max. wind speeds 261-318 mph) tornado 18.7 miles away from the Matteson village center killed 29 people and injured 350 people and caused between $50,000 and $500,000 in damages.
On 4/21/1967, a category F4 (max. wind speeds 207-260 mph) tornado 12.0 miles away from the village center killed 33 people and injured 500 people and caused between $5,000,000 and $50,000,000 in damages.
Earthquake activity:
Matteson-area historical earthquake activity is significantly above Illinois state average. It is 48% greater than the overall U.S. average.On 4/18/2008 at 09:36:59, a magnitude 5.4 (5.1 MB, 4.8 MS, 5.4 MW, 5.2 MW, Class: Moderate, Intensity: VI - VII) earthquake occurred 211.6 miles away from Matteson center
On 6/10/1987 at 23:48:54, a magnitude 5.1 (4.9 MB, 4.4 MS, 4.6 MS, 5.1 LG) earthquake occurred 186.1 miles away from the city center
On 4/18/2008 at 09:36:59, a magnitude 5.2 (5.2 MW, Depth: 8.9 mi) earthquake occurred 211.7 miles away from Matteson center
On 6/28/2004 at 06:10:52, a magnitude 4.2 (4.2 MW, Depth: 6.2 mi, Class: Light, Intensity: IV - V) earthquake occurred 60.2 miles away from the city center
On 6/18/2002 at 17:37:15, a magnitude 5.0 (4.3 MB, 4.6 MW, 5.0 LG) earthquake occurred 243.7 miles away from Matteson center
On 4/18/2008 at 15:14:16, a magnitude 4.8 (4.5 MB, 4.8 MW, 4.6 MW) earthquake occurred 209.9 miles away from the city center
Magnitude types: regional Lg-wave magnitude (LG), body-wave magnitude (MB), surface-wave magnitude (MS), moment magnitude (MW)
Natural disasters:
The number of natural disasters in Cook County (20) is greater than the US average (15).Major Disasters (Presidential) Declared: 15
Emergencies Declared: 4
Causes of natural disasters: Floods: 13, Storms: 12, Tornadoes: 3, Snowstorms: 2, Winter Storms: 2, Blizzard: 1, Hurricane: 1, Snow: 1, Wind: 1, Other: 1 (Note: some incidents may be assigned to more than one category).
Hospitals and medical centers in Matteson:
- MATTESON COURT (237 CENTRAL AVENUE)
- VITAS CORPORATION (600 HOLIDAY PLAZA DRIVE STE 200)
- APPLEWOOD REHABILITATION CENTER (21020 KOSTNER AVENUE)
- DAVITA - OLYMPIA FIELDS DIALYSIS CENTER (4557 B WEST LINCOLN HIGHWAY)
- ABSOLUTE HOME HEALTHCARE, INC (4440 W LINCOLN HWY SUITE 305)
- COMET HOME HEALTHCARE, INC (21141 GOVERNORS HIGHWAY, STE 302)
- HEALTHY HEALTH HOME HEALTH, INC (4747 LINCOLN MALL DRIVE, SUITE 260)
- HERITAGE HEALTH CARE SYSTEMS, INC (ONE PRAIRIE CENTER, 4749 LINCOLN MALL DR, STE 410)
- MARI HOME HEALTHCARE SERVICES, LLC (21141 GOVERNORS HIGHWAY, STE 208)
- QUANTUM HEALTHCARE SERVICES, INC (4747 LINCOLN MALL DRIVE, SUITE 420)
Amtrak stations near Matteson:
- 6 miles: HOMEWOOD (181 1ST ST. & PARK AVE.) . Services: ticket office, enclosed waiting area, public restrooms, public payphones, paid short-term parking, paid long-term parking, public transit connection.
- 12 miles: DYER (SHEFFIELD RD.) . Services: enclosed waiting area, public payphones, free short-term parking, free long-term parking.
- 18 miles: HAMMOND-WHITING (HAMMOND, 1135 CALUMET AVE.) . Services: ticket office, partially wheelchair accessible, enclosed waiting area, public restrooms, public payphones, free short-term parking, free long-term parking, call for taxi service.
Colleges/universities with over 2000 students nearest to Matteson:
- Governors State University (about 5 miles; University Park, IL; Full-time enrollment: 4,043)
- Prairie State College (about 6 miles; Chicago Heights, IL; FT enrollment: 4,050)
- South Suburban College (about 10 miles; South Holland, IL; FT enrollment: 3,972)
- Moraine Valley Community College (about 14 miles; Palos Hills, IL; FT enrollment: 12,008)
- Saint Xavier University (about 14 miles; Chicago, IL; FT enrollment: 3,576)
- Purdue University-Calumet Campus (about 15 miles; Hammond, IN; FT enrollment: 7,343)
- City Colleges of Chicago-Olive-Harvey College (about 16 miles; Chicago, IL; FT enrollment: 4,110)
Public elementary/middle schools in Matteson:
- COLIN POWELL MIDDLE SCH (Students: 816, Location: 20600 MATTESON AVE, Grades: 6-8)
- O W HUTH MIDDLE SCHOOL (Students: 663, Location: 3718 213TH PL, Grades: 7-8)
- MATTESON ELEM SCHOOL (Students: 524, Location: 21245 MAIN ST, Grades: 1-3)
- MARYA YATES ELEMENTARY SCHOOL (Students: 452, Location: 6131 ALLEMONG DR, Grades: PK-5)
- WOODGATE ELEM SCHOOL (Students: 330, Location: 101 CENTRAL AVE, Grades: PK-5)
- SIEDEN PRAIRIE ELEMENTARY SCHOOL (Students: 266, Location: 725 NOTRE DAME DR, Grades: KG-5)
Private elementary/middle schools in Matteson:
Library in Matteson:
User-submitted facts and corrections:
- St. Lawrence O'Toole is a NCLB Blue Ribbon School.
Points of interest:
Notable locations in Matteson: Matteson Metrorail Station (A), Matteson Village Hall (B), Matteson Public Library (C), Matteson Fire Department Station 1 (D), Matteson Fire Department Station 2 (E). Display/hide their locations on the map
Shopping Centers: Matteson Plaza Shopping Center (1), Lincoln Mall Shopping Center (2). Display/hide their locations on the map
Churches in Matteson include: Zion Church (A), Lutheran Church of the Holy Trinity (B), Saint Pauls Church (C). Display/hide their locations on the map
Cemeteries: Lutheran Cemetery (1), Saint Pauls Evangelical Lutheran Cemetery (2), Zion Evangelical Lutheran Cemetery (3), Elliott Family Cemetery (4). Display/hide their locations on the map
Parks in Matteson include: Memorial Park (1), Notre Dame Park (2), Oakwood Park (3), Governors Trail Park (4), Old Plank Road Prairie Nature Preserve (5), Woodgate Park (6), Alleymong Park (7). Display/hide their locations on the map
Tourist attraction: Waterwerks Aquariums (Aquariums; 3100 W. Holden Circle).
Hotels: Country Inn-Suites Matteson (950 Lake Superior Drive), Hampton Inn Chicago-Matteson (5200 Lincoln Hwy), Country Inn & Suites by Carlson-Matteson (950 Lake Superior Drive), Baymont Inns & Suites (5210 Southwick Drive), Covert Motel Inc (21609 Governors Highway), Holiday Inn Matteson (500 Holiday Plaza Drive).
Birthplace of: Tai Streets - 2005 NFL player (Detroit Lions, born: Apr 20, 1977), Jon Asamoah - Football player.
Drinking water stations with addresses in Matteson that have no violations reported:
- MAYO DAY CARE (Population served: 25, Primary Water Source Type: Groundwater)
| This village: | 2.8 people |
| Illinois: | 2.6 people |
| This village: | 74.5% |
| Whole state: | 65.8% |
| This village: | 4.8% |
| Whole state: | 6.3% |
Likely homosexual households (counted as self-reported same-sex unmarried-partner households)
- Lesbian couples: 0.4% of all households
- Gay men: 0.3% of all households
People in group quarters in Matteson in 2010:
- 93 people in nursing facilities/skilled-nursing facilities
- 30 people in other noninstitutional facilities
- 19 people in group homes intended for adults
16 people in homes for the mentally retarded in 2000
Banks with branches in Matteson (2011 data):
- JPMorgan Chase Bank, National Association: Matteson Dominicks at 4233 West 211th Street, branch established on 1997/02/06; Lincoln Mall Banking Center at 4411 West 211st Street, branch established on 2007/12/27. Info updated 2011/11/10: Bank assets: $1,811,678.0 mil, Deposits: $1,190,738.0 mil, headquarters in Columbus, OH, positive income, International Specialization, 5577 total offices, Holding Company: Jpmorgan Chase & Co.
- First American Bank: Matteson Branch at 20704 S. Cicero Avenue, branch established on 2005/06/16. Info updated 2010/01/19: Bank assets: $2,710.6 mil, Deposits: $2,213.4 mil, headquarters in Elk Grove Village, IL, negative income in the last year, Commercial Lending Specialization, 50 total offices, Holding Company: First American Bank Corporation
- Guaranty Bank: Matteson Club Foods Branch at 4200 West 211th Street, branch established on 2001/04/04. Info updated 2011/07/21: Bank assets: $1,179.1 mil, Deposits: $1,102.7 mil, headquarters in Milwaukee, WI, negative income in the last year, Mortgage Lending Specialization, 166 total offices
- BMO Harris Bank National Association: Lincoln Mall Drive Branch at 4940 West 211th Street, branch established on 1934/08/01. Info updated 2011/07/14: Bank assets: $97,264.0 mil, Deposits: $75,624.6 mil, headquarters in Chicago, IL, positive income, 717 total offices, Holding Company: Bank Of Montreal
- Bank of America, National Association: Matteson Branch at 4800 Southwick Drive, branch established on 1966/09/01. Info updated 2009/11/18: Bank assets: $1,451,969.3 mil, Deposits: $1,077,176.8 mil, headquarters in Charlotte, NC, positive income, 5782 total offices, Holding Company: Bank Of America Corporation
- Great Lakes Bank, National Association: Matteson Branch at 4600 West Lincoln Highway, branch established on 1973/01/02. Info updated 2007/12/05: Bank assets: $627.2 mil, Deposits: $501.8 mil, headquarters in Blue Island, IL, positive income, Commercial Lending Specialization, 8 total offices, Holding Company: Great Lakes Financial Resources, Inc. Employee Stock Ownership Plan
- Fifth Third Bank: Matteson Banking Center Branch at 21403 Cicero Avenue, branch established on 2009/01/21. Info updated 2009/10/05: Bank assets: $114,540.4 mil, Deposits: $89,689.1 mil, headquarters in Cincinnati, OH, positive income, Commercial Lending Specialization, 1378 total offices, Holding Company: Fifth Third Bancorp
- RBS Citizens, National Association: Matteson at 4350 West Lincoln Highway, branch established on 1965/07/15. Info updated 2007/09/19: Bank assets: $106,940.6 mil, Deposits: $75,690.2 mil, headquarters in Providence, RI, positive income, 1135 total offices, Holding Company: Uk Financial Investments Limited
For population 15 years and over in Matteson:
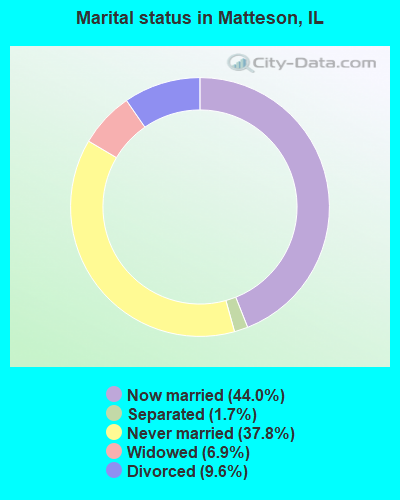
- Never married: 37.8%
- Now married: 44.0%
- Separated: 1.7%
- Widowed: 6.9%
- Divorced: 9.6%
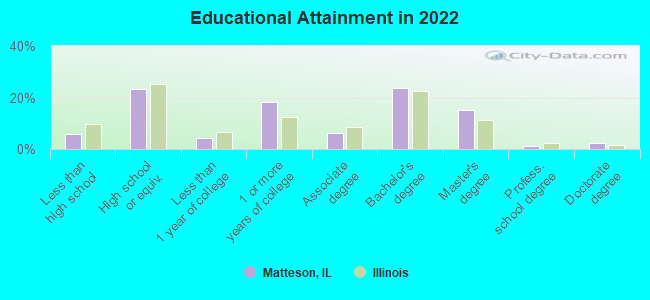
For population 25 years and over in Matteson:
- High school or higher: 94.2%
- Bachelor's degree or higher: 40.5%
- Graduate or professional degree: 17.7%
- Unemployed: 5.6%
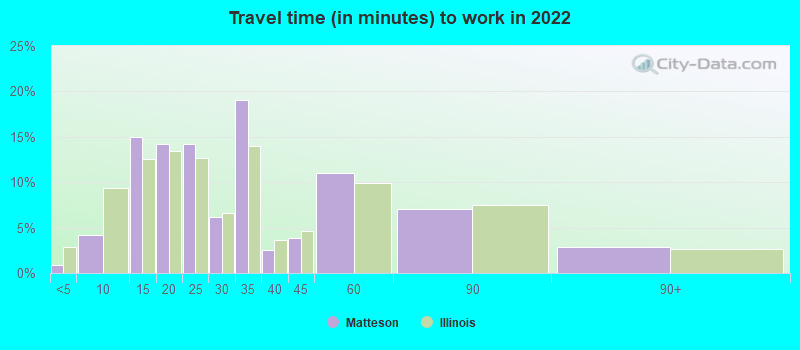
- Mean travel time to work (commute): 30.6 minutes
| Here: | 10.5 |
| Illinois average: | 12.5 |


Graphs represent county-level data. Detailed 2008 Election Results
Neighborhoods in Matteson:
(Matteson, Illinois Neighborhood Map)- Apple Oak (Apple-Oak) neighborhood
- Auto Mall neighborhood
- Butterfield Place (Butterfield Pl) neighborhood
- Creekside neighborhood
- Glenridge (Cricket Hill) neighborhood
- Holden Park neighborhood
- Lincoln Terrace (Lincoln Terr) neighborhood
- Maple Brook (Maplebrook) neighborhood
- Michael John Manor neighborhood
- Newbury Estates (Newbury) neighborhood
- Old Mattteson (Downtown) neighborhood
- Oxford Estates neighborhood
- Providence Manor neighborhood
- Ridgeland Manor neighborhood
- Southwick Courtyards (Southwick Courtyard) neighborhood
- Timber Ridge neighborhood
- Virginia Estates neighborhood
- Woodgate (Wood Gate) neighborhood
Religion statistics for Matteson, IL (based on Cook County data)


| Religion | Adherents | Congregations |
|---|---|---|
| Catholic | 1,947,223 | 376 |
| Evangelical Protestant | 432,975 | 1,484 |
| Other | 312,636 | 403 |
| Mainline Protestant | 202,114 | 630 |
| Black Protestant | 148,895 | 395 |
| Orthodox | 53,276 | 66 |
| None | 2,097,556 | - |
Food Environment Statistics:
| This county: | 2.77 / 10,000 pop. |
| Illinois: | 2.24 / 10,000 pop. |
| Here: | 0.04 / 10,000 pop. |
| State: | 0.08 / 10,000 pop. |
| Here: | 0.93 / 10,000 pop. |
| Illinois: | 0.75 / 10,000 pop. |
| Cook County: | 1.53 / 10,000 pop. |
| Illinois: | 2.61 / 10,000 pop. |
| Here: | 6.67 / 10,000 pop. |
| State: | 6.86 / 10,000 pop. |
| Cook County: | 8.4% |
| Illinois: | 8.3% |
| This county: | 23.5% |
| State: | 25.2% |
| This county: | 16.3% |
| State: | 14.5% |
Health and Nutrition:
| Matteson: | 49.5% |
| Illinois: | 49.5% |
| Matteson: | 47.2% |
| State: | 47.2% |
| Here: | 29.5 |
| Illinois: | 28.6 |
| This city: | 18.0% |
| Illinois: | 20.5% |
| Matteson: | 13.1% |
| Illinois: | 10.8% |
| This city: | 6.6 |
| State: | 6.8 |
| Matteson: | 37.0% |
| State: | 33.4% |
| This city: | 55.3% |
| Illinois: | 56.4% |
| This city: | 81.8% |
| State: | 79.9% |
More about Health and Nutrition of Matteson, IL Residents
| Local government employment and payroll (March 2022) | |||||
| Function | Full-time employees | Monthly full-time payroll | Average yearly full-time wage | Part-time employees | Monthly part-time payroll |
|---|---|---|---|---|---|
| Police Protection - Officers | 40 | $394,754 | $118,426 | 2 | $1,909 |
| Firefighters | 32 | $304,019 | $114,007 | 0 | $0 |
| Streets and Highways | 25 | $156,907 | $75,315 | 0 | $0 |
| Parks and Recreation | 7 | $36,323 | $62,268 | 50 | $45,530 |
| Housing and Community Development (Local) | 6 | $41,084 | $82,168 | 2 | $1,988 |
| Financial Administration | 5 | $30,774 | $73,858 | 0 | $0 |
| Other Government Administration | 4 | $17,017 | $51,051 | 7 | $1,795 |
| Police - Other | 4 | $23,483 | $70,449 | 9 | $9,406 |
| Other and Unallocable | 2 | $11,638 | $69,828 | 0 | $0 |
| Totals for Government | 125 | $1,015,999 | $97,536 | 70 | $60,629 |
Matteson government finances - Expenditure in 2018 (per resident):
- Construction - Housing and Community Development: $2,476,000 ($134.28)
Central Staff Services: $59,000 ($3.20)
- Current Operations - Police Protection: $7,457,000 ($404.41)
Local Fire Protection: $6,442,000 ($349.37)
Water Utilities: $5,488,000 ($297.63)
Central Staff Services: $4,367,000 ($236.83)
Parks and Recreation: $3,022,000 ($163.89)
Regular Highways: $1,584,000 ($85.90)
Financial Administration: $883,000 ($47.89)
General - Other: $499,000 ($27.06)
- General - Interest on Debt: $5,059,000 ($274.36)
- Other Capital Outlay - Regular Highways: $369,000 ($20.01)
Central Staff Services: $107,000 ($5.80)
Police Protection: $99,000 ($5.37)
Parks and Recreation: $7,000 ($0.38)
- Total Salaries and Wages: $11,966,000 ($648.95)
Matteson government finances - Revenue in 2018 (per resident):
- Charges - Other: $2,944,000 ($159.66)
Parks and Recreation: $1,179,000 ($63.94)
- Federal Intergovernmental - Public Welfare: $165,000 ($8.95)
- Miscellaneous - Fines and Forfeits: $3,119,000 ($169.15)
General Revenue - Other: $1,464,000 ($79.40)
Interest Earnings: $172,000 ($9.33)
- Revenue - Water Utilities: $7,421,000 ($402.46)
- State Intergovernmental - General Local Government Support: $6,636,000 ($359.89)
Highways: $550,000 ($29.83)
Other: $144,000 ($7.81)
Water Utilities: $48,000 ($2.60)
Public Welfare: $8,000 ($0.43)
- Tax - Property: $8,045,000 ($436.30)
Other Selective Sales: $3,720,000 ($201.75)
Public Utilities Sales: $1,382,000 ($74.95)
Other License: $1,022,000 ($55.43)
Matteson government finances - Debt in 2018 (per resident):
- Long Term Debt - Beginning Outstanding - Unspecified Public Purpose: $126,464,000 ($6858.51)
Outstanding Unspecified Public Purpose: $115,314,000 ($6253.81)
Retired Unspecified Public Purpose: $17,848,000 ($967.95)
Issue, Unspecified Public Purpose: $6,697,000 ($363.20)
Matteson government finances - Cash and Securities in 2018 (per resident):
- Other Funds - Cash and Securities: $19,826,000 ($1075.22)
3.53% of this county's 2021 resident taxpayers lived in other counties in 2020 ($82,405 average adjusted gross income)
| Here: | 3.53% |
| Illinois average: | 5.09% |
0.01% of residents moved from foreign countries ($114 average AGI)
Cook County: 0.01% Illinois average: 0.01%
Top counties from which taxpayers relocated into this county between 2020 and 2021:
| from DuPage County, IL | |
| from Lake County, IL | |
| from Will County, IL |
5.44% of this county's 2020 resident taxpayers moved to other counties in 2021 ($120,340 average adjusted gross income)
| Here: | 5.44% |
| Illinois average: | 6.10% |
0.01% of residents moved to foreign countries ($140 average AGI)
Cook County: 0.01% Illinois average: 0.01%
Top counties to which taxpayers relocated from this county between 2020 and 2021:
| to DuPage County, IL | |
| to Will County, IL | |
| to Lake County, IL |
| Businesses in Matteson, IL | ||||
| Name | Count | Name | Count | |
|---|---|---|---|---|
| AT&T | 1 | McDonald's | 1 | |
| Bally Total Fitness | 1 | Men's Wearhouse | 1 | |
| Bath & Body Works | 1 | Menards | 1 | |
| Burger King | 1 | New Balance | 1 | |
| Burlington Coat Factory | 1 | Nike | 6 | |
| Carson Pirie Scott | 1 | Nissan | 1 | |
| Casual Male XL | 1 | OfficeMax | 1 | |
| Catherines | 1 | Old Navy | 1 | |
| Chuck E. Cheese's | 1 | Olive Garden | 1 | |
| Circle K | 1 | Panda Express | 1 | |
| Cracker Barrel | 1 | Panera Bread | 1 | |
| Dairy Queen | 1 | Payless | 1 | |
| Discount Tire | 1 | PetSmart | 1 | |
| Express | 1 | Pizza Hut | 1 | |
| Famous Footwear | 1 | Quiznos | 1 | |
| FedEx | 5 | RadioShack | 1 | |
| Finish Line | 1 | Red Lobster | 1 | |
| Firestone Complete Auto Care | 1 | Safeway | 1 | |
| Foot Locker | 1 | Sam's Club | 1 | |
| Ford | 1 | Sears | 2 | |
| GNC | 1 | Sephora | 1 | |
| GameStop | 2 | Sprint Nextel | 1 | |
| H&R Block | 2 | Starbucks | 2 | |
| Hilton | 1 | Subway | 2 | |
| Holiday Inn | 1 | T-Mobile | 3 | |
| Home Depot | 1 | Taco Bell | 1 | |
| Honda | 1 | Target | 1 | |
| Hyundai | 1 | Toyota | 1 | |
| IHOP | 1 | Toys"R"Us | 1 | |
| JCPenney | 1 | U-Haul | 2 | |
| Jones New York | 1 | U.S. Cellular | 2 | |
| KFC | 1 | UPS | 4 | |
| LA Fitness | 1 | Vans | 1 | |
| La Quinta | 1 | Verizon Wireless | 1 | |
| Lane Bryant | 1 | Victoria's Secret | 1 | |
| Lane Furniture | 1 | Vons | 1 | |
| LensCrafters | 1 | Walmart | 1 | |
| Long John Silver's | 1 | Wendy's | 1 | |
| Marshalls | 1 | White Castle | 1 | |
| MasterBrand Cabinets | 1 | |||
Strongest AM radio stations in Matteson:
- WLS (890 AM; 50 kW; CHICAGO, IL; Owner: WLS, INC.)
- WYLL (1160 AM; 50 kW; CHICAGO, IL; Owner: SCA LICENSE CORPORATION)
- WVIV (1200 AM; 20 kW; CHICAGO, IL; Owner: WLXX-AM LICENSE CORP.)
- WMVP (1000 AM; 50 kW; CHICAGO, IL; Owner: ABC, INC.)
- WSCR (670 AM; 50 kW; CHICAGO, IL; Owner: INFINITY BROADCASTING OPERATIONS, INC.)
- WBBM (780 AM; 50 kW; CHICAGO, IL; Owner: INFINITY BROADCASTING OPERATIONS, INC.)
- WGN (720 AM; 50 kW; CHICAGO, IL; Owner: WGN CONTINENTAL BROADCASTING CO.)
- WNTD (950 AM; 5 kW; CHICAGO, IL; Owner: RADIO UNICA OF CHICAGO LICENSE CORP.)
- WIND (560 AM; 5 kW; CHICAGO, IL; Owner: TICHENOR LICENSE CORPORATION ("TLC"))
- WRDZ (1300 AM; 4 kW; LA GRANGE, IL; Owner: ABC, INC.)
- WNWI (1080 AM; 3 kW; OAK LAWN, IL; Owner: BIRACH BROADCASTING CORPORATION)
- WGCI (1390 AM; 5 kW; CHICAGO, IL; Owner: AMFM RADIO LICENSES, L.L.C.)
- WBEE (1570 AM; 1 kW; HARVEY, IL)
Strongest FM radio stations in Matteson:
- WBMF (88.1 FM; CRETE, IL; Owner: AMERICAN FAMILY ASSOCIATION)
- WCKG (105.9 FM; ELMWOOD PARK, IL; Owner: INFINITY HOLDINGS CORPORATION OF ORLANDO)
- WLIT-FM (93.9 FM; CHICAGO, IL; Owner: AMFM RADIO LICENSES, L.L.C.)
- WJMK (104.3 FM; CHICAGO, IL; Owner: INFINITY BROADCASTING CORP. OF ILLINOIS)
- WNUA (95.5 FM; CHICAGO, IL; Owner: AMFM RADIO LICENSES, L.L.C.)
- WTMX (101.9 FM; SKOKIE, IL; Owner: BONNEVILLE HOLDING COMPANY)
- WBBM-FM (96.3 FM; CHICAGO, IL; Owner: INFINITY BROADCASTING OPERATIONS, INC.)
- WKSC-FM (103.5 FM; CHICAGO, IL; Owner: AMFM RADIO LICENSES, L.L.C.)
- WFMT (98.7 FM; CHICAGO, IL; Owner: WINDOW TO THE WORLD COMMUNICATIONS)
- WZZN (94.7 FM; CHICAGO, IL; Owner: ABC CHICAGO FM RADIO,INC.)
- WGCI-FM (107.5 FM; CHICAGO, IL; Owner: AMFM RADIO LICENSES, L.L.C.)
- WBEZ (91.5 FM; CHICAGO, IL; Owner: THE WBEZ ALLIANCE, INC.)
- WKQX (101.1 FM; CHICAGO, IL; Owner: EMMIS RADIO LICENSE CORPORATION)
- WLUP-FM (97.9 FM; CHICAGO, IL; Owner: BONNEVILLE HOLDING COMPANY)
- WNND (100.3 FM; CHICAGO, IL; Owner: BONNEVILLE HOLDING COMPANY)
- WOJO (105.1 FM; EVANSTON, IL; Owner: TICHENOR LICENSE CORPORATION ("TLC"))
- WUSN (99.5 FM; CHICAGO, IL; Owner: INFINITY BROADCASTING CORPORATION OF CHICAGO)
- WVAZ (102.7 FM; OAK PARK, IL; Owner: AMFM RADIO LICENSES, L.L.C.)
- WDRV (97.1 FM; CHICAGO, IL; Owner: BONNEVILLE HOLDING COMPANY)
- WYCA (106.3 FM; LANSING, IL; Owner: DONTRON, INC.)
TV broadcast stations around Matteson:
- W54AP (Channel 54; BLUE ISLAND, IL; Owner: CATHOLIC VIEWS BROADCASTS, INC.)
- WLS-TV (Channel 7; CHICAGO, IL; Owner: WLS TELEVISION, INC.)
- WYIN (Channel 56; GARY, IN; Owner: NORTHWEST INDIANA PUBLIC BROADCASTING, INC.)
- WMAQ-TV (Channel 5; CHICAGO, IL; Owner: NBC SUBSIDIARY (WMAQ-TV), INC.)
- WTTW (Channel 11; CHICAGO, IL; Owner: WINDOW TO THE WORLD COMMUNICATIONS, INC.)
- WGN-TV (Channel 9; CHICAGO, IL; Owner: WGN CONTINENTAL BROADCASTING COMPANY)
- WGBO-TV (Channel 66; JOLIET, IL; Owner: WGBO LICENSE PARTNERSHIP, G.P.)
- WBBM-TV (Channel 2; CHICAGO, IL; Owner: CBS BROADCASTING INC.)
- WPWR-TV (Channel 50; GARY, IN; Owner: FOX TELEVISION STATIONS, INC.)
- WXFT (Channel 60; AURORA, IL; Owner: TELEFUTURA CHICAGO LLC)
- WCIU-TV (Channel 26; CHICAGO, IL; Owner: WCIU-TV LIMITED PARTNERSHIP)
- WCPX (Channel 38; CHICAGO, IL; Owner: PAXSON CHICAGO LICENSE, INC.)
- WFLD (Channel 32; CHICAGO, IL; Owner: FOX TELEVISION STATIONS, INC.)
- W68DO (Channel 68; PALATINE, IL; Owner: TRINITY BROADCASTING NETWORK)
- WFBT-CA (Channel 23; CHICAGO, IL; Owner: CHANNEL 23 LIMITED PARTNERSHIP)
- WJYS (Channel 62; HAMMOND, IN; Owner: JOVON BROADCASTING CORPORATION)
- WSNS-TV (Channel 44; CHICAGO, IL; Owner: TELEMUNDO OF CHICAGO, INC.)
- WOCH-LP (Channel 28; CHICAGO, IL; Owner: KM LPTV OF CHICAGO-28, L.L.C.)
- WYCC (Channel 20; CHICAGO, IL; Owner: COLLEGE DIST. #508, COUNTY OF COOK)
- WOCK-CA (Channel 13; CHICAGO, IL; Owner: KM LPTV OF CHICAGO-13, L.L.C.)
- W34CK (Channel 34; ARLINGTON HEIGHTS, IL; Owner: FIRST UNITED, INC.)
- National Bridge Inventory (NBI) Statistics
- 27Number of bridges
- 138ft / 41.8mTotal length
- $4,915,000Total costs
- 663,025Total average daily traffic
- 68,521Total average daily truck traffic
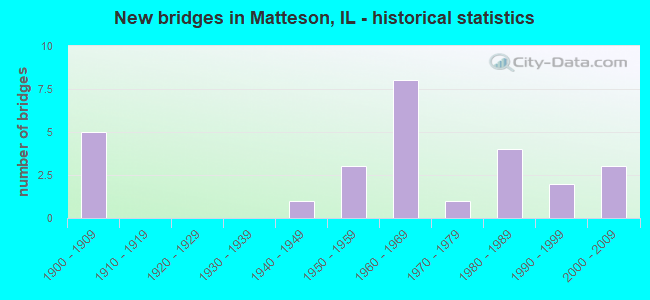
- New bridges - historical statistics
- 51900-1909
- 11940-1949
- 31950-1959
- 81960-1969
- 11970-1979
- 41980-1989
- 21990-1999
- 32000-2009
FCC Registered Antenna Towers:
42 (See the full list of FCC Registered Antenna Towers in Matteson)FCC Registered Private Land Mobile Towers:
1 (See the full list of FCC Registered Private Land Mobile Towers in Matteson, IL)FCC Registered Broadcast Land Mobile Towers:
15 (See the full list of FCC Registered Broadcast Land Mobile Towers)FCC Registered Microwave Towers:
19 (See the full list of FCC Registered Microwave Towers in this town)FCC Registered Amateur Radio Licenses:
33 (See the full list of FCC Registered Amateur Radio Licenses in Matteson)FAA Registered Aircraft:
3- Aircraft: CESSNA 182A (Category: Land, Seats: 4, Weight: Up to 12,499 Pounds, Speed: 119 mph), Engine: CONT MOTOR O-470 SERIES (230 HP) (Reciprocating)
N-Number: 2090G, N2090G, N-2090G, Serial Number: 51390, Year manufactured: 1958, Airworthiness Date: 07/01/1958, Certificate Issue Date: 09/27/1979
Registrant (Individual): Gerald J Sr Coulon, 3703 West 215 St, Matteson, IL 60443 - Aircraft: PIPER PA-24-250 (Category: Land, Seats: 4, Weight: Up to 12,499 Pounds, Speed: 135 mph), Engine: LYCOMING 0-540 SERIES (250 HP) (Reciprocating)
N-Number: 7185P, N7185P, N-7185P, Serial Number: 24-2355, Year manufactured: 1960, Certificate Issue Date: 11/24/2009
Registrant (Individual): Darryl T Mack, Po Box 1637, Matteson, IL 60443 - Aircraft: QUAD CITY CHALLENGER CHALLENGER I (Category: Land, Seats: 2, Weight: Up to 12,499 Pounds), Engine: 2 Cycle
N-Number: 9106T, N9106T, N-9106T, Serial Number: R418 715, Certificate Issue Date: 01/18/2007
Registrant (Individual): Leonard Richard, 100 Maryview Pkwy, Matteson, IL 60443
Deregistered: Cancel Date: 04/29/2004
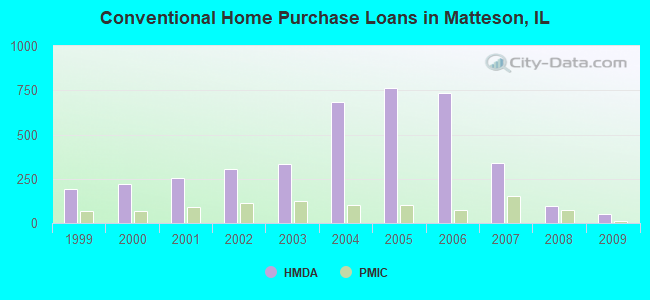
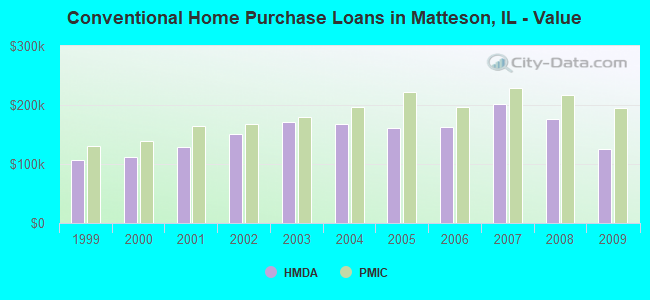
| Home Mortgage Disclosure Act Aggregated Statistics For Year 2009 (Based on 1 full and 6 partial tracts) | ||||||||||||||
| A) FHA, FSA/RHS & VA Home Purchase Loans | B) Conventional Home Purchase Loans | C) Refinancings | D) Home Improvement Loans | E) Loans on Dwellings For 5+ Families | F) Non-occupant Loans on < 5 Family Dwellings (A B C & D) | G) Loans On Manufactured Home Dwelling (A B C & D) | ||||||||
|---|---|---|---|---|---|---|---|---|---|---|---|---|---|---|
| Number | Average Value | Number | Average Value | Number | Average Value | Number | Average Value | Number | Average Value | Number | Average Value | Number | Average Value | |
| LOANS ORIGINATED | 115 | $179,863 | 49 | $124,913 | 298 | $199,337 | 11 | $48,626 | 0 | $0 | 21 | $79,536 | 5 | $42,514 |
| APPLICATIONS APPROVED, NOT ACCEPTED | 12 | $193,649 | 5 | $137,412 | 49 | $196,537 | 2 | $21,175 | 1 | $160,720 | 1 | $97,370 | 1 | $12,310 |
| APPLICATIONS DENIED | 50 | $168,388 | 20 | $112,641 | 221 | $203,842 | 25 | $21,715 | 0 | $0 | 8 | $115,155 | 5 | $43,164 |
| APPLICATIONS WITHDRAWN | 31 | $184,721 | 11 | $158,965 | 76 | $208,306 | 2 | $76,835 | 0 | $0 | 4 | $109,082 | 0 | $0 |
| FILES CLOSED FOR INCOMPLETENESS | 11 | $149,554 | 4 | $162,285 | 47 | $216,860 | 2 | $21,615 | 0 | $0 | 2 | $109,740 | 1 | $13,850 |
Detailed HMDA statistics for the following Tracts: 8300.01 , 8300.03, 8300.04, 8300.06, 8302.01, 8302.02
| Private Mortgage Insurance Companies Aggregated Statistics For Year 2009 (Based on 1 full and 5 partial tracts) | ||||
| A) Conventional Home Purchase Loans | B) Refinancings | |||
|---|---|---|---|---|
| Number | Average Value | Number | Average Value | |
| LOANS ORIGINATED | 10 | $195,736 | 6 | $268,622 |
| APPLICATIONS APPROVED, NOT ACCEPTED | 7 | $261,746 | 4 | $244,572 |
| APPLICATIONS DENIED | 0 | $0 | 2 | $296,150 |
| APPLICATIONS WITHDRAWN | 1 | $93,470 | 1 | $149,240 |
| FILES CLOSED FOR INCOMPLETENESS | 0 | $0 | 0 | $0 |
Detailed PMIC statistics for the following Tracts: 8300.01 , 8300.03, 8300.04, 8300.06, 8302.01, 8302.02
2002 - 2018 National Fire Incident Reporting System (NFIRS) incidents
- Fire incident types reported to NFIRS in Matteson, IL
- 85554.4%Structure Fires
- 35022.3%Outside Fires
- 32220.5%Mobile Property/Vehicle Fires
- 452.9%Other
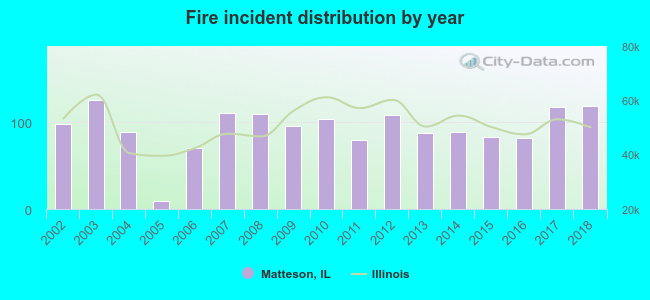 According to the data from the years 2002 - 2018 the average number of fire incidents per year is 92. The highest number of fire incidents - 125 took place in 2003, and the least - 9 in 2005. The data has a rising trend.
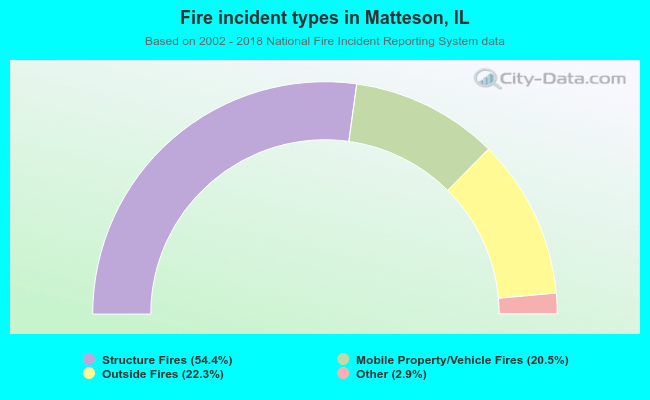 When looking into fire subcategories, the most reports belonged to: Structure Fires (54.4%), and Outside Fires (22.3%).
Fire-safe hotels and motels in Matteson, Illinois:
- Baymont Inn & Suites-chicago (matteson), 5210 W Southwick Dr, Matteson, Illinois 60443 , Phone: (708) 503-0999, Fax: (708) 503-0444
- Holiday Inn Matteson Hotel & Conference Center, 500 Holiday Plaza Dr, Matteson, Illinois 60443 , Phone: (708) 747-3500, Fax: (708) 747-9767
- Covert Motel, 21609 Governors Hwy, Matteson, Illinois 60443 , Phone: (708) 748-8000, Fax: (708) 748-8028
- Country Inn & Suites, 950 Lake Superior Dr, Matteson, Illinois 60443 , Phone: (708) 748-4740, Fax: (708) 748-4916
- Americas Best Value Inn & Suites, 5200 W Lincoln Hwy Matteson, Matteson, Illinois 60443 , Phone: (708) 481-3900, Fax: (708) 481-8424
- Hampton Inn & Suites, 20920 Matteson Ave, Matteson, Illinois 60443 , Phone: (708) 748-4102, Fax: (708) 748-4145
| Most common first names in Matteson, IL among deceased individuals | ||
| Name | Count | Lived (average) |
|---|---|---|
| John | 87 | 73.3 years |
| Mary | 67 | 79.8 years |
| Robert | 56 | 70.6 years |
| William | 56 | 73.0 years |
| James | 46 | 70.6 years |
| Edward | 43 | 74.9 years |
| Dorothy | 40 | 77.1 years |
| Charles | 39 | 74.8 years |
| George | 35 | 76.6 years |
| Frank | 35 | 71.8 years |
| Most common last names in Matteson, IL among deceased individuals | ||
| Last name | Count | Lived (average) |
|---|---|---|
| Johnson | 23 | 76.6 years |
| Smith | 18 | 73.5 years |
| Brown | 16 | 63.9 years |
| Jones | 14 | 64.4 years |
| Anderson | 13 | 75.3 years |
| Miller | 13 | 71.5 years |
| Green | 11 | 70.5 years |
| Wilson | 11 | 71.3 years |
| Thomas | 10 | 79.1 years |
| Sullivan | 10 | 74.3 years |
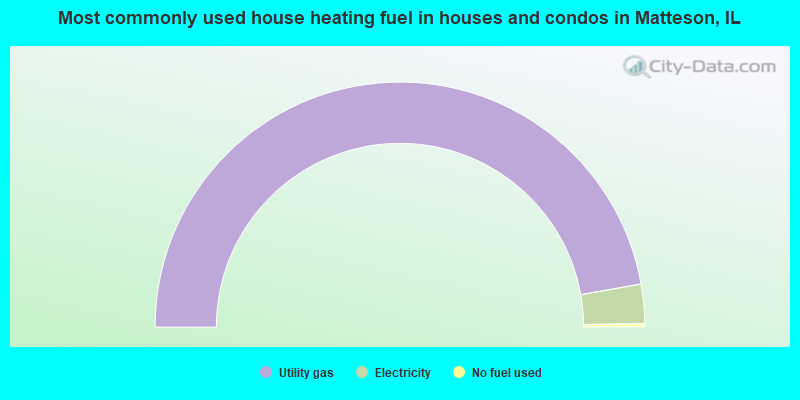
- 94.4%Utility gas
- 5.2%Electricity
- 0.4%No fuel used
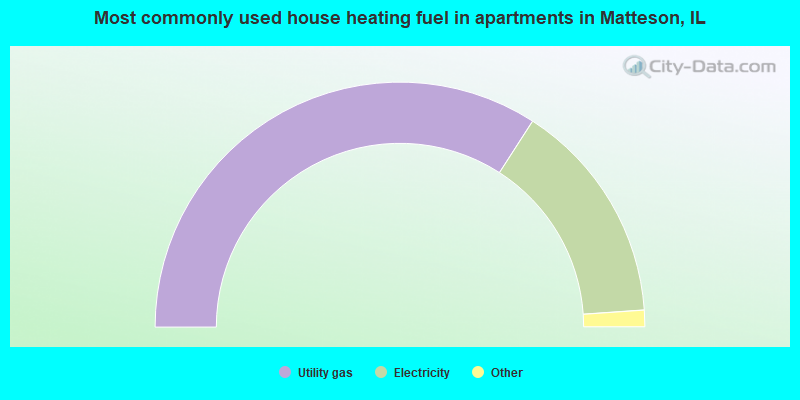
- 68.3%Utility gas
- 29.6%Electricity
- 1.2%Bottled, tank, or LP gas
- 0.9%No fuel used
Matteson compared to Illinois state average:
- Unemployed percentage below state average.
- Black race population percentage significantly above state average.
- Hispanic race population percentage significantly below state average.
- Foreign-born population percentage below state average.
- Renting percentage below state average.
- Length of stay since moving in significantly above state average.
- House age significantly below state average.
- Percentage of population with a bachelor's degree or higher above state average.
Matteson on our top lists:
- #49 on the list of "Top 101 cities with the most full-time local library workers per 1000 residents (population 5,000+)"
- #58 on the list of "Top 101 cities with the most people taking railroad to work (population 5,000+)"
- #83 on the list of "Top 101 cities with largest percentage of males in industries: transportation and warehousing (population 5,000+)"
- #94 on the list of "Top 101 cities with largest percentage of females in occupations: health diagnosing and treating practitioners and other technical occupations (population 5,000+)"
- #53 (60471) on the list of "Top 101 zip codes with the lowest 2012 average reported profit/loss from business (pop 5,000+)"
- #1 on the list of "Top 101 counties with the most Black Protestant congregations"
- #1 on the list of "Top 101 counties with the most Catholic congregations"
- #1 on the list of "Top 101 counties with the highest surface withdrawal of fresh water for public supply"
- #2 on the list of "Top 101 counties with the most Black Protestant adherents"
- #2 on the list of "Top 101 counties with the most Orthodox congregations (pop. 50,000+)"

|
|
Total of 16 patent applications in 2008-2024.