Melrose, Massachusetts Submit your own pictures of this city and show them to the world
OSM Map
General Map
Google Map
MSN Map
OSM Map
General Map
Google Map
MSN Map
OSM Map
General Map
Google Map
MSN Map
OSM Map
General Map
Google Map
MSN Map
Please wait while loading the map...
Population in 2022: 29,155 (100% urban, 0% rural). Population change since 2000: +7.4%Males: 14,199 Females: 14,956
March 2022 cost of living index in Melrose: 137.6 (high, U.S. average is 100) Percentage of residents living in poverty in 2022: 4.0%for White Non-Hispanic residents , 11.7% for Black residents , 6.4% for Hispanic or Latino residents , 13.5% for other race residents , 4.3% for two or more races residents )
Profiles of local businesses
Business Search - 14 Million verified businesses
Data:
Median household income ($)
Median household income (% change since 2000)
Household income diversity
Ratio of average income to average house value (%)
Ratio of average income to average rent
Median household income ($) - White
Median household income ($) - Black or African American
Median household income ($) - Asian
Median household income ($) - Hispanic or Latino
Median household income ($) - American Indian and Alaska Native
Median household income ($) - Multirace
Median household income ($) - Other Race
Median household income for houses/condos with a mortgage ($)
Median household income for apartments without a mortgage ($)
Races - White alone (%)
Races - White alone (% change since 2000)
Races - Black alone (%)
Races - Black alone (% change since 2000)
Races - American Indian alone (%)
Races - American Indian alone (% change since 2000)
Races - Asian alone (%)
Races - Asian alone (% change since 2000)
Races - Hispanic (%)
Races - Hispanic (% change since 2000)
Races - Native Hawaiian and Other Pacific Islander alone (%)
Races - Native Hawaiian and Other Pacific Islander alone (% change since 2000)
Races - Two or more races (%)
Races - Two or more races (% change since 2000)
Races - Other race alone (%)
Races - Other race alone (% change since 2000)
Racial diversity
Unemployment (%)
Unemployment (% change since 2000)
Unemployment (%) - White
Unemployment (%) - Black or African American
Unemployment (%) - Asian
Unemployment (%) - Hispanic or Latino
Unemployment (%) - American Indian and Alaska Native
Unemployment (%) - Multirace
Unemployment (%) - Other Race
Population density (people per square mile)
Population - Males (%)
Population - Females (%)
Population - Males (%) - White
Population - Males (%) - Black or African American
Population - Males (%) - Asian
Population - Males (%) - Hispanic or Latino
Population - Males (%) - American Indian and Alaska Native
Population - Males (%) - Multirace
Population - Males (%) - Other Race
Population - Females (%) - White
Population - Females (%) - Black or African American
Population - Females (%) - Asian
Population - Females (%) - Hispanic or Latino
Population - Females (%) - American Indian and Alaska Native
Population - Females (%) - Multirace
Population - Females (%) - Other Race
Coronavirus confirmed cases (Apr 27, 2024)
Deaths caused by coronavirus (Apr 27, 2024)
Coronavirus confirmed cases (per 100k population) (Apr 27, 2024)
Deaths caused by coronavirus (per 100k population) (Apr 27, 2024)
Daily increase in number of cases (Apr 27, 2024)
Weekly increase in number of cases (Apr 27, 2024)
Cases doubled (in days) (Apr 27, 2024)
Hospitalized patients (Apr 18, 2022)
Negative test results (Apr 18, 2022)
Total test results (Apr 18, 2022)
COVID Vaccine doses distributed (per 100k population) (Sep 19, 2023)
COVID Vaccine doses administered (per 100k population) (Sep 19, 2023)
COVID Vaccine doses distributed (Sep 19, 2023)
COVID Vaccine doses administered (Sep 19, 2023)
Likely homosexual households (%)
Likely homosexual households (% change since 2000)
Likely homosexual households - Lesbian couples (%)
Likely homosexual households - Lesbian couples (% change since 2000)
Likely homosexual households - Gay men (%)
Likely homosexual households - Gay men (% change since 2000)
Cost of living index
Median gross rent ($)
Median contract rent ($)
Median monthly housing costs ($)
Median house or condo value ($)
Median house or condo value ($ change since 2000)
Mean house or condo value by units in structure - 1, detached ($)
Mean house or condo value by units in structure - 1, attached ($)
Mean house or condo value by units in structure - 2 ($)
Mean house or condo value by units in structure by units in structure - 3 or 4 ($)
Mean house or condo value by units in structure - 5 or more ($)
Mean house or condo value by units in structure - Boat, RV, van, etc. ($)
Mean house or condo value by units in structure - Mobile home ($)
Median house or condo value ($) - White
Median house or condo value ($) - Black or African American
Median house or condo value ($) - Asian
Median house or condo value ($) - Hispanic or Latino
Median house or condo value ($) - American Indian and Alaska Native
Median house or condo value ($) - Multirace
Median house or condo value ($) - Other Race
Median resident age
Resident age diversity
Median resident age - Males
Median resident age - Females
Median resident age - White
Median resident age - Black or African American
Median resident age - Asian
Median resident age - Hispanic or Latino
Median resident age - American Indian and Alaska Native
Median resident age - Multirace
Median resident age - Other Race
Median resident age - Males - White
Median resident age - Males - Black or African American
Median resident age - Males - Asian
Median resident age - Males - Hispanic or Latino
Median resident age - Males - American Indian and Alaska Native
Median resident age - Males - Multirace
Median resident age - Males - Other Race
Median resident age - Females - White
Median resident age - Females - Black or African American
Median resident age - Females - Asian
Median resident age - Females - Hispanic or Latino
Median resident age - Females - American Indian and Alaska Native
Median resident age - Females - Multirace
Median resident age - Females - Other Race
Commute - mean travel time to work (minutes)
Travel time to work - Less than 5 minutes (%)
Travel time to work - Less than 5 minutes (% change since 2000)
Travel time to work - 5 to 9 minutes (%)
Travel time to work - 5 to 9 minutes (% change since 2000)
Travel time to work - 10 to 19 minutes (%)
Travel time to work - 10 to 19 minutes (% change since 2000)
Travel time to work - 20 to 29 minutes (%)
Travel time to work - 20 to 29 minutes (% change since 2000)
Travel time to work - 30 to 39 minutes (%)
Travel time to work - 30 to 39 minutes (% change since 2000)
Travel time to work - 40 to 59 minutes (%)
Travel time to work - 40 to 59 minutes (% change since 2000)
Travel time to work - 60 to 89 minutes (%)
Travel time to work - 60 to 89 minutes (% change since 2000)
Travel time to work - 90 or more minutes (%)
Travel time to work - 90 or more minutes (% change since 2000)
Marital status - Never married (%)
Marital status - Now married (%)
Marital status - Separated (%)
Marital status - Widowed (%)
Marital status - Divorced (%)
Median family income ($)
Median family income (% change since 2000)
Median non-family income ($)
Median non-family income (% change since 2000)
Median per capita income ($)
Median per capita income (% change since 2000)
Median family income ($) - White
Median family income ($) - Black or African American
Median family income ($) - Asian
Median family income ($) - Hispanic or Latino
Median family income ($) - American Indian and Alaska Native
Median family income ($) - Multirace
Median family income ($) - Other Race
Median year house/condo built
Median year apartment built
Year house built - Built 2005 or later (%)
Year house built - Built 2000 to 2004 (%)
Year house built - Built 1990 to 1999 (%)
Year house built - Built 1980 to 1989 (%)
Year house built - Built 1970 to 1979 (%)
Year house built - Built 1960 to 1969 (%)
Year house built - Built 1950 to 1959 (%)
Year house built - Built 1940 to 1949 (%)
Year house built - Built 1939 or earlier (%)
Average household size
Household density (households per square mile)
Average household size - White
Average household size - Black or African American
Average household size - Asian
Average household size - Hispanic or Latino
Average household size - American Indian and Alaska Native
Average household size - Multirace
Average household size - Other Race
Occupied housing units (%)
Vacant housing units (%)
Owner occupied housing units (%)
Renter occupied housing units (%)
Vacancy status - For rent (%)
Vacancy status - For sale only (%)
Vacancy status - Rented or sold, not occupied (%)
Vacancy status - For seasonal, recreational, or occasional use (%)
Vacancy status - For migrant workers (%)
Vacancy status - Other vacant (%)
Residents with income below the poverty level (%)
Residents with income below 50% of the poverty level (%)
Children below poverty level (%)
Poor families by family type - Married-couple family (%)
Poor families by family type - Male, no wife present (%)
Poor families by family type - Female, no husband present (%)
Poverty status for native-born residents (%)
Poverty status for foreign-born residents (%)
Poverty among high school graduates not in families (%)
Poverty among people who did not graduate high school not in families (%)
Residents with income below the poverty level (%) - White
Residents with income below the poverty level (%) - Black or African American
Residents with income below the poverty level (%) - Asian
Residents with income below the poverty level (%) - Hispanic or Latino
Residents with income below the poverty level (%) - American Indian and Alaska Native
Residents with income below the poverty level (%) - Multirace
Residents with income below the poverty level (%) - Other Race
Air pollution - Air Quality Index (AQI)
Air pollution - CO
Air pollution - NO2
Air pollution - SO2
Air pollution - Ozone
Air pollution - PM10
Air pollution - PM25
Air pollution - Pb
Crime - Murders per 100,000 population
Crime - Rapes per 100,000 population
Crime - Robberies per 100,000 population
Crime - Assaults per 100,000 population
Crime - Burglaries per 100,000 population
Crime - Thefts per 100,000 population
Crime - Auto thefts per 100,000 population
Crime - Arson per 100,000 population
Crime - City-data.com crime index
Crime - Violent crime index
Crime - Property crime index
Crime - Murders per 100,000 population (5 year average)
Crime - Rapes per 100,000 population (5 year average)
Crime - Robberies per 100,000 population (5 year average)
Crime - Assaults per 100,000 population (5 year average)
Crime - Burglaries per 100,000 population (5 year average)
Crime - Thefts per 100,000 population (5 year average)
Crime - Auto thefts per 100,000 population (5 year average)
Crime - Arson per 100,000 population (5 year average)
Crime - City-data.com crime index (5 year average)
Crime - Violent crime index (5 year average)
Crime - Property crime index (5 year average)
1996 Presidential Elections Results (%) - Democratic Party (Clinton)
1996 Presidential Elections Results (%) - Republican Party (Dole)
1996 Presidential Elections Results (%) - Other
2000 Presidential Elections Results (%) - Democratic Party (Gore)
2000 Presidential Elections Results (%) - Republican Party (Bush)
2000 Presidential Elections Results (%) - Other
2004 Presidential Elections Results (%) - Democratic Party (Kerry)
2004 Presidential Elections Results (%) - Republican Party (Bush)
2004 Presidential Elections Results (%) - Other
2008 Presidential Elections Results (%) - Democratic Party (Obama)
2008 Presidential Elections Results (%) - Republican Party (McCain)
2008 Presidential Elections Results (%) - Other
2012 Presidential Elections Results (%) - Democratic Party (Obama)
2012 Presidential Elections Results (%) - Republican Party (Romney)
2012 Presidential Elections Results (%) - Other
2016 Presidential Elections Results (%) - Democratic Party (Clinton)
2016 Presidential Elections Results (%) - Republican Party (Trump)
2016 Presidential Elections Results (%) - Other
2020 Presidential Elections Results (%) - Democratic Party (Biden)
2020 Presidential Elections Results (%) - Republican Party (Trump)
2020 Presidential Elections Results (%) - Other
Ancestries Reported - Arab (%)
Ancestries Reported - Czech (%)
Ancestries Reported - Danish (%)
Ancestries Reported - Dutch (%)
Ancestries Reported - English (%)
Ancestries Reported - French (%)
Ancestries Reported - French Canadian (%)
Ancestries Reported - German (%)
Ancestries Reported - Greek (%)
Ancestries Reported - Hungarian (%)
Ancestries Reported - Irish (%)
Ancestries Reported - Italian (%)
Ancestries Reported - Lithuanian (%)
Ancestries Reported - Norwegian (%)
Ancestries Reported - Polish (%)
Ancestries Reported - Portuguese (%)
Ancestries Reported - Russian (%)
Ancestries Reported - Scotch-Irish (%)
Ancestries Reported - Scottish (%)
Ancestries Reported - Slovak (%)
Ancestries Reported - Subsaharan African (%)
Ancestries Reported - Swedish (%)
Ancestries Reported - Swiss (%)
Ancestries Reported - Ukrainian (%)
Ancestries Reported - United States (%)
Ancestries Reported - Welsh (%)
Ancestries Reported - West Indian (%)
Ancestries Reported - Other (%)
Educational Attainment - No schooling completed (%)
Educational Attainment - Less than high school (%)
Educational Attainment - High school or equivalent (%)
Educational Attainment - Less than 1 year of college (%)
Educational Attainment - 1 or more years of college (%)
Educational Attainment - Associate degree (%)
Educational Attainment - Bachelor's degree (%)
Educational Attainment - Master's degree (%)
Educational Attainment - Professional school degree (%)
Educational Attainment - Doctorate degree (%)
School Enrollment - Nursery, preschool (%)
School Enrollment - Kindergarten (%)
School Enrollment - Grade 1 to 4 (%)
School Enrollment - Grade 5 to 8 (%)
School Enrollment - Grade 9 to 12 (%)
School Enrollment - College undergrad (%)
School Enrollment - Graduate or professional (%)
School Enrollment - Not enrolled in school (%)
School enrollment - Public schools (%)
School enrollment - Private schools (%)
School enrollment - Not enrolled (%)
Median number of rooms in houses and condos
Median number of rooms in apartments
Housing units lacking complete plumbing facilities (%)
Housing units lacking complete kitchen facilities (%)
Density of houses
Urban houses (%)
Rural houses (%)
Households with people 60 years and over (%)
Households with people 65 years and over (%)
Households with people 75 years and over (%)
Households with one or more nonrelatives (%)
Households with no nonrelatives (%)
Population in households (%)
Family households (%)
Nonfamily households (%)
Population in families (%)
Family households with own children (%)
Median number of bedrooms in owner occupied houses
Mean number of bedrooms in owner occupied houses
Median number of bedrooms in renter occupied houses
Mean number of bedrooms in renter occupied houses
Median number of vehichles in owner occupied houses
Mean number of vehichles in owner occupied houses
Median number of vehichles in renter occupied houses
Mean number of vehichles in renter occupied houses
Mortgage status - with mortgage (%)
Mortgage status - with second mortgage (%)
Mortgage status - with home equity loan (%)
Mortgage status - with both second mortgage and home equity loan (%)
Mortgage status - without a mortgage (%)
Average family size
Average family size - White
Average family size - Black or African American
Average family size - Asian
Average family size - Hispanic or Latino
Average family size - American Indian and Alaska Native
Average family size - Multirace
Average family size - Other Race
Geographical mobility - Same house 1 year ago (%)
Geographical mobility - Moved within same county (%)
Geographical mobility - Moved from different county within same state (%)
Geographical mobility - Moved from different state (%)
Geographical mobility - Moved from abroad (%)
Place of birth - Born in state of residence (%)
Place of birth - Born in other state (%)
Place of birth - Native, outside of US (%)
Place of birth - Foreign born (%)
Housing units in structures - 1, detached (%)
Housing units in structures - 1, attached (%)
Housing units in structures - 2 (%)
Housing units in structures - 3 or 4 (%)
Housing units in structures - 5 to 9 (%)
Housing units in structures - 10 to 19 (%)
Housing units in structures - 20 to 49 (%)
Housing units in structures - 50 or more (%)
Housing units in structures - Mobile home (%)
Housing units in structures - Boat, RV, van, etc. (%)
House/condo owner moved in on average (years ago)
Renter moved in on average (years ago)
Year householder moved into unit - Moved in 1999 to March 2000 (%)
Year householder moved into unit - Moved in 1995 to 1998 (%)
Year householder moved into unit - Moved in 1990 to 1994 (%)
Year householder moved into unit - Moved in 1980 to 1989 (%)
Year householder moved into unit - Moved in 1970 to 1979 (%)
Year householder moved into unit - Moved in 1969 or earlier (%)
Means of transportation to work - Drove car alone (%)
Means of transportation to work - Carpooled (%)
Means of transportation to work - Public transportation (%)
Means of transportation to work - Bus or trolley bus (%)
Means of transportation to work - Streetcar or trolley car (%)
Means of transportation to work - Subway or elevated (%)
Means of transportation to work - Railroad (%)
Means of transportation to work - Ferryboat (%)
Means of transportation to work - Taxicab (%)
Means of transportation to work - Motorcycle (%)
Means of transportation to work - Bicycle (%)
Means of transportation to work - Walked (%)
Means of transportation to work - Other means (%)
Working at home (%)
Industry diversity
Most Common Industries - Agriculture, forestry, fishing and hunting, and mining (%)
Most Common Industries - Agriculture, forestry, fishing and hunting (%)
Most Common Industries - Mining, quarrying, and oil and gas extraction (%)
Most Common Industries - Construction (%)
Most Common Industries - Manufacturing (%)
Most Common Industries - Wholesale trade (%)
Most Common Industries - Retail trade (%)
Most Common Industries - Transportation and warehousing, and utilities (%)
Most Common Industries - Transportation and warehousing (%)
Most Common Industries - Utilities (%)
Most Common Industries - Information (%)
Most Common Industries - Finance and insurance, and real estate and rental and leasing (%)
Most Common Industries - Finance and insurance (%)
Most Common Industries - Real estate and rental and leasing (%)
Most Common Industries - Professional, scientific, and management, and administrative and waste management services (%)
Most Common Industries - Professional, scientific, and technical services (%)
Most Common Industries - Management of companies and enterprises (%)
Most Common Industries - Administrative and support and waste management services (%)
Most Common Industries - Educational services, and health care and social assistance (%)
Most Common Industries - Educational services (%)
Most Common Industries - Health care and social assistance (%)
Most Common Industries - Arts, entertainment, and recreation, and accommodation and food services (%)
Most Common Industries - Arts, entertainment, and recreation (%)
Most Common Industries - Accommodation and food services (%)
Most Common Industries - Other services, except public administration (%)
Most Common Industries - Public administration (%)
Occupation diversity
Most Common Occupations - Management, business, science, and arts occupations (%)
Most Common Occupations - Management, business, and financial occupations (%)
Most Common Occupations - Management occupations (%)
Most Common Occupations - Business and financial operations occupations (%)
Most Common Occupations - Computer, engineering, and science occupations (%)
Most Common Occupations - Computer and mathematical occupations (%)
Most Common Occupations - Architecture and engineering occupations (%)
Most Common Occupations - Life, physical, and social science occupations (%)
Most Common Occupations - Education, legal, community service, arts, and media occupations (%)
Most Common Occupations - Community and social service occupations (%)
Most Common Occupations - Legal occupations (%)
Most Common Occupations - Education, training, and library occupations (%)
Most Common Occupations - Arts, design, entertainment, sports, and media occupations (%)
Most Common Occupations - Healthcare practitioners and technical occupations (%)
Most Common Occupations - Health diagnosing and treating practitioners and other technical occupations (%)
Most Common Occupations - Health technologists and technicians (%)
Most Common Occupations - Service occupations (%)
Most Common Occupations - Healthcare support occupations (%)
Most Common Occupations - Protective service occupations (%)
Most Common Occupations - Fire fighting and prevention, and other protective service workers including supervisors (%)
Most Common Occupations - Law enforcement workers including supervisors (%)
Most Common Occupations - Food preparation and serving related occupations (%)
Most Common Occupations - Building and grounds cleaning and maintenance occupations (%)
Most Common Occupations - Personal care and service occupations (%)
Most Common Occupations - Sales and office occupations (%)
Most Common Occupations - Sales and related occupations (%)
Most Common Occupations - Office and administrative support occupations (%)
Most Common Occupations - Natural resources, construction, and maintenance occupations (%)
Most Common Occupations - Farming, fishing, and forestry occupations (%)
Most Common Occupations - Construction and extraction occupations (%)
Most Common Occupations - Installation, maintenance, and repair occupations (%)
Most Common Occupations - Production, transportation, and material moving occupations (%)
Most Common Occupations - Production occupations (%)
Most Common Occupations - Transportation occupations (%)
Most Common Occupations - Material moving occupations (%)
People in Group quarters - Institutionalized population (%)
People in Group quarters - Correctional institutions (%)
People in Group quarters - Federal prisons and detention centers (%)
People in Group quarters - Halfway houses (%)
People in Group quarters - Local jails and other confinement facilities (including police lockups) (%)
People in Group quarters - Military disciplinary barracks (%)
People in Group quarters - State prisons (%)
People in Group quarters - Other types of correctional institutions (%)
People in Group quarters - Nursing homes (%)
People in Group quarters - Hospitals/wards, hospices, and schools for the handicapped (%)
People in Group quarters - Hospitals/wards and hospices for chronically ill (%)
People in Group quarters - Hospices or homes for chronically ill (%)
People in Group quarters - Military hospitals or wards for chronically ill (%)
People in Group quarters - Other hospitals or wards for chronically ill (%)
People in Group quarters - Hospitals or wards for drug/alcohol abuse (%)
People in Group quarters - Mental (Psychiatric) hospitals or wards (%)
People in Group quarters - Schools, hospitals, or wards for the mentally retarded (%)
People in Group quarters - Schools, hospitals, or wards for the physically handicapped (%)
People in Group quarters - Institutions for the deaf (%)
People in Group quarters - Institutions for the blind (%)
People in Group quarters - Orthopedic wards and institutions for the physically handicapped (%)
People in Group quarters - Wards in general hospitals for patients who have no usual home elsewhere (%)
People in Group quarters - Wards in military hospitals for patients who have no usual home elsewhere (%)
People in Group quarters - Juvenile institutions (%)
People in Group quarters - Long-term care (%)
People in Group quarters - Homes for abused, dependent, and neglected children (%)
People in Group quarters - Residential treatment centers for emotionally disturbed children (%)
People in Group quarters - Training schools for juvenile delinquents (%)
People in Group quarters - Short-term care, detention or diagnostic centers for delinquent children (%)
People in Group quarters - Type of juvenile institution unknown (%)
People in Group quarters - Noninstitutionalized population (%)
People in Group quarters - College dormitories (includes college quarters off campus) (%)
People in Group quarters - Military quarters (%)
People in Group quarters - On base (%)
People in Group quarters - Barracks, unaccompanied personnel housing (UPH), (Enlisted/Officer), ;and similar group living quarters for military personnel (%)
People in Group quarters - Transient quarters for temporary residents (%)
People in Group quarters - Military ships (%)
People in Group quarters - Group homes (%)
People in Group quarters - Homes or halfway houses for drug/alcohol abuse (%)
People in Group quarters - Homes for the mentally ill (%)
People in Group quarters - Homes for the mentally retarded (%)
People in Group quarters - Homes for the physically handicapped (%)
People in Group quarters - Other group homes (%)
People in Group quarters - Religious group quarters (%)
People in Group quarters - Dormitories (%)
People in Group quarters - Agriculture workers' dormitories on farms (%)
People in Group quarters - Job Corps and vocational training facilities (%)
People in Group quarters - Other workers' dormitories (%)
People in Group quarters - Crews of maritime vessels (%)
People in Group quarters - Other nonhousehold living situations (%)
People in Group quarters - Other noninstitutional group quarters (%)
Residents speaking English at home (%)
Residents speaking English at home - Born in the United States (%)
Residents speaking English at home - Native, born elsewhere (%)
Residents speaking English at home - Foreign born (%)
Residents speaking Spanish at home (%)
Residents speaking Spanish at home - Born in the United States (%)
Residents speaking Spanish at home - Native, born elsewhere (%)
Residents speaking Spanish at home - Foreign born (%)
Residents speaking other language at home (%)
Residents speaking other language at home - Born in the United States (%)
Residents speaking other language at home - Native, born elsewhere (%)
Residents speaking other language at home - Foreign born (%)
Class of Workers - Employee of private company (%)
Class of Workers - Self-employed in own incorporated business (%)
Class of Workers - Private not-for-profit wage and salary workers (%)
Class of Workers - Local government workers (%)
Class of Workers - State government workers (%)
Class of Workers - Federal government workers (%)
Class of Workers - Self-employed workers in own not incorporated business and Unpaid family workers (%)
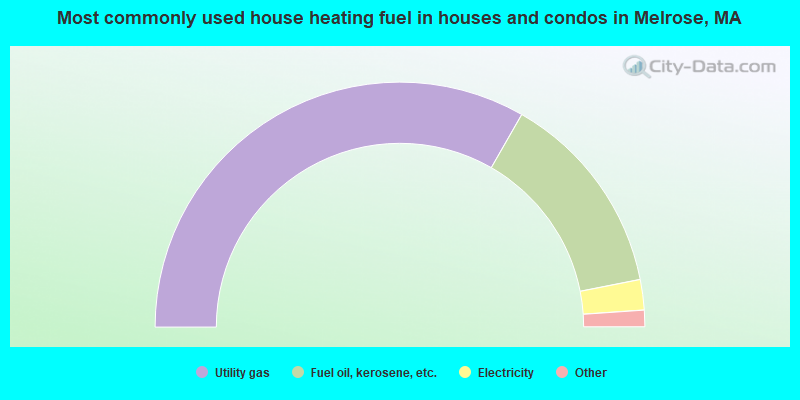
House heating fuel used in houses and condos - Utility gas (%)
House heating fuel used in houses and condos - Bottled, tank, or LP gas (%)
House heating fuel used in houses and condos - Electricity (%)
House heating fuel used in houses and condos - Fuel oil, kerosene, etc. (%)
House heating fuel used in houses and condos - Coal or coke (%)
House heating fuel used in houses and condos - Wood (%)
House heating fuel used in houses and condos - Solar energy (%)
House heating fuel used in houses and condos - Other fuel (%)
House heating fuel used in houses and condos - No fuel used (%)
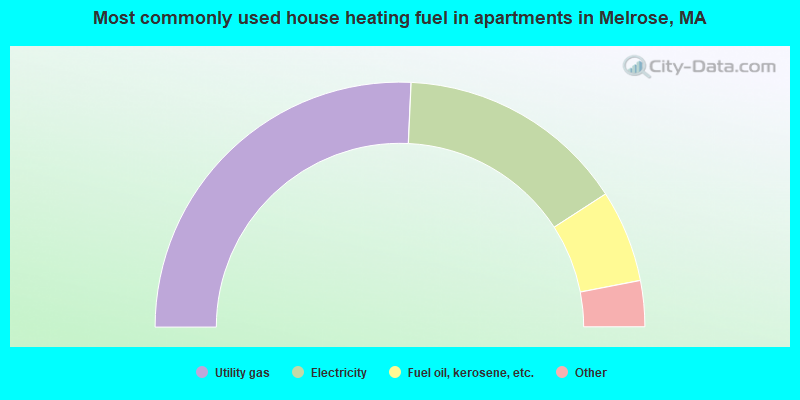
House heating fuel used in apartments - Utility gas (%)
House heating fuel used in apartments - Bottled, tank, or LP gas (%)
House heating fuel used in apartments - Electricity (%)
House heating fuel used in apartments - Fuel oil, kerosene, etc. (%)
House heating fuel used in apartments - Coal or coke (%)
House heating fuel used in apartments - Wood (%)
House heating fuel used in apartments - Solar energy (%)
House heating fuel used in apartments - Other fuel (%)
House heating fuel used in apartments - No fuel used (%)
Armed forces status - In Armed Forces (%)
Armed forces status - Civilian (%)
Armed forces status - Civilian - Veteran (%)
Armed forces status - Civilian - Nonveteran (%)
Fatal accidents locations in years 2005-2021
Fatal accidents locations in 2005
Fatal accidents locations in 2006
Fatal accidents locations in 2007
Fatal accidents locations in 2008
Fatal accidents locations in 2009
Fatal accidents locations in 2010
Fatal accidents locations in 2011
Fatal accidents locations in 2012
Fatal accidents locations in 2013
Fatal accidents locations in 2014
Fatal accidents locations in 2015
Fatal accidents locations in 2016
Fatal accidents locations in 2017
Fatal accidents locations in 2018
Fatal accidents locations in 2019
Fatal accidents locations in 2020
Fatal accidents locations in 2021
Alcohol use - People drinking some alcohol every month (%)
Alcohol use - People not drinking at all (%)
Alcohol use - Average days/month drinking alcohol
Alcohol use - Average drinks/week
Alcohol use - Average days/year people drink much
Audiometry - Average condition of hearing (%)
Audiometry - People that can hear a whisper from across a quiet room (%)
Audiometry - People that can hear normal voice from across a quiet room (%)
Audiometry - Ears ringing, roaring, buzzing (%)
Audiometry - Had a job exposure to loud noise (%)
Audiometry - Had off-work exposure to loud noise (%)
Blood Pressure & Cholesterol - Has high blood pressure (%)
Blood Pressure & Cholesterol - Checking blood pressure at home (%)
Blood Pressure & Cholesterol - Frequently checking blood cholesterol (%)
Blood Pressure & Cholesterol - Has high cholesterol level (%)
Consumer Behavior - Money monthly spent on food at supermarket/grocery store
Consumer Behavior - Money monthly spent on food at other stores
Consumer Behavior - Money monthly spent on eating out
Consumer Behavior - Money monthly spent on carryout/delivered foods
Consumer Behavior - Income spent on food at supermarket/grocery store (%)
Consumer Behavior - Income spent on food at other stores (%)
Consumer Behavior - Income spent on eating out (%)
Consumer Behavior - Income spent on carryout/delivered foods (%)
Current Health Status - General health condition (%)
Current Health Status - Blood donors (%)
Current Health Status - Has blood ever tested for HIV virus (%)
Current Health Status - Left-handed people (%)
Dermatology - People using sunscreen (%)
Diabetes - Diabetics (%)
Diabetes - Had a blood test for high blood sugar (%)
Diabetes - People taking insulin (%)
Diet Behavior & Nutrition - Diet health (%)
Diet Behavior & Nutrition - Milk product consumption (# of products/month)
Diet Behavior & Nutrition - Meals not home prepared (#/week)
Diet Behavior & Nutrition - Meals from fast food or pizza place (#/week)
Diet Behavior & Nutrition - Ready-to-eat foods (#/month)
Diet Behavior & Nutrition - Frozen meals/pizza (#/month)
Drug Use - People that ever used marijuana or hashish (%)
Drug Use - Ever used hard drugs (%)
Drug Use - Ever used any form of cocaine (%)
Drug Use - Ever used heroin (%)
Drug Use - Ever used methamphetamine (%)
Health Insurance - People covered by health insurance (%)
Kidney Conditions-Urology - Avg. # of times urinating at night
Medical Conditions - People with asthma (%)
Medical Conditions - People with anemia (%)
Medical Conditions - People with psoriasis (%)
Medical Conditions - People with overweight (%)
Medical Conditions - Elderly people having difficulties in thinking or remembering (%)
Medical Conditions - People who ever received blood transfusion (%)
Medical Conditions - People having trouble seeing even with glass/contacts (%)
Medical Conditions - People with arthritis (%)
Medical Conditions - People with gout (%)
Medical Conditions - People with congestive heart failure (%)
Medical Conditions - People with coronary heart disease (%)
Medical Conditions - People with angina pectoris (%)
Medical Conditions - People who ever had heart attack (%)
Medical Conditions - People who ever had stroke (%)
Medical Conditions - People with emphysema (%)
Medical Conditions - People with thyroid problem (%)
Medical Conditions - People with chronic bronchitis (%)
Medical Conditions - People with any liver condition (%)
Medical Conditions - People who ever had cancer or malignancy (%)
Mental Health - People who have little interest in doing things (%)
Mental Health - People feeling down, depressed, or hopeless (%)
Mental Health - People who have trouble sleeping or sleeping too much (%)
Mental Health - People feeling tired or having little energy (%)
Mental Health - People with poor appetite or overeating (%)
Mental Health - People feeling bad about themself (%)
Mental Health - People who have trouble concentrating on things (%)
Mental Health - People moving or speaking slowly or too fast (%)
Mental Health - People having thoughts they would be better off dead (%)
Oral Health - Average years since last visit a dentist
Oral Health - People embarrassed because of mouth (%)
Oral Health - People with gum disease (%)
Oral Health - General health of teeth and gums (%)
Oral Health - Average days a week using dental floss/device
Oral Health - Average days a week using mouthwash for dental problem
Oral Health - Average number of teeth
Pesticide Use - Households using pesticides to control insects (%)
Pesticide Use - Households using pesticides to kill weeds (%)
Physical Activity - People doing vigorous-intensity work activities (%)
Physical Activity - People doing moderate-intensity work activities (%)
Physical Activity - People walking or bicycling (%)
Physical Activity - People doing vigorous-intensity recreational activities (%)
Physical Activity - People doing moderate-intensity recreational activities (%)
Physical Activity - Average hours a day doing sedentary activities
Physical Activity - Average hours a day watching TV or videos
Physical Activity - Average hours a day using computer
Physical Functioning - People having limitations keeping them from working (%)
Physical Functioning - People limited in amount of work they can do (%)
Physical Functioning - People that need special equipment to walk (%)
Physical Functioning - People experiencing confusion/memory problems (%)
Physical Functioning - People requiring special healthcare equipment (%)
Prescription Medications - Average number of prescription medicines taking
Preventive Aspirin Use - Adults 40+ taking low-dose aspirin (%)
Reproductive Health - Vaginal deliveries (%)
Reproductive Health - Cesarean deliveries (%)
Reproductive Health - Deliveries resulted in a live birth (%)
Reproductive Health - Pregnancies resulted in a delivery (%)
Reproductive Health - Women breastfeeding newborns (%)
Reproductive Health - Women that had a hysterectomy (%)
Reproductive Health - Women that had both ovaries removed (%)
Reproductive Health - Women that have ever taken birth control pills (%)
Reproductive Health - Women taking birth control pills (%)
Reproductive Health - Women that have ever used Depo-Provera or injectables (%)
Reproductive Health - Women that have ever used female hormones (%)
Sexual Behavior - People 18+ that ever had sex (vaginal, anal, or oral) (%)
Sexual Behavior - Males 18+ that ever had vaginal sex with a woman (%)
Sexual Behavior - Males 18+ that ever performed oral sex on a woman (%)
Sexual Behavior - Males 18+ that ever had anal sex with a woman (%)
Sexual Behavior - Males 18+ that ever had any sex with a man (%)
Sexual Behavior - Females 18+ that ever had vaginal sex with a man (%)
Sexual Behavior - Females 18+ that ever performed oral sex on a man (%)
Sexual Behavior - Females 18+ that ever had anal sex with a man (%)
Sexual Behavior - Females 18+ that ever had any kind of sex with a woman (%)
Sexual Behavior - Average age people first had sex
Sexual Behavior - Average number of female sex partners in lifetime (males 18+)
Sexual Behavior - Average number of female vaginal sex partners in lifetime (males 18+)
Sexual Behavior - Average age people first performed oral sex on a woman (18+)
Sexual Behavior - Average number of woman performed oral sex on in lifetime (18+)
Sexual Behavior - Average number of male sex partners in lifetime (males 18+)
Sexual Behavior - Average number of male anal sex partners in lifetime (males 18+)
Sexual Behavior - Average age people first performed oral sex on a man (18+)
Sexual Behavior - Average number of male oral sex partners in lifetime (18+)
Sexual Behavior - People using protection when performing oral sex (%)
Sexual Behavior - Average number of times people have vaginal or anal sex a year
Sexual Behavior - People having sex without condom (%)
Sexual Behavior - Average number of male sex partners in lifetime (females 18+)
Sexual Behavior - Average number of male vaginal sex partners in lifetime (females 18+)
Sexual Behavior - Average number of female sex partners in lifetime (females 18+)
Sexual Behavior - Circumcised males 18+ (%)
Sleep Disorders - Average hours sleeping at night
Sleep Disorders - People that has trouble sleeping (%)
Smoking-Cigarette Use - People smoking cigarettes (%)
Taste & Smell - People 40+ having problems with smell (%)
Taste & Smell - People 40+ having problems with taste (%)
Taste & Smell - People 40+ that ever had wisdom teeth removed (%)
Taste & Smell - People 40+ that ever had tonsils teeth removed (%)
Taste & Smell - People 40+ that ever had a loss of consciousness because of a head injury (%)
Taste & Smell - People 40+ that ever had a broken nose or other serious injury to face or skull (%)
Taste & Smell - People 40+ that ever had two or more sinus infections (%)
Weight - Average height (inches)
Weight - Average weight (pounds)
Weight - Average BMI
Weight - People that are obese (%)
Weight - People that ever were obese (%)
Weight - People trying to lose weight (%)
According to our research of Massachusetts and other state lists, there were 3 registered sex offenders living in Melrose, Massachusetts as of April 27, 2024 . The ratio of all residents to sex offenders in Melrose is 9,393 to 1.The ratio of registered sex offenders to all residents in this city is much lower than the state average.
Officers per 1,000 residents here:
1.60Massachusetts average:
2.53
Latest news from Melrose, MA collected exclusively by city-data.com from local newspapers, TV, and radio stations
Ancestries: Irish (22.9%), Italian (10.9%), Moroccan (5.0%), American (4.7%), English (3.8%), European (2.7%).
Current Local Time:
Land area: 4.69 square miles.
Population density: 6,210 people per square mile (high).
4,705 residents are foreign born (6.3% Asia , 3.4% Latin America , 3.1% Europe , 2.2% Africa ).
This city:
16.0%Massachusetts:
17.6%
Median real estate property taxes paid for housing units with mortgages in 2022: $6,522 (0.8%)Median real estate property taxes paid for housing units with no mortgage in 2022: $6,677 (0.9%)
Nearest city with pop. 50,000+: Malden, MA
Nearest city with pop. 200,000+: Boston, MA
Nearest city with pop. 1,000,000+: Bronx, NY
Nearest cities:
Latitude: 42.46 N, Longitude: 71.06 W
Daytime population change due to commuting: -6,379 (-21.7%)Workers who live and work in this city: 5,502 (34.2%)
Area codes: 781, 339, 617
Property values in Melrose, MA
Single-family new house construction building permits:
2022: 8 buildings , average cost: $431,3002021: 1 building , cost: $425,0002020: 4 buildings , average cost: $327,5002019: 7 buildings , average cost: $221,1002018: 19 buildings , average cost: $270,3002017: 5 buildings , average cost: $379,6002016: 5 buildings , average cost: $337,0002015: 11 buildings , average cost: $161,4002014: 3 buildings , average cost: $204,0002013: 9 buildings , average cost: $187,1002012: 9 buildings , average cost: $201,0002011: 6 buildings , average cost: $267,8002010: 12 buildings , average cost: $257,7002009: 6 buildings , average cost: $215,5002008: 3 buildings , average cost: $157,5002007: 6 buildings , average cost: $179,6002006: 7 buildings , average cost: $222,7002005: 11 buildings , average cost: $139,5002004: 5 buildings , average cost: $193,2002003: 7 buildings , average cost: $186,9002002: 8 buildings , average cost: $159,9002001: 3 buildings , average cost: $98,7002000: 4 buildings , average cost: $131,0001999: 5 buildings , average cost: $334,1001998: 11 buildings , average cost: $117,7001997: 7 buildings , average cost: $190,600Unemployment in December 2023: Here:
2.9%Massachusetts:
3.5%
Most common occupations in Melrose, MA (%)
Both Males Females
Computer specialists (5.6%)
Other management occupations, except farmers and farm managers (5.0%)
Other office and administrative support workers, including supervisors (4.5%)
Preschool, kindergarten, elementary, and middle school teachers (3.8%)
Secretaries and administrative assistants (3.6%)
Sales representatives, services, wholesale and manufacturing (3.1%)
Other sales and related occupations, including supervisors (3.1%)
Computer specialists (7.6%)
Other management occupations, except farmers and farm managers (5.5%)
Sales representatives, services, wholesale and manufacturing (4.1%)
Material recording, scheduling, dispatching, and distributing workers (4.0%)
Engineers (4.0%)
Other office and administrative support workers, including supervisors (3.6%)
Driver/sales workers and truck drivers (3.5%)
Secretaries and administrative assistants (7.2%)
Preschool, kindergarten, elementary, and middle school teachers (6.6%)
Other office and administrative support workers, including supervisors (5.4%)
Registered nurses (5.0%)
Other management occupations, except farmers and farm managers (4.4%)
Computer specialists (3.4%)
Information and record clerks, except customer service representatives (3.1%)
Tornado activity:
Melrose-area historical tornado activity is near Massachusetts state average. It is 44% smaller than the overall U.S. average.
On 6/9/1953, a category F4 (max. wind speeds 207-260 mph) tornado 25.8 miles away from the Melrose city center killed 90 people and injured 1228 people and caused between $50,000,000 and $500,000,000 in damages.
On 9/29/1974, a category F3 (max. wind speeds 158-206 mph) tornado 13.0 miles away from the city center injured one person and caused between $50,000 and $500,000 in damages.
Earthquake activity:
Melrose-area historical earthquake activity is significantly above Massachusetts state average. It is 73% smaller than the overall U.S. average. On 4/20/2002 at 10:50:47, a magnitude 5.3 (5.3 ML, Depth: 3.0 mi, Class: Moderate, Intensity: VI - VII) earthquake occurred 194.0 miles away from Melrose center On 10/7/1983 at 10:18:46, a magnitude 5.3 (5.1 MB, 5.3 LG, 5.1 ML) earthquake occurred 195.0 miles away from the city center On 1/19/1982 at 00:14:42, a magnitude 4.7 (4.5 MB, 4.7 MD, 4.5 LG, Class: Light, Intensity: IV - V) earthquake occurred 77.0 miles away from the city center On 10/16/2012 at 23:12:25, a magnitude 4.7 (4.7 ML, Depth: 10.0 mi) earthquake occurred 81.4 miles away from Melrose center On 4/20/2002 at 10:50:47, a magnitude 5.2 (5.2 MB, 4.2 MS, 5.2 MW, 5.0 MW) earthquake occurred 193.5 miles away from Melrose center On 8/22/1992 at 12:20:32, a magnitude 4.8 (4.8 MB, 3.8 MS, 4.7 LG, Depth: 6.2 mi) earthquake occurred 235.2 miles away from the city center Magnitude types: regional Lg-wave magnitude (LG), body-wave magnitude (MB), duration magnitude (MD), local magnitude (ML), surface-wave magnitude (MS), moment magnitude (MW) Natural disasters: The number of natural disasters in Middlesex County (31) is a lot greater than the US average (15).Major Disasters (Presidential) Declared: 17Emergencies Declared: 14Floods: 12, Storms: 9, Hurricanes: 6, Snowstorms: 6, Winter Storms: 5, Blizzards: 2, Snows: 2, Explosion: 1, Heavy Rain: 1, Snowfall: 1, Water Main Break: 1, Wind: 1 (Note: some incidents may be assigned to more than one category). Hospitals in Melrose: HALLMARK HEALTH SYSTEM (Voluntary non-profit - Private, provides emergency services, 585 LEBANON STREET) MELROSE-WAKEFIELD HOSPITAL (585 LEBANON ST) Home Health Centers in Melrose: MELROSE VISITING NRSG SERV (50 TREMONT STREET, #103) Nursing Homes in Melrose: CUMMINGS REHAB AND NURSING CARE CENTER (585 LEBANON STREET) EPOCH SENIOR HEALTHCARE OF MELROSE (15 GREEN STREET) GOLDEN LIVING CENTER-MELROSE (40 MARTIN STREET) GOLDEN LIVING CENTER-THE ELMHURST (743 MAIN STREET) MACKENZIE NURSING HOME INC (24 VINE STREET) MELROSE CARE CENTER, A LTC FACILITY (40 MARTIN ST) NORMANDY HOUSE NURSING HOME (15 GREEN ST) TUELL NURSING HOME (92 FRANKLIN STREET) Amtrak stations near Melrose: 6 miles: WOBURN (100 ATLANTIC AVE.) Services: ticket office.
7 miles: BOSTON, NORTH STATION (BOSTON, 126 CAUSEWAY ST.) Services: ticket office, enclosed waiting area.
8 miles: BOSTON (SO. STA) (BOSTON, ATLANTIC AVE. & SUMMER ST.) Services: ticket office, fully wheelchair accessible, enclosed waiting area, public restrooms, public payphones, full-service food facilities and snack bar, ATM, paid short-term parking, paid long-term parking, call for car rental service, taxi stand, intercity bus service, public transit connection.
Colleges/universities with over 2000 students nearest to Melrose:
Tufts University (about 5 miles; Medford, MA ; Full-time enrollment: 9,041)
Bunker Hill Community College (about 6 miles; Boston, MA ; FT enrollment: 8,814)
Lesley University (about 7 miles; Cambridge, MA ; FT enrollment: 4,317)
Harvard University (about 7 miles; Cambridge, MA ; FT enrollment: 20,857)
Cambridge College (about 7 miles; Cambridge, MA ; FT enrollment: 2,782)
Suffolk University (about 7 miles; Boston, MA ; FT enrollment: 6,982)
Massachusetts Institute of Technology (about 8 miles; Cambridge, MA ; FT enrollment: 13,548)
Public high school in Melrose: MELROSE HIGH Students: 896, Location: 360 LYNN FELLS PKWY, Grades: 9-12)Public elementary/middle schools in Melrose: MELROSE MIDDLE Students: 779, Location: 350 LYNN FELLS PKWY, Grades: 6-8)WINTHROP Students: 402, Location: 162 FIRST STREET, Grades: KG-5)LINCOLN Students: 401, Location: 80 WEST WYOMING AVENUE, Grades: KG-5)ROOSEVELT Students: 365, Location: 253 VINTON STREET, Grades: KG-5)HORACE MANN Students: 267, Location: 40 DAMON AVENUE, Grades: KG-5)HERBERT CLARK HOOVER Students: 263, Location: 37 GLENDOWER RD, Grades: KG-5)Private elementary/middle schools in Melrose: ST MARY'S SCHOOL Students: 390, Location: 4 MYRTLE ST, Grades: PK-8)
ANOVA Students: 40, Location: 645 MAIN ST ANNEX BLDG, Grades: KG-7)
MELROSE MONTESSORI SCHOOL Students: 35, Location: 70 W EMERSON ST, Grades: PK-1)
See full list of schools located in Melrose Library in Melrose: MELROSE PUBLIC LIBRARY Operating income: $1,120,250; Location: 69 WEST EMERSON ST.; 100,590 books ; 3,015 audio materials ; 3,866 video materials ; 1 local licensed databases ; 34 state licensed databases ; 11 other licensed databases ; 157 print serial subscriptions )
User-submitted facts and corrections:
Nearest hospital: Melrose-Wakefield Hospital, in MELROSE, MA
Notable locations in Melrose: (A) , Melrose-Highlands Station (B) , Wyoming Hill Station (C) , Mount Hood Golf Course (D) , Towers Plaza (E) , Bellevue Golf Club (F) , Melrose Fire Department Station 3 (G) , Melrose Fire Department Station 2 (H) , Melrose City Hall (I) , Donald Collins Memorial Library (J) , First Baptist Church Library (K) , Melrose Fire Department Station 1 Headquarters (L) , Melrose Public Library (M) , Milano Senior Center (N) . Display/hide their locations on the map
Shopping Center: (1) . Display/hide its location on the map
Churches in Melrose include: (A) , Trinity Episcopal Church (B) , Trinity Church (C) , Temple Beth Shalom (D) , Temple Beth Shaolom (E) , Saint Marys Parish Church (F) , Saint Mary of the Annunciation Church (G) , Melrose Unitarian Universalist Church (H) , Melrose Highlands Congregational Church (I) . Display/hide their locations on the map
Cemetery: (1) . Display/hide its location on the map
Lakes and reservoirs: (A) , Long Pond (B) , Swains Pond (C) , Towners Pond (D) , Second Pond (E) , First Pond (F) . Display/hide their locations on the map
Parks in Melrose include: (1) , Sewall Woods Park (2) , Conant Playground (3) , Mount Hood Memorial Park (4) , Melrose Common (5) , Pine Banks Park (6) . Display/hide their locations on the map
Tourist attraction:
Birthplace of: Andy Brickley - Ice hockey winger, David Souter - Judge, Sewall Wright - Geneticist, Colin McManus - Ice dancer, Don Orsillo - Television sports announcer, Elizabeth George Speare - Children's writer, Geraldine Farrar - (1882-1967) opera diva, John Larrabee - Politician, Keith Tkachuk - NHL player (St. Louis Blues, born : Mar 28, 1972), Leslie Parrish - Film actor.
Middlesex County has a predicted average indoor radon screening level greater than 4 pCi/L (pico curies per liter) - Highest Potential Drinking water stations with addresses in Melrose and their reported violations in the past:
MELROSE WATER DEPT. (MWRA) (Population served: 26,983, Purch surface water):
Past health violations:
Lead Service Line Replacement (LSLR) - In JAN-01-2013, Contaminant: Lead and Copper Rule. Follow-up actions: St AO (w/o penalty) issued (APR-01-2014), St Compliance achieved (2 times from JUN-01-2014 to JUN-16-2014)
Lead Service Line Replacement (LSLR) - In JAN-01-2009, Contaminant: Lead and Copper Rule. Follow-up actions: St AO (w/o penalty) issued (AUG-11-2009), St Compliance achieved (OCT-01-2009)
Lead Service Line Replacement (LSLR) - In JAN-01-2008, Contaminant: Lead and Copper Rule. Follow-up actions: St AO (w/o penalty) issued (MAR-31-2009), St Compliance achieved (JUL-15-2009), St AO (w/o penalty) issued (AUG-11-2009), St Compliance achieved (OCT-01-2009)
Average household size: This city:
2.4 peopleMassachusetts:
2.5 people
Percentage of family households: This city:
63.1%Whole state:
63.0%
Percentage of households with unmarried partners: This city:
5.4%Whole state:
7.0%
Likely homosexual households (counted as self-reported same-sex unmarried-partner households)
Lesbian couples: 0.6% of all households Gay men: 0.6% of all households
People in group quarters in Melrose in 2010:
223 people in nursing facilities/skilled-nursing facilities
27 people in group homes intended for adults
11 people in other noninstitutional facilities
6 people in hospitals with patients who have no usual home elsewhere
People in group quarters in Melrose in 2000:
291 people in nursing homes
24 people in homes for the mentally retarded
11 people in homes for the mentally ill
3 people in religious group quarters
Banks with branches in Melrose (2011 data):
Eastern Bank: Melrose Branch at 441 Main Street, branch established on 1981/07/01; Melrose Towers Branch at 27 Melrose Street, branch established on 1975/09/12. Info updated 2011/03/30: Bank assets: $7,812.9 mil, Deposits: $6,295.8 mil, headquarters in Boston, MA, positive income , Commercial Lending Specialization, 94 total offices , Holding Company: Eastern Bank Corporation
East Boston Savings Bank: Melrose Branch at 108 Main Street, branch established on 2004/08/30. Info updated 2011/06/07: Bank assets: $1,946.5 mil, Deposits: $1,609.3 mil, headquarters in Boston, MA, positive income , Commercial Lending Specialization, 24 total offices , Holding Company: Meridian Financial Services, Inc
TD Bank, National Association: Melrose Store Branch at 478 Main Street, branch established on 2011/05/21. Info updated 2010/10/04: Bank assets: $188,912.6 mil, Deposits: $153,149.8 mil, headquarters in Wilmington, DE, positive income , 1314 total offices , Holding Company: Toronto-Dominion Bank, The
Bank of America, National Association: Melrose Branch at 690 Main Street, branch established on 1957/05/06. Info updated 2009/11/18: Bank assets: $1,451,969.3 mil, Deposits: $1,077,176.8 mil, headquarters in Charlotte, NC, positive income , 5782 total offices , Holding Company: Bank Of America Corporation
Melrose Co-operative Bank: Melrose Co-Operative Bank at 638 Main Street, branch established on 1890/01/01. Info updated 2006/11/03: Bank assets: $179.3 mil, Deposits: $160.9 mil, local headquarters , positive income , Mortgage Lending Specialization, 1 total offices
Central Co-operative Bank: Melrose Branch at 846 Main Street, branch established on 1974/05/20. Info updated 2008/06/25: Bank assets: $520.7 mil, Deposits: $335.1 mil, headquarters in Somerville, MA, positive income , Commercial Lending Specialization, 11 total offices , Holding Company: Central Bancorp, Inc.
Sovereign Bank, National Association: Melrose Branch at 492 Main Street, branch established on 1968/01/29. Info updated 2012/01/31: Bank assets: $78,146.9 mil, Deposits: $48,042.9 mil, headquarters in Wilmington, DE, positive income , Commercial Lending Specialization, 718 total offices , Holding Company: Banco Santander, S.A.
Northern Bank & Trust Company: Melrose Branch at 514-516 Franklin Street, branch established on 1987/10/19. Info updated 2012/02/08: Bank assets: $734.7 mil, Deposits: $586.1 mil, headquarters in Woburn, MA, positive income , Commercial Lending Specialization, 11 total offices , Holding Company: Northern Bancorp, Inc.
For population 15 years and over in Melrose:
Never married: 30.2%Now married: 55.4%Separated: 1.1%Widowed: 5.4%Divorced: 7.9% For population 25 years and over in Melrose:
High school or higher: 95.0%Bachelor's degree or higher: 61.3%Graduate or professional degree: 28.1%Unemployed: 2.0%Mean travel time to work (commute): 26.2 minutes
Education Gini index (Inequality in education) Here:
11.4Massachusetts average:
13.0
Religion statistics for Melrose, MA (based on Middlesex County data)
Religion Adherents Congregations Catholic 718,209 107 Mainline Protestant 70,053 269 Other 68,480 199 Evangelical Protestant 41,270 304 Orthodox 23,641 28 Black Protestant 2,276 8 None 579,156 -
Source: Clifford Grammich, Kirk Hadaway, Richard Houseal, Dale E.Jones, Alexei Krindatch, Richie Stanley and Richard H.Taylor. 2012. 2010 U.S.Religion Census: Religious Congregations & Membership Study. Association of Statisticians of American Religious Bodies. Jones, Dale E., et al. 2002. Congregations and Membership in the United States 2000. Nashville, TN: Glenmary Research Center. Graphs represent county-level data
Food Environment Statistics: Number of grocery stores : 251Middlesex County :
1.71 / 10,000 pop.Massachusetts :
1.98 / 10,000 pop.
Number of supercenters and club stores : 5This county :
0.03 / 10,000 pop.Massachusetts :
0.05 / 10,000 pop.
Number of convenience stores (no gas) : 314This county :
2.14 / 10,000 pop.Massachusetts :
2.22 / 10,000 pop.
Number of convenience stores (with gas) : 203This county :
1.38 / 10,000 pop.Massachusetts :
1.77 / 10,000 pop.
Number of full-service restaurants : 1,153This county :
7.84 / 10,000 pop.Massachusetts :
8.76 / 10,000 pop.
Adult diabetes rate : Here :
7.8%Massachusetts :
8.1%
Adult obesity rate : This county :
21.5%Massachusetts :
22.5%
Low-income preschool obesity rate : Middlesex County :
18.0%Massachusetts :
16.5%
Health and Nutrition: Healthy diet rate : This city:
57.8%Massachusetts:
50.5%
Average overall health of teeth and gums : This city:
58.7%Massachusetts:
48.0%
People feeling badly about themselves : This city:
17.5%Massachusetts:
20.7%
People not drinking alcohol at all : Melrose:
7.7%Massachusetts:
10.4%
Average hours sleeping at night : Melrose:
7.0Massachusetts:
6.8
Overweight people : This city:
34.0%Massachusetts:
33.4%
General health condition : Melrose:
64.1%Massachusetts:
57.1%
Average condition of hearing : This city:
81.4%Massachusetts:
79.2%
More about Health and Nutrition of Melrose, MA Residents
Local government employment and payroll (March 2022)
Function
Full-time employees
Monthly full-time payroll
Average yearly full-time wage
Part-time employees
Monthly part-time payroll
Elementary and Secondary - Instruction
298 $2,207,729 $88,902 94 $240,920 Firefighters
56 $465,438 $99,737 0 $0 Other and Unallocable
48 $345,995 $86,499 32 $46,451 Police Protection - Officers
47 $679,848 $173,578 0 $0 Elementary and Secondary - Other Total
38 $126,499 $39,947 127 $162,633 Parks and Recreation
17 $100,365 $70,846 20 $13,613 Financial Administration
17 $118,416 $83,588 0 $0 Health
15 $89,289 $71,431 13 $23,170 Local Libraries
13 $70,919 $65,464 20 $12,511 Water Supply
11 $57,381 $62,597 0 $0 Other Government Administration
11 $94,718 $103,329 2 $2,808 Housing and Community Development (Local)
3 $24,229 $96,916 2 $7,617 Judicial and Legal
3 $25,159 $100,636 0 $0 Fire - Other
2 $10,270 $61,620 0 $0 Sewerage
2 $15,199 $91,194 0 $0 Police - Other
2 $10,474 $62,844 2 $4,088
Totals for Government
583 $4,441,927 $91,429 312 $513,811
Melrose government finances - Expenditure in 2021 (per resident):
Construction - Regular Highways: $570,000 ($19.55)
General - Other: $6,000 ($0.21)Current Operations - Elementary and Secondary Education: $56,452,000 ($1936.27)
General - Other: $31,496,000 ($1080.29)Sewerage: $8,758,000 ($300.39)Water Utilities: $5,846,000 ($200.51)Regular Highways: $5,763,000 ($197.67)Police Protection: $5,194,000 ($178.15)Local Fire Protection: $4,739,000 ($162.55)Parks and Recreation: $1,763,000 ($60.47)Solid Waste Management: $1,468,000 ($50.35)Financial Administration: $1,279,000 ($43.87)Judicial and Legal Services: $1,188,000 ($40.75)Libraries: $1,085,000 ($37.21)Health - Other: $1,034,000 ($35.47)Central Staff Services: $419,000 ($14.37)Protective Inspection and Regulation - Other: $374,000 ($12.83)Public Welfare - Other: $365,000 ($12.52)Natural Resources - Other: $21,000 ($0.72)Housing and Community Development: $7,000 ($0.24)General - Interest on Debt: $1,628,000 ($55.84)
Intergovernmental to Local - Other - Elementary and Secondary Education: $1,650,000 ($56.59)
Other - Central Staff Services: $15,000 ($0.51)Other - Health - Other: $10,000 ($0.34)Intergovernmental to State - Transit Utilities: $631,000 ($21.64)
General - Other: $42,000 ($1.44)Other Capital Outlay - Elementary and Secondary Education: $337,000 ($11.56)
Total Salaries and Wages: $32,199,000 ($1104.41)
Water Utilities - Interest on Debt: $48,000 ($1.65)
Melrose government finances - Revenue in 2021 (per resident):
Charges - Sewerage: $9,594,000 ($329.07)
Other: $1,974,000 ($67.71)Parks and Recreation: $1,924,000 ($65.99)Elementary and Secondary Education School Tuition and Transportation: $728,000 ($24.97)Elementary and Secondary Education - Other: $178,000 ($6.11)Federal Intergovernmental - Other: $4,184,000 ($143.51)
Education: $21,000 ($0.72)Local Intergovernmental - Education: $35,000 ($1.20)
Miscellaneous - General Revenue - Other: $1,004,000 ($34.44)
Donations From Private Sources: $170,000 ($5.83)Fines and Forfeits: $105,000 ($3.60)Interest Earnings: $46,000 ($1.58)Special Assessments: $5,000 ($0.17)Revenue - Water Utilities: $6,814,000 ($233.72)
State Intergovernmental - Education: $15,151,000 ($519.67)
General Local Government Support: $5,550,000 ($190.36)Other: $857,000 ($29.39)Highways: $783,000 ($26.86)Public Welfare: $183,000 ($6.28)Tax - Property: $77,424,000 ($2655.60)
Other Selective Sales: $870,000 ($29.84)Other License: $15,000 ($0.51)
Melrose government finances - Debt in 2021 (per resident):
Long Term Debt - Beginning Outstanding - Unspecified Public Purpose: $55,799,000 ($1913.87)
Outstanding Unspecified Public Purpose: $50,613,000 ($1736.00)Retired Unspecified Public Purpose: $5,726,000 ($196.40)Issue, Unspecified Public Purpose: $540,000 ($18.52)
Melrose government finances - Cash and Securities in 2021 (per resident):
Bond Funds - Cash and Securities: $2,467,000 ($84.62)
Other Funds - Cash and Securities: $22,933,000 ($786.59)
6.91% of this county's 2021 resident taxpayers lived in other counties in 2020 ($102,955 average adjusted gross income )
Here:
6.91%Massachusetts average:
6.35%
0.01% of residents moved from foreign countries ($137 average AGI )Middlesex County:
0.01%Massachusetts average:
0.01%
Top counties from which taxpayers relocated into this county between 2020 and 2021:
8.22% of this county's 2020 resident taxpayers moved to other counties in 2021 ($123,369 average adjusted gross income )
Here:
8.22%Massachusetts average:
7.18%
0.01% of residents moved to foreign countries ($124 average AGI )Middlesex County:
0.01%Massachusetts average:
0.02%
Top counties to which taxpayers relocated from this county between 2020 and 2021:
Businesses in Melrose, MA
Name Count Name Count
CVS 1 MasterBrand Cabinets 4 Decora Cabinetry 4 New Balance 1 Domino's Pizza 1 Nike 1 Dunkin Donuts 2 Rite Aid 1 FedEx 2 Shaw's 1 GNC 1 Starbucks 1 H&R Block 1 UPS 2 Lane Furniture 1 YMCA 1
Strongest AM radio stations in Melrose:
WRKO (680 AM; 50 kW; BOSTON, MA; Owner: ENTERCOM BOSTON LICENSE, LLC)
WEZE (590 AM; 5 kW; BOSTON, MA; Owner: NEW ENGLAND CONTINENTAL MEDIA, INC.)
WWZN (1510 AM; 50 kW; BOSTON, MA; Owner: ROSE CITY RADIO CORPORATION)
WILD (1090 AM; daytime; 5 kW; BOSTON, MA; Owner: RADIO ONE OF BOSTON LICENSES, LLC)
WROL (950 AM; 5 kW; BOSTON, MA; Owner: SCA LICENSE CORPORATION)
WXKS (1430 AM; 5 kW; EVERETT, MA; Owner: AMFM RADIO LICENSES, L.L.C.)
WEEI (850 AM; 50 kW; BOSTON, MA; Owner: ENTERCOM BOSTON LICENSE, LLC)
WBZ (1030 AM; 50 kW; BOSTON, MA; Owner: INFINITY BROADCASTING OPERATIONS, INC.)
WRCA (1330 AM; 25 kW; WALTHAM, MA; Owner: WRCA LICENSE, LLC)
WKOX (1200 AM; 50 kW; FRAMINGHAM, MA; Owner: CAPSTAR TX LIMITED PARTNERSHIP)
WBIX (1060 AM; 40 kW; NATICK, MA; Owner: LANGER BROADCASTING CORPORATION)
WUNR (1600 AM; 20 kW; BROOKLINE, MA; Owner: CHAMPION BROADCASTING SYSTEMS, INC.)
WBPS (1150 AM; 5 kW; BOSTON, MA; Owner: MEGA COMMUNICATIONS OF BOSTON LICENSEE, L.L.C.)
Strongest FM radio stations in Melrose:
WFNX (101.7 FM; LYNN, MA; Owner: MCC BROADCASTING COMPANY, INC.)
WXKS-FM (107.9 FM; MEDFORD, MA; Owner: AMFM RADIO LICENSES, L.L.C.)
WMJX (106.7 FM; BOSTON, MA; Owner: GREATER BOSTON RADIO, INC.)
WQSX (93.7 FM; LAWRENCE, MA; Owner: ENTERCOM BOSTON LICENSE, LLC)
W267AI (101.3 FM; BOSTON, MA; Owner: MCC BROADCASTING COMPANY, INC.)
WBCN (104.1 FM; BOSTON, MA; Owner: HEMISPHERE BROADCASTING CORPORATION)
WZLX (100.7 FM; BOSTON, MA; Owner: INFINITY BROADCASTING CORPORATION OF BOSTON)
WERS (88.9 FM; BOSTON, MA; Owner: EMERSON COLLEGE)
WHRB (95.3 FM; CAMBRIDGE, MA; Owner: HARVARD RADIO BROADCASTING CO., INC.)
WBMX (98.5 FM; BOSTON, MA; Owner: INFINITY RADIO OPERATIONS INC.)
WJMN (94.5 FM; BOSTON, MA; Owner: AMFM RADIO LICENSES, L.L.C.)
WCRB (102.5 FM; WALTHAM, MA; Owner: CHARLES RIVER BROADCASTING WCRB LICE)
WTKK (96.9 FM; BOSTON, MA; Owner: GREATER BOSTON RADIO, INC.)
WROR-FM (105.7 FM; FRAMINGHAM, MA; Owner: GREATER BOSTON RADIO, INC.)
WBOS (92.9 FM; BROOKLINE, MA; Owner: GREATER BOSTON RADIO, INC.)
WGBH (89.7 FM; BOSTON, MA; Owner: WGBH EDUCATIONAL FOUNDATION)
WBUR-FM (90.9 FM; BOSTON, MA; Owner: TRUSTEES OF BOSTON UNIVERSITY)
WODS (103.3 FM; BOSTON, MA; Owner: INFINITY BROADCASTING OPERATIONS, INC.)
WMBR (88.1 FM; CAMBRIDGE, MA; Owner: TECHNOLOGY BROADCASTING CORPORATION)
WMFO (91.5 FM; MEDFORD, MA; Owner: TUFTS UNIVERSITY)
TV broadcast stations around Melrose:
WBPX (Channel 68; BOSTON, MA; Owner: PAXSON BOSTON-68 LICENSE, INC.)
WTMU-LP (Channel 32; BOSTON, MA; Owner: ZGS BOSTON, INC.)
WCEA-LP (Channel 58; BOSTON, MA; Owner: CHANNEL 19 TV CORPORATION)
WCVB-TV (Channel 5; BOSTON, MA; Owner: WCVB HEARST-ARGYLE TV, INC.)
WGBH-TV (Channel 2; BOSTON, MA; Owner: WGBH EDUCATIONAL FOUNDATION)
WHDH-TV (Channel 7; BOSTON, MA; Owner: WHDH-TV)
WMFP (Channel 62; LAWRENCE, MA; Owner: WSAH LICENSE, INC.)
WSBK-TV (Channel 38; BOSTON, MA; Owner: VIACOM INC.)
WLVI-TV (Channel 56; CAMBRIDGE, MA; Owner: WLVI, INC.)
WBZ-TV (Channel 4; BOSTON, MA; Owner: VIACOM INC.)
WGBX-TV (Channel 44; BOSTON, MA; Owner: WGBH EDUCATIONAL FOUNDATION)
WFXT (Channel 25; BOSTON, MA; Owner: FOX TELEVISION STATIONS INC.)
W40BO (Channel 40; BOSTON, MA; Owner: PAXSON COMMUNICATIONS LPTV, INC.)
WUTF (Channel 66; MARLBOROUGH, MA; Owner: TELEFUTURA BOSTON LLC)
WFXZ-CA (Channel 24; BOSTON, MA; Owner: BOSTON BROADCASTING CORP.)
WUNI (Channel 27; WORCESTER, MA; Owner: ENTRAVISION HOLDINGS, LLC)
WWDP (Channel 46; NORWELL, MA; Owner: NORWELL TELEVISION, LLC)
WHDN-LP (Channel 26; BOSTON, MA; Owner: GUENTER MARKSTEINER)
WLNE-TV (Channel 6; NEW BEDFORD, MA; Owner: FREEDOM BROADCASTING OF SOUTHERN NEW ENGLAND, INC.)
WNAC-TV (Channel 64; PROVIDENCE, RI; Owner: WNAC, LLC)
WPRI-TV (Channel 12; PROVIDENCE, RI; Owner: TVL BROADCASTING OF RHODE ISLAND, LLC)
WNDS (Channel 50; DERRY, NH; Owner: CTV OF DERRY, INC)
Medal of Honor Recipients
Medal of Honor Recipient born in Melrose: Walter C., Jr. Monegan.
National Bridge Inventory (NBI) Statistics 1 Number of bridges3ft / 1.2m Total length $850,000 Total costs3,200 Total average daily traffic640 Total average daily truck traffic0 Total future (year 21) average daily traffic
FCC Registered Private Land Mobile Towers: 2 (
See the full list of FCC Registered Private Land Mobile Towers in Melrose, MA )
FCC Registered Broadcast Land Mobile Towers: 7 (
See the full list of FCC Registered Broadcast Land Mobile Towers )
FCC Registered Microwave Towers: 4
MELROSE, 585 Lebanon St (Lat: 42.460639 Lon: -71.061139), Structure height: 25.6 m, Overall height: 33.5 m, Call Sign: WPOP921, Assigned Frequencies: 17945.0 MHz, Grant Date: 02/12/2008, Expiration Date: 04/01/2018, Cancellation Date: 07/20/2016, Certifier: Carol L Tacker, Registrant: At&t Mobility LLC, 1120 20th Street, Nw - Suite 1000, Washington, DC 20036, Phone: (202) 457-2055, Fax: (202) 457-3073, Email:
BOS0305, 585 Lebanon (Lat: 42.459722 Lon: -71.060833), Type: Pole, Structure height: 30.5 m, Overall height: 33.5 m, Call Sign: WQBM335, Assigned Frequencies: 19640.0 MHz, Grant Date: 11/03/2004, Expiration Date: 11/03/2014, Cancellation Date: 11/01/2005, Certifier: Eric M Botto, Registrant: Comsearch, 19700 Janelia Farm Boulevard, Ashburn, VA 20147, Phone: (703) 726-5671, Fax: (703) 726-5594, Email:
MA-BOS5914A, 51 Highland Ave (Lat: 42.465639 Lon: -71.063639), Type: Bant, Structure height: 26.8 m, Overall height: 29.8 m, Call Sign: WQMB379, Assigned Frequencies: 17815.0 MHz, 17915.0 MHz, Grant Date: 08/04/2020, Expiration Date: 06/17/2030, Cancellation Date: 09/13/2021, Certifier: Nadja S Sodos-Wallace, Registrant: T-Mobile Usa, Inc., 12920 Se 38th Street, Bellevue, WA 98006, Phone: (425) 383-8402, Fax: (425) 383-4840, Email:
MA-BOS5241A, 340 Main Street (Lat: 42.452028 Lon: -71.066694), Type: Bant, Structure height: 24.4 m, Overall height: 27.4 m, Call Sign: WQNM420, Assigned Frequencies: 21825.0 MHz, 21925.0 MHz, Grant Date: 03/22/2011, Expiration Date: 03/22/2021, Cancellation Date: 03/18/2021, Certifier: Nadja S Sodos-Wallace, Registrant: Sprint Corporation, 12502 Sunrise Valley Drive, M/S: Varesa0209, Reston, VA 20196, Phone: (800) 572-8256, Fax: (703) 433-4483, Email:
FCC Registered Paging Towers: 1
585 Lebanon Street, Melrose Wakefield Hospital (Lat: 42.460278 Lon: -71.061944), Type: Bant, Structure height: 35.1 m, Overall height: 38.1 m, Call Sign: KCI297, Licensee ID: L01422065, Assigned Frequencies: 454.175 MHz, Grant Date: 05/05/2009, Expiration Date: 04/01/2019, Cancellation Date: 07/13/2010, Certifier: Shawn E Endsley, Registrant: Usa Mobility Wireless, Inc., 3000 Technology Dr. #400, Plano, TX 75074, Phone: (972) 801-0000, Fax: (972) 801-1699, Email:
FCC Registered Amateur Radio Licenses: 105 (
See the full list of FCC Registered Amateur Radio Licenses in Melrose )
FAA Registered Aircraft: 3
Aircraft: NAVION NAVION A (Category: Land, Seats: 4, Weight: Up to 12,499 Pounds, Speed: 120 mph), Engine: CONT MOTOR E225 SERIES (225 HP) (Reciprocating)N-Number: 1046W, N1046W, N-1046W, Serial Number: NAV-4-54, Airworthiness Date: 09/08/1955, Certificate Issue Date: 10/31/2016Registrant (Individual): Thomas Schinkel, 499 Lebanon St, Melrose, MA 02176Deregistered: Cancel Date: 09/16/2014Aircraft: DJI INNOVATIONS PHANTOM 3 ADVANCED (Category: Land, Engines: 4), Engine: ElectricN-Number: 608FH, N608FH, N-608FH, Serial Number: P76DCG10011375, Certificate Issue Date: 05/04/2016Registrant (LLC): Blue Heron Ventures LLC, 185 Essex St Unite 1b, Melrose, MA 02176Deregistered: Cancel Date: 09/06/2019Aircraft: MICHAUD NORMAN J KR2S (Category: Land, Seats: 2, Weight: Up to 12,499 Pounds), Engine: AMA/EXPR UNKNOWN ENG (Reciprocating)N-Number: 24065, N24065, N-24065, Serial Number: 9130-653, Year manufactured: 2005, Airworthiness Date: 06/16/2005, Certificate Issue Date: 09/24/2002Registrant (Individual): Norman J Michaud, 7 Winter St, Melrose, MA 02176Deregistered: Cancel Date: 07/07/2017
Home Mortgage Disclosure Act Aggregated Statistics For Year 2009(Based on 5 full tracts) A) FHA, FSA/RHS & VA B) Conventional C) Refinancings D) Home Improvement Loans E) Loans on Dwellings For 5+ Families F) Non-occupant Loans on Number Average Value Number Average Value Number Average Value Number Average Value Number Average Value Number Average Value
LOANS ORIGINATED 63 $334,968 199 $271,749 1,105 $272,699 48 $119,896 1 $2,288,000 27 $222,852 APPLICATIONS APPROVED, NOT ACCEPTED 4 $249,250 14 $225,429 61 $275,164 7 $81,714 0 $0 2 $299,000 APPLICATIONS DENIED 10 $342,600 27 $229,963 172 $298,291 13 $116,462 1 $525,000 12 $251,083 APPLICATIONS WITHDRAWN 9 $329,667 25 $302,320 126 $281,659 5 $166,800 1 $788,000 3 $306,000 FILES CLOSED FOR INCOMPLETENESS 0 $0 3 $366,333 44 $292,568 1 $150,000 0 $0 2 $280,000
Aggregated Statistics For Year 2008(Based on 5 full tracts) A) FHA, FSA/RHS & VA B) Conventional C) Refinancings D) Home Improvement Loans E) Loans on Dwellings For 5+ Families F) Non-occupant Loans on G) Loans On Manufactured Number Average Value Number Average Value Number Average Value Number Average Value Number Average Value Number Average Value Number Average Value
LOANS ORIGINATED 16 $376,625 249 $280,000 410 $273,307 53 $126,547 7 $1,091,000 52 $267,827 0 $0 APPLICATIONS APPROVED, NOT ACCEPTED 1 $296,000 27 $248,074 54 $281,315 6 $52,500 0 $0 4 $261,500 0 $0 APPLICATIONS DENIED 2 $305,000 22 $253,045 113 $264,000 17 $92,059 0 $0 9 $277,778 0 $0 APPLICATIONS WITHDRAWN 0 $0 33 $302,909 68 $283,500 6 $111,667 1 $471,000 2 $254,000 1 $77,000 FILES CLOSED FOR INCOMPLETENESS 0 $0 6 $195,333 21 $280,429 3 $85,000 0 $0 1 $255,000 0 $0
Aggregated Statistics For Year 2007(Based on 5 full tracts) A) FHA, FSA/RHS & VA B) Conventional C) Refinancings D) Home Improvement Loans E) Loans on Dwellings For 5+ Families F) Non-occupant Loans on Number Average Value Number Average Value Number Average Value Number Average Value Number Average Value Number Average Value
LOANS ORIGINATED 2 $414,500 377 $250,462 404 $243,371 80 $85,275 8 $358,125 36 $209,111 APPLICATIONS APPROVED, NOT ACCEPTED 1 $294,000 42 $219,452 64 $277,844 22 $95,955 0 $0 2 $422,000 APPLICATIONS DENIED 1 $243,000 44 $238,705 214 $305,383 32 $225,688 0 $0 27 $289,074 APPLICATIONS WITHDRAWN 0 $0 38 $265,947 80 $278,775 7 $89,857 1 $1,800,000 4 $220,750 FILES CLOSED FOR INCOMPLETENESS 0 $0 6 $242,500 38 $291,816 2 $182,500 0 $0 2 $151,000
Aggregated Statistics For Year 2006(Based on 5 full tracts) A) FHA, FSA/RHS & VA B) Conventional C) Refinancings D) Home Improvement Loans E) Loans on Dwellings For 5+ Families F) Non-occupant Loans on G) Loans On Manufactured Number Average Value Number Average Value Number Average Value Number Average Value Number Average Value Number Average Value Number Average Value
LOANS ORIGINATED 2 $360,000 463 $245,542 513 $237,099 130 $96,315 4 $419,250 35 $251,286 1 $100,000 APPLICATIONS APPROVED, NOT ACCEPTED 0 $0 56 $212,089 71 $303,380 23 $69,174 1 $1,190,000 10 $806,500 0 $0 APPLICATIONS DENIED 0 $0 72 $219,417 200 $267,410 38 $96,053 1 $50,000 11 $241,455 1 $70,000 APPLICATIONS WITHDRAWN 1 $296,000 49 $242,980 148 $295,500 7 $173,429 0 $0 8 $223,125 0 $0 FILES CLOSED FOR INCOMPLETENESS 0 $0 5 $246,800 37 $283,486 0 $0 0 $0 3 $267,667 0 $0
Aggregated Statistics For Year 2005(Based on 5 full tracts) A) FHA, FSA/RHS & VA B) Conventional C) Refinancings D) Home Improvement Loans E) Loans on Dwellings For 5+ Families F) Non-occupant Loans on G) Loans On Manufactured Number Average Value Number Average Value Number Average Value Number Average Value Number Average Value Number Average Value Number Average Value
LOANS ORIGINATED 1 $308,000 523 $261,939 691 $250,103 119 $119,639 3 $850,000 57 $267,860 2 $125,000 APPLICATIONS APPROVED, NOT ACCEPTED 0 $0 27 $276,370 75 $254,907 14 $80,571 0 $0 3 $209,667 1 $14,000 APPLICATIONS DENIED 0 $0 51 $234,000 162 $273,556 32 $110,500 0 $0 11 $200,636 0 $0 APPLICATIONS WITHDRAWN 0 $0 81 $262,494 227 $278,269 12 $312,167 1 $430,000 11 $308,727 0 $0 FILES CLOSED FOR INCOMPLETENESS 0 $0 14 $279,714 31 $255,484 3 $204,667 0 $0 5 $331,800 0 $0
Aggregated Statistics For Year 2004(Based on 5 full tracts) A) FHA, FSA/RHS & VA B) Conventional C) Refinancings D) Home Improvement Loans E) Loans on Dwellings For 5+ Families F) Non-occupant Loans on G) Loans On Manufactured Number Average Value Number Average Value Number Average Value Number Average Value Number Average Value Number Average Value Number Average Value
LOANS ORIGINATED 2 $271,000 465 $253,443 823 $232,570 110 $139,182 9 $398,222 67 $241,418 1 $26,000 APPLICATIONS APPROVED, NOT ACCEPTED 0 $0 47 $258,745 99 $231,263 14 $129,571 0 $0 7 $290,143 0 $0 APPLICATIONS DENIED 1 $207,000 59 $282,763 169 $290,669 38 $139,026 0 $0 12 $330,833 0 $0 APPLICATIONS WITHDRAWN 0 $0 55 $217,236 227 $258,608 21 $141,333 1 $300,000 7 $344,143 0 $0 FILES CLOSED FOR INCOMPLETENESS 0 $0 9 $310,333 40 $294,850 3 $109,333 0 $0 1 $240,000 0 $0
Aggregated Statistics For Year 2003(Based on 5 full tracts) A) FHA, FSA/RHS & VA B) Conventional C) Refinancings D) Home Improvement Loans E) Loans on Dwellings For 5+ Families F) Non-occupant Loans on Number Average Value Number Average Value Number Average Value Number Average Value Number Average Value Number Average Value
LOANS ORIGINATED 2 $289,000 404 $246,708 2,351 $205,341 62 $89,597 3 $357,333 84 $242,071 APPLICATIONS APPROVED, NOT ACCEPTED 0 $0 44 $224,386 229 $191,747 24 $60,375 1 $1,350,000 10 $225,000 APPLICATIONS DENIED 1 $445,000 38 $229,763 246 $226,232 28 $106,714 0 $0 15 $246,733 APPLICATIONS WITHDRAWN 0 $0 39 $267,718 261 $216,054 13 $70,154 0 $0 4 $341,500 FILES CLOSED FOR INCOMPLETENESS 0 $0 7 $273,571 34 $230,647 1 $50,000 0 $0 0 $0
Aggregated Statistics For Year 2002(Based on 3 full tracts) A) FHA, FSA/RHS & VA B) Conventional C) Refinancings D) Home Improvement Loans E) Loans on Dwellings For 5+ Families F) Non-occupant Loans on Number Average Value Number Average Value Number Average Value Number Average Value Number Average Value Number Average Value
LOANS ORIGINATED 3 $228,000 276 $242,192 1,266 $195,966 93 $62,645 1 $220,000 34 $218,941 APPLICATIONS APPROVED, NOT ACCEPTED 0 $0 29 $260,103 132 $189,280 25 $65,920 0 $0 3 $279,667 APPLICATIONS DENIED 0 $0 17 $277,118 97 $205,804 27 $69,556 1 $415,000 5 $295,400 APPLICATIONS WITHDRAWN 1 $198,000 16 $240,625 126 $309,317 14 $55,071 0 $0 5 $131,600 FILES CLOSED FOR INCOMPLETENESS 0 $0 6 $222,167 23 $235,174 0 $0 0 $0 1 $117,000
Aggregated Statistics For Year 2001(Based on 3 full tracts) A) FHA, FSA/RHS & VA B) Conventional C) Refinancings D) Home Improvement Loans E) Loans on Dwellings For 5+ Families F) Non-occupant Loans on Number Average Value Number Average Value Number Average Value Number Average Value Number Average Value Number Average Value
LOANS ORIGINATED 5 $218,000 278 $212,281 900 $194,830 77 $63,078 2 $190,000 31 $188,968 APPLICATIONS APPROVED, NOT ACCEPTED 1 $124,000 22 $235,773 76 $158,395 27 $65,778 0 $0 2 $354,000 APPLICATIONS DENIED 0 $0 17 $195,412 78 $173,026 31 $44,032 0 $0 6 $184,333 APPLICATIONS WITHDRAWN 1 $177,000 14 $218,571 98 $177,673 24 $62,875 0 $0 3 $201,333 FILES CLOSED FOR INCOMPLETENESS 0 $0 1 $275,000 15 $215,200 2 $37,500 0 $0 0 $0
Aggregated Statistics For Year 2000(Based on 3 full tracts) A) FHA, FSA/RHS & VA B) Conventional C) Refinancings D) Home Improvement Loans E) Loans on Dwellings For 5+ Families F) Non-occupant Loans on Number Average Value Number Average Value Number Average Value Number Average Value Number Average Value Number Average Value
LOANS ORIGINATED 7 $212,714 254 $204,331 179 $154,218 60 $35,483 0 $0 20 $163,550 APPLICATIONS APPROVED, NOT ACCEPTED 2 $189,000 24 $185,833 33 $144,424 21 $40,238 0 $0 1 $289,000 APPLICATIONS DENIED 0 $0 13 $181,538 45 $136,267 28 $43,071 0 $0 0 $0 APPLICATIONS WITHDRAWN 0 $0 28 $171,893 35 $113,457 10 $66,600 1 $350,000 2 $115,000 FILES CLOSED FOR INCOMPLETENESS 0 $0 6 $188,167 11 $135,364 1 $40,000 0 $0 0 $0
Aggregated Statistics For Year 1999(Based on 4 full tracts) A) FHA, FSA/RHS & VA B) Conventional C) Refinancings D) Home Improvement Loans E) Loans on Dwellings For 5+ Families F) Non-occupant Loans on Number Average Value Number Average Value Number Average Value Number Average Value Number Average Value Number Average Value
LOANS ORIGINATED 15 $179,235 377 $175,798 564 $139,646 60 $32,219 4 $300,662 43 $140,561 APPLICATIONS APPROVED, NOT ACCEPTED 1 $163,990 29 $148,534 49 $135,212 19 $31,866 1 $427,810 0 $0 APPLICATIONS DENIED 1 $119,710 34 $153,992 106 $127,595 21 $39,779 0 $0 4 $152,512 APPLICATIONS WITHDRAWN 1 $193,940 29 $168,792 82 $128,883 12 $76,902 2 $237,675 3 $239,987 FILES CLOSED FOR INCOMPLETENESS 0 $0 10 $160,269 23 $143,864 0 $0 0 $0 1 $237,530
Detailed HMDA statistics for the following Tracts:
3361.00
, 3362.00 , 3363.00 , 3364.01 , 3364.02
Private Mortgage Insurance Companies Aggregated Statistics For Year 2009(Based on 5 full tracts) A) Conventional B) Refinancings Number Average Value Number Average Value
LOANS ORIGINATED 46 $323,696 33 $348,182 APPLICATIONS APPROVED, NOT ACCEPTED 16 $319,500 11 $341,091 APPLICATIONS DENIED 6 $270,667 9 $373,889 APPLICATIONS WITHDRAWN 1 $383,000 2 $302,000 FILES CLOSED FOR INCOMPLETENESS 0 $0 0 $0
Aggregated Statistics For Year 2008(Based on 5 full tracts) A) Conventional B) Refinancings Number Average Value Number Average Value
LOANS ORIGINATED 77 $320,545 31 $330,871 APPLICATIONS APPROVED, NOT ACCEPTED 16 $313,000 7 $343,571 APPLICATIONS DENIED 3 $330,667 6 $331,500 APPLICATIONS WITHDRAWN 4 $346,500 3 $387,000 FILES CLOSED FOR INCOMPLETENESS 0 $0 0 $0
Aggregated Statistics For Year 2007(Based on 5 full tracts) A) Conventional B) Refinancings C) Non-occupant Loans on Number Average Value Number Average Value Number Average Value
LOANS ORIGINATED 49 $307,918 13 $333,154 3 $245,667 APPLICATIONS APPROVED, NOT ACCEPTED 7 $247,571 1 $202,000 2 $227,500 APPLICATIONS DENIED 0 $0 1 $463,000 0 $0 APPLICATIONS WITHDRAWN 8 $312,750 0 $0 0 $0 FILES CLOSED FOR INCOMPLETENESS 0 $0 0 $0 0 $0
Aggregated Statistics For Year 2006(Based on 5 full tracts) A) Conventional B) Refinancings C) Non-occupant Loans on Number Average Value Number Average Value Number Average Value
LOANS ORIGINATED 29 $315,621 2 $365,500 2 $268,000 APPLICATIONS APPROVED, NOT ACCEPTED 6 $296,500 1 $396,000 2 $268,000 APPLICATIONS DENIED 1 $360,000 1 $366,000 1 $360,000 APPLICATIONS WITHDRAWN 0 $0 1 $347,000 0 $0 FILES CLOSED FOR INCOMPLETENESS 0 $0 0 $0 0 $0
Aggregated Statistics For Year 2005(Based on 5 full tracts) A) Conventional B) Refinancings C) Non-occupant Loans on Number Average Value Number Average Value Number Average Value
LOANS ORIGINATED 35 $299,943 8 $252,625 3 $300,333 APPLICATIONS APPROVED, NOT ACCEPTED 8 $316,625 3 $276,667 1 $570,000 APPLICATIONS DENIED 0 $0 0 $0 0 $0 APPLICATIONS WITHDRAWN 1 $296,000 0 $0 0 $0 FILES CLOSED FOR INCOMPLETENESS 0 $0 1 $129,000 0 $0
Aggregated Statistics For Year 2004(Based on 5 full tracts) A) Conventional B) Refinancings C) Non-occupant Loans on Number Average Value Number Average Value Number Average Value
LOANS ORIGINATED 50 $281,540 19 $347,158 3 $362,000 APPLICATIONS APPROVED, NOT ACCEPTED 6 $312,500 7 $311,857 0 $0 APPLICATIONS DENIED 1 $324,000 2 $589,000 1 $570,000 APPLICATIONS WITHDRAWN 3 $286,000 3 $502,000 0 $0 FILES CLOSED FOR INCOMPLETENESS 0 $0 2 $253,500 0 $0
Aggregated Statistics For Year 2003(Based on 5 full tracts) A) Conventional B) Refinancings C) Non-occupant Loans on Number Average Value Number Average Value Number Average Value
LOANS ORIGINATED 75 $270,133 29 $263,034 5 $265,200 APPLICATIONS APPROVED, NOT ACCEPTED 15 $294,067 6 $288,833 1 $198,000 APPLICATIONS DENIED 1 $446,000 0 $0 0 $0 APPLICATIONS WITHDRAWN 4 $214,500 2 $291,500 0 $0 FILES CLOSED FOR INCOMPLETENESS 0 $0 0 $0 0 $0
Aggregated Statistics For Year 2002(Based on 3 full tracts) A) Conventional B) Refinancings C) Non-occupant Loans on Number Average Value Number Average Value Number Average Value
LOANS ORIGINATED 46 $291,935 7 $273,143 0 $0 APPLICATIONS APPROVED, NOT ACCEPTED 10 $275,900 3 $332,000 1 $208,000 APPLICATIONS DENIED 2 $336,000 1 $280,000 1 $280,000 APPLICATIONS WITHDRAWN 0 $0 1 $220,000 0 $0 FILES CLOSED FOR INCOMPLETENESS 1 $349,000 0 $0 0 $0
Aggregated Statistics For Year 2001(Based on 3 full tracts) A) Conventional B) Refinancings C) Non-occupant Loans on Number Average Value Number Average Value Number Average Value
LOANS ORIGINATED 67 $265,179 6 $269,833 3 $285,333 APPLICATIONS APPROVED, NOT ACCEPTED 4 $175,000 4 $205,750 0 $0 APPLICATIONS DENIED 3 $216,333 0 $0 1 $296,000 APPLICATIONS WITHDRAWN 2 $287,500 0 $0 0 $0 FILES CLOSED FOR INCOMPLETENESS 0 $0 0 $0 0 $0
Aggregated Statistics For Year 2000(Based on 3 full tracts) A) Conventional B) Refinancings C) Non-occupant Loans on Number Average Value Number Average Value Number Average Value
LOANS ORIGINATED 71 $235,155 3 $213,000 3 $260,667 APPLICATIONS APPROVED, NOT ACCEPTED 6 $233,167 3 $192,333 0 $0 APPLICATIONS DENIED 3 $218,667 0 $0 0 $0 APPLICATIONS WITHDRAWN 2 $266,500 0 $0 1 $283,000 FILES CLOSED FOR INCOMPLETENESS 1 $164,000 0 $0 0 $0
Aggregated Statistics For Year 1999(Based on 4 full tracts) A) Conventional B) Refinancings C) Non-occupant Loans on Number Average Value Number Average Value Number Average Value
LOANS ORIGINATED 141 $192,184 29 $188,510 6 $191,098 APPLICATIONS APPROVED, NOT ACCEPTED 22 $202,534 11 $200,621 0 $0 APPLICATIONS DENIED 9 $179,332 3 $221,600 0 $0 APPLICATIONS WITHDRAWN 1 $150,890 0 $0 0 $0 FILES CLOSED FOR INCOMPLETENESS 0 $0 2 $181,735 0 $0
Detailed PMIC statistics for the following Tracts:
3361.00
, 3362.00 , 3363.00 , 3364.01 , 3364.02
Most common first names in Melrose, MA among deceased individuals Name Count Lived (average)
Mary 471 82.3 years John 386 75.9 years William 237 74.8 years Helen 198 82.0 years Joseph 189 77.4 years James 182 75.5 years Margaret 172 82.7 years George 166 77.8 years Robert 163 71.0 years Charles 148 78.6 years
Most common last names in Melrose, MA among deceased individuals Last name Count Lived (average)
Smith 74 79.3 years Sullivan 72 78.6 years Brown 68 81.6 years Murphy 63 77.6 years Johnson 51 77.2 years Macdonald 43 81.2 years Jones 33 80.1 years Anderson 32 79.1 years Obrien 30 78.4 years Cronin 29 77.4 years
Melrose compared to Massachusetts state average:
Unemployed percentage significantly below state average. Black race population percentage below state average. Hispanic race population percentage below state average. Length of stay since moving in significantly above state average. Percentage of population with a bachelor's degree or higher above state average.
#53 on the list of "Top 101 cities with the biggest property tax revenues per resident (population 10,000+)"
#4 on the list of "Top 101 counties with the most Orthodox adherents"
#7 on the list of "Top 101 counties with the most Catholic adherents"
#7 on the list of "Top 101 counties with the most Mainline Protestant congregations"
#7 on the list of "Top 101 counties with the most Orthodox congregations"
#8 on the list of "Top 101 counties with the lowest percentage of residents that keep firearms around their homes"
Top Patent Applicants
Marco Giovanardi (27)
Martin R. Tremblay (25)
Edward Buckley (24)
Brian D. Musselman (22)
Pericles Calias (22)
Gadalia Vainer (19)
Daniel J. Sexton (19)
Prakash Narayan Govindan (17)
Fupeng Ma (15)
R. Daniel Ferguson (14)
Total of 1098 patent applications in 2008-2024.

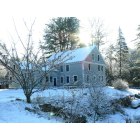


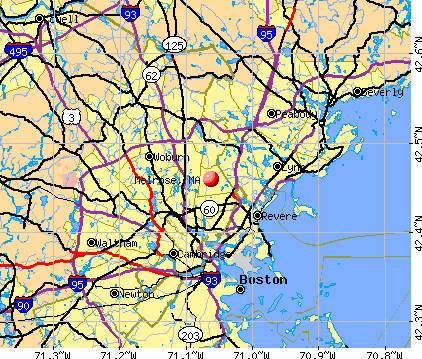


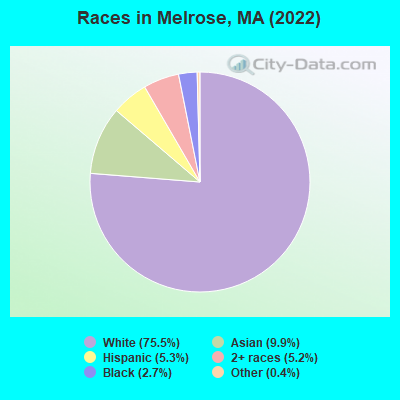
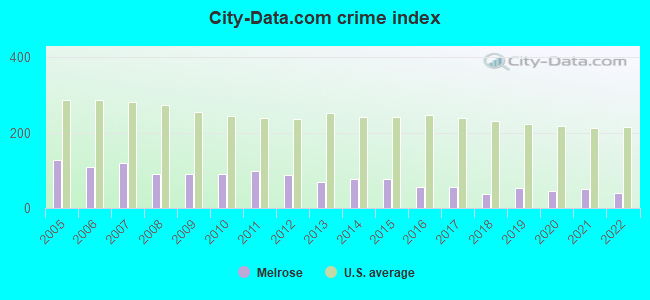
 Recent articles from our blog. Our writers, many of them Ph.D. graduates or candidates, create easy-to-read articles on a wide variety of topics.

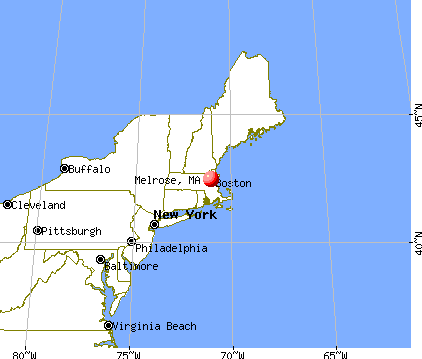
 (2.1 miles
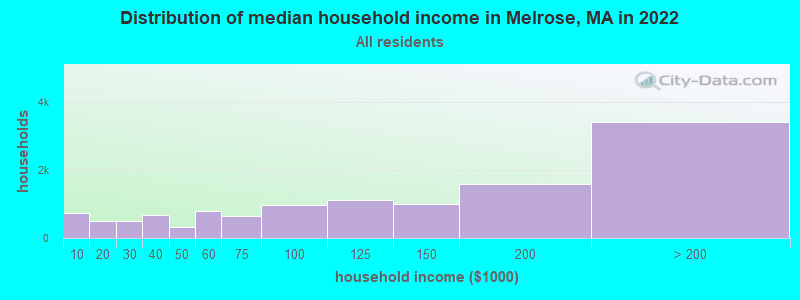
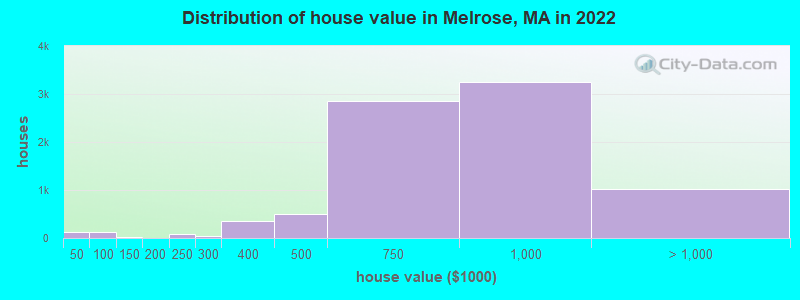
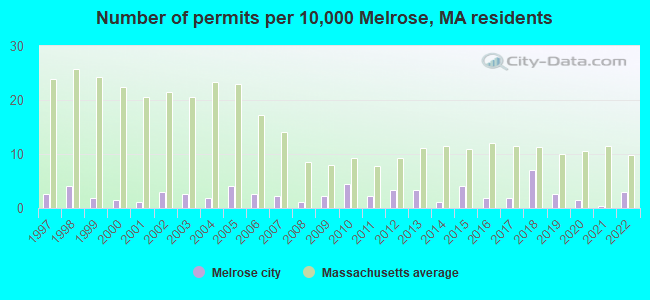
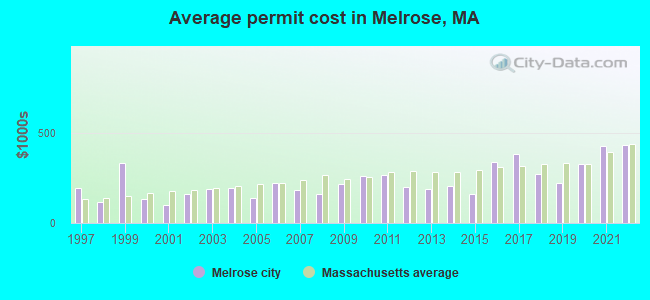
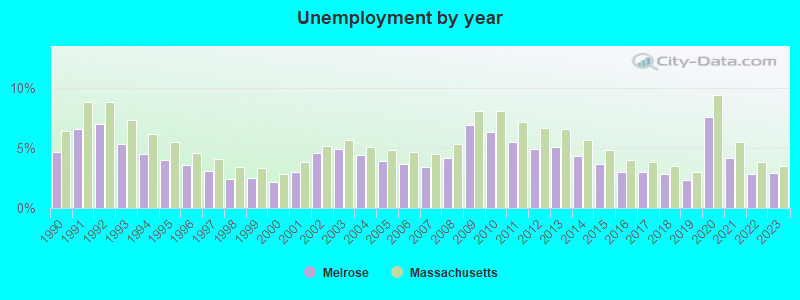
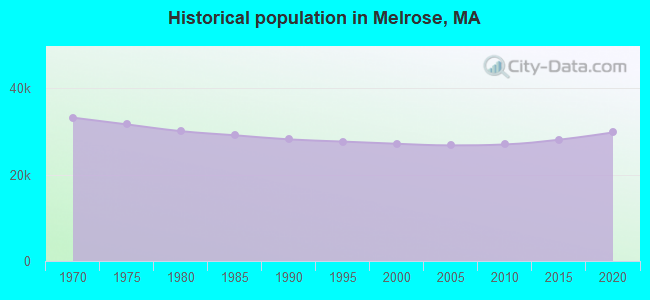
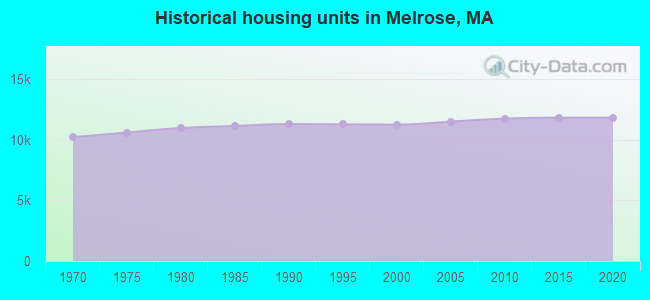
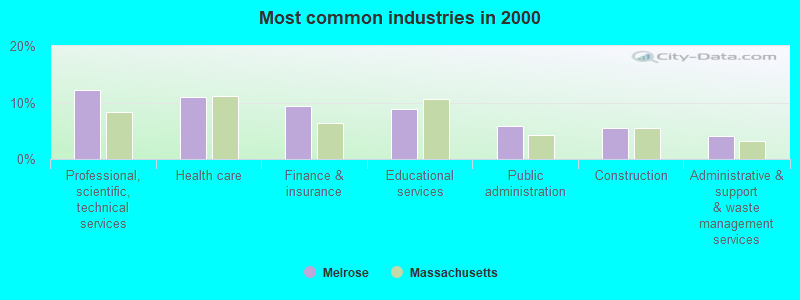
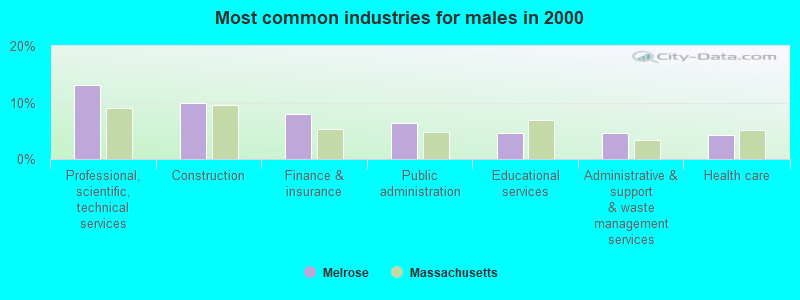
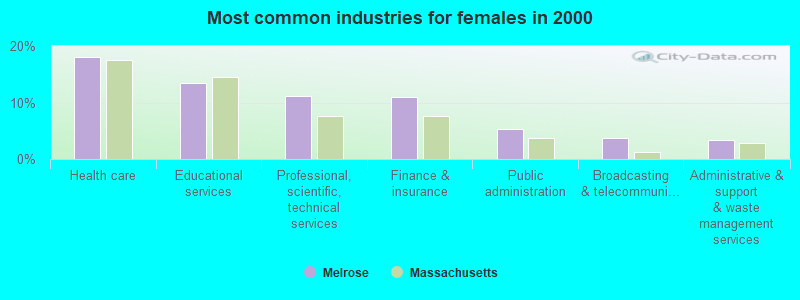
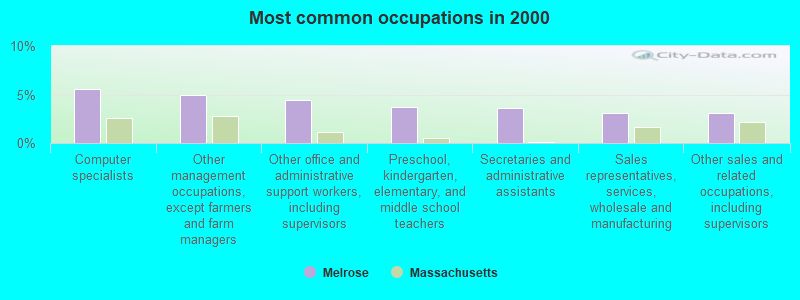
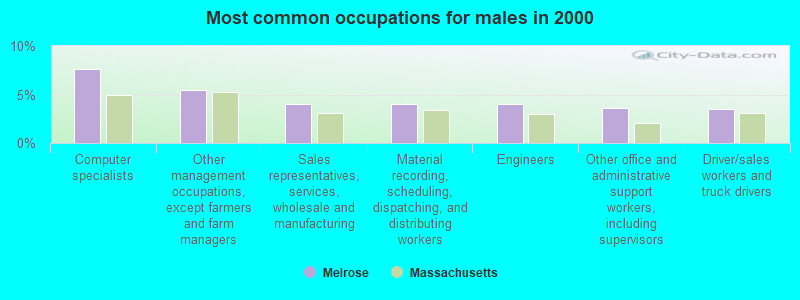
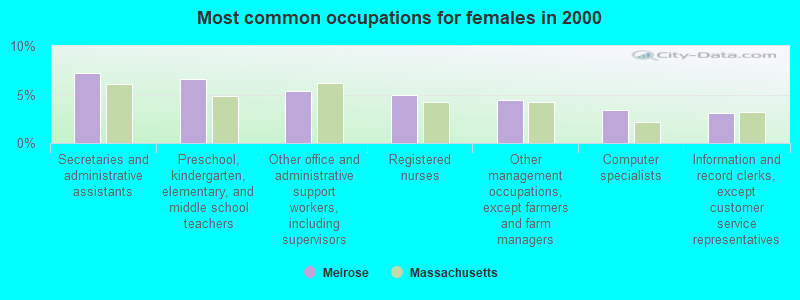
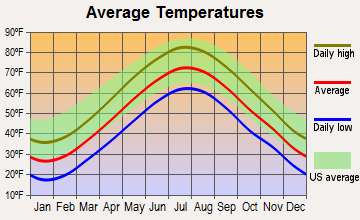
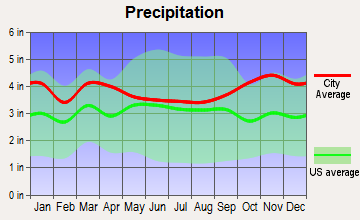
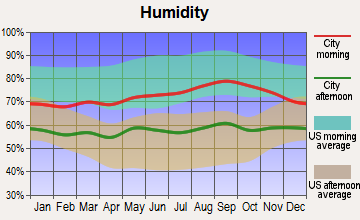
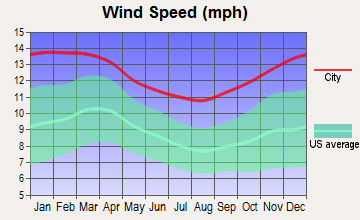
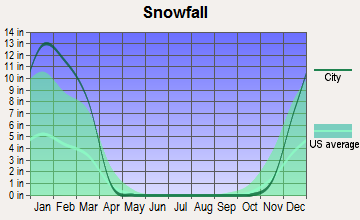
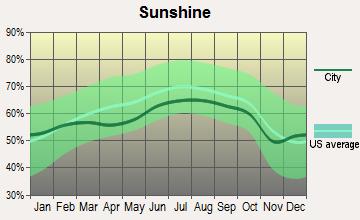
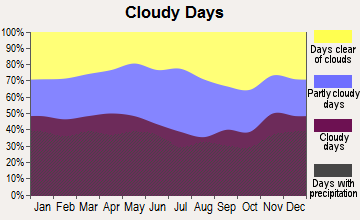


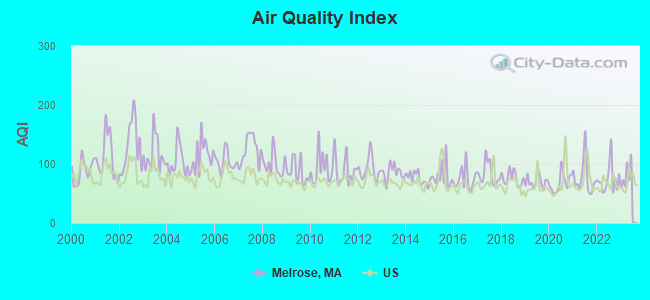
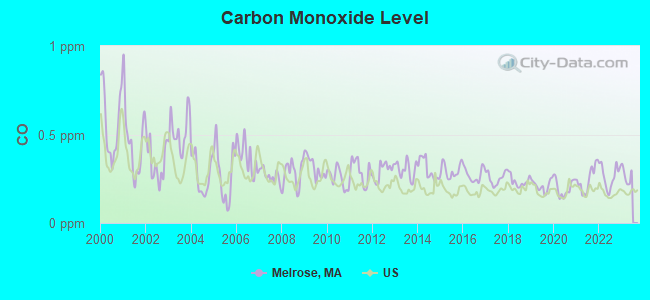
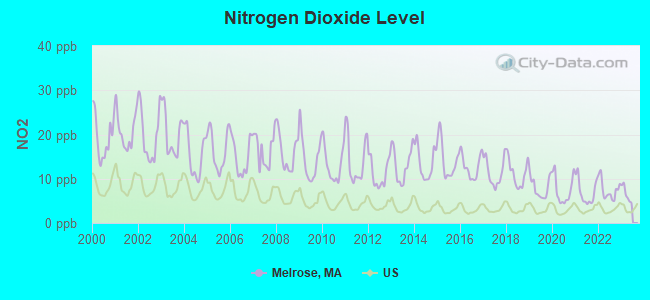
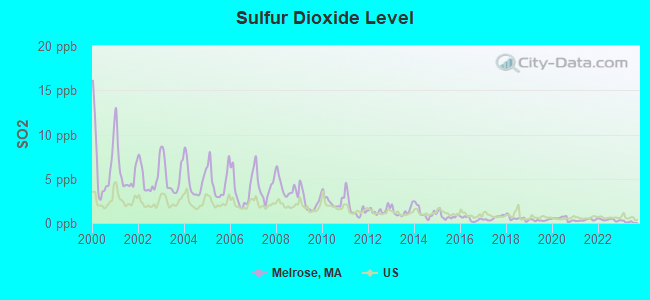
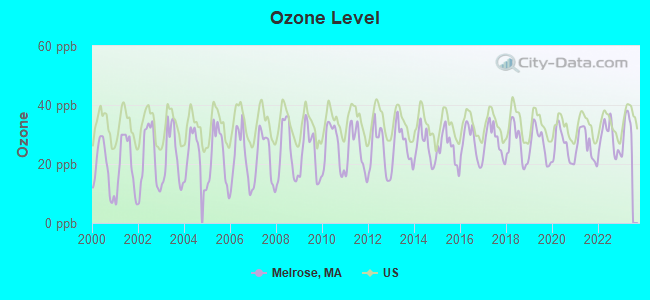
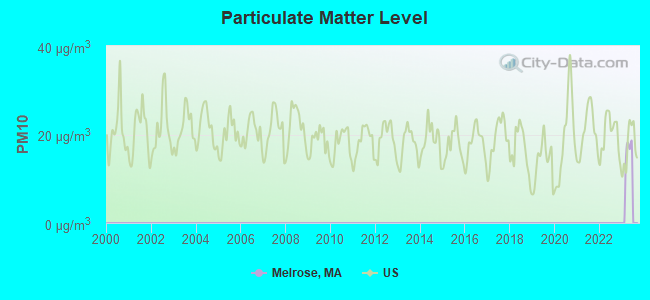
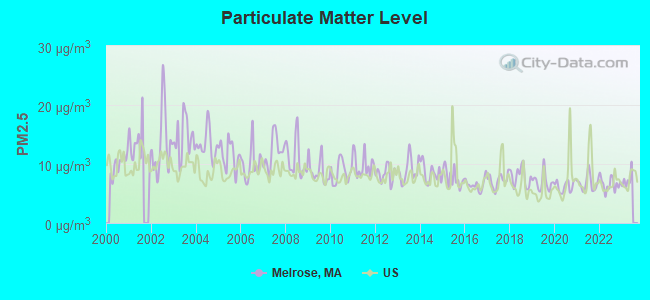
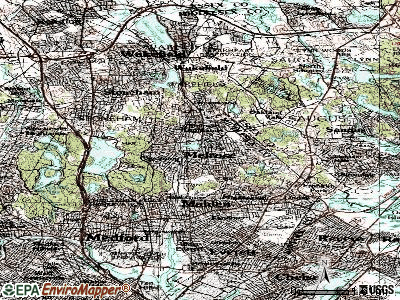
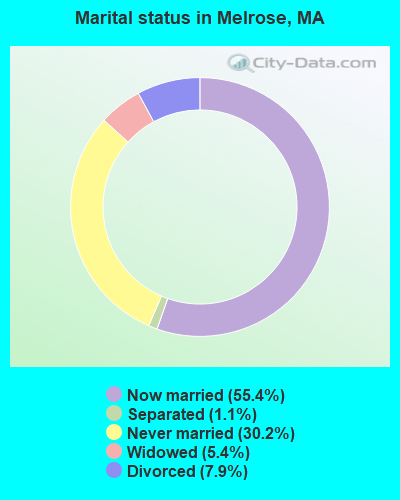
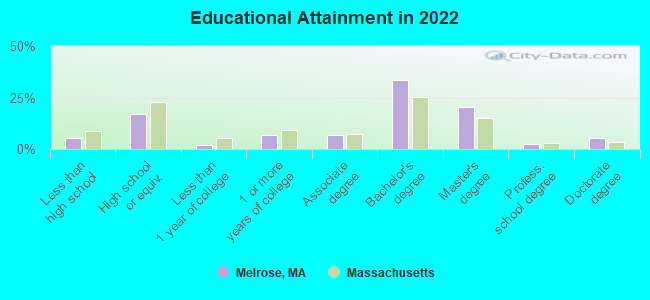
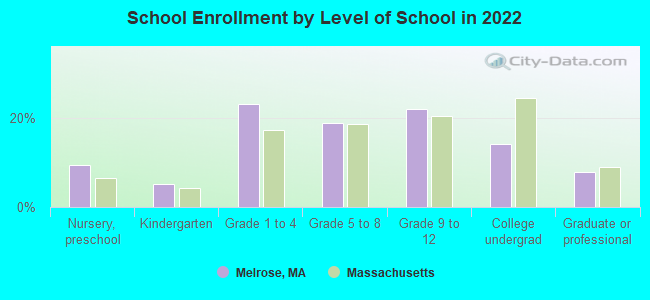
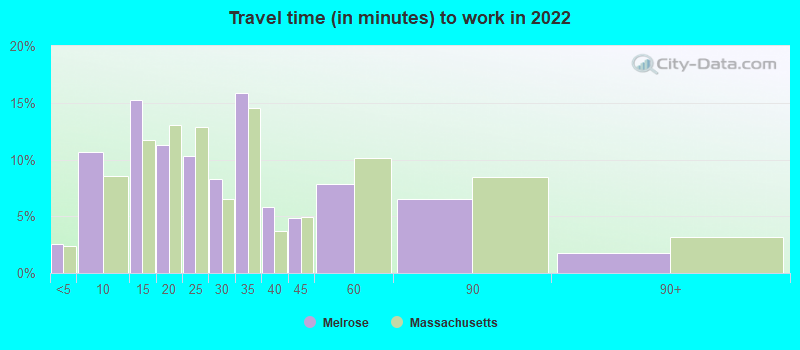
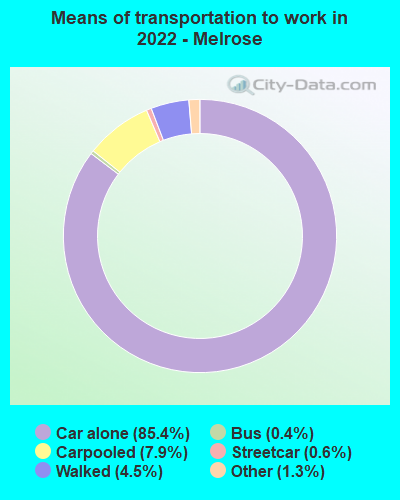
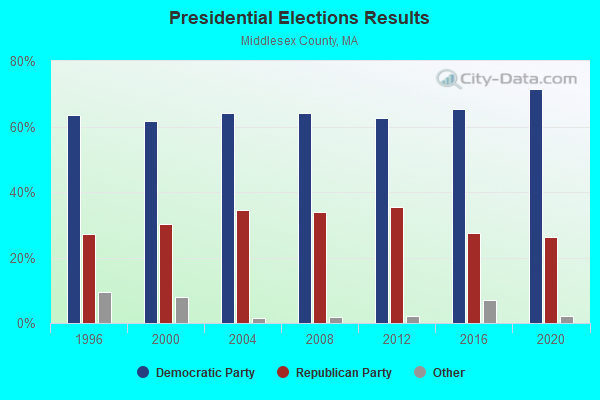
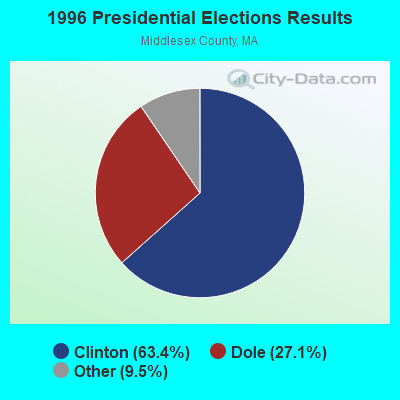
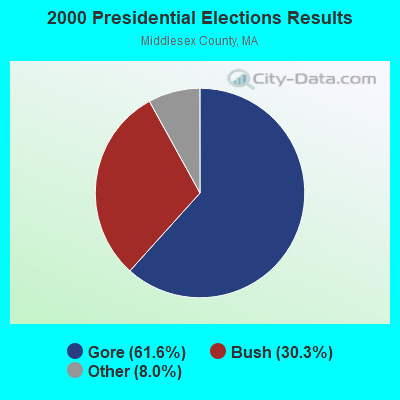
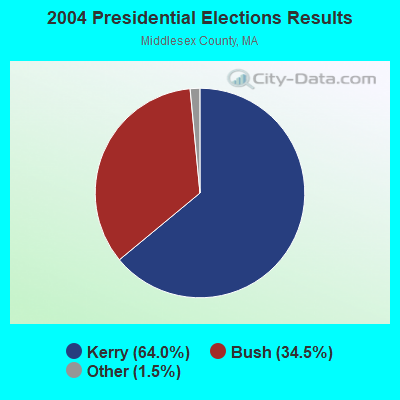
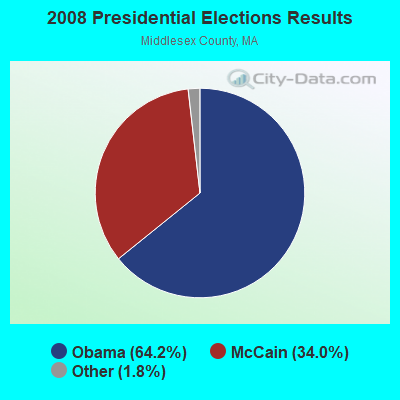
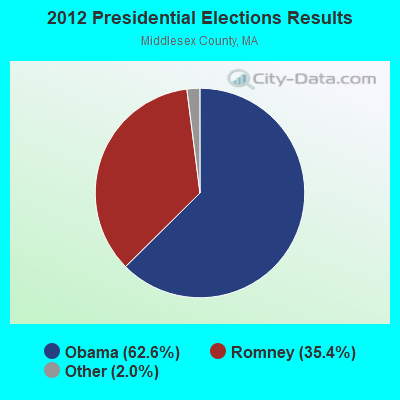
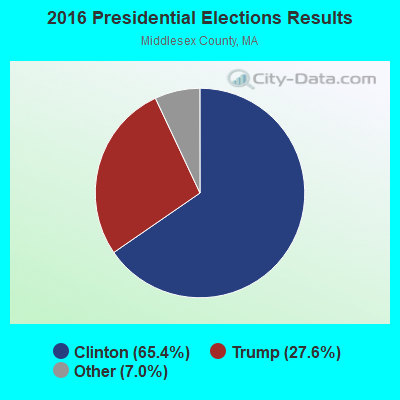
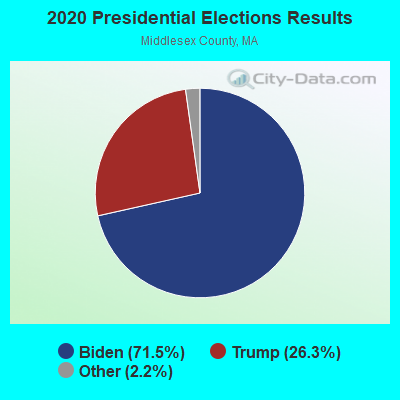
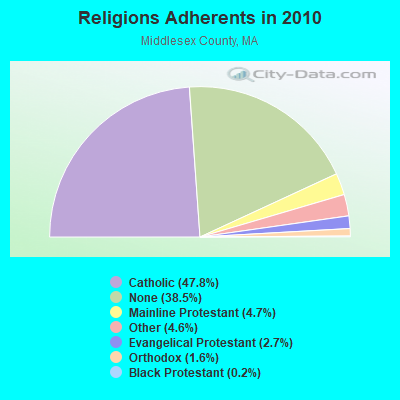
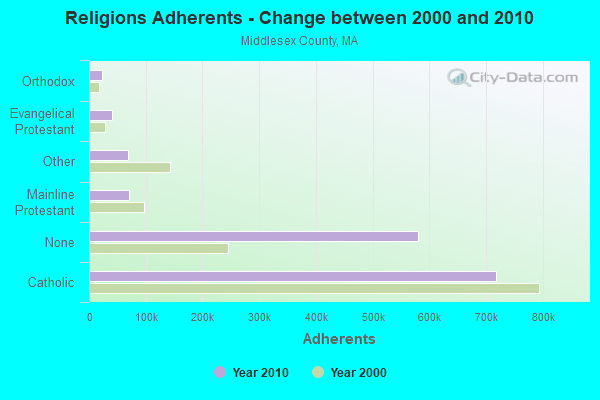
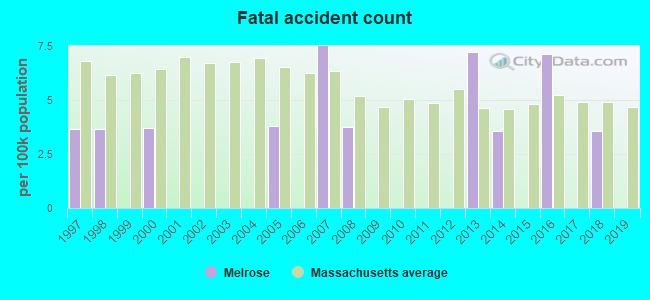
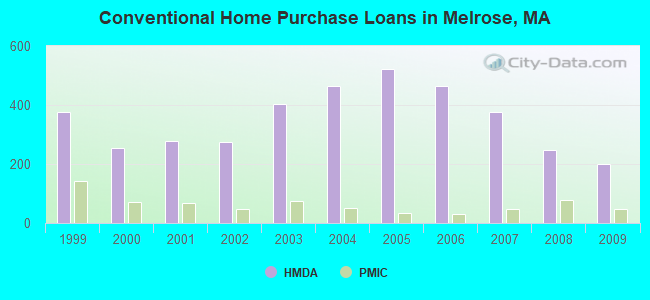
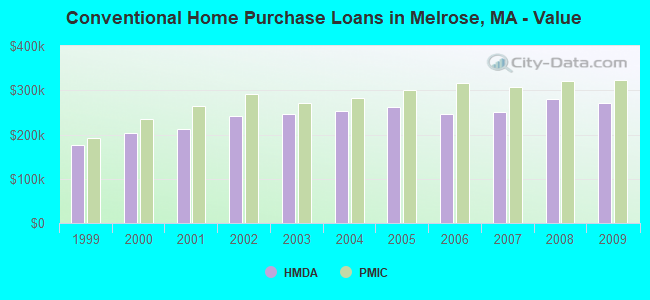
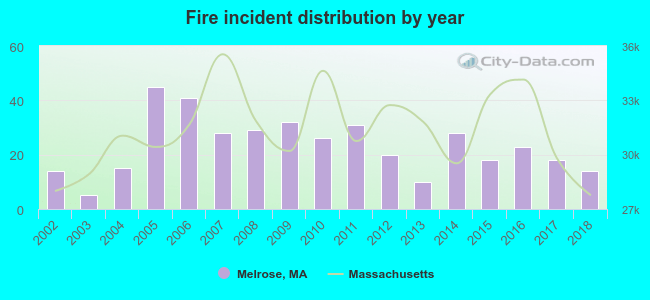 Based on the data from the years 2002 - 2018 the average number of fires per year is 23. The highest number of fire incidents - 45 took place in 2005, and the least - 5 in 2003. The data has a constant trend.
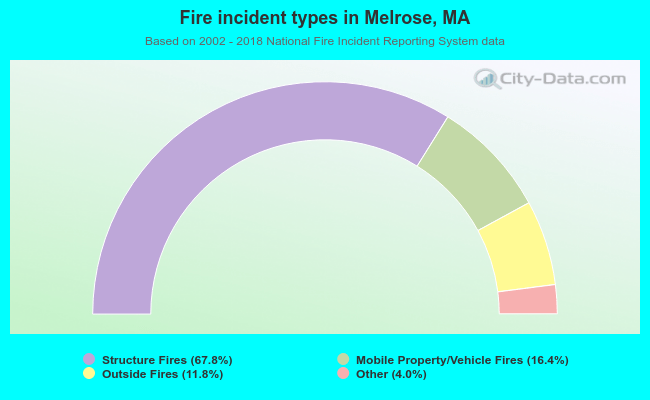 When looking into fire subcategories, the most reports belonged to: Structure Fires (67.8%), and Mobile Property/Vehicle Fires (16.4%).