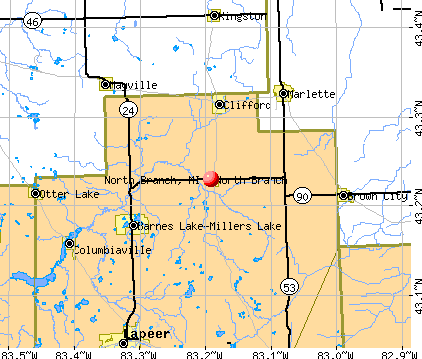
North Branch, Michigan
North Branch: Family Farm - One of Many
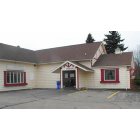
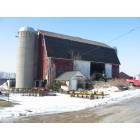
North Branch: 3960 Huron Street is the new location of the North Branch Farm and Flea Market
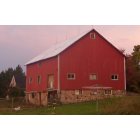
North Branch: Old barns dot the surrounding area on working farms.
- add
your
Submit your own pictures of this village and show them to the world
- OSM Map
- General Map
- Google Map
- MSN Map
Population change since 2000: +7.4%
 |
| Males: 500 | |
| Females: 603 |
| Median resident age: | 37.8 years |
| Michigan median age: | 40.3 years |
Zip codes: 48461.
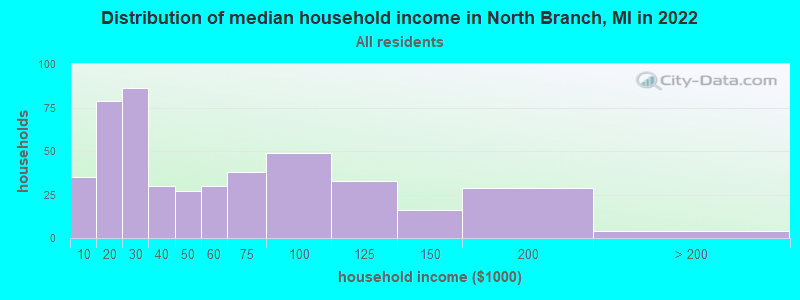
| North Branch: | $39,380 |
| MI: | $66,986 |
Estimated per capita income in 2022: $29,426 (it was $15,782 in 2000)
North Branch village income, earnings, and wages data
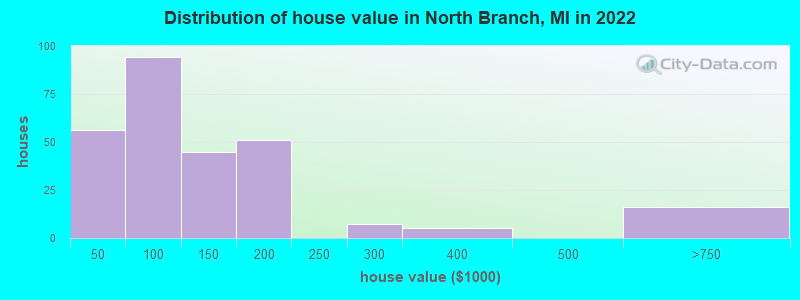
Estimated median house or condo value in 2022: $117,702 (it was $94,300 in 2000)
| North Branch: | $117,702 |
| MI: | $224,400 |
Mean prices in 2022: all housing units: $138,753; detached houses: $148,306; mobile homes: $22,337
Median gross rent in 2022: $790.
(22.6% for White Non-Hispanic residents, 18.8% for Hispanic or Latino residents, 10.3% for two or more races residents)
Detailed information about poverty and poor residents in North Branch, MI
Compare current foreclosures near North Branch, MI:
| Photo | Address | Area | Beds / Baths | Price | Details |
|---|---|---|---|---|---|

|
#1
Willis Rd
North Branch, MI 48461
|
- sq. feet
|
- baths - beds |
show details | |

|
#2
Cedar Creek Rd
North Branch, MI 48461
|
- sq. feet
|
- baths - beds |
show details | |

|
#3
Cedar Creek Rd
North Branch, MI 48461
|
- sq. feet
|
- baths - beds |
show details | |

|
#4
Huron St
North Branch, MI 48461
|
- sq. feet
|
- baths - beds |
show details | |

|
#5
Fish Lake Rd
North Branch, MI 48461
|
- sq. feet
|
- baths - beds |
show details | |

|
#6
Jefferson Rd
North Branch, MI 48461
|
- sq. feet
|
- baths - beds |
show details | |

|
#7
Tozer Rd
North Branch, MI 48461
|
- sq. feet
|
- baths - beds |
show details | |

|
#8
Oak Grove Rd
North Branch, MI 48461
|
- sq. feet
|
- baths - beds |
show details | |

|
#9
N Branch Rd
North Branch, MI 48461
|
- sq. feet
|
- baths - beds |
show details | |

|
#10
Snoblin Rd
North Branch, MI 48461
|
- sq. feet
|
- baths - beds |
show details |
| Photo | Address | Area | Beds / Baths | Price | Details |
|---|---|---|---|---|---|

|
#11
Gravel Creek Rd
North Branch, MI 48461
|
- sq. feet
|
- baths - beds |
show details | |

|
#12
Gravel Creek Rd
North Branch, MI 48461
|
- sq. feet
|
- baths - beds |
show details | |

|
#13
Old State Rd
North Branch, MI 48461
|
- sq. feet
|
- baths - beds |
show details | |

|
#14
Opal Ln
North Branch, MI 48461
|
- sq. feet
|
- baths - beds |
show details | |

|
#15
Burnside Rd
North Branch, MI 48461
|
- sq. feet
|
- baths - beds |
show details | |

|
#16
N Main St
Lapeer, MI 48446
|
1,700 sq. feet
|
1 baths 3 beds |
show details | |

|
#17
Slater Rd
Lapeer, MI 48446
|
1,436 sq. feet
|
2 baths 3 beds |
show details | |

|
#18
N Van Dyke Rd
Imlay City, MI 48444
|
1,149 sq. feet
|
2 baths 3 beds |
show details | |

|
#19
Central St
Columbiaville, MI 48421
|
1,729 sq. feet
|
2 baths 5 beds |
show details | |

|
#20
Adams St
Lapeer, MI 48446
|
1,100 sq. feet
|
1 baths 3 beds |
show details |
| Photo | Address | Area | Beds / Baths | Price | Details |
|---|---|---|---|---|---|

|
#21
Otter Lake Rd
Otter Lake, MI 48464
|
1,036 sq. feet
|
1 baths 3 beds |
show details | |

|
#22
Mckillop Rd
Clifford, MI 48727
|
1,404 sq. feet
|
2 baths 3 beds |
show details | |

|
#23
E Norway Lake Rd
Lapeer, MI 48446
|
2,320 sq. feet
|
2 baths 3 beds |
show details | |

|
#24
W Capac Rd
Imlay City, MI 48444
|
- sq. feet
|
1 baths 3 beds |
show details | |

|
#25
Seabury Rd
Imlay City, MI 48444
|
- sq. feet
|
2 baths 3 beds |
show details | |

|
#26
W 4th St
Imlay City, MI 48444
|
- sq. feet
|
2 baths 4 beds |
show details | |

|
#27
Maple Dr
Columbiaville, MI 48421
|
- sq. feet
|
2 baths 3 beds |
show details | |

|
#28
W Burnside Rd
Fostoria, MI 48435
|
- sq. feet
|
2 baths 3 beds |
show details | |

|
#29
Northview Dr
Lapeer, MI 48446
|
- sq. feet
|
- baths - beds |
show details | |

|
#30
Golfside Dr
Lapeer, MI 48446
|
- sq. feet
|
- baths - beds |
show details |
| Photo | Address | Area | Beds / Baths | Price | Details |
|---|---|---|---|---|---|

|
#31
Jeddo Rd
Brown City, MI 48416
|
- sq. feet
|
- baths - beds |
show details | |

|
#32
W Main St
Mayville, MI 48744
|
- sq. feet
|
- baths - beds |
show details | |

|
#33
Riverview Dr
Lapeer, MI 48446
|
- sq. feet
|
- baths - beds |
show details | |

|
#34
Rustic Dr, Apt 204
Lapeer, MI 48446
|
- sq. feet
|
- baths - beds |
show details | |

|
#35
Central St # B
Columbiaville, MI 48421
|
- sq. feet
|
- baths - beds |
show details | |

|
#36
Dewey St # 911
Lapeer, MI 48446
|
- sq. feet
|
- baths - beds |
show details | |

|
#37
Suzanne Dr Apt 33
Lapeer, MI 48446
|
- sq. feet
|
- baths - beds |
show details | |

|
#38
Norman Rd
Yale, MI 48097
|
- sq. feet
|
- baths - beds |
show details | |

|
#39
N Saginaw St Apt 404
Lapeer, MI 48446
|
- sq. feet
|
- baths - beds |
show details | |

|
#40
Trend St # C
Mayville, MI 48744
|
- sq. feet
|
- baths - beds |
show details |
| Photo | Address | Area | Beds / Baths | Price | Details |
|---|---|---|---|---|---|

|
#41
Maple Grove Rd Apt 19
Lapeer, MI 48446
|
- sq. feet
|
- baths - beds |
show details | |

|
#42
Gray Rd
Lapeer, MI 48446
|
- sq. feet
|
- baths - beds |
show details | |

|
#43
Bittersweet Dr
Columbiaville, MI 48421
|
- sq. feet
|
- baths - beds |
show details | |

|
#44
Raleigh Ave Apt 14
Lapeer, MI 48446
|
- sq. feet
|
- baths - beds |
show details | |

|
#45
Bowers Rd
Imlay City, MI 48444
|
- sq. feet
|
- baths - beds |
show details | |

|
#46
Sherwood Dr
Lapeer, MI 48446
|
- sq. feet
|
- baths - beds |
show details | |

|
#47
Snover Rd
Silverwood, MI 48760
|
- sq. feet
|
- baths - beds |
show details | |

|
#48
Fostoria Rd
Fostoria, MI 48435
|
- sq. feet
|
- baths - beds |
show details | |

|
#49
White Creek Rd
Kingston, MI 48741
|
- sq. feet
|
- baths - beds |
show details | |

|
Check over 1 million property listings on Foreclosure.com!
|
browse all offers | |||


- 93793.7%White alone
- 383.8%Two or more races
- 161.6%Hispanic
- 20.2%Black alone
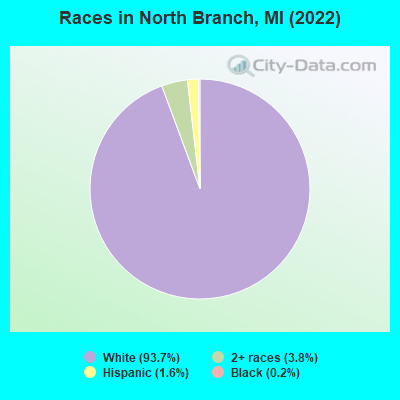
Races in North Branch detailed stats: ancestries, foreign born residents, place of birth
According to our research of Michigan and other state lists, there were 25 registered sex offenders living in North Branch, Michigan as of April 27, 2024.
The ratio of all residents to sex offenders in North Branch is 43 to 1.
 Recent articles from our blog. Our writers, many of them Ph.D. graduates or candidates, create easy-to-read articles on a wide variety of topics.

 | Interracial couple thinking about moving to Lapeer or Bay City Michigan (13 replies) |
| What I Miss Most About Michigan (39 replies) |
| The Michigan Accent (358 replies) |
| Why I think Metro Detroit is Great (53 replies) |
| north branch salvage sisters (3 replies) |
| Where do you reside? (197 replies) |
Latest news from North Branch, MI collected exclusively by city-data.com from local newspapers, TV, and radio stations
Ancestries: German (29.4%), English (21.5%), Polish (14.0%), American (8.1%), Irish (6.1%), French (2.6%).
Current Local Time: EST time zone
Elevation: 810 feet
Land area: 1.28 square miles.
Population density: 864 people per square mile (low).
9 residents are foreign born
| This village: | 0.9% |
| Michigan: | 6.9% |
Median real estate property taxes paid for housing units with mortgages in 2022: $1,629 (1.3%)
Median real estate property taxes paid for housing units with no mortgage in 2022: $1,592 (1.3%)
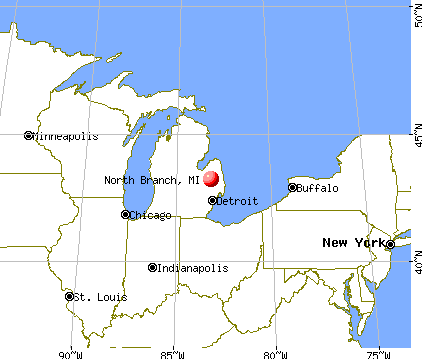
Nearest city with pop. 50,000+: Flint, MI  (29.0 miles , pop. 124,943).
Nearest city with pop. 200,000+: Detroit, MI (58.5 miles , pop. 951,270).
Nearest city with pop. 1,000,000+: Chicago, IL (248.0 miles , pop. 2,896,016).
Nearest cities:
), ), ), )Latitude: 43.23 N, Longitude: 83.19 W
Area code: 810
| Here: | 4.2% |
| Michigan: | 3.5% |
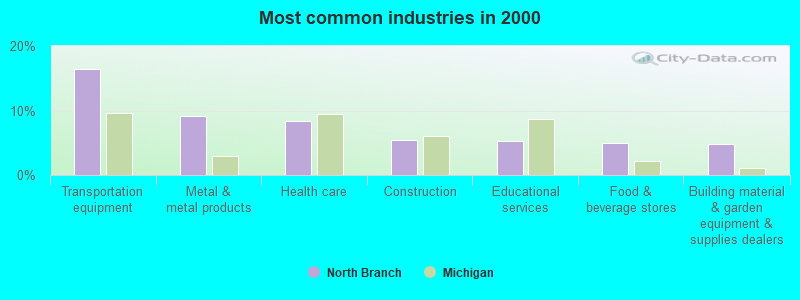
- Transportation equipment (16.4%)
- Metal & metal products (9.1%)
- Health care (8.4%)
- Construction (5.5%)
- Educational services (5.2%)
- Food & beverage stores (5.0%)
- Building material & garden equipment & supplies dealers (4.8%)
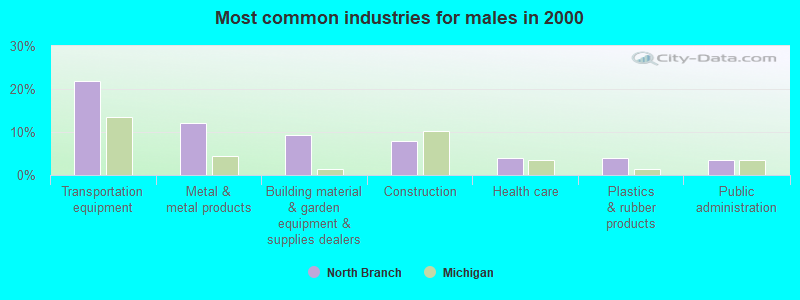
- Transportation equipment (21.8%)
- Metal & metal products (12.0%)
- Building material & garden equipment & supplies dealers (9.3%)
- Construction (8.0%)
- Health care (4.0%)
- Plastics & rubber products (4.0%)
- Public administration (3.6%)
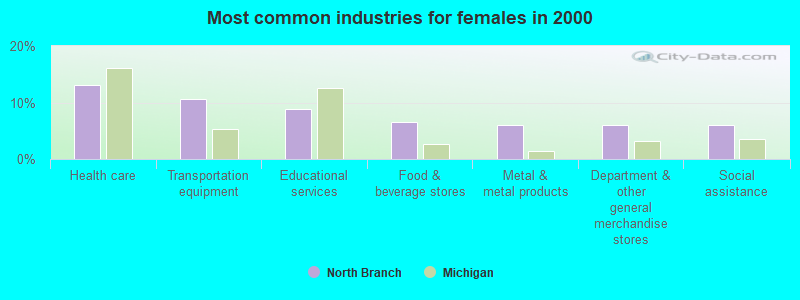
- Health care (13.0%)
- Transportation equipment (10.7%)
- Educational services (8.8%)
- Food & beverage stores (6.5%)
- Metal & metal products (6.0%)
- Department & other general merchandise stores (6.0%)
- Social assistance (6.0%)
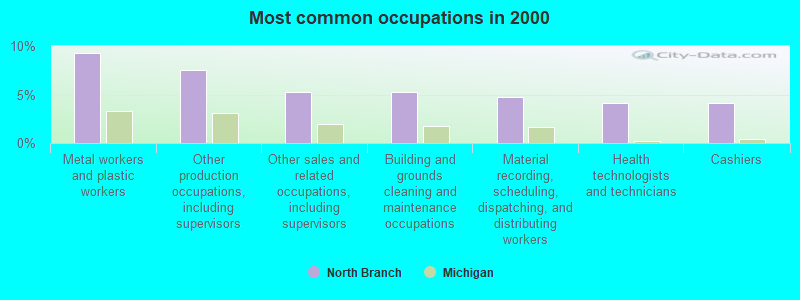
- Metal workers and plastic workers (9.3%)
- Other production occupations, including supervisors (7.5%)
- Other sales and related occupations, including supervisors (5.2%)
- Building and grounds cleaning and maintenance occupations (5.2%)
- Material recording, scheduling, dispatching, and distributing workers (4.8%)
- Health technologists and technicians (4.1%)
- Cashiers (4.1%)
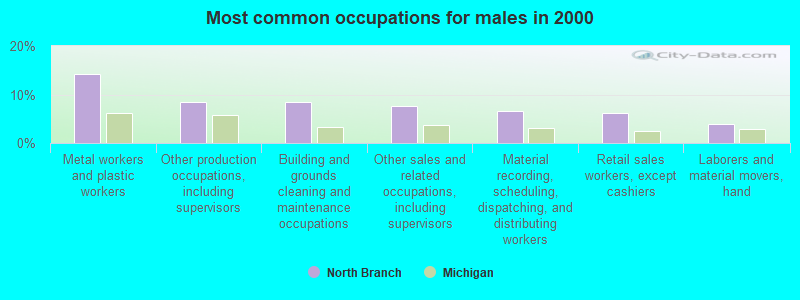
- Metal workers and plastic workers (14.2%)
- Other production occupations, including supervisors (8.4%)
- Building and grounds cleaning and maintenance occupations (8.4%)
- Other sales and related occupations, including supervisors (7.6%)
- Material recording, scheduling, dispatching, and distributing workers (6.7%)
- Retail sales workers, except cashiers (6.2%)
- Laborers and material movers, hand (4.0%)
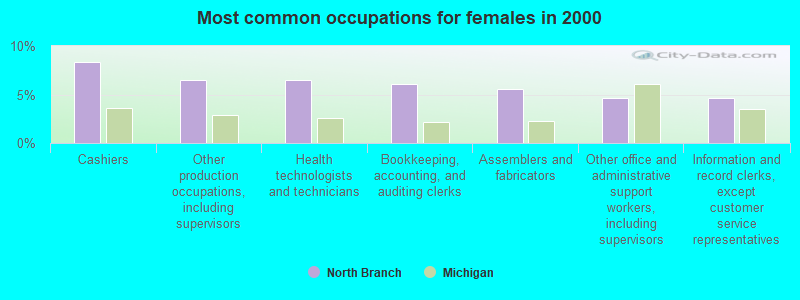
- Cashiers (8.4%)
- Other production occupations, including supervisors (6.5%)
- Health technologists and technicians (6.5%)
- Bookkeeping, accounting, and auditing clerks (6.0%)
- Assemblers and fabricators (5.6%)
- Other office and administrative support workers, including supervisors (4.7%)
- Information and record clerks, except customer service representatives (4.7%)
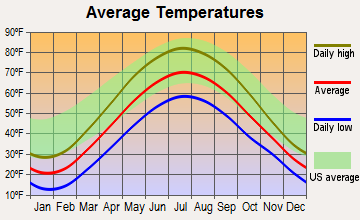
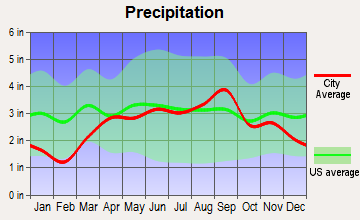
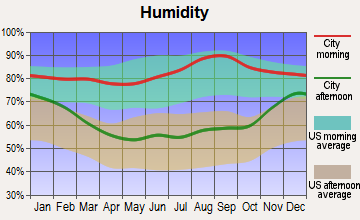
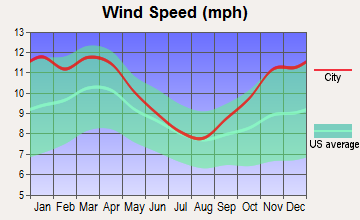
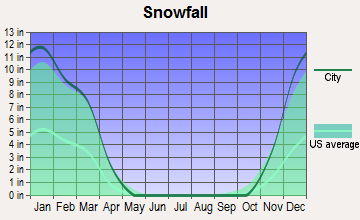
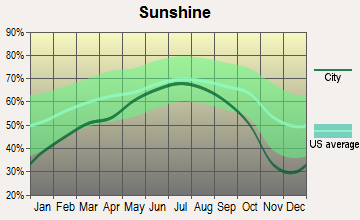
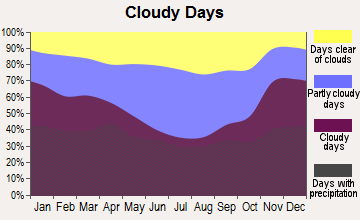
Average climate in North Branch, Michigan
Based on data reported by over 4,000 weather stations
|
|

(lower is better)
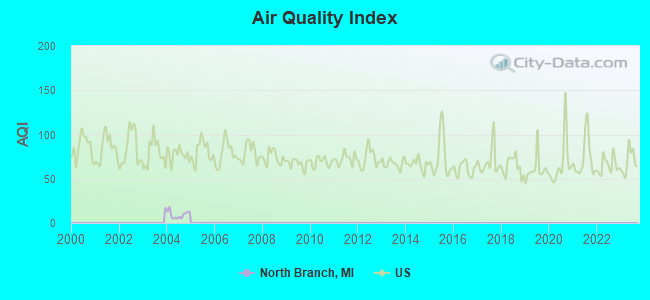
Air Quality Index (AQI) level in 2004 was 9.30. This is significantly better than average.
| City: | 9.30 |
| U.S.: | 72.56 |
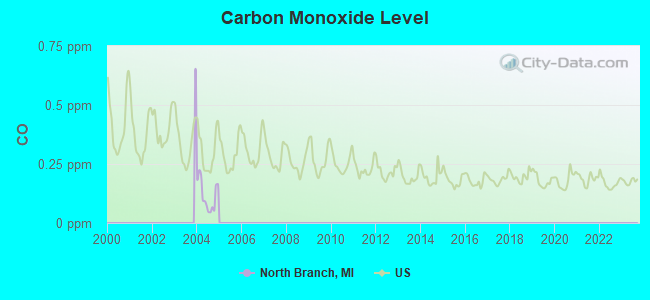
Carbon Monoxide (CO) [ppm] level in 2004 was 0.117. This is significantly better than average. Closest monitor was 14.3 miles away from the city center.
| City: | 0.117 |
| U.S.: | 0.251 |
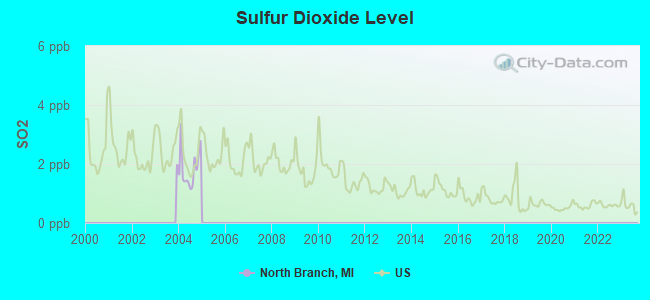
Sulfur Dioxide (SO2) [ppb] level in 2004 was 1.85. This is worse than average. Closest monitor was 13.3 miles away from the city center.
| City: | 1.85 |
| U.S.: | 1.51 |
Tornado activity:
North Branch-area historical tornado activity is near Michigan state average. It is 9% greater than the overall U.S. average.
On 6/8/1953, a category F5 (max. wind speeds 261-318 mph) tornado 12.2 miles away from the North Branch village center killed 116 people and injured 844 people and caused between $5,000,000 and $50,000,000 in damages.
On 6/8/1953, a category F4 (max. wind speeds 207-260 mph) tornado 5.6 miles away from the village center injured 23 people and caused between $50,000 and $500,000 in damages.
Earthquake activity:
North Branch-area historical earthquake activity is significantly above Michigan state average. It is 56% smaller than the overall U.S. average.On 9/25/1998 at 19:52:52, a magnitude 5.2 (4.8 MB, 4.3 MS, 5.2 LG, 4.5 MW, Depth: 3.1 mi, Class: Moderate, Intensity: VI - VII) earthquake occurred 186.7 miles away from the city center
On 1/31/1986 at 16:46:43, a magnitude 5.0 (5.0 MB) earthquake occurred 153.1 miles away from North Branch center
On 5/2/2015 at 16:23:07, a magnitude 4.2 (4.2 MW, Depth: 2.8 mi, Class: Light, Intensity: IV - V) earthquake occurred 132.8 miles away from the city center
On 7/12/1986 at 08:19:37, a magnitude 4.5 (4.5 MB) earthquake occurred 195.9 miles away from North Branch center
On 7/27/1980 at 18:52:21, a magnitude 5.2 (5.1 MB, 4.7 MS, 5.0 UK, 5.2 UK) earthquake occurred 349.8 miles away from the city center
On 6/10/2019 at 14:50:45, a magnitude 4.0 (4.0 MB, Depth: 1.2 mi) earthquake occurred 139.1 miles away from North Branch center
Magnitude types: regional Lg-wave magnitude (LG), body-wave magnitude (MB), surface-wave magnitude (MS), moment magnitude (MW)
Natural disasters:
The number of natural disasters in Lapeer County (10) is smaller than the US average (15).Major Disasters (Presidential) Declared: 5
Emergencies Declared: 4
Causes of natural disasters: Floods: 5, Storms: 4, Blizzard: 1, Hurricane: 1, Power Outage: 1, Snowstorm: 1, Tornado: 1, Wind: 1, Winter Storm: 1, Other: 1 (Note: some incidents may be assigned to more than one category).
Hospitals and medical centers near North Branch:
- MARLETTE COMMUNITY HOSPITAL (Hospital, about 10 miles away; MARLETTE, MI)
- MARLETTE COMM HOSP LTCU (Nursing Home, about 10 miles away; MARLETTE, MI)
- FISHER SENIOR CARE AND REHAB (Nursing Home, about 11 miles away; MAYVILLE, MI)
- RRC - LAPEER (Dialysis Facility, about 14 miles away; LAPEER, MI)
- MCLAREN LAPEER REGION Acute Care Hospitals (about 14 miles away; LAPEER, MI)
- LAPEER REGIONAL EXTENDED CARE (Nursing Home, about 14 miles away; LAPEER, MI)
- LAPEER COUNTY MEDICAL CARE FAC (Nursing Home, about 14 miles away; LAPEER, MI)
Colleges/universities with over 2000 students nearest to North Branch:
- Mott Community College (about 29 miles; Flint, MI; Full-time enrollment: 7,394)
- University of Michigan-Flint (about 30 miles; Flint, MI; FT enrollment: 6,284)
- Kettering University (about 31 miles; Flint, MI; FT enrollment: 2,044)
- Baker College Center for Graduate Studies (about 31 miles; Flint, MI; FT enrollment: 3,405)
- Baker College of Flint (about 31 miles; Flint, MI; FT enrollment: 3,877)
- Oakland University (about 39 miles; Rochester Hills, MI; FT enrollment: 16,449)
- Baker College of Auburn Hills (about 40 miles; Auburn Hills, MI; FT enrollment: 2,284)
Public high schools in North Branch:
- NORTH BRANCH HIGH SCHOOL (Students: 894, Location: 6598 BRUSH ST, Grades: 9-12)
- QUEST HIGH SCHOOL (Students: 57, Location: 6655 JEFFERSON RD, Grades: 10-12)
Public elementary/middle schools in North Branch:
- NORTH BRANCH ELEMENTARY SCHOOL (Students: 721, Location: 4055 ELM CREEK RD, Grades: KG-4)
- RUTH FOX ELEMENTARY SCHOOL (Students: 599, Location: 6570 BRUSH ST, Grades: 5-6)
- NORTH BRANCH MIDDLE SCHOOL (Students: 438, Location: 6600 BRUSH ST, Grades: 7-8)
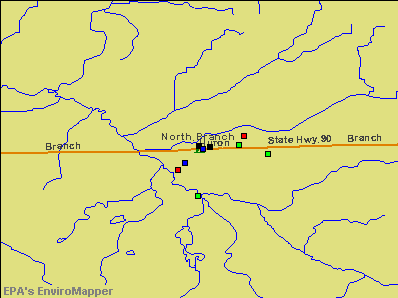
Points of interest:
Notable locations in North Branch: North Branch Library (A), North Branch Police Department (B). Display/hide their locations on the map
Churches in North Branch include: Saint James Lutheran Church (A), Methodist Church (B), Saints Peter and Paul Catholic Church (C), First Baptist Church (D), North Branch Wesleyan Church (E). Display/hide their locations on the map
Parks in North Branch include: North Branch Memorial Park (1), Pioneer Bank Historical Marker (2). Display/hide their locations on the map
Drinking water stations with addresses in North Branch and their reported violations in the past:
WASHAKIE GOLF & R.V. RESORT (Population served: 300, Groundwater):Past monitoring violations:NORTH BRANCH WESLEYAN CHURCH (Population served: 100, Groundwater):
- One routine major monitoring violation
Past health violations:ST. JAMES EVANGELICAL LUTH CHU (Population served: 75, Groundwater):
- MCL, Average - Between JAN-01-2008 and JAN-01-2018, Contaminant: Arsenic. Follow-up actions: St Public Notif received (JAN-31-2008), St BCA signed (JAN-31-2008), State No Longer Subject to Rule (FEB-06-2013)
Past health violations:KINGS MILL MARKET (Population served: 50, Groundwater):
- MCL, Monthly (TCR) - In JUL-2013, Contaminant: Coliform. Follow-up actions: St Public Notif received (JUL-12-2013), St Violation/Reminder Notice (JUL-12-2013), St Tech Assistance Visit (3 times from JUL-12-2013 to JUL-18-2013), St Compliance achieved (JUL-24-2013)
Past monitoring violations:SWEET WEDDING CHAPEL (Population served: 25, Groundwater):
- 2 routine major monitoring violations
Past monitoring violations:
- One routine major monitoring violation
Drinking water stations with addresses in North Branch that have no violations reported:
- SUTTER'S RECREATION AREA (Population served: 800, Primary Water Source Type: Groundwater)
- M & N MARKET (Population served: 300, Primary Water Source Type: Groundwater)
- NEW LIFE IN CHRIST LUTH CH (Population served: 100, Primary Water Source Type: Groundwater)
- WHISTLE STOP PARTY STORE (Population served: 100, Primary Water Source Type: Groundwater)
- ST MARYS (Population served: 75, Primary Water Source Type: Groundwater)
- SAWDUST CORNERS BAR (Population served: 30, Primary Water Source Type: Groundwater)
- MCNEES MEATS (Population served: 25, Primary Water Source Type: Groundwater)
| This village: | 2.5 people |
| Michigan: | 2.5 people |
| This village: | 62.9% |
| Whole state: | 66.0% |
| This village: | 9.6% |
| Whole state: | 6.4% |
Likely homosexual households (counted as self-reported same-sex unmarried-partner households)
- Lesbian couples: 0.5% of all households
- Gay men: 0.2% of all households
4 people in other group homes in 2000
Banks with branches in North Branch (2011 data):
- Tri-County Bank: North Branch Office Branch at 6681 Bernie Kohler Drive, branch established on 2004/05/24; North Branch Branch at 6681 Bernie Kohler Drive, branch established on 1995/06/29. Info updated 2006/11/03: Bank assets: $205.3 mil, Deposits: $182.2 mil, headquarters in Brown City, MI, positive income, Agricultural Specialization, 9 total offices, Holding Company: Tri-County Bancorp, Inc.
- Independent Bank: North Branch at 4046 Huron Street, branch established on 1994/04/30; North Branch Drive Up at 3765 Huron Street, branch established on 1996/03/04. Info updated 2010/10/20: Bank assets: $2,304.7 mil, Deposits: $2,092.2 mil, headquarters in Ionia, MI, negative income in the last year, Commercial Lending Specialization, 107 total offices, Holding Company: Independent Bank Corporation
- Lapeer County Bank & Trust Co.: Deerfield Branch at 6002-B North Lapeer Road, branch established on 1993/05/30. Info updated 2006/11/03: Bank assets: $300.4 mil, Deposits: $270.1 mil, headquarters in Lapeer, MI, positive income, Commercial Lending Specialization, 7 total offices, Holding Company: County Bank Corp
For population 15 years and over in North Branch:
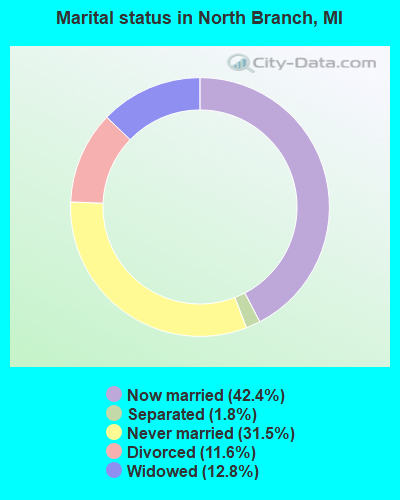
- Never married: 31.5%
- Now married: 42.4%
- Separated: 1.8%
- Widowed: 12.8%
- Divorced: 11.6%
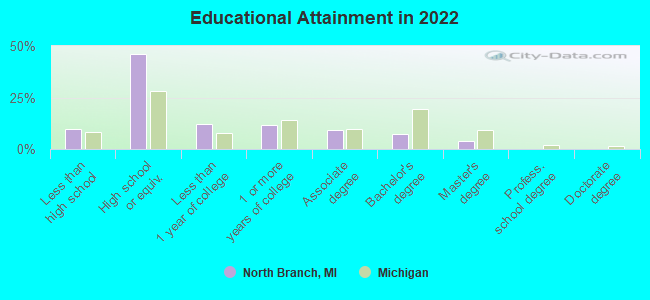
For population 25 years and over in North Branch:
- High school or higher: 88.3%
- Bachelor's degree or higher: 10.4%
- Graduate or professional degree: 3.4%
- Unemployed: 6.4%
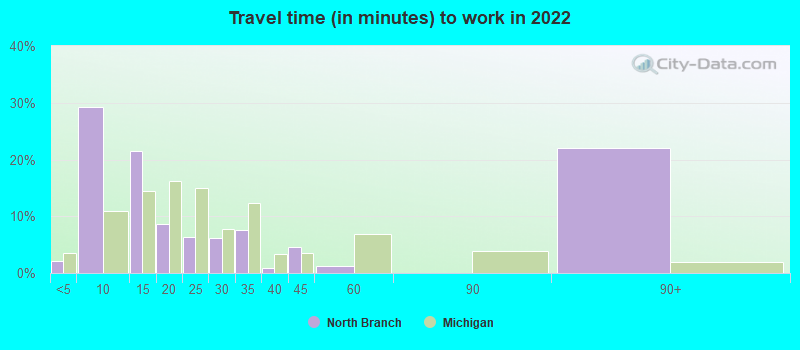
- Mean travel time to work (commute): 22.2 minutes
| Here: | 8.1 |
| Michigan average: | 11.0 |
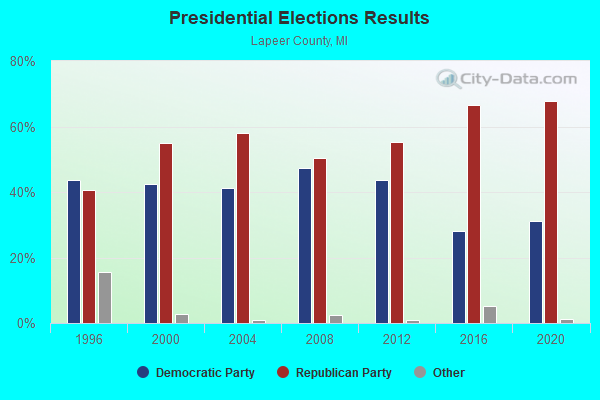
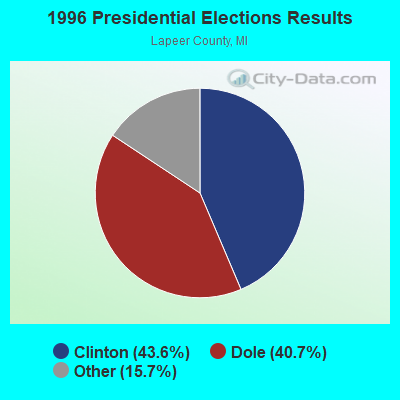
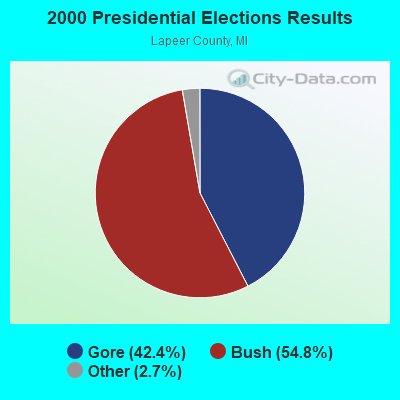
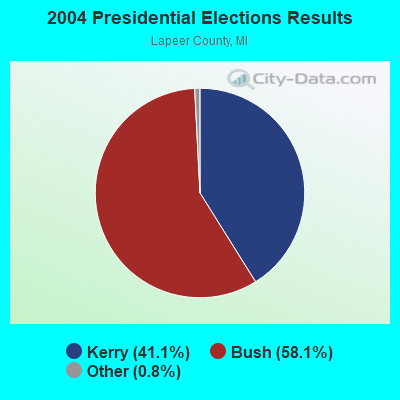
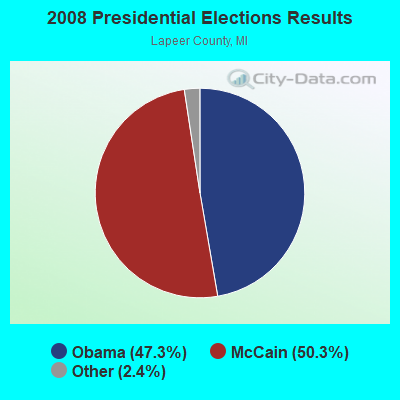
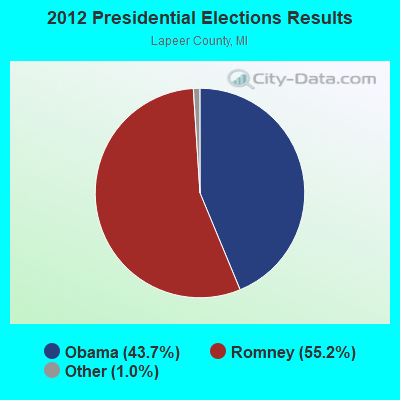
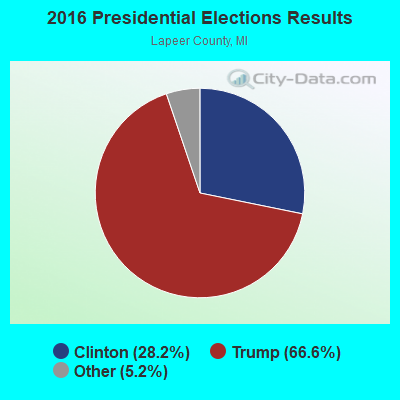
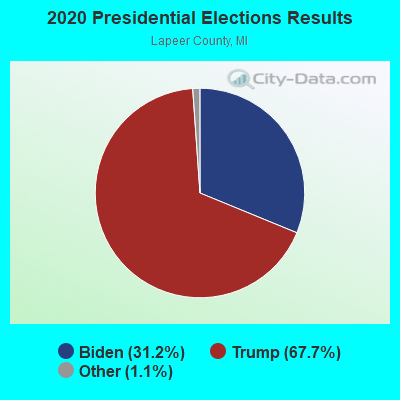
Graphs represent county-level data. Detailed 2008 Election Results
Religion statistics for North Branch, MI (based on Lapeer County data)
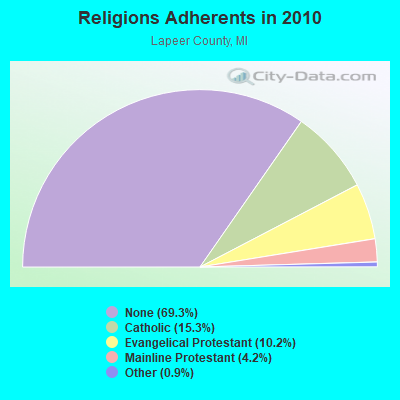
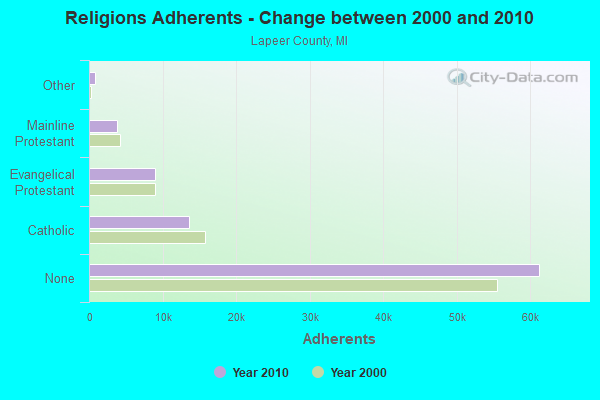
| Religion | Adherents | Congregations |
|---|---|---|
| Catholic | 13,538 | 5 |
| Evangelical Protestant | 8,972 | 49 |
| Mainline Protestant | 3,741 | 19 |
| Other | 839 | 6 |
| None | 61,229 | - |
Food Environment Statistics:
| Here: | 1.64 / 10,000 pop. |
| State: | 2.34 / 10,000 pop. |
| Lapeer County: | 0.11 / 10,000 pop. |
| Michigan: | 0.18 / 10,000 pop. |
| This county: | 1.74 / 10,000 pop. |
| Michigan: | 1.52 / 10,000 pop. |
| This county: | 2.83 / 10,000 pop. |
| State: | 2.99 / 10,000 pop. |
| This county: | 5.12 / 10,000 pop. |
| State: | 6.80 / 10,000 pop. |
| Lapeer County: | 9.1% |
| Michigan: | 9.7% |
| This county: | 30.1% |
| Michigan: | 29.7% |
| Here: | 15.3% |
| Michigan: | 13.4% |
Health and Nutrition:
| Here: | 46.8% |
| Michigan: | 50.3% |
| This city: | 41.0% |
| Michigan: | 47.9% |
| North Branch: | 28.2 |
| Michigan: | 28.7 |
| This city: | 20.0% |
| State: | 20.6% |
| Here: | 10.8% |
| Michigan: | 10.4% |
| North Branch: | 6.8 |
| Michigan: | 6.8 |
| This city: | 32.2% |
| Michigan: | 34.1% |
| North Branch: | 53.2% |
| Michigan: | 57.0% |
| North Branch: | 77.1% |
| State: | 79.6% |
More about Health and Nutrition of North Branch, MI Residents
| Local government employment and payroll (March 2022) | |||||
| Function | Full-time employees | Monthly full-time payroll | Average yearly full-time wage | Part-time employees | Monthly part-time payroll |
|---|---|---|---|---|---|
| Sewerage | 1 | $3,603 | $43,236 | 0 | $0 |
| Streets and Highways | 1 | $4,243 | $50,916 | 0 | $0 |
| Water Supply | 1 | $3,782 | $45,384 | 0 | $0 |
| Other Government Administration | 1 | $4,818 | $57,816 | 6 | $471 |
| Financial Administration | 0 | $0 | 1 | $1,116 | |
| Other and Unallocable | 0 | $0 | 1 | $178 | |
| Totals for Government | 4 | $16,445 | $49,335 | 8 | $1,765 |
North Branch government finances - Expenditure in 2017 (per resident):
- Current Operations - Regular Highways: $286,000 ($259.29)
Sewerage: $216,000 ($195.83)
Police Protection: $131,000 ($118.77)
General - Other: $99,000 ($89.76)
Central Staff Services: $68,000 ($61.65)
Solid Waste Management: $68,000 ($61.65)
Financial Administration: $20,000 ($18.13)
General Public Buildings: $18,000 ($16.32)
Parks and Recreation: $5,000 ($4.53)
Protective Inspection and Regulation - Other: $1,000 ($0.91)
- Intergovernmental to Local - Other - Police Protection: $132,000 ($119.67)
- Other Capital Outlay - Regular Highways: $39,000 ($35.36)
General - Other: $4,000 ($3.63)
- Total Salaries and Wages: $185,000 ($167.72)
- Water Utilities - Interest on Debt: $13,000 ($11.79)
North Branch government finances - Debt in 2017 (per resident):
- Long Term Debt - Beginning Outstanding - Unspecified Public Purpose: $530,000 ($480.51)
Outstanding Unspecified Public Purpose: $470,000 ($426.11)
Retired Unspecified Public Purpose: $60,000 ($54.40)
North Branch government finances - Cash and Securities in 2017 (per resident):
- Other Funds - Cash and Securities: $1,545,000 ($1400.73)
Businesses in North Branch, MI
- U-Haul: 1
- UPS: 1
Strongest AM radio stations in North Branch:
- WWJ (950 AM; 50 kW; DETROIT, MI; Owner: INFINITY BROADCASTING OPERATIONS, INC.)
- WOAP (1080 AM; 50 kW; OWOSSO, MI)
- WLSP (1530 AM; daytime; 5 kW; LAPEER, MI; Owner: REGENT BROADCASTING OF FLINT INC.)
- WXYT (1270 AM; 50 kW; DETROIT, MI; Owner: INFINITY BROADCASTING CORP. OF DETROIT)
- WJR (760 AM; 50 kW; DETROIT, MI; Owner: ABC, INC.)
- WFDF (910 AM; 50 kW; FLINT, MI; Owner: ABC, INC.)
- WCHB (1200 AM; 50 kW; TAYLOR, MI; Owner: RADIO ONE OF DETROIT, LLC)
- WDFN (1130 AM; 50 kW; DETROIT, MI; Owner: AMFM RADIO LICENSES, L.L.C.)
- WMPC (1230 AM; 1 kW; LAPEER, MI; Owner: THE CALVARY BIBLE CHURCH OF LAPEER)
- WSGW (790 AM; 5 kW; SAGINAW, MI; Owner: NM LICENSING LLC)
- WTRX (1330 AM; 5 kW; FLINT, MI; Owner: CITADEL BROADCASTING COMPANY)
- WFNT (1470 AM; 5 kW; FLINT, MI)
- WMIC (660 AM; daytime; 1 kW; SANDUSKY, MI; Owner: SANILAC BROADCASTING COMPANY)
Strongest FM radio stations in North Branch:
- WBGV (92.5 FM; MARLETTE, MI; Owner: GB BROADCASTING COMPANY)
- WHNN (96.1 FM; BAY CITY, MI; Owner: CITADEL BROADCASTING COMPANY)
- WQUS (103.1 FM; LAPEER, MI; Owner: REGENT BROADCASTING OF FLINT INC.)
- WWBN (101.5 FM; TUSCOLA, MI; Owner: REGENT BROADCASTING OF FLINT, INC.)
- WHYT (89.1 FM; IMLAY CITY, MI; Owner: MICHIGAN COMMUNITY RADIO)
- WOWE (98.9 FM; VASSAR, MI; Owner: PRAESTANTIA BROADCASTING, INC.)
- WRCL (93.7 FM; FRANKENMUTH, MI; Owner: REGENT BROADCASTING OF FLINT, INC.)
- WIOG (102.5 FM; BAY CITY, MI; Owner: CITADEL BROADCASTING COMPANY)
- WIDL (92.1 FM; CARO, MI; Owner: EDWARDS COMMUNICATIONS LC)
- WFUM-FM (91.1 FM; FLINT, MI; Owner: THE REGENTS OF THE UNIV. OF MICHIGAN)
- WFBE (95.1 FM; FLINT, MI; Owner: CITADEL BROADCASTING COMPANY)
- WTGV-FM (97.7 FM; SANDUSKY, MI; Owner: SANILAC BROADCASTING COMPANY)
- WNFR (90.7 FM; SANDUSKY, MI; Owner: ROSS BIBLE CHURCH)
TV broadcast stations around North Branch:
- WEYI-TV (Channel 25; SAGINAW, MI; Owner: WEYI BROADCASTING, LLC)
- W52CU (Channel 52; PINCONNING, MI; Owner: NTN/SAGINAW, INC.)
- WFUM (Channel 28; FLINT, MI; Owner: UNIVERSITY OF MICHIGAN)
- WNEM-TV (Channel 5; BAY CITY, MI; Owner: MEREDITH CORPORATION)
- WXON-LP (Channel 54; FLINT, MI; Owner: P & P CABLE HOLDINGS, L.L.C.)
- WDCP-TV (Channel 35; BAD AXE, MI; Owner: DELTA COLLEGE)
- W09CK (Channel 9; FLINT, MI; Owner: P & P CABLE HOLDINGS, L.L.C.)
- WSMH (Channel 66; FLINT, MI; Owner: WSMH LICENSEE, LLC)
- WAQP (Channel 49; SAGINAW, MI; Owner: TCT OF MICHIGAN, INC.)
- WJRT-TV (Channel 12; FLINT, MI; Owner: FLINT LICENSE SUBSIDIARY CORP.)
North Branch fatal accident list:
Apr 21, 1994 03:50 PM, Brush St, Vehicles: 1, Persons: 2, Pedestrians: 1, Fatalities: 1
- National Bridge Inventory (NBI) Statistics
- 19Number of bridges
- 72ft / 22.1mTotal length
- 20,842Total average daily traffic
- 657Total average daily truck traffic
- 25,652Total future (year 2018) average daily traffic
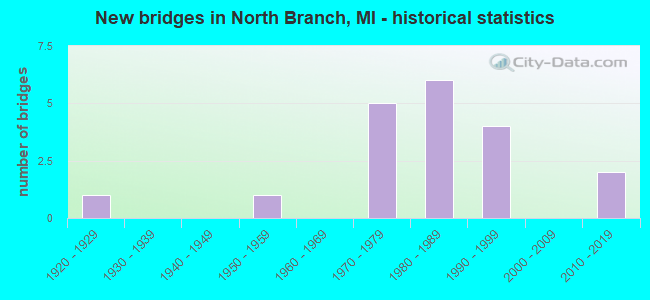
- New bridges - historical statistics
- 11920-1929
- 11950-1959
- 51970-1979
- 61980-1989
- 41990-1999
- 22010-2019
FCC Registered Cell Phone Towers:
2 (See the full list of FCC Registered Cell Phone Towers in North Branch)FCC Registered Antenna Towers:
61 (See the full list of FCC Registered Antenna Towers)FCC Registered Broadcast Land Mobile Towers:
2- At Lakehead Pipeline N Branch Sta On Barnes Rd 3 Mi Nw (Lat: 43.267250 Lon: -83.252444), Structure height: 76 m, Call Sign: KVJ592,
Assigned Frequencies: 451.700 MHz, Grant Date: 03/31/2015, Expiration Date: 06/12/2025, Registrant: Keller And Heckman LLP, 1001 G Street Nw, Suite 500 West, Washington, DC 20001, Phone: (202) 434-4100, Fax: (202) 434-4646, Email:
- 5861 Cedar Creek Rd (Lat: 43.213917 Lon: -83.165222), Call Sign: KNEW969,
Assigned Frequencies: 153.035 MHz, Grant Date: 04/06/1998, Expiration Date: 03/29/2003, Cancellation Date: 06/29/2003, Registrant: Reynolds, Roy Dba Reynolds Berry Farms, 5861 Cedar Creek Rd, North Branch, MI 48461
FCC Registered Microwave Towers:
14 (See the full list of FCC Registered Microwave Towers in this town)FCC Registered Amateur Radio Licenses:
45 (See the full list of FCC Registered Amateur Radio Licenses in North Branch)FAA Registered Aircraft:
2- Aircraft: PIPER PA-28-151 (Category: Land, Seats: 4, Weight: Up to 12,499 Pounds, Speed: 80 mph), Engine: LYCOMING 0-320 SERIES (180 HP) (Reciprocating)
N-Number: 41667, N41667, N-41667, Serial Number: 28-7415116, Year manufactured: 1974, Certificate Issue Date: 06/08/1990
Registrant (Individual): Clifton Jack Lewis, 5600 Clear Lake Road, North Branch, MI 48461 - Aircraft: CESSNA 172 (Category: Land, Seats: 4, Weight: Up to 12,499 Pounds, Speed: 105 mph), Engine: CONT MOTOR 0-300 SER (145 HP) (Reciprocating)
N-Number: 8078B, N8078B, N-8078B, Serial Number: 29878, Year manufactured: 1957, Certificate Issue Date: 11/01/2019
Registrant (LLC): Shareair LLC, 6557 Gleaner Hall Rd, North Branch, MI 48461
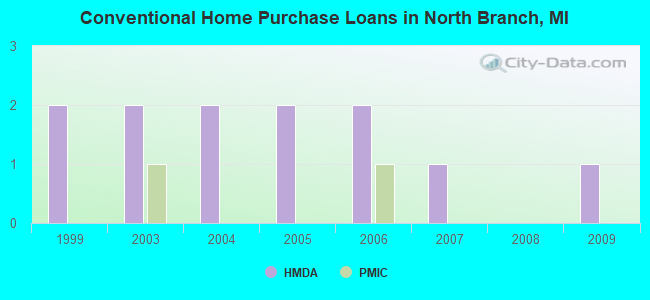
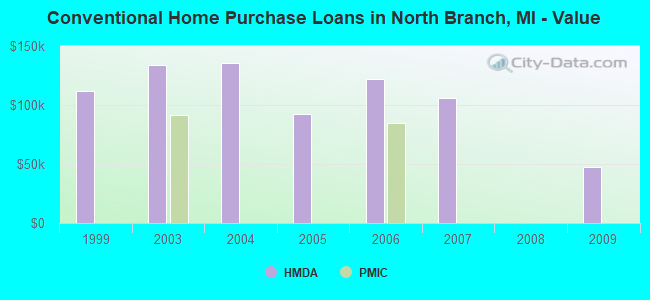
| Home Mortgage Disclosure Act Aggregated Statistics For Year 2009 (Based on 1 partial tract) | ||||
| B) Conventional Home Purchase Loans | C) Refinancings | |||
|---|---|---|---|---|
| Number | Average Value | Number | Average Value | |
| LOANS ORIGINATED | 1 | $47,130 | 2 | $143,540 |
| APPLICATIONS APPROVED, NOT ACCEPTED | 0 | $0 | 0 | $0 |
| APPLICATIONS DENIED | 0 | $0 | 1 | $137,240 |
| APPLICATIONS WITHDRAWN | 0 | $0 | 0 | $0 |
| FILES CLOSED FOR INCOMPLETENESS | 0 | $0 | 0 | $0 |
Detailed HMDA statistics for the following Tracts: 3325.00
| Private Mortgage Insurance Companies Aggregated Statistics For Year 2006 (Based on 1 partial tract) | ||
| A) Conventional Home Purchase Loans | ||
|---|---|---|
| Number | Average Value | |
| LOANS ORIGINATED | 1 | $84,760 |
| APPLICATIONS APPROVED, NOT ACCEPTED | 0 | $0 |
| APPLICATIONS DENIED | 0 | $0 |
| APPLICATIONS WITHDRAWN | 0 | $0 |
| FILES CLOSED FOR INCOMPLETENESS | 0 | $0 |
Detailed PMIC statistics for the following Tracts: 3325.00
2002 - 2018 National Fire Incident Reporting System (NFIRS) incidents
- Fire incident types reported to NFIRS in North Branch, MI
- 14842.5%Structure Fires
- 9527.3%Outside Fires
- 6117.5%Other
- 4412.6%Mobile Property/Vehicle Fires
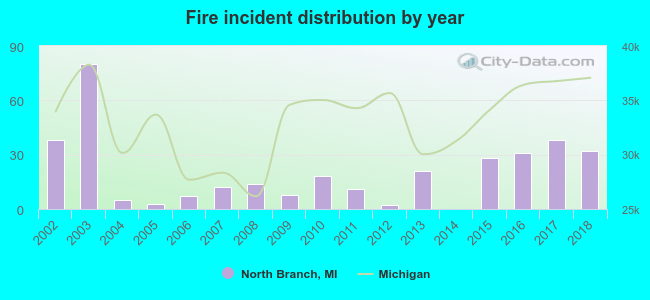 According to the data from the years 2002 - 2018 the average number of fire incidents per year is 20. The highest number of fires - 80 took place in 2003, and the least - 0 in 2014. The data has a declining trend.
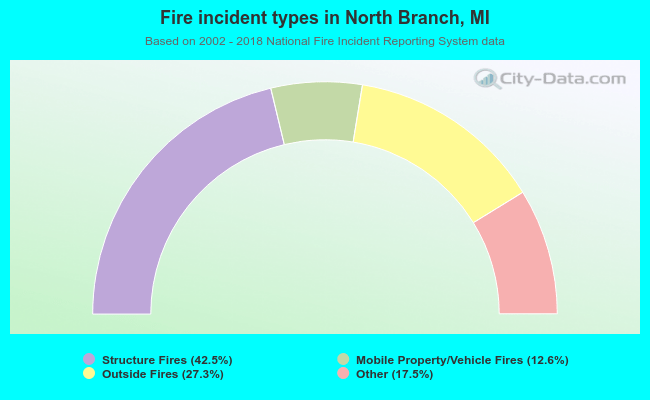 When looking into fire subcategories, the most reports belonged to: Structure Fires (42.5%), and Outside Fires (27.3%).
| Most common first names in North Branch, MI among deceased individuals | ||
| Name | Count | Lived (average) |
|---|---|---|
| John | 46 | 76.9 years |
| Mary | 37 | 79.2 years |
| William | 26 | 72.6 years |
| George | 21 | 75.1 years |
| Robert | 21 | 66.6 years |
| Frank | 19 | 75.9 years |
| Charles | 18 | 75.4 years |
| Edward | 16 | 67.8 years |
| Dorothy | 13 | 77.6 years |
| Leo | 13 | 76.5 years |
| Most common last names in North Branch, MI among deceased individuals | ||
| Last name | Count | Lived (average) |
|---|---|---|
| Smith | 23 | 69.1 years |
| Swoish | 13 | 77.9 years |
| Miller | 11 | 66.8 years |
| Klauka | 11 | 74.1 years |
| Robinet | 9 | 77.9 years |
| Kreiner | 9 | 79.7 years |
| Hunt | 8 | 81.3 years |
| Bennett | 8 | 69.9 years |
| Crawford | 8 | 79.7 years |
| Thompson | 8 | 78.3 years |
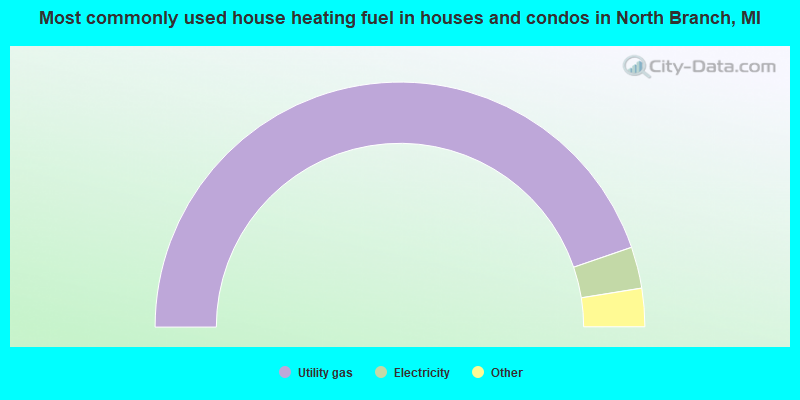
- 89.9%Utility gas
- 5.5%Electricity
- 2.5%Bottled, tank, or LP gas
- 1.3%Other fuel
- 0.8%Fuel oil, kerosene, etc.
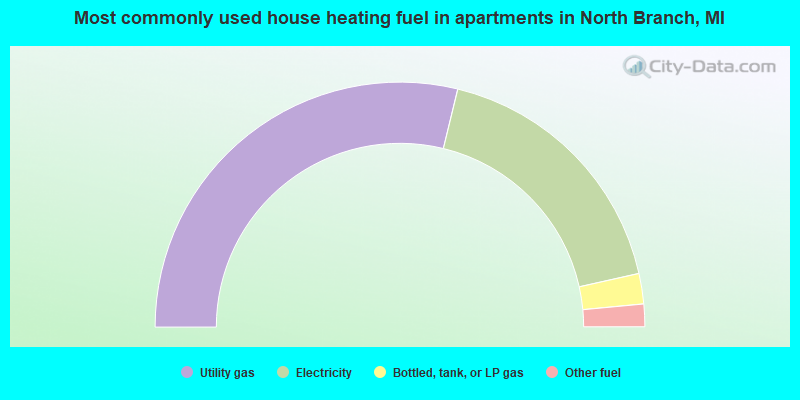
- 57.6%Utility gas
- 35.4%Electricity
- 4.0%Bottled, tank, or LP gas
- 3.0%Other fuel
North Branch compared to Michigan state average:
- Median household income below state average.
- Median house value below state average.
- Unemployed percentage below state average.
- Black race population percentage significantly below state average.
- Hispanic race population percentage significantly below state average.
- Median age below state average.
- Foreign-born population percentage significantly below state average.
- Renting percentage above state average.
- Length of stay since moving in significantly below state average.
- Percentage of population with a bachelor's degree or higher below state average.

|
|
Total of 31 patent applications in 2008-2024.