Northwood, Iowa
Submit your own pictures of this city and show them to the world
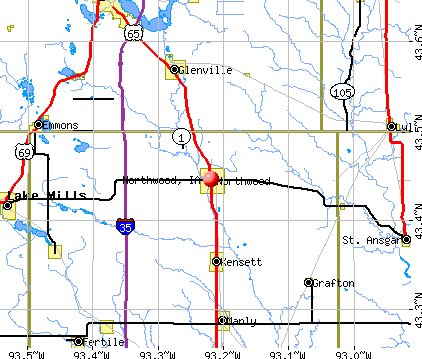
- OSM Map
- General Map
- Google Map
- MSN Map
Population change since 2000: +0.0%
 |
| Males: 1,013 | |
| Females: 1,038 |
| Median resident age: | 45.0 years |
| Iowa median age: | 38.9 years |
Zip codes: 50459.
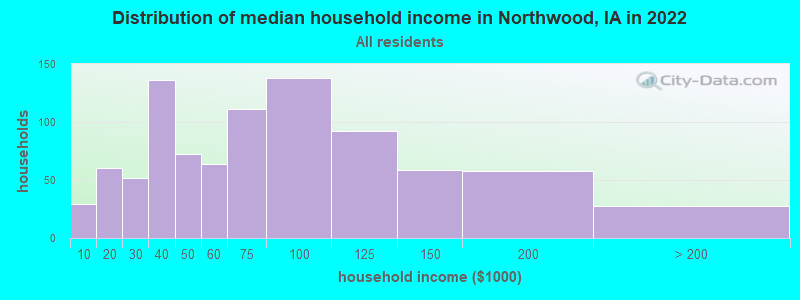
| Northwood: | $61,512 |
| IA: | $69,588 |
Estimated per capita income in 2022: $31,765 (it was $18,167 in 2000)
Northwood city income, earnings, and wages data
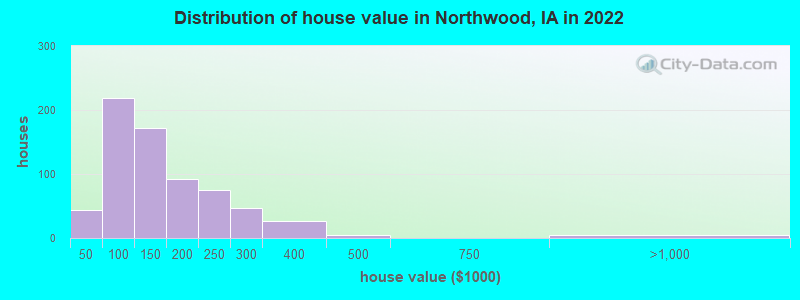
Estimated median house or condo value in 2022: $129,769 (it was $57,200 in 2000)
| Northwood: | $129,769 |
| IA: | $194,600 |
Mean prices in 2022: all housing units: $183,039; detached houses: $184,564; townhouses or other attached units: $291,520; mobile homes: $21,315
Median gross rent in 2022: $633.
(4.2% for White Non-Hispanic residents, 30.8% for Black residents, 3.8% for Hispanic or Latino residents, 9.3% for two or more races residents)
Detailed information about poverty and poor residents in Northwood, IA
Compare current foreclosures near Northwood, IA:
| Photo | Address | Area | Beds / Baths | Price | Details |
|---|---|---|---|---|---|

|
#1
12th St S
Northwood, IA 50459
|
- sq. feet
|
1 baths 3 beds |
show details | |

|
#2
1st Ave N Apt 1
Northwood, IA 50459
|
- sq. feet
|
- baths - beds |
show details | |

|
#3
Lake St E
Emmons, MN 56029
|
1,532 sq. feet
|
1 baths 3 beds |
$10,593
|
show details |

|
#4
5th St N
Northwood, IA 50459
|
- sq. feet
|
- baths - beds |
show details | |

|
#5
Main St
Emmons, MN 56029
|
1,099 sq. feet
|
1 baths 3 beds |
$27,900
|
show details |

|
#6
James Ave
Albert Lea, MN 56007
|
1,552 sq. feet
|
1 baths 3 beds |
show details | |

|
#7
E 11th St
Albert Lea, MN 56007
|
2,284 sq. feet
|
1 baths 4 beds |
show details | |

|
#8
Court St
Albert Lea, MN 56007
|
1,560 sq. feet
|
1 baths 4 beds |
show details | |

|
#9
Giles Pl
Albert Lea, MN 56007
|
996 sq. feet
|
1 baths 2 beds |
show details | |

|
#10
Park Avenue
Albert Lea, MN 56007
|
1,498 sq. feet
|
1 baths 3 beds |
show details |
| Photo | Address | Area | Beds / Baths | Price | Details |
|---|---|---|---|---|---|

|
#11
W Fountain St
Albert Lea, MN 56007
|
1,399 sq. feet
|
1 baths 4 beds |
show details | |

|
#12
High St
Albert Lea, MN 56007
|
1,358 sq. feet
|
1 baths 3 beds |
show details | |

|
#13
Burr Oak Dr
Albert Lea, MN 56007
|
1,696 sq. feet
|
2 baths 4 beds |
show details | |

|
#14
Columbus Ave
Albert Lea, MN 56007
|
1,224 sq. feet
|
1 baths 3 beds |
show details | |

|
#15
Oak Ln
Albert Lea, MN 56007
|
936 sq. feet
|
1 baths 2 beds |
show details | |

|
#16
Mcarthur Dr
Albert Lea, MN 56007
|
1,766 sq. feet
|
1 baths 3 beds |
show details | |

|
#17
Ulstad Ave
Albert Lea, MN 56007
|
1,120 sq. feet
|
1 baths 3 beds |
show details | |

|
#18
Johnson St
Albert Lea, MN 56007
|
1,684 sq. feet
|
1 baths 4 beds |
show details | |

|
#19
Plainview Ln
Albert Lea, MN 56007
|
1,052 sq. feet
|
1 baths 3 beds |
show details | |

|
#20
W Fountain St
Albert Lea, MN 56007
|
1,203 sq. feet
|
1 baths 4 beds |
show details |
| Photo | Address | Area | Beds / Baths | Price | Details |
|---|---|---|---|---|---|

|
#21
Saint Peter Ave
Albert Lea, MN 56007
|
1,093 sq. feet
|
1 baths 3 beds |
show details | |

|
#22
The Fairway
Albert Lea, MN 56007
|
2,660 sq. feet
|
2 baths 3 beds |
show details | |

|
#23
High St
Emmons, MN 56029
|
1,434 sq. feet
|
1 baths 3 beds |
show details | |

|
#24
W 7th St
Albert Lea, MN 56007
|
1,592 sq. feet
|
1 baths 4 beds |
show details | |

|
#25
Todd Ave
Albert Lea, MN 56007
|
680 sq. feet
|
1 baths 2 beds |
show details | |

|
#26
Oline Dr
Albert Lea, MN 56007
|
1,200 sq. feet
|
1 baths 3 beds |
show details | |

|
#27
Concord St
Emmons, MN 56029
|
1,060 sq. feet
|
1 baths 3 beds |
show details | |

|
#28
N 2nd Ave E
Lake Mills, IA 50450
|
910 sq. feet
|
1 baths - beds |
show details | |

|
#29
890th Ave
Albert Lea, MN 56007
|
1,176 sq. feet
|
1 baths - beds |
show details | |

|
#30
State Highway 105
Austin, MN 55912
|
- sq. feet
|
- baths - beds |
show details |
| Photo | Address | Area | Beds / Baths | Price | Details |
|---|---|---|---|---|---|

|
#31
Gene Ave
Albert Lea, MN 56007
|
- sq. feet
|
- baths - beds |
show details | |

|
#32
Abbott St Apt 301
Albert Lea, MN 56007
|
- sq. feet
|
- baths - beds |
show details | |

|
#33
E 18th St
Albert Lea, MN 56007
|
- sq. feet
|
- baths - beds |
show details | |

|
#34
Stevens St
Albert Lea, MN 56007
|
- sq. feet
|
- baths - beds |
show details | |

|
#35
E 2nd St Apt 103
Lyle, MN 55953
|
- sq. feet
|
- baths - beds |
show details | |

|
#36
W Front St
Albert Lea, MN 56007
|
- sq. feet
|
- baths - beds |
show details | |

|
#37
S 4th Ave Apt 101
Albert Lea, MN 56007
|
- sq. feet
|
- baths - beds |
show details | |

|
#38
E College St
Albert Lea, MN 56007
|
- sq. feet
|
- baths - beds |
show details | |

|
#39
Wedgewood Rd
Albert Lea, MN 56007
|
- sq. feet
|
- baths - beds |
show details | |

|
#40
440th St
Lake Mills, IA 50450
|
- sq. feet
|
- baths - beds |
show details |
| Photo | Address | Area | Beds / Baths | Price | Details |
|---|---|---|---|---|---|

|
Check over 1 million property listings on Foreclosure.com!
|
browse all offers | |||
| Photo | Address | Area | Beds / Baths | Price | Details |
|---|


- 2,00193.1%White alone
- 552.6%Hispanic
- 331.5%Two or more races
- 211.0%Asian alone
- 200.9%Black alone
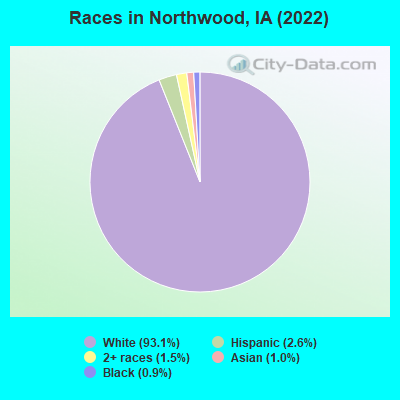
Races in Northwood detailed stats: ancestries, foreign born residents, place of birth
According to our research of Iowa and other state lists, there were 4 registered sex offenders living in Northwood, Iowa as of April 27, 2024.
The ratio of all residents to sex offenders in Northwood is 487 to 1.
The ratio of registered sex offenders to all residents in this city is near the state average.
 Recent articles from our blog. Our writers, many of them Ph.D. graduates or candidates, create easy-to-read articles on a wide variety of topics.

 | Town Suggestions - Northern Iowa (12 replies) |
| Northwood (3 replies) |
| Garner, IA (4 replies) |
| i need help to find a town in iowa (7 replies) |
| Relocation under way (7 replies) |
Latest news from Northwood, IA collected exclusively by city-data.com from local newspapers, TV, and radio stations
Ancestries: Norwegian (39.0%), German (22.3%), Irish (4.9%), English (4.4%), American (4.2%), Polish (1.9%).
Current Local Time: CST time zone
Incorporated on 06/7/1875
Elevation: 1232 feet
Land area: 3.78 square miles.
Population density: 542 people per square mile (low).
24 residents are foreign born
| This city: | 1.1% |
| Iowa: | 5.6% |
Median real estate property taxes paid for housing units with mortgages in 2022: $1,438 (1.1%)
Median real estate property taxes paid for housing units with no mortgage in 2022: $1,914 (1.4%)
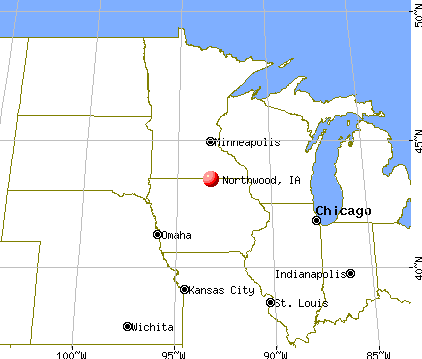
Nearest city with pop. 50,000+: Rochester, MN  (54.8 miles , pop. 85,806).
Nearest city with pop. 200,000+: St. Paul, MN (104.5 miles , pop. 287,151).
Nearest city with pop. 1,000,000+: Chicago, IL (302.9 miles , pop. 2,896,016).
Nearest cities:
), ), ), Latitude: 43.45 N, Longitude: 93.22 W
Area code: 641

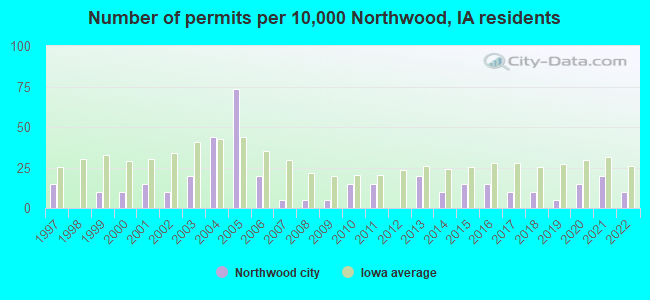
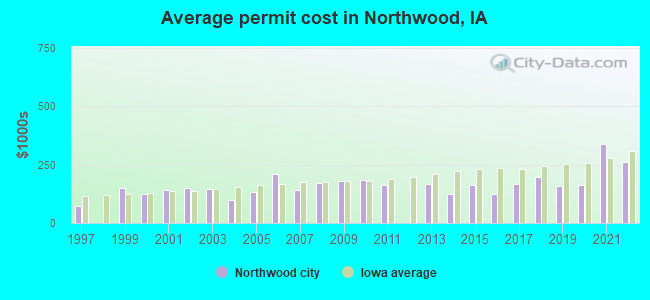
Single-family new house construction building permits:
- 2022: 2 buildings, average cost: $262,500
- 2021: 4 buildings, average cost: $337,500
- 2020: 3 buildings, average cost: $163,300
- 2019: 1 building, cost: $160,000
- 2018: 2 buildings, average cost: $195,000
- 2017: 2 buildings, average cost: $166,500
- 2016: 3 buildings, average cost: $123,300
- 2015: 3 buildings, average cost: $163,300
- 2014: 2 buildings, average cost: $125,000
- 2013: 4 buildings, average cost: $167,500
- 2011: 3 buildings, average cost: $163,300
- 2010: 3 buildings, average cost: $185,000
- 2009: 1 building, cost: $180,000
- 2008: 1 building, cost: $170,000
- 2007: 1 building, cost: $140,000
- 2006: 4 buildings, average cost: $211,300
- 2005: 15 buildings, average cost: $133,900
- 2004: 9 buildings, average cost: $99,300
- 2003: 4 buildings, average cost: $146,000
- 2002: 2 buildings, average cost: $150,000
- 2001: 3 buildings, average cost: $143,300
- 2000: 2 buildings, average cost: $125,000
- 1999: 2 buildings, average cost: $150,000
- 1997: 3 buildings, average cost: $71,700
| Here: | 2.4% |
| Iowa: | 2.7% |
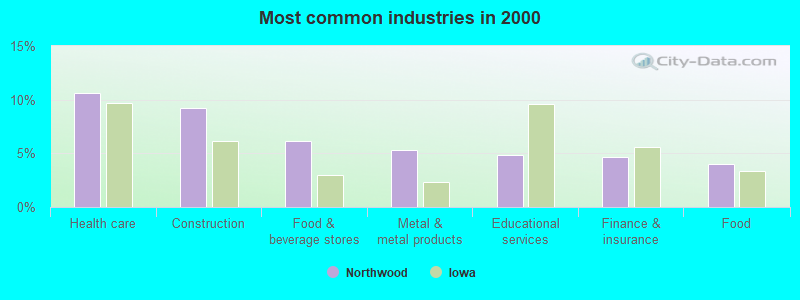
- Health care (10.6%)
- Construction (9.2%)
- Food & beverage stores (6.2%)
- Metal & metal products (5.3%)
- Educational services (4.8%)
- Finance & insurance (4.6%)
- Food (4.0%)
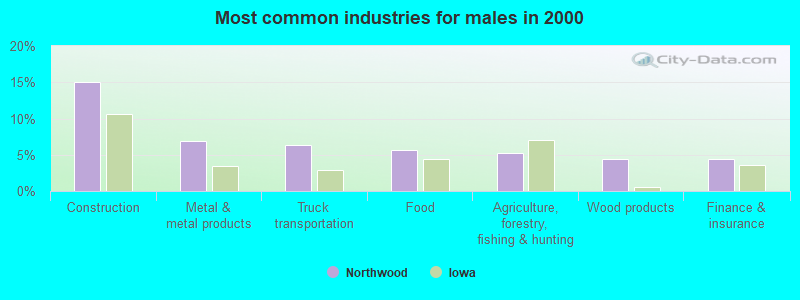
- Construction (15.1%)
- Metal & metal products (7.0%)
- Truck transportation (6.4%)
- Food (5.6%)
- Agriculture, forestry, fishing & hunting (5.2%)
- Wood products (4.4%)
- Finance & insurance (4.4%)
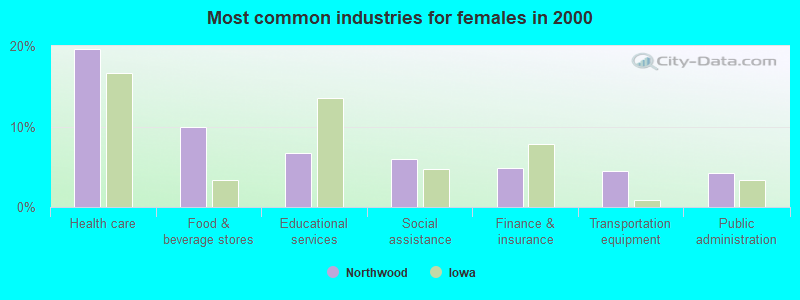
- Health care (19.6%)
- Food & beverage stores (9.9%)
- Educational services (6.8%)
- Social assistance (5.9%)
- Finance & insurance (4.9%)
- Transportation equipment (4.4%)
- Public administration (4.2%)
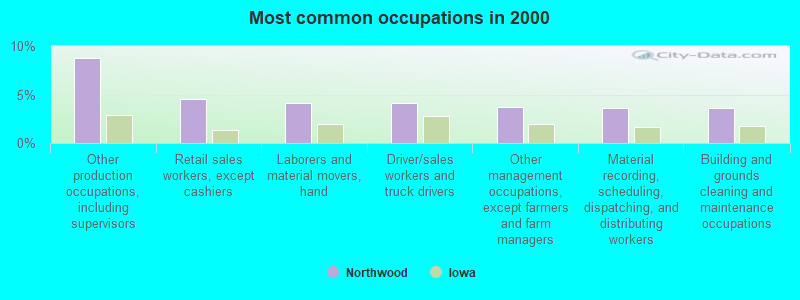
- Other production occupations, including supervisors (8.8%)
- Retail sales workers, except cashiers (4.5%)
- Laborers and material movers, hand (4.1%)
- Driver/sales workers and truck drivers (4.1%)
- Other management occupations, except farmers and farm managers (3.7%)
- Material recording, scheduling, dispatching, and distributing workers (3.6%)
- Building and grounds cleaning and maintenance occupations (3.6%)
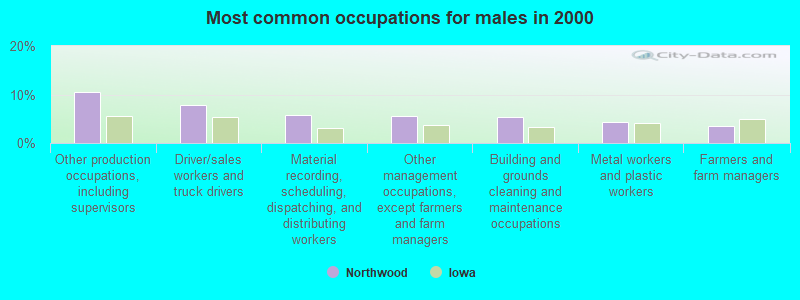
- Other production occupations, including supervisors (10.4%)
- Driver/sales workers and truck drivers (7.9%)
- Material recording, scheduling, dispatching, and distributing workers (5.8%)
- Other management occupations, except farmers and farm managers (5.6%)
- Building and grounds cleaning and maintenance occupations (5.4%)
- Metal workers and plastic workers (4.3%)
- Farmers and farm managers (3.5%)
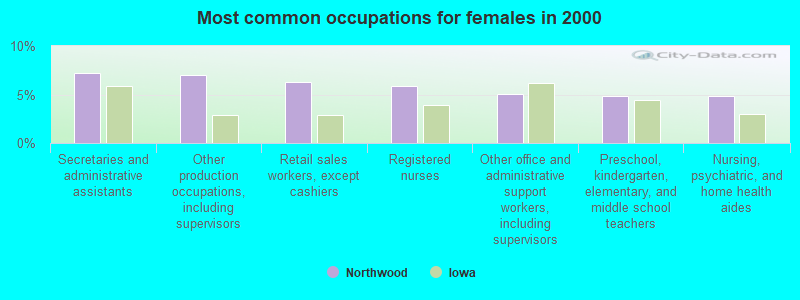
- Secretaries and administrative assistants (7.2%)
- Other production occupations, including supervisors (7.0%)
- Retail sales workers, except cashiers (6.3%)
- Registered nurses (5.9%)
- Other office and administrative support workers, including supervisors (5.1%)
- Preschool, kindergarten, elementary, and middle school teachers (4.9%)
- Nursing, psychiatric, and home health aides (4.9%)
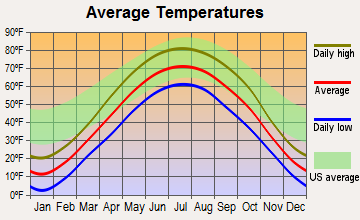
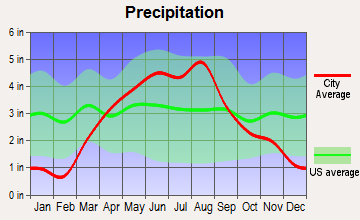
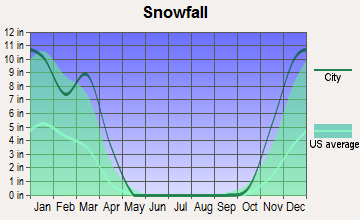
Average climate in Northwood, Iowa
Based on data reported by over 4,000 weather stations


|
|


(lower is better)
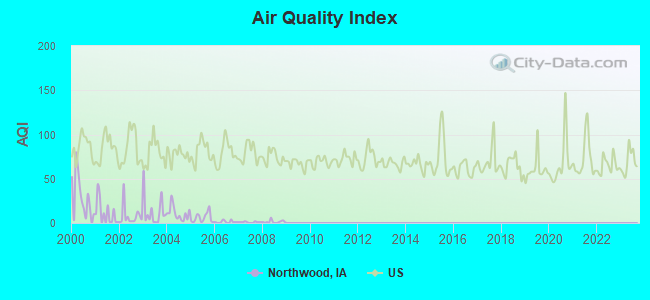
Air Quality Index (AQI) level in 2008 was 1.21. This is significantly better than average.
| City: | 1.21 |
| U.S.: | 72.56 |
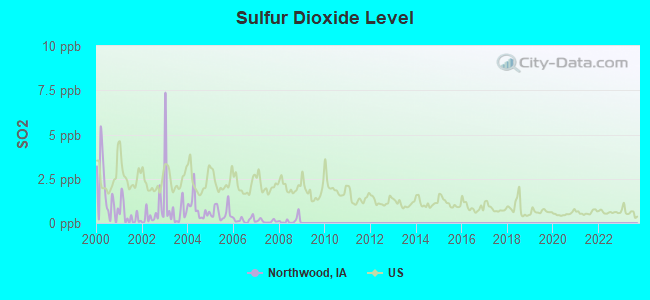
Sulfur Dioxide (SO2) [ppb] level in 2008 was 0.136. This is significantly better than average. Closest monitor was 19.1 miles away from the city center.
| City: | 0.136 |
| U.S.: | 1.515 |
Tornado activity:
Northwood-area historical tornado activity is near Iowa state average. It is 76% greater than the overall U.S. average.
On 4/30/1967, a category F4 (max. wind speeds 207-260 mph) tornado 2.5 miles away from the Northwood city center injured one person and caused between $500,000 and $5,000,000 in damages.
On 5/10/1953, a category F4 tornado 8.1 miles away from the city center injured 3 people and caused between $50,000 and $500,000 in damages.
Earthquake activity:
Northwood-area historical earthquake activity is significantly above Iowa state average. It is 107% greater than the overall U.S. average.On 7/9/1975 at 14:54:15, a magnitude 4.6 (4.6 MB, Class: Light, Intensity: IV - V) earthquake occurred 207.3 miles away from the city center
On 6/5/1993 at 01:24:53, a magnitude 4.1 (4.1 LG, Depth: 6.2 mi) earthquake occurred 216.1 miles away from Northwood center
On 4/18/2008 at 09:36:59, a magnitude 5.4 (5.1 MB, 4.8 MS, 5.4 MW, 5.2 MW, Class: Moderate, Intensity: VI - VII) earthquake occurred 443.6 miles away from Northwood center
On 3/4/1983 at 06:32:18, a magnitude 4.6 (4.4 MB, 4.6 LG, 4.4 ML) earthquake occurred 313.3 miles away from Northwood center
On 6/28/2004 at 06:10:52, a magnitude 4.2 (4.2 MW, Depth: 6.2 mi) earthquake occurred 259.7 miles away from the city center
On 9/3/2016 at 12:02:44, a magnitude 5.8 (5.8 MW, Depth: 3.5 mi) earthquake occurred 523.8 miles away from Northwood center
Magnitude types: regional Lg-wave magnitude (LG), body-wave magnitude (MB), local magnitude (ML), surface-wave magnitude (MS), moment magnitude (MW)
Natural disasters:
The number of natural disasters in Worth County (13) is near the US average (15).Major Disasters (Presidential) Declared: 11
Emergencies Declared: 1
Causes of natural disasters: Floods: 9, Storms: 7, Tornadoes: 3, Heavy Rain: 1, Hurricane: 1, Ice Storm: 1, Winter Storm: 1, Other: 1 (Note: some incidents may be assigned to more than one category).

Hospitals and medical centers in Northwood:
Other hospitals and medical centers near Northwood:
- MANLY NURSING AND REHAB CENTER (Nursing Home, about 12 miles away; MANLY, IA)
- MAYO DIALYSIS - ALBERT LEA (Dialysis Facility, about 15 miles away; ALBERT LEA, MN)
- ALBERT LEA M C HOME HEALTH (Home Health Center, about 15 miles away; ALBERT LEA, MN)
- REM WOODVALE INC PLAINVIEW (Hospital, about 16 miles away; ALBERT LEA, MN)
Airports located in Northwood:
- Northwood Municipal Airport (5D2) (Runways: 1, Itinerant Ops: 1,050, Local Ops: 700)
Colleges/universities with over 2000 students nearest to Northwood:
- Riverland Community College (about 20 miles; Austin, MN; Full-time enrollment: 2,321)
- North Iowa Area Community College (about 21 miles; Mason City, IA; FT enrollment: 2,235)
- Rochester Community and Technical College (about 57 miles; Rochester, MN; FT enrollment: 4,444)
- Minnesota State University-Mankato (about 63 miles; Mankato, MN; FT enrollment: 13,940)
- South Central College (about 66 miles; North Mankato, MN; FT enrollment: 2,726)
- St Olaf College (about 71 miles; Northfield, MN; FT enrollment: 3,141)
- Northeast Iowa Community College-Calmar (about 71 miles; Calmar, IA; FT enrollment: 3,365)
Public high school in Northwood:
- NORTHWOOD-KENSETT JR-SR HIGH SCHOOL (Students: 256, Location: 704 7TH STREET NORTH, Grades: 7-12)
Public elementary/middle school in Northwood:
- NORTHWOOD-KENSETT ELEMENTARY (Students: 261, Location: 1200 1ST AVE NORTH, Grades: PK-6)
Points of interest:
Notable locations in Northwood: Northwood Co-op Elevator (A), Northwood (B), Northwood Public Library (C), Northwood Volunteer Fire Company (D), Northwood Police Department (E), Worth County Historical Museum (F), Swensrud School Museum (G), Worth County Sheriffs Office (H), Worth County Courthouse (I). Display/hide their locations on the map
Churches in Northwood include: United Methodist Church (A), Northwood Baptist Church (B), First Shell Rock Church (C), First Lutheran Church (D). Display/hide their locations on the map
Cemeteries: Sunset Rest Cemetery (1), Seater Family Plot (2). Display/hide their locations on the map
Parks in Northwood include: Swensrud Park (1), Central Park (2), Hurd Park (3). Display/hide their locations on the map
Tourist attraction: Top of Iowa Welcome Center (Tours & Charters; 4705 Wheelerwood Road).
Hotels: Royal Motel (903 10th Street South), Hotel Northwood (98 8th Street South).
Courts: Iowa State - Judicial Department- Clerk Of District Court (Court House), Iowa State - Judicial Department- Judicial Magistrate (Court House).
Drinking water stations with addresses in Northwood and their reported violations in the past:
NORTHWOOD COUNTRY CLUB (Address: 207 3RD ST NORTH , Population served: 42, Groundwater):Past health violations:Past monitoring violations:
- MCL, Monthly (TCR) - In SEP-2008, Contaminant: Coliform. Follow-up actions: St Formal NOV issued (OCT-03-2008), St Public Notif requested (OCT-03-2008), St Public Notif received (JUN-08-2009), St Compliance achieved (OCT-31-2009)
- MCL, Monthly (TCR) - In AUG-2008, Contaminant: Coliform. Follow-up actions: St Violation/Reminder Notice (AUG-11-2008), St Formal NOV issued (AUG-28-2008), St Public Notif requested (AUG-28-2008), St Public Notif received (JUN-08-2009), St Compliance achieved (OCT-31-2009)
- MCL, Monthly (TCR) - In SEP-2007, Contaminant: Coliform. Follow-up actions: St Public Notif requested (SEP-28-2007), St Formal NOV issued (SEP-28-2007), St Compliance achieved (MAR-31-2008), St Public Notif received (JUN-08-2009)
- MCL, Monthly (TCR) - In AUG-2007, Contaminant: Coliform. Follow-up actions: St Public Notif requested (AUG-31-2007), St Formal NOV issued (AUG-31-2007), St Compliance achieved (MAR-31-2008), St Public Notif received (JUN-08-2009)
- Monitoring, Repeat Major (TCR) - Between APR-2009 and MAY-2009, Contaminant: Coliform (TCR). Follow-up actions: St Public Notif requested (MAY-21-2009), St Formal NOV issued (MAY-21-2009), St Compliance achieved (MAY-27-2009), St Public Notif received (JUN-08-2009)
- 3 routine major monitoring violations
- One minor monitoring violation
| This city: | 2.2 people |
| Iowa: | 2.4 people |
| This city: | 59.9% |
| Whole state: | 64.7% |
| This city: | 6.3% |
| Whole state: | 6.7% |
Likely homosexual households (counted as self-reported same-sex unmarried-partner households)
- Lesbian couples: 0.2% of all households
- Gay men: 0.1% of all households
5 people in local jails and other municipal confinement facilities in 2010
83 people in nursing homes in 2000
6 people in local jails and other confinement facilities (including police lockups) in 2000
Banks with branches in Northwood (2011 data):
- Northwoods State Bank: Northwood Branch at 900 Central Avenue, branch established on 1999/06/07. Info updated 2006/11/03: Bank assets: $153.0 mil, Deposits: $129.2 mil, headquarters in Mason City, IA, positive income, Agricultural Specialization, 3 total offices, Holding Company: Northwood Financial Services Corporation
- Farmers State Bank: at 99 7th Street North, branch established on 1921/11/15. Info updated 2006/11/03: Bank assets: $148.0 mil, Deposits: $125.2 mil, local headquarters, positive income, Agricultural Specialization, 8 total offices, Holding Company: Farmers State Bancshares, Inc.
For population 15 years and over in Northwood:
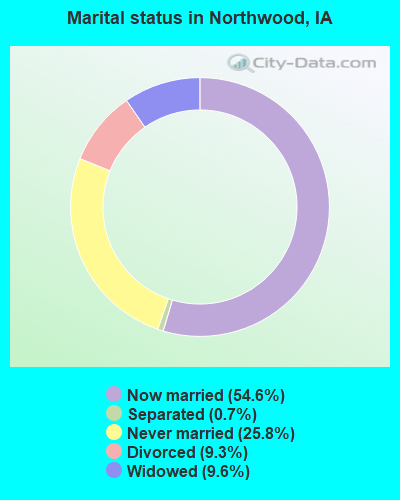
- Never married: 25.8%
- Now married: 54.6%
- Separated: 0.7%
- Widowed: 9.6%
- Divorced: 9.3%
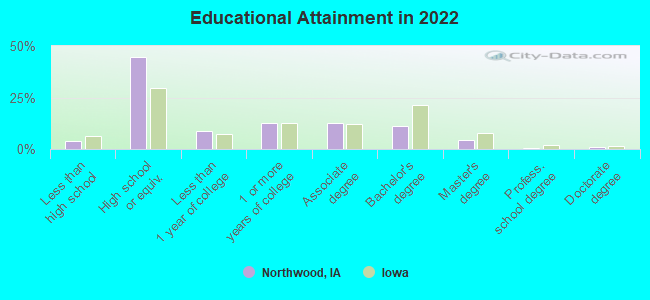
For population 25 years and over in Northwood:
- High school or higher: 95.8%
- Bachelor's degree or higher: 16.0%
- Graduate or professional degree: 5.6%
- Unemployed: 2.7%
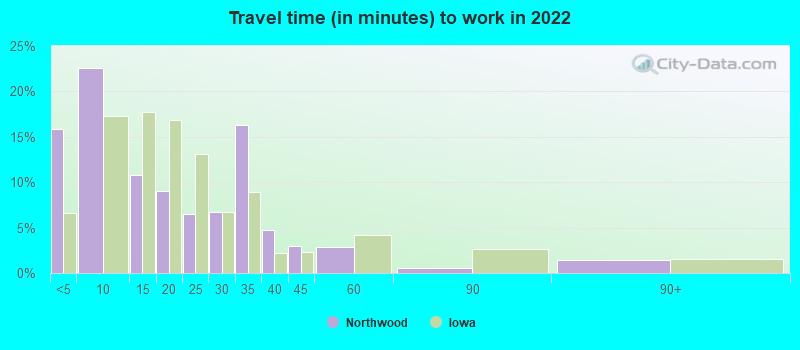
- Mean travel time to work (commute): 20.5 minutes
| Here: | 7.8 |
| Iowa average: | 10.5 |
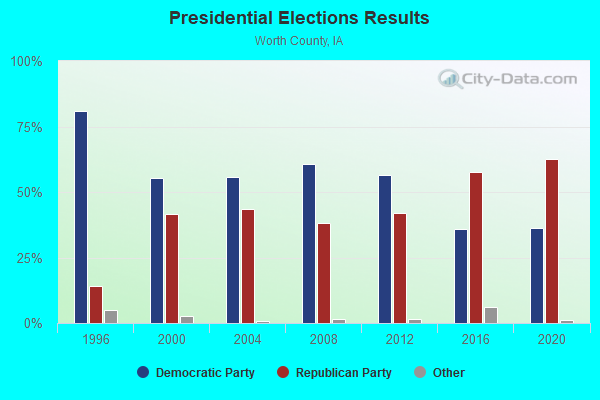
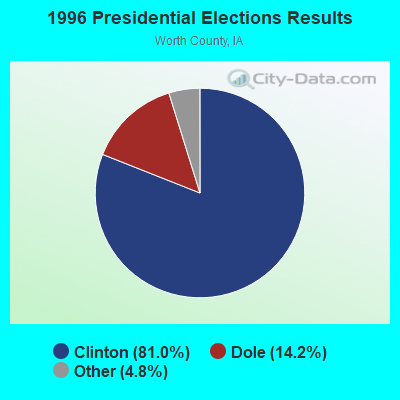
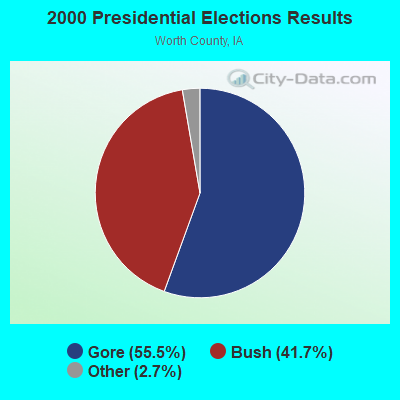

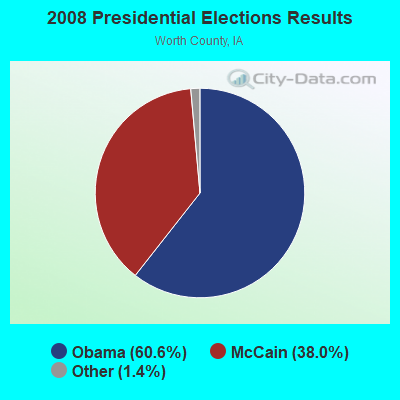
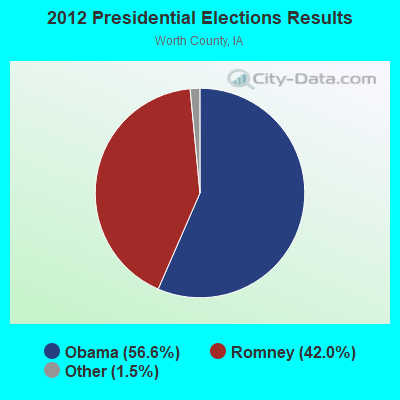
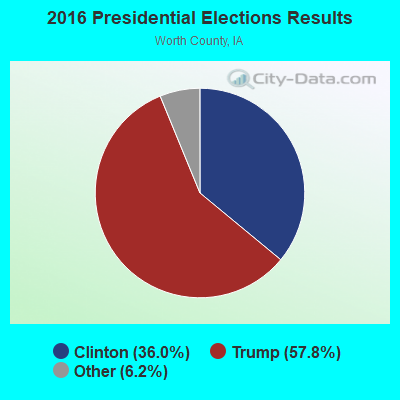
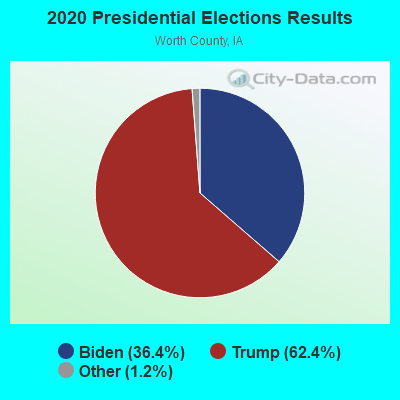
Graphs represent county-level data. Detailed 2008 Election Results
Religion statistics for Northwood, IA (based on Worth County data)

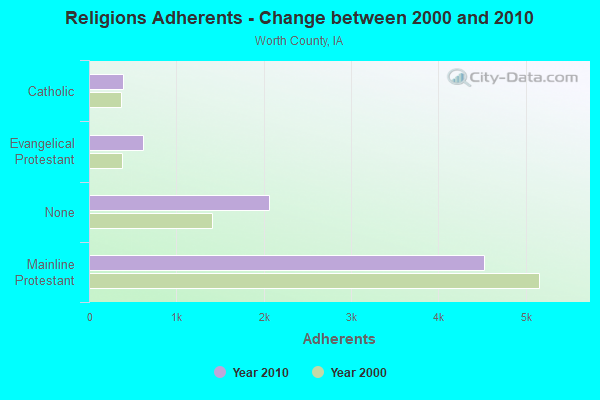
| Religion | Adherents | Congregations |
|---|---|---|
| Mainline Protestant | 4,521 | 12 |
| Evangelical Protestant | 621 | 9 |
| Catholic | 390 | 1 |
| None | 2,066 | - |
Food Environment Statistics:
| This county: | 2.61 / 10,000 pop. |
| Iowa: | 2.14 / 10,000 pop. |
| Here: | 6.53 / 10,000 pop. |
| State: | 5.55 / 10,000 pop. |
| Here: | 9.14 / 10,000 pop. |
| Iowa: | 8.01 / 10,000 pop. |
| This county: | 8.2% |
| Iowa: | 7.8% |
| Worth County: | 28.6% |
| State: | 27.3% |
Health and Nutrition:
| Northwood: | 50.2% |
| State: | 49.5% |
| This city: | 45.5% |
| Iowa: | 46.1% |
| Here: | 29.4 |
| Iowa: | 28.6 |
| Northwood: | 20.2% |
| State: | 21.4% |
| Northwood: | 14.9% |
| Iowa: | 10.4% |
| Here: | 6.9 |
| Iowa: | 6.8 |
| Here: | 35.5% |
| Iowa: | 33.8% |
| Here: | 55.2% |
| Iowa: | 55.9% |
| Northwood: | 74.9% |
| Iowa: | 77.7% |
More about Health and Nutrition of Northwood, IA Residents
| Local government employment and payroll (March 2022) | |||||
| Function | Full-time employees | Monthly full-time payroll | Average yearly full-time wage | Part-time employees | Monthly part-time payroll |
|---|---|---|---|---|---|
| Streets and Highways | 4 | $18,288 | $54,864 | 0 | $0 |
| Police Protection - Officers | 4 | $18,678 | $56,034 | 0 | $0 |
| Transit | 1 | $3,267 | $39,204 | 0 | $0 |
| Water Supply | 1 | $5,670 | $68,040 | 0 | $0 |
| Local Libraries | 1 | $2,510 | $30,120 | 1 | $2,975 |
| Other Government Administration | 1 | $7,806 | $93,672 | 11 | $6,894 |
| Sewerage | 1 | $5,670 | $68,040 | 0 | $0 |
| Other and Unallocable | 1 | $10,016 | $120,192 | 1 | $368 |
| Totals for Government | 14 | $71,905 | $61,633 | 13 | $10,237 |
Northwood government finances - Expenditure in 2021 (per resident):
- Current Operations - Sewerage: $604,000 ($294.49)
Regular Highways: $561,000 ($273.53)
Police Protection: $356,000 ($173.57)
General - Other: $294,000 ($143.34)
Water Utilities: $279,000 ($136.03)
Parks and Recreation: $166,000 ($80.94)
Solid Waste Management: $151,000 ($73.62)
Miscellaneous Commercial Activities - Other: $93,000 ($45.34)
Libraries: $72,000 ($35.10)
Financial Administration: $65,000 ($31.69)
General Public Buildings: $65,000 ($31.69)
Housing and Community Development: $35,000 ($17.06)
Transit Utilities: $32,000 ($15.60)
Central Staff Services: $14,000 ($6.83)
Health - Other: $12,000 ($5.85)
Local Fire Protection: $8,000 ($3.90)
Air Transportation: $7,000 ($3.41)
Judicial and Legal Services: $6,000 ($2.93)
- General - Interest on Debt: $348,000 ($169.67)
- Intergovernmental to Local - Other - Police Protection: $356,000 ($173.57)
- Total Salaries and Wages: $563,000 ($274.50)
Northwood government finances - Revenue in 2021 (per resident):
- Charges - Sewerage: $624,000 ($304.24)
Solid Waste Management: $153,000 ($74.60)
Parks and Recreation: $37,000 ($18.04)
Other: $26,000 ($12.68)
Miscellaneous Commercial Activities: $19,000 ($9.26)
Air Transportation: $3,000 ($1.46)
- Local Intergovernmental - Other: $20,000 ($9.75)
- Miscellaneous - General Revenue - Other: $410,000 ($199.90)
Interest Earnings: $25,000 ($12.19)
Rents: $19,000 ($9.26)
Fines and Forfeits: $2,000 ($0.98)
- Revenue - Water Utilities: $356,000 ($173.57)
Transit Utilities: $29,000 ($14.14)
- State Intergovernmental - Highways: $298,000 ($145.29)
Other: $3,000 ($1.46)
- Tax - Property: $951,000 ($463.68)
General Sales and Gross Receipts: $240,000 ($117.02)
Other License: $25,000 ($12.19)
Northwood government finances - Debt in 2021 (per resident):
- Long Term Debt - Beginning Outstanding - Unspecified Public Purpose: $8,705,000 ($4244.27)
Outstanding Unspecified Public Purpose: $8,380,000 ($4085.81)
Retired Unspecified Public Purpose: $325,000 ($158.46)
Northwood government finances - Cash and Securities in 2021 (per resident):
- Other Funds - Cash and Securities: $2,538,000 ($1237.45)
| Businesses in Northwood, IA | ||||
| Name | Count | Name | Count | |
|---|---|---|---|---|
| Burger King | 2 | Holiday Inn | 1 | |
| Chevrolet | 1 | Subway | 1 | |
| Ford | 1 | True Value | 1 | |
Strongest AM radio stations in Northwood:
- KNFX (970 AM; 5 kW; AUSTIN, MN; Owner: CLEAR CHANNEL BROADCASTING LICENSES, INC.)
- KGLO (1300 AM; 5 kW; MASON CITY, IA; Owner: CLEAR CHANNEL BROADCASTING LICENSES, INC.)
- KFAN (1130 AM; 50 kW; MINNEAPOLIS, MN; Owner: AMFM RADIO LICENSES, L.L.C.)
- WCTS (1030 AM; 50 kW; MAPLEWOOD, MN; Owner: CNTL. BAPT. THEO/AL SEMI MINNEAPOLIS)
- WCCO (830 AM; 50 kW; MINNEAPOLIS, MN; Owner: INFINITY MEDIA CORPORATION)
- KXEL (1540 AM; 50 kW; WATERLOO, IA; Owner: KXEL BROADCASTING COMPANY, INC.)
- KATE (1450 AM; 1 kW; ALBERT LEA, MN; Owner: THREE EAGLES OF LUVERNE, INC.)
- WHO (1040 AM; 50 kW; DES MOINES, IA; Owner: CITICASTERS LICENSES, L.P.)
- KSTP (1500 AM; 50 kW; ST. PAUL, MN; Owner: KSTP-AM, LLC (DELAWARE))
- KAUS (1480 AM; 1 kW; AUSTIN, MN; Owner: THREE EAGLES OF LUVERNE, INC.)
- KTIS (900 AM; 25 kW; MINNEAPOLIS, MN; Owner: NORTHWESTERN COLLEGE)
- KOLM (1520 AM; 10 kW; ROCHESTER, MN; Owner: OLMSTED COUNTY BROADCASTING COMPANY)
- KDHL (920 AM; 5 kW; FARIBAULT, MN; Owner: CUMULUS LICENSING CORP.)
Strongest FM radio stations in Northwood:
- KYTC (102.7 FM; NORTHWOOD, IA; Owner: THREE EAGLES OF MASON CITY, INC.)
- KBDC (88.5 FM; MASON CITY, IA; Owner: AMERICAN FAMILY ASSOCIATION)
- KAUS-FM (99.9 FM; AUSTIN, MN; Owner: THREE EAGLES OF LUVERNE, INC.)
- KLSS-FM (106.1 FM; MASON CITY, IA; Owner: THREE EAGLES OF MASON CITY, INC.)
- KSMA-FM (98.7 FM; OSAGE, IA; Owner: CLEAR CHANNEL BROADCASTING LICENSES, INC.)
- KQPR (96.1 FM; ALBERT LEA, MN; Owner: HOMETOWN BROADCASTING, INC.)
- KIAI (93.9 FM; MASON CITY, IA; Owner: CLEAR CHANNEL BROADCASTING LICENSES, INC.)
- KCPI (94.9 FM; ALBERT LEA, MN; Owner: THREE EAGLES OF LUVERNE, INC.)
- KROC-FM (106.9 FM; ROCHESTER, MN; Owner: SOUTHERN MINNESOTA BROADCASTING CO.)
- K299AL (107.7 FM; ALBERT LEA, MN; Owner: FREEBORN COUNTY CHRISTIAN RADIO, INC)
- KUNY (91.5 FM; MASON CITY, IA; Owner: UNIVERSITY OF NORTHERN IOWA)
- KJCY (95.5 FM; ST. ANSGAR, IA; Owner: MINN-IOWA CHRISTIAN BROADCASTING, INC.)
- KYBA (105.3 FM; STEWARTVILLE, MN; Owner: SOUTHERN MINNESOTA BROADCASTING CO)
- KVGO (104.3 FM; SPRING VALLEY, MN; Owner: KVGO, INC.)
- KCMR (97.9 FM; MASON CITY, IA; Owner: TLC BROADCASTING CORPORATION)
- K223AB (92.5 FM; MASON CITY, IA; Owner: GREAT COMM. COMMCNS. OF N. IOWA INC)
- KMSK (91.3 FM; AUSTIN, MN; Owner: MANKATO STATE UNIVERSITY)
TV broadcast stations around Northwood:
- KYIN (Channel 24; MASON CITY, IA; Owner: IOWA PUBLIC BROADCASTING BOARD)
- KIMT (Channel 3; MASON CITY, IA; Owner: MEDIA GENERAL BROADCASTING OF SO. CAROLINA HOLDINGS, INC.)
- KAAL (Channel 6; AUSTIN, MN; Owner: KAAL-TV, LLC)
- KTTC (Channel 10; ROCHESTER, MN; Owner: KTTC TELEVISION, INC.)
- K43DH (Channel 43; AUSTIN, MN; Owner: TELEVIEW SYSTEMS OF MINNESOTA)
- K45DF (Channel 45; AUSTIN, MN; Owner: TELEVIEW SYSTEMS OF MINNESOTA)
- K49DB (Channel 49; AUSTIN, MN; Owner: TELEVIEW SYSTEMS OF MINNESOTA)
- K51CY (Channel 51; AUSTIN, MN; Owner: TELEVIEW SYSTEMS OF MINNESOTA)
- K53DI (Channel 53; AUSTIN, MN; Owner: TELEVIEW SYSTEMS OF MINNESOTA)
- K55FJ (Channel 55; AUSTIN, MN; Owner: TELEVIEW SYSTEMS OF MINNESOTA)
- K61EU (Channel 61; AUSTIN, MN; Owner: TELEVIEW SYSTEMS OF MINNESOTA)
- K57EU (Channel 57; AUSTIN, MN; Owner: TELEVIEW SYSTEMS OF MINNESOTA)
- KSMQ-TV (Channel 15; AUSTIN, MN; Owner: INDEPENDENT SCHOOL DISTRICT #492)
- K54HA (Channel 54; ALBERT LEA, MN; Owner: TRINITY BROADCASTING NETWORK)
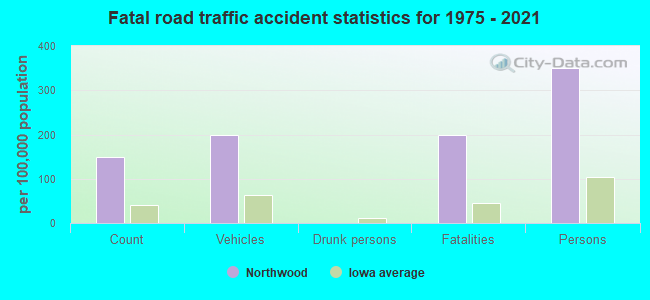
Northwood fatal accident list:
Oct 3, 1995 09:14 PM, 105, Vehicles: 2, Persons: 5, Fatalities: 2
Apr 13, 1985 11:14 AM, 16th St N, Vehicles: 1, Persons: 1, Fatalities: 1
- National Bridge Inventory (NBI) Statistics
- 11Number of bridges
- 128ft / 38.9mTotal length
- 10,342Total average daily traffic
- 1,365Total average daily truck traffic
- 10,342Total future (year 2040) average daily traffic
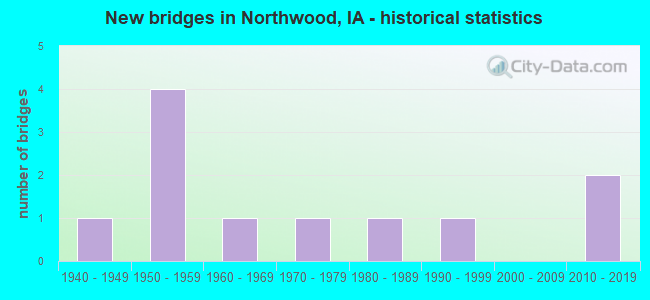
- New bridges - historical statistics
- 11940-1949
- 41950-1959
- 11960-1969
- 11970-1979
- 11980-1989
- 11990-1999
- 22010-2019
FCC Registered Cell Phone Towers:
2 (See the full list of FCC Registered Cell Phone Towers in Northwood)FCC Registered Antenna Towers:
63 (See the full list of FCC Registered Antenna Towers)FCC Registered Broadcast Land Mobile Towers:
13 (See the full list of FCC Registered Broadcast Land Mobile Towers in Northwood, IA)FCC Registered Microwave Towers:
7- NORTHWOOD, 3.1 Mi Ssw (Lat: 43.397222 Lon: -93.236111), Type: Gtower, Structure height: 91.4 m, Overall height: 96 m, Call Sign: WMS989,
Assigned Frequencies: 6755.00 MHz, Grant Date: 03/08/2011, Expiration Date: 02/01/2021, Cancellation Date: 05/05/2016, Certifier: Steven T Campbell, Registrant: Holland & Knight LLP, 800 17th Street, N.W., Suite #1100, Washington, DC 20006-3906, Phone: (202) 955-3000, Fax: (202) 955-5564, Email:
- STATION, 4 Mi W Of Northwood On Hwy 105 1.1 Mi S (Lat: 43.427444 Lon: -93.289917), Overall height: 60.4 m, Call Sign: WNTU792,
Assigned Frequencies: 952.193 MHz, 928.193 MHz, Grant Date: 03/20/2019, Expiration Date: 04/05/2029, Registrant: Prokarma, 222 So 15th St., Suite 505n, Omaha, NE 68102, Phone: (402) 522-5068, Fax: (402) 346-6676, Email:
- Northwood Elevator, Lat: 43.449000 Lon: -93.212806, Type: Silo, Structure height: 61 m, Overall height: 64 m, Call Sign: WQKB396,
Assigned Frequencies: 3650.00 MHz, Grant Date: 03/17/2009, Expiration Date: 03/31/2018, Cancellation Date: 06/02/2018, Certifier: Terry Wegener, Registrant: Attorney At Law, 2154 Wisconsin Avenue, Nw, Ste 250, Washington, DC 20007, Phone: (202) 223-3772, Fax: (202) 315-3587, Email:
- TOP OF IOWA, 853 480th Street (Lat: 43.458750 Lon: -93.350000), Type: Tower, Structure height: 76.2 m, Overall height: 79.2 m, Call Sign: WQLA262,
Assigned Frequencies: 6595.00 MHz, Grant Date: 11/09/2009, Expiration Date: 11/09/2019, Cancellation Date: 05/05/2016, Certifier: John E Rooney, Registrant: Holland & Knight LLP, 800 17th Street, N.W., Suite #1100, Washington, DC 20006-3906, Phone: (202) 955-3000, Fax: (202) 955-5564, Email:
- NORTHWOODS, 5 Mi W (Lat: 43.445000 Lon: -93.326111), Type: Tower, Structure height: 91.4 m, Overall height: 94.5 m, Call Sign: WQPM407,
Assigned Frequencies: 6137.92 MHz, 6137.92 MHz, 6137.92 MHz, 6137.92 MHz, 6137.92 MHz, 6137.92 MHz, Grant Date: 06/27/2012, Expiration Date: 06/27/2022, Cancellation Date: 03/29/2022, Certifier: Gregory M Romano, Registrant: Verizon, 1300 I St Nw - Suite 500 East, Washington, DC 20005, Phone: (202) 515-2453, Email:
- NTHW IA 01, 4576 Kingfisher Avenue (Lat: 43.427611 Lon: -93.289778), Type: Gtower, Structure height: 60.4 m, Call Sign: WHC791,
Assigned Frequencies: 6775.00 MHz, 6785.00 MHz, 5974.85 MHz, 6034.15 MHz, 5974.85 MHz, 6034.15 MHz, 5974.85 MHz, 6034.15 MHz, 5974.85 MHz, 6034.15 MHz... (+3 more), Grant Date: 01/15/2020, Expiration Date: 02/15/2030, Registrant: Concentrix, 222 So 15th St., Suite 505n, Omaha, NE 68102, Phone: (402) 262-4785, Email:
FCC Registered Amateur Radio Licenses:
13 (See the full list of FCC Registered Amateur Radio Licenses in Northwood)FAA Registered Aircraft:
4- Aircraft: UNDERKOFLER KENNETH B SR QUICKSILVER MX II (Category: Land, Seats: 2, Weight: Up to 12,499 Pounds), Engine: BOMBARDIER ROTAX (ALL) (Reciprocating)
N-Number: 118KU, N118KU, N-118KU, Serial Number: 118, Year manufactured: 1989, Airworthiness Date: 12/26/1989, Certificate Issue Date: 10/31/2018
Registrant (Individual): Patrick Maher, 549 500th St, Northwood, IA 50459 - Aircraft: CESSNA 182P (Category: Land, Seats: 4, Weight: Up to 12,499 Pounds, Speed: 120 mph), Engine: CONT MOTOR O-470 SERIES (230 HP) (Reciprocating)
N-Number: 182LW, N182LW, N-182LW, Serial Number: 18261255, Year manufactured: 1972, Airworthiness Date: 06/29/1972, Certificate Issue Date: 03/27/2012
Registrant (Individual): Rodney R Loken, 4763 Jonquil Ave, Northwood, IA 50459 - Aircraft: CESSNA 182K (Category: Land, Seats: 4, Weight: Up to 12,499 Pounds, Speed: 119 mph), Engine: CONT MOTOR O-470 SERIES (230 HP) (Reciprocating)
N-Number: 2595R, N2595R, N-2595R, Serial Number: 18258295, Year manufactured: 1967, Airworthiness Date: 06/21/1967, Certificate Issue Date: 08/16/1988
Registrant (Individual): Michael E Dierenfeld, 4646 Mallard Avenue, Northwood, IA 50459 - Aircraft: VAVRA ROGER L ZODIAC 601XL (Category: Land, Seats: 2, Weight: Up to 12,499 Pounds), Engine: LYCOMING O-235-C1B (115 HP) (Reciprocating)
N-Number: 601VL, N601VL, N-601VL, Serial Number: 6-5093, Year manufactured: 2009, Airworthiness Date: 07/19/2009, Certificate Issue Date: 07/07/2014
Registrant (Co-Owned): Mark E Beal, 1747 430th St, Northwood, IA 50459, Other Owners: Shirley A Beal
2004 - 2017 National Fire Incident Reporting System (NFIRS) incidents
- Fire incident types reported to NFIRS in Northwood, IA
- 9745.5%Outside Fires
- 6430.0%Structure Fires
- 3616.9%Mobile Property/Vehicle Fires
- 167.5%Other
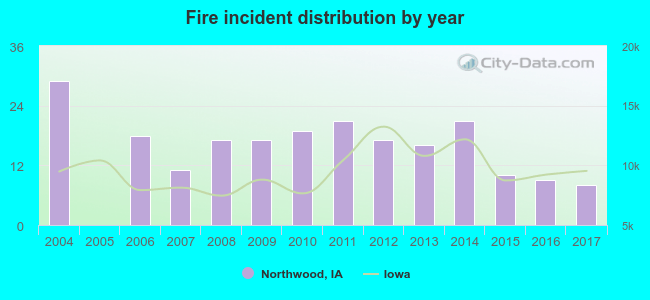 According to the data from the years 2004 - 2017 the average number of fire incidents per year is 15. The highest number of fires - 29 took place in 2004, and the least - 0 in 2005. The data has a declining trend.
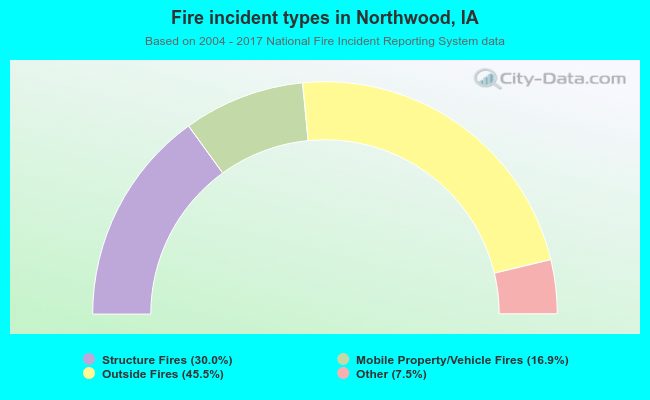 When looking into fire subcategories, the most incidents belonged to: Outside Fires (45.5%), and Structure Fires (30.0%).
Fire-safe hotels and motels in Northwood, Iowa:
- Country Inn And Suites, 711 Diamond Jo Ln, Northwood, Iowa 50459 , Phone: (641) 323-7000, Fax: (641) 323-7412
- Holiday Inn Express & Suites Northwood, 4712 Wheelerwood Rd, Northwood, Iowa 50459 , Phone: (641) 323-7500
| Most common first names in Northwood, IA among deceased individuals | ||
| Name | Count | Lived (average) |
|---|---|---|
| John | 28 | 81.6 years |
| Clarence | 22 | 79.8 years |
| Clara | 17 | 86.3 years |
| William | 16 | 78.6 years |
| George | 15 | 81.8 years |
| Arthur | 15 | 78.8 years |
| Alice | 15 | 83.6 years |
| Mabel | 14 | 79.9 years |
| Carl | 13 | 82.5 years |
| Charles | 13 | 82.2 years |
| Most common last names in Northwood, IA among deceased individuals | ||
| Last name | Count | Lived (average) |
|---|---|---|
| Johnson | 44 | 81.8 years |
| Nelson | 31 | 77.5 years |
| Olson | 27 | 81.3 years |
| Anderson | 23 | 83.4 years |
| Hanson | 23 | 78.9 years |
| Reyerson | 19 | 78.3 years |
| Peterson | 14 | 81.1 years |
| Thompson | 13 | 80.2 years |
| Holstad | 12 | 83.5 years |
| Tenold | 11 | 75.3 years |
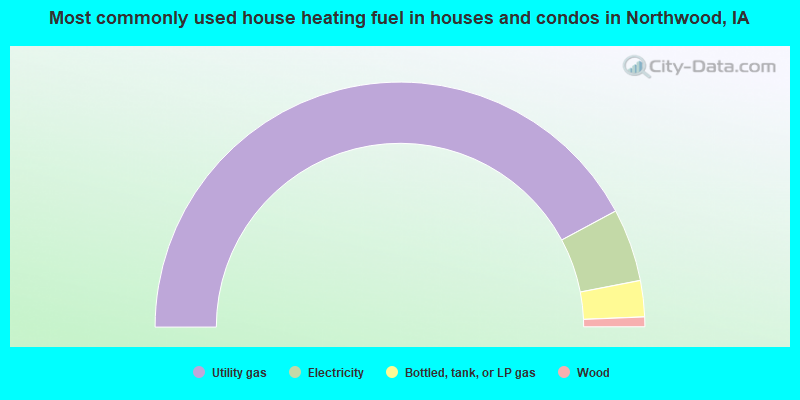
- 84.4%Utility gas
- 9.6%Electricity
- 4.8%Bottled, tank, or LP gas
- 1.3%Wood
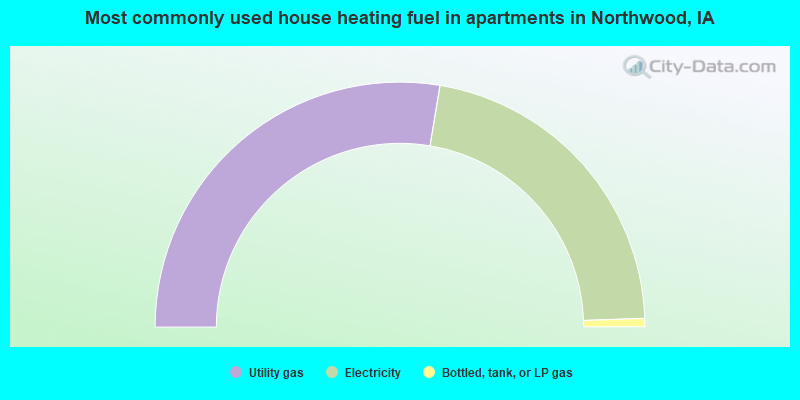
- 55.2%Utility gas
- 43.6%Electricity
- 1.1%Bottled, tank, or LP gas
Northwood compared to Iowa state average:
- Unemployed percentage significantly below state average.
- Black race population percentage significantly below state average.
- Hispanic race population percentage below state average.
- Foreign-born population percentage significantly below state average.
- Length of stay since moving in significantly above state average.
- Number of college students below state average.