Parkesburg, Pennsylvania Submit your own pictures of this borough and show them to the world
OSM Map
General Map
Google Map
MSN Map
OSM Map
General Map
Google Map
MSN Map
OSM Map
General Map
Google Map
MSN Map
OSM Map
General Map
Google Map
MSN Map
Please wait while loading the map...
Population in 2022: 3,934 (100% urban, 0% rural). Population change since 2000: +16.6%Males: 1,891 Females: 2,043
March 2022 cost of living index in Parkesburg: 102.2 (near average, U.S. average is 100) Percentage of residents living in poverty in 2022: 10.0%for White Non-Hispanic residents , 26.8% for Black residents , 8.9% for Hispanic or Latino residents , 23.0% for two or more races residents )
Profiles of local businesses
Business Search - 14 Million verified businesses
Data:
Median household income ($)
Median household income (% change since 2000)
Household income diversity
Ratio of average income to average house value (%)
Ratio of average income to average rent
Median household income ($) - White
Median household income ($) - Black or African American
Median household income ($) - Asian
Median household income ($) - Hispanic or Latino
Median household income ($) - American Indian and Alaska Native
Median household income ($) - Multirace
Median household income ($) - Other Race
Median household income for houses/condos with a mortgage ($)
Median household income for apartments without a mortgage ($)
Races - White alone (%)
Races - White alone (% change since 2000)
Races - Black alone (%)
Races - Black alone (% change since 2000)
Races - American Indian alone (%)
Races - American Indian alone (% change since 2000)
Races - Asian alone (%)
Races - Asian alone (% change since 2000)
Races - Hispanic (%)
Races - Hispanic (% change since 2000)
Races - Native Hawaiian and Other Pacific Islander alone (%)
Races - Native Hawaiian and Other Pacific Islander alone (% change since 2000)
Races - Two or more races (%)
Races - Two or more races (% change since 2000)
Races - Other race alone (%)
Races - Other race alone (% change since 2000)
Racial diversity
Unemployment (%)
Unemployment (% change since 2000)
Unemployment (%) - White
Unemployment (%) - Black or African American
Unemployment (%) - Asian
Unemployment (%) - Hispanic or Latino
Unemployment (%) - American Indian and Alaska Native
Unemployment (%) - Multirace
Unemployment (%) - Other Race
Population density (people per square mile)
Population - Males (%)
Population - Females (%)
Population - Males (%) - White
Population - Males (%) - Black or African American
Population - Males (%) - Asian
Population - Males (%) - Hispanic or Latino
Population - Males (%) - American Indian and Alaska Native
Population - Males (%) - Multirace
Population - Males (%) - Other Race
Population - Females (%) - White
Population - Females (%) - Black or African American
Population - Females (%) - Asian
Population - Females (%) - Hispanic or Latino
Population - Females (%) - American Indian and Alaska Native
Population - Females (%) - Multirace
Population - Females (%) - Other Race
Coronavirus confirmed cases (Apr 28, 2024)
Deaths caused by coronavirus (Apr 28, 2024)
Coronavirus confirmed cases (per 100k population) (Apr 28, 2024)
Deaths caused by coronavirus (per 100k population) (Apr 28, 2024)
Daily increase in number of cases (Apr 28, 2024)
Weekly increase in number of cases (Apr 28, 2024)
Cases doubled (in days) (Apr 28, 2024)
Hospitalized patients (Apr 18, 2022)
Negative test results (Apr 18, 2022)
Total test results (Apr 18, 2022)
COVID Vaccine doses distributed (per 100k population) (Sep 19, 2023)
COVID Vaccine doses administered (per 100k population) (Sep 19, 2023)
COVID Vaccine doses distributed (Sep 19, 2023)
COVID Vaccine doses administered (Sep 19, 2023)
Likely homosexual households (%)
Likely homosexual households (% change since 2000)
Likely homosexual households - Lesbian couples (%)
Likely homosexual households - Lesbian couples (% change since 2000)
Likely homosexual households - Gay men (%)
Likely homosexual households - Gay men (% change since 2000)
Cost of living index
Median gross rent ($)
Median contract rent ($)
Median monthly housing costs ($)
Median house or condo value ($)
Median house or condo value ($ change since 2000)
Mean house or condo value by units in structure - 1, detached ($)
Mean house or condo value by units in structure - 1, attached ($)
Mean house or condo value by units in structure - 2 ($)
Mean house or condo value by units in structure by units in structure - 3 or 4 ($)
Mean house or condo value by units in structure - 5 or more ($)
Mean house or condo value by units in structure - Boat, RV, van, etc. ($)
Mean house or condo value by units in structure - Mobile home ($)
Median house or condo value ($) - White
Median house or condo value ($) - Black or African American
Median house or condo value ($) - Asian
Median house or condo value ($) - Hispanic or Latino
Median house or condo value ($) - American Indian and Alaska Native
Median house or condo value ($) - Multirace
Median house or condo value ($) - Other Race
Median resident age
Resident age diversity
Median resident age - Males
Median resident age - Females
Median resident age - White
Median resident age - Black or African American
Median resident age - Asian
Median resident age - Hispanic or Latino
Median resident age - American Indian and Alaska Native
Median resident age - Multirace
Median resident age - Other Race
Median resident age - Males - White
Median resident age - Males - Black or African American
Median resident age - Males - Asian
Median resident age - Males - Hispanic or Latino
Median resident age - Males - American Indian and Alaska Native
Median resident age - Males - Multirace
Median resident age - Males - Other Race
Median resident age - Females - White
Median resident age - Females - Black or African American
Median resident age - Females - Asian
Median resident age - Females - Hispanic or Latino
Median resident age - Females - American Indian and Alaska Native
Median resident age - Females - Multirace
Median resident age - Females - Other Race
Commute - mean travel time to work (minutes)
Travel time to work - Less than 5 minutes (%)
Travel time to work - Less than 5 minutes (% change since 2000)
Travel time to work - 5 to 9 minutes (%)
Travel time to work - 5 to 9 minutes (% change since 2000)
Travel time to work - 10 to 19 minutes (%)
Travel time to work - 10 to 19 minutes (% change since 2000)
Travel time to work - 20 to 29 minutes (%)
Travel time to work - 20 to 29 minutes (% change since 2000)
Travel time to work - 30 to 39 minutes (%)
Travel time to work - 30 to 39 minutes (% change since 2000)
Travel time to work - 40 to 59 minutes (%)
Travel time to work - 40 to 59 minutes (% change since 2000)
Travel time to work - 60 to 89 minutes (%)
Travel time to work - 60 to 89 minutes (% change since 2000)
Travel time to work - 90 or more minutes (%)
Travel time to work - 90 or more minutes (% change since 2000)
Marital status - Never married (%)
Marital status - Now married (%)
Marital status - Separated (%)
Marital status - Widowed (%)
Marital status - Divorced (%)
Median family income ($)
Median family income (% change since 2000)
Median non-family income ($)
Median non-family income (% change since 2000)
Median per capita income ($)
Median per capita income (% change since 2000)
Median family income ($) - White
Median family income ($) - Black or African American
Median family income ($) - Asian
Median family income ($) - Hispanic or Latino
Median family income ($) - American Indian and Alaska Native
Median family income ($) - Multirace
Median family income ($) - Other Race
Median year house/condo built
Median year apartment built
Year house built - Built 2005 or later (%)
Year house built - Built 2000 to 2004 (%)
Year house built - Built 1990 to 1999 (%)
Year house built - Built 1980 to 1989 (%)
Year house built - Built 1970 to 1979 (%)
Year house built - Built 1960 to 1969 (%)
Year house built - Built 1950 to 1959 (%)
Year house built - Built 1940 to 1949 (%)
Year house built - Built 1939 or earlier (%)
Average household size
Household density (households per square mile)
Average household size - White
Average household size - Black or African American
Average household size - Asian
Average household size - Hispanic or Latino
Average household size - American Indian and Alaska Native
Average household size - Multirace
Average household size - Other Race
Occupied housing units (%)
Vacant housing units (%)
Owner occupied housing units (%)
Renter occupied housing units (%)
Vacancy status - For rent (%)
Vacancy status - For sale only (%)
Vacancy status - Rented or sold, not occupied (%)
Vacancy status - For seasonal, recreational, or occasional use (%)
Vacancy status - For migrant workers (%)
Vacancy status - Other vacant (%)
Residents with income below the poverty level (%)
Residents with income below 50% of the poverty level (%)
Children below poverty level (%)
Poor families by family type - Married-couple family (%)
Poor families by family type - Male, no wife present (%)
Poor families by family type - Female, no husband present (%)
Poverty status for native-born residents (%)
Poverty status for foreign-born residents (%)
Poverty among high school graduates not in families (%)
Poverty among people who did not graduate high school not in families (%)
Residents with income below the poverty level (%) - White
Residents with income below the poverty level (%) - Black or African American
Residents with income below the poverty level (%) - Asian
Residents with income below the poverty level (%) - Hispanic or Latino
Residents with income below the poverty level (%) - American Indian and Alaska Native
Residents with income below the poverty level (%) - Multirace
Residents with income below the poverty level (%) - Other Race
Air pollution - Air Quality Index (AQI)
Air pollution - CO
Air pollution - NO2
Air pollution - SO2
Air pollution - Ozone
Air pollution - PM10
Air pollution - PM25
Air pollution - Pb
Crime - Murders per 100,000 population
Crime - Rapes per 100,000 population
Crime - Robberies per 100,000 population
Crime - Assaults per 100,000 population
Crime - Burglaries per 100,000 population
Crime - Thefts per 100,000 population
Crime - Auto thefts per 100,000 population
Crime - Arson per 100,000 population
Crime - City-data.com crime index
Crime - Violent crime index
Crime - Property crime index
Crime - Murders per 100,000 population (5 year average)
Crime - Rapes per 100,000 population (5 year average)
Crime - Robberies per 100,000 population (5 year average)
Crime - Assaults per 100,000 population (5 year average)
Crime - Burglaries per 100,000 population (5 year average)
Crime - Thefts per 100,000 population (5 year average)
Crime - Auto thefts per 100,000 population (5 year average)
Crime - Arson per 100,000 population (5 year average)
Crime - City-data.com crime index (5 year average)
Crime - Violent crime index (5 year average)
Crime - Property crime index (5 year average)
1996 Presidential Elections Results (%) - Democratic Party (Clinton)
1996 Presidential Elections Results (%) - Republican Party (Dole)
1996 Presidential Elections Results (%) - Other
2000 Presidential Elections Results (%) - Democratic Party (Gore)
2000 Presidential Elections Results (%) - Republican Party (Bush)
2000 Presidential Elections Results (%) - Other
2004 Presidential Elections Results (%) - Democratic Party (Kerry)
2004 Presidential Elections Results (%) - Republican Party (Bush)
2004 Presidential Elections Results (%) - Other
2008 Presidential Elections Results (%) - Democratic Party (Obama)
2008 Presidential Elections Results (%) - Republican Party (McCain)
2008 Presidential Elections Results (%) - Other
2012 Presidential Elections Results (%) - Democratic Party (Obama)
2012 Presidential Elections Results (%) - Republican Party (Romney)
2012 Presidential Elections Results (%) - Other
2016 Presidential Elections Results (%) - Democratic Party (Clinton)
2016 Presidential Elections Results (%) - Republican Party (Trump)
2016 Presidential Elections Results (%) - Other
2020 Presidential Elections Results (%) - Democratic Party (Biden)
2020 Presidential Elections Results (%) - Republican Party (Trump)
2020 Presidential Elections Results (%) - Other
Ancestries Reported - Arab (%)
Ancestries Reported - Czech (%)
Ancestries Reported - Danish (%)
Ancestries Reported - Dutch (%)
Ancestries Reported - English (%)
Ancestries Reported - French (%)
Ancestries Reported - French Canadian (%)
Ancestries Reported - German (%)
Ancestries Reported - Greek (%)
Ancestries Reported - Hungarian (%)
Ancestries Reported - Irish (%)
Ancestries Reported - Italian (%)
Ancestries Reported - Lithuanian (%)
Ancestries Reported - Norwegian (%)
Ancestries Reported - Polish (%)
Ancestries Reported - Portuguese (%)
Ancestries Reported - Russian (%)
Ancestries Reported - Scotch-Irish (%)
Ancestries Reported - Scottish (%)
Ancestries Reported - Slovak (%)
Ancestries Reported - Subsaharan African (%)
Ancestries Reported - Swedish (%)
Ancestries Reported - Swiss (%)
Ancestries Reported - Ukrainian (%)
Ancestries Reported - United States (%)
Ancestries Reported - Welsh (%)
Ancestries Reported - West Indian (%)
Ancestries Reported - Other (%)
Educational Attainment - No schooling completed (%)
Educational Attainment - Less than high school (%)
Educational Attainment - High school or equivalent (%)
Educational Attainment - Less than 1 year of college (%)
Educational Attainment - 1 or more years of college (%)
Educational Attainment - Associate degree (%)
Educational Attainment - Bachelor's degree (%)
Educational Attainment - Master's degree (%)
Educational Attainment - Professional school degree (%)
Educational Attainment - Doctorate degree (%)
School Enrollment - Nursery, preschool (%)
School Enrollment - Kindergarten (%)
School Enrollment - Grade 1 to 4 (%)
School Enrollment - Grade 5 to 8 (%)
School Enrollment - Grade 9 to 12 (%)
School Enrollment - College undergrad (%)
School Enrollment - Graduate or professional (%)
School Enrollment - Not enrolled in school (%)
School enrollment - Public schools (%)
School enrollment - Private schools (%)
School enrollment - Not enrolled (%)
Median number of rooms in houses and condos
Median number of rooms in apartments
Housing units lacking complete plumbing facilities (%)
Housing units lacking complete kitchen facilities (%)
Density of houses
Urban houses (%)
Rural houses (%)
Households with people 60 years and over (%)
Households with people 65 years and over (%)
Households with people 75 years and over (%)
Households with one or more nonrelatives (%)
Households with no nonrelatives (%)
Population in households (%)
Family households (%)
Nonfamily households (%)
Population in families (%)
Family households with own children (%)
Median number of bedrooms in owner occupied houses
Mean number of bedrooms in owner occupied houses
Median number of bedrooms in renter occupied houses
Mean number of bedrooms in renter occupied houses
Median number of vehichles in owner occupied houses
Mean number of vehichles in owner occupied houses
Median number of vehichles in renter occupied houses
Mean number of vehichles in renter occupied houses
Mortgage status - with mortgage (%)
Mortgage status - with second mortgage (%)
Mortgage status - with home equity loan (%)
Mortgage status - with both second mortgage and home equity loan (%)
Mortgage status - without a mortgage (%)
Average family size
Average family size - White
Average family size - Black or African American
Average family size - Asian
Average family size - Hispanic or Latino
Average family size - American Indian and Alaska Native
Average family size - Multirace
Average family size - Other Race
Geographical mobility - Same house 1 year ago (%)
Geographical mobility - Moved within same county (%)
Geographical mobility - Moved from different county within same state (%)
Geographical mobility - Moved from different state (%)
Geographical mobility - Moved from abroad (%)
Place of birth - Born in state of residence (%)
Place of birth - Born in other state (%)
Place of birth - Native, outside of US (%)
Place of birth - Foreign born (%)
Housing units in structures - 1, detached (%)
Housing units in structures - 1, attached (%)
Housing units in structures - 2 (%)
Housing units in structures - 3 or 4 (%)
Housing units in structures - 5 to 9 (%)
Housing units in structures - 10 to 19 (%)
Housing units in structures - 20 to 49 (%)
Housing units in structures - 50 or more (%)
Housing units in structures - Mobile home (%)
Housing units in structures - Boat, RV, van, etc. (%)
House/condo owner moved in on average (years ago)
Renter moved in on average (years ago)
Year householder moved into unit - Moved in 1999 to March 2000 (%)
Year householder moved into unit - Moved in 1995 to 1998 (%)
Year householder moved into unit - Moved in 1990 to 1994 (%)
Year householder moved into unit - Moved in 1980 to 1989 (%)
Year householder moved into unit - Moved in 1970 to 1979 (%)
Year householder moved into unit - Moved in 1969 or earlier (%)
Means of transportation to work - Drove car alone (%)
Means of transportation to work - Carpooled (%)
Means of transportation to work - Public transportation (%)
Means of transportation to work - Bus or trolley bus (%)
Means of transportation to work - Streetcar or trolley car (%)
Means of transportation to work - Subway or elevated (%)
Means of transportation to work - Railroad (%)
Means of transportation to work - Ferryboat (%)
Means of transportation to work - Taxicab (%)
Means of transportation to work - Motorcycle (%)
Means of transportation to work - Bicycle (%)
Means of transportation to work - Walked (%)
Means of transportation to work - Other means (%)
Working at home (%)
Industry diversity
Most Common Industries - Agriculture, forestry, fishing and hunting, and mining (%)
Most Common Industries - Agriculture, forestry, fishing and hunting (%)
Most Common Industries - Mining, quarrying, and oil and gas extraction (%)
Most Common Industries - Construction (%)
Most Common Industries - Manufacturing (%)
Most Common Industries - Wholesale trade (%)
Most Common Industries - Retail trade (%)
Most Common Industries - Transportation and warehousing, and utilities (%)
Most Common Industries - Transportation and warehousing (%)
Most Common Industries - Utilities (%)
Most Common Industries - Information (%)
Most Common Industries - Finance and insurance, and real estate and rental and leasing (%)
Most Common Industries - Finance and insurance (%)
Most Common Industries - Real estate and rental and leasing (%)
Most Common Industries - Professional, scientific, and management, and administrative and waste management services (%)
Most Common Industries - Professional, scientific, and technical services (%)
Most Common Industries - Management of companies and enterprises (%)
Most Common Industries - Administrative and support and waste management services (%)
Most Common Industries - Educational services, and health care and social assistance (%)
Most Common Industries - Educational services (%)
Most Common Industries - Health care and social assistance (%)
Most Common Industries - Arts, entertainment, and recreation, and accommodation and food services (%)
Most Common Industries - Arts, entertainment, and recreation (%)
Most Common Industries - Accommodation and food services (%)
Most Common Industries - Other services, except public administration (%)
Most Common Industries - Public administration (%)
Occupation diversity
Most Common Occupations - Management, business, science, and arts occupations (%)
Most Common Occupations - Management, business, and financial occupations (%)
Most Common Occupations - Management occupations (%)
Most Common Occupations - Business and financial operations occupations (%)
Most Common Occupations - Computer, engineering, and science occupations (%)
Most Common Occupations - Computer and mathematical occupations (%)
Most Common Occupations - Architecture and engineering occupations (%)
Most Common Occupations - Life, physical, and social science occupations (%)
Most Common Occupations - Education, legal, community service, arts, and media occupations (%)
Most Common Occupations - Community and social service occupations (%)
Most Common Occupations - Legal occupations (%)
Most Common Occupations - Education, training, and library occupations (%)
Most Common Occupations - Arts, design, entertainment, sports, and media occupations (%)
Most Common Occupations - Healthcare practitioners and technical occupations (%)
Most Common Occupations - Health diagnosing and treating practitioners and other technical occupations (%)
Most Common Occupations - Health technologists and technicians (%)
Most Common Occupations - Service occupations (%)
Most Common Occupations - Healthcare support occupations (%)
Most Common Occupations - Protective service occupations (%)
Most Common Occupations - Fire fighting and prevention, and other protective service workers including supervisors (%)
Most Common Occupations - Law enforcement workers including supervisors (%)
Most Common Occupations - Food preparation and serving related occupations (%)
Most Common Occupations - Building and grounds cleaning and maintenance occupations (%)
Most Common Occupations - Personal care and service occupations (%)
Most Common Occupations - Sales and office occupations (%)
Most Common Occupations - Sales and related occupations (%)
Most Common Occupations - Office and administrative support occupations (%)
Most Common Occupations - Natural resources, construction, and maintenance occupations (%)
Most Common Occupations - Farming, fishing, and forestry occupations (%)
Most Common Occupations - Construction and extraction occupations (%)
Most Common Occupations - Installation, maintenance, and repair occupations (%)
Most Common Occupations - Production, transportation, and material moving occupations (%)
Most Common Occupations - Production occupations (%)
Most Common Occupations - Transportation occupations (%)
Most Common Occupations - Material moving occupations (%)
People in Group quarters - Institutionalized population (%)
People in Group quarters - Correctional institutions (%)
People in Group quarters - Federal prisons and detention centers (%)
People in Group quarters - Halfway houses (%)
People in Group quarters - Local jails and other confinement facilities (including police lockups) (%)
People in Group quarters - Military disciplinary barracks (%)
People in Group quarters - State prisons (%)
People in Group quarters - Other types of correctional institutions (%)
People in Group quarters - Nursing homes (%)
People in Group quarters - Hospitals/wards, hospices, and schools for the handicapped (%)
People in Group quarters - Hospitals/wards and hospices for chronically ill (%)
People in Group quarters - Hospices or homes for chronically ill (%)
People in Group quarters - Military hospitals or wards for chronically ill (%)
People in Group quarters - Other hospitals or wards for chronically ill (%)
People in Group quarters - Hospitals or wards for drug/alcohol abuse (%)
People in Group quarters - Mental (Psychiatric) hospitals or wards (%)
People in Group quarters - Schools, hospitals, or wards for the mentally retarded (%)
People in Group quarters - Schools, hospitals, or wards for the physically handicapped (%)
People in Group quarters - Institutions for the deaf (%)
People in Group quarters - Institutions for the blind (%)
People in Group quarters - Orthopedic wards and institutions for the physically handicapped (%)
People in Group quarters - Wards in general hospitals for patients who have no usual home elsewhere (%)
People in Group quarters - Wards in military hospitals for patients who have no usual home elsewhere (%)
People in Group quarters - Juvenile institutions (%)
People in Group quarters - Long-term care (%)
People in Group quarters - Homes for abused, dependent, and neglected children (%)
People in Group quarters - Residential treatment centers for emotionally disturbed children (%)
People in Group quarters - Training schools for juvenile delinquents (%)
People in Group quarters - Short-term care, detention or diagnostic centers for delinquent children (%)
People in Group quarters - Type of juvenile institution unknown (%)
People in Group quarters - Noninstitutionalized population (%)
People in Group quarters - College dormitories (includes college quarters off campus) (%)
People in Group quarters - Military quarters (%)
People in Group quarters - On base (%)
People in Group quarters - Barracks, unaccompanied personnel housing (UPH), (Enlisted/Officer), ;and similar group living quarters for military personnel (%)
People in Group quarters - Transient quarters for temporary residents (%)
People in Group quarters - Military ships (%)
People in Group quarters - Group homes (%)
People in Group quarters - Homes or halfway houses for drug/alcohol abuse (%)
People in Group quarters - Homes for the mentally ill (%)
People in Group quarters - Homes for the mentally retarded (%)
People in Group quarters - Homes for the physically handicapped (%)
People in Group quarters - Other group homes (%)
People in Group quarters - Religious group quarters (%)
People in Group quarters - Dormitories (%)
People in Group quarters - Agriculture workers' dormitories on farms (%)
People in Group quarters - Job Corps and vocational training facilities (%)
People in Group quarters - Other workers' dormitories (%)
People in Group quarters - Crews of maritime vessels (%)
People in Group quarters - Other nonhousehold living situations (%)
People in Group quarters - Other noninstitutional group quarters (%)
Residents speaking English at home (%)
Residents speaking English at home - Born in the United States (%)
Residents speaking English at home - Native, born elsewhere (%)
Residents speaking English at home - Foreign born (%)
Residents speaking Spanish at home (%)
Residents speaking Spanish at home - Born in the United States (%)
Residents speaking Spanish at home - Native, born elsewhere (%)
Residents speaking Spanish at home - Foreign born (%)
Residents speaking other language at home (%)
Residents speaking other language at home - Born in the United States (%)
Residents speaking other language at home - Native, born elsewhere (%)
Residents speaking other language at home - Foreign born (%)
Class of Workers - Employee of private company (%)
Class of Workers - Self-employed in own incorporated business (%)
Class of Workers - Private not-for-profit wage and salary workers (%)
Class of Workers - Local government workers (%)
Class of Workers - State government workers (%)
Class of Workers - Federal government workers (%)
Class of Workers - Self-employed workers in own not incorporated business and Unpaid family workers (%)
House heating fuel used in houses and condos - Utility gas (%)
House heating fuel used in houses and condos - Bottled, tank, or LP gas (%)
House heating fuel used in houses and condos - Electricity (%)
House heating fuel used in houses and condos - Fuel oil, kerosene, etc. (%)
House heating fuel used in houses and condos - Coal or coke (%)
House heating fuel used in houses and condos - Wood (%)
House heating fuel used in houses and condos - Solar energy (%)
House heating fuel used in houses and condos - Other fuel (%)
House heating fuel used in houses and condos - No fuel used (%)
House heating fuel used in apartments - Utility gas (%)
House heating fuel used in apartments - Bottled, tank, or LP gas (%)
House heating fuel used in apartments - Electricity (%)
House heating fuel used in apartments - Fuel oil, kerosene, etc. (%)
House heating fuel used in apartments - Coal or coke (%)
House heating fuel used in apartments - Wood (%)
House heating fuel used in apartments - Solar energy (%)
House heating fuel used in apartments - Other fuel (%)
House heating fuel used in apartments - No fuel used (%)
Armed forces status - In Armed Forces (%)
Armed forces status - Civilian (%)
Armed forces status - Civilian - Veteran (%)
Armed forces status - Civilian - Nonveteran (%)
Fatal accidents locations in years 2005-2021
Fatal accidents locations in 2005
Fatal accidents locations in 2006
Fatal accidents locations in 2007
Fatal accidents locations in 2008
Fatal accidents locations in 2009
Fatal accidents locations in 2010
Fatal accidents locations in 2011
Fatal accidents locations in 2012
Fatal accidents locations in 2013
Fatal accidents locations in 2014
Fatal accidents locations in 2015
Fatal accidents locations in 2016
Fatal accidents locations in 2017
Fatal accidents locations in 2018
Fatal accidents locations in 2019
Fatal accidents locations in 2020
Fatal accidents locations in 2021
Alcohol use - People drinking some alcohol every month (%)
Alcohol use - People not drinking at all (%)
Alcohol use - Average days/month drinking alcohol
Alcohol use - Average drinks/week
Alcohol use - Average days/year people drink much
Audiometry - Average condition of hearing (%)
Audiometry - People that can hear a whisper from across a quiet room (%)
Audiometry - People that can hear normal voice from across a quiet room (%)
Audiometry - Ears ringing, roaring, buzzing (%)
Audiometry - Had a job exposure to loud noise (%)
Audiometry - Had off-work exposure to loud noise (%)
Blood Pressure & Cholesterol - Has high blood pressure (%)
Blood Pressure & Cholesterol - Checking blood pressure at home (%)
Blood Pressure & Cholesterol - Frequently checking blood cholesterol (%)
Blood Pressure & Cholesterol - Has high cholesterol level (%)
Consumer Behavior - Money monthly spent on food at supermarket/grocery store
Consumer Behavior - Money monthly spent on food at other stores
Consumer Behavior - Money monthly spent on eating out
Consumer Behavior - Money monthly spent on carryout/delivered foods
Consumer Behavior - Income spent on food at supermarket/grocery store (%)
Consumer Behavior - Income spent on food at other stores (%)
Consumer Behavior - Income spent on eating out (%)
Consumer Behavior - Income spent on carryout/delivered foods (%)
Current Health Status - General health condition (%)
Current Health Status - Blood donors (%)
Current Health Status - Has blood ever tested for HIV virus (%)
Current Health Status - Left-handed people (%)
Dermatology - People using sunscreen (%)
Diabetes - Diabetics (%)
Diabetes - Had a blood test for high blood sugar (%)
Diabetes - People taking insulin (%)
Diet Behavior & Nutrition - Diet health (%)
Diet Behavior & Nutrition - Milk product consumption (# of products/month)
Diet Behavior & Nutrition - Meals not home prepared (#/week)
Diet Behavior & Nutrition - Meals from fast food or pizza place (#/week)
Diet Behavior & Nutrition - Ready-to-eat foods (#/month)
Diet Behavior & Nutrition - Frozen meals/pizza (#/month)
Drug Use - People that ever used marijuana or hashish (%)
Drug Use - Ever used hard drugs (%)
Drug Use - Ever used any form of cocaine (%)
Drug Use - Ever used heroin (%)
Drug Use - Ever used methamphetamine (%)
Health Insurance - People covered by health insurance (%)
Kidney Conditions-Urology - Avg. # of times urinating at night
Medical Conditions - People with asthma (%)
Medical Conditions - People with anemia (%)
Medical Conditions - People with psoriasis (%)
Medical Conditions - People with overweight (%)
Medical Conditions - Elderly people having difficulties in thinking or remembering (%)
Medical Conditions - People who ever received blood transfusion (%)
Medical Conditions - People having trouble seeing even with glass/contacts (%)
Medical Conditions - People with arthritis (%)
Medical Conditions - People with gout (%)
Medical Conditions - People with congestive heart failure (%)
Medical Conditions - People with coronary heart disease (%)
Medical Conditions - People with angina pectoris (%)
Medical Conditions - People who ever had heart attack (%)
Medical Conditions - People who ever had stroke (%)
Medical Conditions - People with emphysema (%)
Medical Conditions - People with thyroid problem (%)
Medical Conditions - People with chronic bronchitis (%)
Medical Conditions - People with any liver condition (%)
Medical Conditions - People who ever had cancer or malignancy (%)
Mental Health - People who have little interest in doing things (%)
Mental Health - People feeling down, depressed, or hopeless (%)
Mental Health - People who have trouble sleeping or sleeping too much (%)
Mental Health - People feeling tired or having little energy (%)
Mental Health - People with poor appetite or overeating (%)
Mental Health - People feeling bad about themself (%)
Mental Health - People who have trouble concentrating on things (%)
Mental Health - People moving or speaking slowly or too fast (%)
Mental Health - People having thoughts they would be better off dead (%)
Oral Health - Average years since last visit a dentist
Oral Health - People embarrassed because of mouth (%)
Oral Health - People with gum disease (%)
Oral Health - General health of teeth and gums (%)
Oral Health - Average days a week using dental floss/device
Oral Health - Average days a week using mouthwash for dental problem
Oral Health - Average number of teeth
Pesticide Use - Households using pesticides to control insects (%)
Pesticide Use - Households using pesticides to kill weeds (%)
Physical Activity - People doing vigorous-intensity work activities (%)
Physical Activity - People doing moderate-intensity work activities (%)
Physical Activity - People walking or bicycling (%)
Physical Activity - People doing vigorous-intensity recreational activities (%)
Physical Activity - People doing moderate-intensity recreational activities (%)
Physical Activity - Average hours a day doing sedentary activities
Physical Activity - Average hours a day watching TV or videos
Physical Activity - Average hours a day using computer
Physical Functioning - People having limitations keeping them from working (%)
Physical Functioning - People limited in amount of work they can do (%)
Physical Functioning - People that need special equipment to walk (%)
Physical Functioning - People experiencing confusion/memory problems (%)
Physical Functioning - People requiring special healthcare equipment (%)
Prescription Medications - Average number of prescription medicines taking
Preventive Aspirin Use - Adults 40+ taking low-dose aspirin (%)
Reproductive Health - Vaginal deliveries (%)
Reproductive Health - Cesarean deliveries (%)
Reproductive Health - Deliveries resulted in a live birth (%)
Reproductive Health - Pregnancies resulted in a delivery (%)
Reproductive Health - Women breastfeeding newborns (%)
Reproductive Health - Women that had a hysterectomy (%)
Reproductive Health - Women that had both ovaries removed (%)
Reproductive Health - Women that have ever taken birth control pills (%)
Reproductive Health - Women taking birth control pills (%)
Reproductive Health - Women that have ever used Depo-Provera or injectables (%)
Reproductive Health - Women that have ever used female hormones (%)
Sexual Behavior - People 18+ that ever had sex (vaginal, anal, or oral) (%)
Sexual Behavior - Males 18+ that ever had vaginal sex with a woman (%)
Sexual Behavior - Males 18+ that ever performed oral sex on a woman (%)
Sexual Behavior - Males 18+ that ever had anal sex with a woman (%)
Sexual Behavior - Males 18+ that ever had any sex with a man (%)
Sexual Behavior - Females 18+ that ever had vaginal sex with a man (%)
Sexual Behavior - Females 18+ that ever performed oral sex on a man (%)
Sexual Behavior - Females 18+ that ever had anal sex with a man (%)
Sexual Behavior - Females 18+ that ever had any kind of sex with a woman (%)
Sexual Behavior - Average age people first had sex
Sexual Behavior - Average number of female sex partners in lifetime (males 18+)
Sexual Behavior - Average number of female vaginal sex partners in lifetime (males 18+)
Sexual Behavior - Average age people first performed oral sex on a woman (18+)
Sexual Behavior - Average number of woman performed oral sex on in lifetime (18+)
Sexual Behavior - Average number of male sex partners in lifetime (males 18+)
Sexual Behavior - Average number of male anal sex partners in lifetime (males 18+)
Sexual Behavior - Average age people first performed oral sex on a man (18+)
Sexual Behavior - Average number of male oral sex partners in lifetime (18+)
Sexual Behavior - People using protection when performing oral sex (%)
Sexual Behavior - Average number of times people have vaginal or anal sex a year
Sexual Behavior - People having sex without condom (%)
Sexual Behavior - Average number of male sex partners in lifetime (females 18+)
Sexual Behavior - Average number of male vaginal sex partners in lifetime (females 18+)
Sexual Behavior - Average number of female sex partners in lifetime (females 18+)
Sexual Behavior - Circumcised males 18+ (%)
Sleep Disorders - Average hours sleeping at night
Sleep Disorders - People that has trouble sleeping (%)
Smoking-Cigarette Use - People smoking cigarettes (%)
Taste & Smell - People 40+ having problems with smell (%)
Taste & Smell - People 40+ having problems with taste (%)
Taste & Smell - People 40+ that ever had wisdom teeth removed (%)
Taste & Smell - People 40+ that ever had tonsils teeth removed (%)
Taste & Smell - People 40+ that ever had a loss of consciousness because of a head injury (%)
Taste & Smell - People 40+ that ever had a broken nose or other serious injury to face or skull (%)
Taste & Smell - People 40+ that ever had two or more sinus infections (%)
Weight - Average height (inches)
Weight - Average weight (pounds)
Weight - Average BMI
Weight - People that are obese (%)
Weight - People that ever were obese (%)
Weight - People trying to lose weight (%)
Officers per 1,000 residents here:
1.30Pennsylvania average:
2.55
Latest news from Parkesburg, PA collected exclusively by city-data.com from local newspapers, TV, and radio stations
Ancestries: American (14.0%), German (10.6%), Italian (7.5%), Irish (7.4%), English (2.8%), Scottish (2.5%).
Current Local Time:
Incorporated on 03/01/1872
Land area: 1.25 square miles.
Population density: 3,157 people per square mile (average).
297 residents are foreign born (4.7% Latin America , 2.6% Asia ).
This borough:
7.5%Pennsylvania:
7.3%
Median real estate property taxes paid for housing units with mortgages in 2022: $5,991 (2.4%)Median real estate property taxes paid for housing units with no mortgage in 2022: $5,012 (2.0%)
Nearest city with pop. 50,000+: Lancaster, PA
Nearest city with pop. 200,000+: Philadelphia, PA
Nearest cities:
Latitude: 39.96 N, Longitude: 75.92 W
Unemployment in December 2023: Here:
2.1%Pennsylvania:
2.9%
Population change in the 1990s: +349 (+11.5%).
Most common occupations in Parkesburg, PA (%)
Both Males Females
Other office and administrative support workers, including supervisors (5.5%)
Material recording, scheduling, dispatching, and distributing workers (5.0%)
Building and grounds cleaning and maintenance occupations (4.5%)
Secretaries and administrative assistants (4.1%)
Other sales and related occupations, including supervisors (3.6%)
Driver/sales workers and truck drivers (3.6%)
Laborers and material movers, hand (3.5%)
Material recording, scheduling, dispatching, and distributing workers (6.7%)
Driver/sales workers and truck drivers (6.3%)
Building and grounds cleaning and maintenance occupations (6.0%)
Electrical equipment mechanics and other installation, maintenance, and repair workers, including supervisors (4.8%)
Laborers and material movers, hand (4.7%)
Other production occupations, including supervisors (4.0%)
Metal workers and plastic workers (3.7%)
Other office and administrative support workers, including supervisors (10.6%)
Secretaries and administrative assistants (8.7%)
Health technologists and technicians (5.1%)
Bookkeeping, accounting, and auditing clerks (4.7%)
Registered nurses (4.3%)
Other sales and related occupations, including supervisors (4.3%)
Cashiers (4.1%)
Tornado activity:
Parkesburg-area historical tornado activity is slightly above Pennsylvania state average. It is 19% greater than the overall U.S. average.
On 7/27/1994, a category F3 (max. wind speeds 158-206 mph) tornado 14.2 miles away from the Parkesburg borough center injured 11 people and caused between $500,000 and $5,000,000 in damages.
On 3/22/1955, a category F3 tornado 15.9 miles away from the borough center killed one person and caused between $50,000 and $500,000 in damages.
Earthquake activity:
Parkesburg-area historical earthquake activity is significantly above Pennsylvania state average. It is 63% smaller than the overall U.S. average. On 8/23/2011 at 17:51:04, a magnitude 5.8 (5.8 MW, Depth: 3.7 mi, Class: Moderate, Intensity: VI - VII) earthquake occurred 178.5 miles away from the city center On 1/16/1994 at 01:49:16, a magnitude 4.6 (4.6 MB, 4.6 LG, Depth: 3.1 mi, Class: Light, Intensity: IV - V) earthquake occurred 26.4 miles away from Parkesburg center On 1/16/1994 at 00:42:43, a magnitude 4.2 (4.2 MB, 4.0 LG, Depth: 3.1 mi) earthquake occurred 25.9 miles away from the city center On 9/25/1998 at 19:52:52, a magnitude 5.2 (4.8 MB, 4.3 MS, 5.2 LG, 4.5 MW, Depth: 3.1 mi) earthquake occurred 257.4 miles away from Parkesburg center On 10/7/1983 at 10:18:46, a magnitude 5.3 (5.1 MB, 5.3 LG, 5.1 ML) earthquake occurred 287.9 miles away from the city center On 11/30/2017 at 21:47:31, a magnitude 4.1 (4.1 MW, Depth: 6.1 mi) earthquake occurred 58.7 miles away from Parkesburg center Magnitude types: regional Lg-wave magnitude (LG), body-wave magnitude (MB), local magnitude (ML), surface-wave magnitude (MS), moment magnitude (MW) Natural disasters: The number of natural disasters in Chester County (23) is greater than the US average (15).Major Disasters (Presidential) Declared: 17Emergencies Declared: 6Floods: 5, Hurricanes: 5, Winter Storms: 5, Storms: 4, Tropical Storms: 4, Snowstorms: 3, Blizzard: 1, Mudslide: 1, Snowfall: 1, Tropical Depression: 1, Water Shortage: 1, Other: 1 (Note: some incidents may be assigned to more than one category). Hospitals and medical centers near Parkesburg: HARRISON SENIOR LIVING OF CHRISTIANA (Nursing Home, about 4 miles away; CHRISTIANA, PA)
TEL HAI RETIREMENT COMMUNITY (Nursing Home, about 8 miles away; HONEY BROOK, PA)
INN AT FREEDOM VILLAGE,THE (Nursing Home, about 8 miles away; WEST BRANDYWINE, PA)
BRANDYWINE HOSPITAL (about 9 miles away; COATESVILLE, PA)
HICKORY HOUSE NURSING HOME (Nursing Home, about 9 miles away; HONEY BROOK, PA)
CHATHAM ACRES (Nursing Home, about 10 miles away; WEST GROVE, PA)
JENNERSVILLE REGIONAL HOSPITAL (about 10 miles away; WEST GROVE, PA)
Amtrak station: PARKESBURG (WEST 1ST & S. CULVERT STS.)
.
Services: public payphones, free short-term parking.
Colleges/universities with over 2000 students nearest to Parkesburg:
Lincoln University of Pennsylvania (about 11 miles; Lincoln University, PA ; Full-time enrollment: 2,042)
Universal Technical Institute of Pennsylvania Inc (about 15 miles; Exton, PA ; FT enrollment: 2,731)
West Chester University of Pennsylvania (about 18 miles; West Chester, PA ; FT enrollment: 14,492)
Immaculata University (about 20 miles; Immaculata, PA ; FT enrollment: 2,912)
University of Delaware (about 22 miles; Newark, DE ; FT enrollment: 20,078)
Franklin and Marshall College (about 22 miles; Lancaster, PA ; FT enrollment: 2,585)
Millersville University of Pennsylvania (about 24 miles; Millersville, PA ; FT enrollment: 7,743)
Private elementary/middle schools in Parkesburg: HIDDEN ACRES SCHOOL Students: 34, Location: 251 SKILES RD, Grades: 1-8)
EDGEWOOD SCHOOL Students: 27, Location: 7647 N MOSCOW RD, Grades: 1-8)BREEZEWOOD AMISH SCHOOL Students: 24, Location: 6138 LIMEVILLE RD, Grades: 1-8)
MAPLE GROVE SCHOOL Students: 24, Location: 5229 STRASBURG RD, Grades: 1-8)
See full list of schools located in Parkesburg Library in Parkesburg: PARKESBURG FREE LIBRARY Operating income: $201,123; Location: 105 WEST ST; 26,866 books ; 1,200 audio materials ; 3,313 video materials ; 29 local licensed databases ; 41 state licensed databases ; 56 print serial subscriptions )
Notable location: (A) . Display/hide its location on the map
Tourist attraction:
Court:
Birthplace of: Pop Corkhill - Baseball player.
Chester County has a predicted average indoor radon screening level greater than 4 pCi/L (pico curies per liter) - Highest Potential Drinking water stations with addresses in Parkesburg and their reported violations in the past:
APPLEVILLE MOBILE HOME PARK (Population served: 450, Groundwater):
Past health violations:
MCL, Monthly (TCR) - In OCT-2010, Contaminant: Coliform. Follow-up actions: St Compliance achieved (DEC-02-2010), St Public Notif received (JUL-18-2011), St Compliance achieved (JUL-18-2011), St Public Notif requested (JUL-18-2011)
MCL, Monthly (TCR) - In DEC-2008, Contaminant: Coliform. Follow-up actions: St Compliance achieved (JAN-30-2009)
Past monitoring violations:
Monitoring, Source Water (GWR) - Between MAY-27-2011 and JUN-27-2011, Contaminant: E. COLI. Follow-up actions: St Violation/Reminder Notice (JUL-07-2011), St Compliance achieved (AUG-10-2011), St Public Notif received (AUG-10-2011)
Monitoring, Source Water (GWR) - In OCT-2010, Contaminant: E. COLI. Follow-up actions: St Compliance achieved (DEC-02-2010)
One minor monitoring violation
Population served: 435, Groundwater):
Past monitoring violations:
One routine major monitoring violation
Population served: 250, Groundwater):
Past health violations:
MCL, Single Sample - Between APR-2008 and JUN-2008, Contaminant: Nitrate. Follow-up actions: St Compliance achieved (JUL-31-2008)
MCL, Single Sample - Between JAN-2008 and DEC-2008, Contaminant: Nitrate. Follow-up actions: St Compliance achieved (MAY-01-2008)
Past monitoring violations:
Monitoring, Check/Repeat/Confirmation - Between APR-2008 and JUN-2008, Contaminant: Nitrate. Follow-up actions: St Compliance achieved (2 times from JUL-31-2008 to JUL-31-2008)
Monitoring, Check/Repeat/Confirmation - Between JAN-2008 and MAR-2008, Contaminant: Nitrate. Follow-up actions: St Compliance achieved (2 times from MAY-01-2008 to MAY-01-2008)
One routine major monitoring violation
2 regular monitoring violations
Population served: 25, Groundwater):
Past monitoring violations:
2 routine major monitoring violations
2 regular monitoring violations
Population served: 25, Groundwater):
Past monitoring violations:
3 routine major monitoring violations
Drinking water stations with addresses in Parkesburg that have no violations reported:
KEYSTONE MOTEL (Population served: 50, Primary Water Source Type: Groundwater)
Average household size: This borough:
2.6 peoplePennsylvania:
2.5 people
Percentage of family households: This borough:
67.5%Whole state:
65.0%
Percentage of households with unmarried partners: This borough:
6.5%Whole state:
6.6%
Likely homosexual households (counted as self-reported same-sex unmarried-partner households)
Lesbian couples: 0.0% of all households Gay men: 0.3% of all households
9 people in group homes intended for adults in 2010People in group quarters in Parkesburg in 2000:
8 people in homes for the mentally retarded
2 people in religious group quarters
2 people in other noninstitutional group quarters
Banks with branches in Parkesburg (2011 data):
Woodforest National Bank: Parkesburg Walmart Branch at 100 Commons Drive, branch established on 2007/07/07. Info updated 2011/05/10: Bank assets: $3,488.9 mil, Deposits: $3,097.6 mil, headquarters in Houston, TX, positive income , Commercial Lending Specialization, 766 total offices , Holding Company: Woodforest Financial Group Employee Stock Ownership Plan (With 401(K) Provisions)
Susquehanna Bank: West Sadsbury Branch at 850 Commons Drive, Route 10 And Route 30, branch established on 2002/04/22. Info updated 2012/02/28: Bank assets: $14,849.0 mil, Deposits: $10,294.4 mil, headquarters in Lititz, PA, positive income , Commercial Lending Specialization, 308 total offices , Holding Company: Susquehanna Bancshares, Inc.
Fulton Bank, National Association: Parkesburg Shopping Center Branch at 100 First Avenue, branch established on 1988/12/10. Info updated 2010/12/30: Bank assets: $9,041.7 mil, Deposits: $6,700.3 mil, headquarters in Lancaster, PA, positive income , Commercial Lending Specialization, 122 total offices , Holding Company: Fulton Financial Corporation
Sovereign Bank, National Association: Parkesburg Branch at 214-226 First Avenue, branch established on 1966/11/10. Info updated 2012/01/31: Bank assets: $78,146.9 mil, Deposits: $48,042.9 mil, headquarters in Wilmington, DE, positive income , Commercial Lending Specialization, 718 total offices , Holding Company: Banco Santander, S.A.
For population 15 years and over in Parkesburg:
Never married: 28.2%Now married: 51.4%Separated: 1.0%Widowed: 5.5%Divorced: 13.9% For population 25 years and over in Parkesburg:
High school or higher: 84.8%Bachelor's degree or higher: 24.9%Graduate or professional degree: 11.0%Unemployed: 3.4%Mean travel time to work (commute): 26.5 minutes
Education Gini index (Inequality in education) Here:
12.4Pennsylvania average:
11.4
Religion statistics for Parkesburg, PA (based on Chester County data)
Religion Adherents Congregations Catholic 212,113 33 Mainline Protestant 60,921 156 Evangelical Protestant 31,520 167 Other 6,090 25 Black Protestant 4,271 25 Orthodox 675 4 None 183,296 -
Source: Clifford Grammich, Kirk Hadaway, Richard Houseal, Dale E.Jones, Alexei Krindatch, Richie Stanley and Richard H.Taylor. 2012. 2010 U.S.Religion Census: Religious Congregations & Membership Study. Association of Statisticians of American Religious Bodies. Jones, Dale E., et al. 2002. Congregations and Membership in the United States 2000. Nashville, TN: Glenmary Research Center. Graphs represent county-level data
Food Environment Statistics: Number of grocery stores : 75Here :
1.54 / 10,000 pop.State :
2.04 / 10,000 pop.
Number of supercenters and club stores : 3Here :
0.06 / 10,000 pop.Pennsylvania :
0.09 / 10,000 pop.
Number of convenience stores (no gas) : 28This county :
0.58 / 10,000 pop.State :
0.88 / 10,000 pop.
Number of convenience stores (with gas) : 91Here :
1.87 / 10,000 pop.Pennsylvania :
2.52 / 10,000 pop.
Number of full-service restaurants : 322Here :
6.63 / 10,000 pop.Pennsylvania :
7.12 / 10,000 pop.
Adult diabetes rate : Chester County :
7.5%Pennsylvania :
9.1%
Adult obesity rate : Chester County :
22.3%State :
27.2%
Low-income preschool obesity rate : Here :
14.0%Pennsylvania :
11.5%
Health and Nutrition: Healthy diet rate : Parkesburg:
49.1%Pennsylvania:
50.2%
Average overall health of teeth and gums : Parkesburg:
46.4%Pennsylvania:
47.1%
Average BMI : Here:
28.6Pennsylvania:
28.7
People feeling badly about themselves : Parkesburg:
20.7%State:
20.8%
People not drinking alcohol at all : Parkesburg:
9.5%State:
10.9%
Average hours sleeping at night : Overweight people : Parkesburg:
34.3%State:
34.3%
General health condition : Parkesburg:
55.8%Pennsylvania:
56.2%
Average condition of hearing : Here:
78.9%Pennsylvania:
78.3%
More about Health and Nutrition of Parkesburg, PA Residents
Local government employment and payroll (March 2022)
Function
Full-time employees
Monthly full-time payroll
Average yearly full-time wage
Part-time employees
Monthly part-time payroll
Police Protection - Officers
8 $57,105 $85,658 12 $21,972 Streets and Highways
5 $20,986 $50,366 2 $1,612 Judicial and Legal
0 $0 2 $6,245 Police - Other
0 $0 3 $6,053 Other Government Administration
0 $0 15 $21,444 Financial Administration
0 $0 2 $2,076
Totals for Government
13 $78,091 $72,084 36 $59,402
Parkesburg government finances - Expenditure in 2017 (per resident):
Current Operations - Police Protection: $1,005,000 ($255.47)
General - Other: $646,000 ($164.21)Regular Highways: $354,000 ($89.98)Central Staff Services: $335,000 ($85.16)Local Fire Protection: $164,000 ($41.69)Solid Waste Management: $102,000 ($25.93)Housing and Community Development: $20,000 ($5.08)Libraries: $8,000 ($2.03)Parks and Recreation: $6,000 ($1.53)Health - Other: $4,000 ($1.02)General - Interest on Debt: $137,000 ($34.82)
Parkesburg government finances - Revenue in 2017 (per resident):
Charges - Solid Waste Management: $403,000 ($102.44)
Other: $264,000 ($67.11)Federal Intergovernmental - Other: $63,000 ($16.01)
Local Intergovernmental - Other: $3,000 ($0.76)
Miscellaneous - Fines and Forfeits: $109,000 ($27.71)
General Revenue - Other: $19,000 ($4.83)Donations From Private Sources: $2,000 ($0.51)Interest Earnings: $0 ($0.00)State Intergovernmental - Other: $248,000 ($63.04)
Tax - Property: $1,361,000 ($345.96)
Individual Income: $397,000 ($100.92)Public Utility License: $75,000 ($19.06)Documentary and Stock Transfer: $64,000 ($16.27)Occupation and Business License - Other: $36,000 ($9.15)
Parkesburg government finances - Debt in 2017 (per resident):
Long Term Debt - Beginning Outstanding - Unspecified Public Purpose: $3,417,000 ($868.58)
Outstanding Unspecified Public Purpose: $3,134,000 ($796.64)Retired Unspecified Public Purpose: $336,000 ($85.41)Issue, Unspecified Public Purpose: $53,000 ($13.47)
Parkesburg government finances - Cash and Securities in 2017 (per resident):
Other Funds - Cash and Securities: $532,000 ($135.23)
6.84% of this county's 2021 resident taxpayers lived in other counties in 2020 ($103,258 average adjusted gross income )
Here:
6.84%Pennsylvania average:
5.27%
0.01% of residents moved from foreign countries Chester County:
0.01%Pennsylvania average:
0.01%
Top counties from which taxpayers relocated into this county between 2020 and 2021:
5.95% of this county's 2020 resident taxpayers moved to other counties in 2021 ($116,684 average adjusted gross income )
Here:
5.95%Pennsylvania average:
5.44%
0.01% of residents moved to foreign countries ($128 average AGI )Chester County:
0.01%Pennsylvania average:
0.01%
Top counties to which taxpayers relocated from this county between 2020 and 2021:
Businesses in Parkesburg, PA
Name Count Name Count
AT&T 1 Home Depot 1 Advance Auto Parts 1 Kroger 1 Arby's 1 MasterBrand Cabinets 6 Blockbuster 1 McDonald's 1 DHL 1 Nike 1 Dairy Queen 1 RadioShack 1 Dunkin Donuts 1 Subway 1 Fashion Bug 1 T-Mobile 2 FedEx 1 U-Haul 1 GNC 1 UPS 1 GameStop 1 Walmart 1
Strongest AM radio stations in Parkesburg:
WVCH (740 AM; 50 kW; CHESTER, PA; Owner: WVCH COMMUNICATIONS, INC.)
WCOJ (1420 AM; 5 kW; COATESVILLE, PA; Owner: WCOJ RADIO COMPANY, INC.)
WPEN (950 AM; 50 kW; PHILADELPHIA, PA; Owner: GREATER PHILADELPHIA RADIO, INC.)
WZZD (990 AM; 50 kW; PHILADELPHIA, PA; Owner: PENNSYLVANIA MEDIA ASSOCIATES, INC.)
KYW (1060 AM; 50 kW; PHILADELPHIA, PA; Owner: INFINITY BROADCASTING OPERATIONS, INC.)
WWJZ (640 AM; 50 kW; MOUNT HOLLY, NJ; Owner: ABC, INC.)
WEEU (830 AM; 20 kW; READING, PA; Owner: WEEU BROADCASTING COMPANY)
WNWR (1540 AM; 50 kW; PHILADELPHIA, PA)
WPHT (1210 AM; 50 kW; PHILADELPHIA, PA; Owner: INFINITY BROADCASTING OPERATIONS, INC.)
WCBM (680 AM; 50 kW; BALTIMORE, MD; Owner: WCBM MARYLAND, INC.)
WBAL (1090 AM; 50 kW; BALTIMORE, MD; Owner: HEARST RADIO, INC.)
WWLG (1370 AM; 50 kW; BALTIMORE, MD; Owner: M-10 BROADCASTING, INC.)
WWDB (860 AM; daytime; 10 kW; PHILADELPHIA, PA)
Strongest FM radio stations in Parkesburg:
WBMP (88.1 FM; WARWICK, PA; Owner: FOUR RIVERS COMMUNITY BROADCASTING CORP.)
WIOV-FM (105.1 FM; EPHRATA, PA; Owner: REGENT BROADCASTING OF LANCASTER, INC.)
WDAC (94.5 FM; LANCASTER, PA; Owner: WDAC RADIO COMPANY)
WPLY (100.3 FM; MEDIA, PA; Owner: RADIO ONE LICENSES, LLC)
WRFY-FM (102.5 FM; READING, PA; Owner: CLEAR CHANNEL BROADCASTING LICENSES, INC.)
WARM-FM (103.3 FM; YORK, PA; Owner: WSBA LICO, INC.)
WROZ (101.3 FM; LANCASTER, PA; Owner: HALL COMMUNICATIONS, INC.)
WRTL (90.7 FM; EPHRATA, PA; Owner: TEMPLE UNIV OF COMMONWEALTH SYSTEM)
WMWX (95.7 FM; PHILADELPHIA, PA; Owner: GREATER PHILADELPHIA RADIO, INC.)
WMGK (102.9 FM; PHILADELPHIA, PA; Owner: GREATER PHILADELPHIA RADIO, INC.)
WIOV-FM1 (105.1 FM; READING, PA; Owner: REGENT BROADCASTING OF LANCASTER, INC.)
WOGL (98.1 FM; PHILADELPHIA, PA; Owner: INFINITY BROADCASTING OPERATIONS, INC.)
WJTL (90.3 FM; LANCASTER, PA; Owner: CREATIVE MINISTRIES, INC.)
WSNI-FM (104.5 FM; PHILADELPHIA, PA; Owner: AMFM RADIO LICENSES, L.L.C.)
WBEB (101.1 FM; PHILADELPHIA, PA; Owner: WEAZ-FM RADIO, INC.)
WRTI (90.1 FM; PHILADELPHIA, PA; Owner: TEMPLE UNIV. OF THE COMMONWEALTH, ET)
WPHI-FM (103.9 FM; JENKINTOWN, PA; Owner: RADIO ONE LICENSES, LLC)
WSOX (96.1 FM; RED LION, PA; Owner: LANCASTER-YORK BROADCASTING, LLC)
WJBR-FM (99.5 FM; WILMINGTON, DE; Owner: NM LICENSING, LLC)
WSTW (93.7 FM; WILMINGTON, DE; Owner: DELMARVA BROADCASTING COMPANY)
TV broadcast stations around Parkesburg:
KYW-TV (Channel 3; PHILADELPHIA, PA; Owner: CBS BROADCASTING INC.)
WTSD-CA (Channel 14; WILMINGTON, DE; Owner: PRIORITY COMMUNICATIONS MINISTRIES, INC.)
WPHL-TV (Channel 17; PHILADELPHIA, PA; Owner: TRIBUNE TELEVISION COMPANY)
WPPX (Channel 61; WILMINGTON, DE; Owner: PAXSON PHILADELPHIA LICENSE, INC.)
WPVI-TV (Channel 6; PHILADELPHIA, PA; Owner: ABC, INC.)
WPSG (Channel 57; PHILADELPHIA, PA; Owner: VIACOM STATIONS GROUP OF PHILADELPHIA INC.)
WCAU (Channel 10; PHILADELPHIA, PA; Owner: NBC SUBSIDIARY (WCAU-TV), L.P.)
WGTW (Channel 48; BURLINGTON, NJ; Owner: BRUNSON COMMUNICATIONS, INC.)
WLYH-TV (Channel 15; LANCASTER, PA; Owner: TELEVISION STATION GROUP LICENSE SUBSIDIARY, LLC)
WYBE (Channel 35; PHILADELPHIA, PA; Owner: INDEPENDENCE PUBLIC MEDIA OF PHILADELPHIA, INC.)
WTVE (Channel 51; READING, PA; Owner: READING BROADCASTING, INC.)
WHYY-TV (Channel 12; WILMINGTON, DE; Owner: WHYY, INC.)
WPMT (Channel 43; YORK, PA; Owner: TRIBUNE TELEVISION COMPANY)
WWJT-LP (Channel 7; PHILADELPHIA, PA; Owner: PHILADELPHIA TELEVISION NETWORK, INC)
WTXF-TV (Channel 29; PHILADELPHIA, PA; Owner: FOX TV STATIONS OF PHILADELPHIA)
WGAL (Channel 8; LANCASTER, PA; Owner: WGAL HEARST-ARGYLE TELEVISION, INC.)
WELL-LP (Channel 8; WILLOW GROVE, ETC., PA; Owner: WORD OF GOD FELLOWSHIP, INC.)
Parkesburg fatal accident statistics for 1975 - 2021
Parkesburg fatal accident list:
May 22, 2007 07:46 AM, Sr-10, Boroline Rd, Lat: 39.952667, Lon: -75.911169, Vehicles: 2, Persons: 2, Fatalities: 1Lat: 39.960143, Lon: -75.913232, Vehicles: 1, Persons: 2, Fatalities: 1Vehicles: 2, Persons: 2, Fatalities: 1Vehicles: 1, Persons: 1, Fatalities: 1, Drunk persons involved: 1Vehicles: 2, Persons: 2, Fatalities: 1Vehicles: 2, Persons: 4, Fatalities: 1
National Bridge Inventory (NBI) Statistics 11 Number of bridges72ft / 21.8m Total length $5,182,000 Total costs132,101 Total average daily traffic13,988 Total average daily truck traffic
New bridges - historical statistics
2 1900-1909 1 1920-1929 1 1930-1939 4 1960-1969 3 1980-1989
See full National Bridge Inventory statistics for Parkesburg, PA
FCC Registered Antenna Towers: 24 (
See the full list of FCC Registered Antenna Towers in Parkesburg )
FCC Registered Broadcast Land Mobile Towers: 2
Off Route 30 (Lat: 39.982333 Lon: -75.923000), Type: Pole, Structure height: 18 m, Overall height: 23 m, Call Sign: WPQF869, Assigned Frequencies: 866.012 MHz, 866.150 MHz, 866.412 MHz, 866.437 MHz, 866.512 MHz, 866.912 MHz, 867.012 MHz, 867.512 MHz, 867.625 MHz, 867.750 MHz, 868.012 MHz, Grant Date: 06/28/2000, Expiration Date: 06/28/2005, Cancellation Date: 01/07/2006, Certifier: Donald R Appleby Jr, Registrant: Rcc Consultants Inc, 2000 Linglestown Road Suite 304, Harrisburg, PA 17110-9347, Fax: (717) 671-0200 100 Mountain Laurel Court (Lat: 39.957222 Lon: -75.892778), Type: Bant, Structure height: 6 m, Overall height: 12 m, Call Sign: WPXC745, Assigned Frequencies: 72.7200 MHz, Grant Date: 03/06/2003, Expiration Date: 03/06/2013, Cancellation Date: 05/11/2013, Certifier: Eric N Nafziger, Registrant: Skylines Unlimited Inc, 100 Stone Church Road, Carlisle, PA 17013, Phone: (717) 218-5003, Fax: (717) 218-5005, Email:
FCC Registered Microwave Towers: 3
Boyd UnitSub, Lat: 39.984389 Lon: -75.932583, Type: Pole, Structure height: 25.9 m, Call Sign: WQMQ231, Assigned Frequencies: 3650.00 MHz, Grant Date: 10/20/2010, Expiration Date: 02/14/2021, Cancellation Date: 03/09/2021, Certifier: Michael Pezzano, Registrant: Exelon Energy, 2900 Lord Baltimore Dr, Baltimore, MD 21244, Phone: (410) 470-8561, Fax: (410) 470-8599, Email:
PL54XC717, Parkesburg Pa (093722) (Lat: 39.890806 Lon: -75.921917), Type: Mtower, Structure height: 46.3 m, Overall height: 47.5 m, Call Sign: WQQY746, Licensee ID: L01744207, Assigned Frequencies: 11135.0 MHz, 11135.0 MHz, 11135.0 MHz, Grant Date: 05/22/2023, Expiration Date: 03/27/2033, Certifier: David Werblow, Registrant: Sprint Spectrum LLC CHES90, Lincoln Hwy And Quaker Rd (Lat: 39.982083 Lon: -75.920639), Type: Mtower, Structure height: 51.8 m, Call Sign: WRMN382, Assigned Frequencies: 6004.50 MHz, 6093.45 MHz, 6004.50 MHz, 6093.45 MHz, 6004.50 MHz, 6093.45 MHz, 6004.50 MHz, 6093.45 MHz, 6004.50 MHz, 6093.45 MHz... (+6 more), Grant Date: 05/06/2021, Expiration Date: 05/06/2031, Certifier: Benjamin Dorsey, Registrant: Commonwealth Of Pennsylvania, 8001 Bretz Drive, Harrisburg, PA 17112, Phone: (717) 425-5490, Fax: (717) 772-8097, Email:
FCC Registered Amateur Radio Licenses: 34 (
See the full list of FCC Registered Amateur Radio Licenses in Parkesburg )
Home Mortgage Disclosure Act Aggregated Statistics For Year 2009(Based on 1 full tract) A) FHA, FSA/RHS & VA B) Conventional C) Refinancings D) Home Improvement Loans F) Non-occupant Loans on Number Average Value Number Average Value Number Average Value Number Average Value Number Average Value
LOANS ORIGINATED 29 $185,586 19 $136,474 73 $152,356 9 $54,889 10 $149,700 APPLICATIONS APPROVED, NOT ACCEPTED 0 $0 2 $135,000 12 $152,000 0 $0 0 $0 APPLICATIONS DENIED 5 $169,800 2 $175,000 39 $171,128 6 $43,667 1 $80,000 APPLICATIONS WITHDRAWN 4 $194,750 2 $177,500 25 $171,320 3 $41,333 2 $109,500 FILES CLOSED FOR INCOMPLETENESS 1 $198,000 1 $160,000 4 $153,750 0 $0 1 $160,000
Aggregated Statistics For Year 2008(Based on 1 full tract) A) FHA, FSA/RHS & VA B) Conventional C) Refinancings D) Home Improvement Loans E) Loans on Dwellings For 5+ Families F) Non-occupant Loans on G) Loans On Manufactured Number Average Value Number Average Value Number Average Value Number Average Value Number Average Value Number Average Value Number Average Value
LOANS ORIGINATED 26 $194,462 30 $156,800 59 $123,644 17 $32,471 1 $3,293,000 15 $141,933 1 $60,000 APPLICATIONS APPROVED, NOT ACCEPTED 4 $194,250 8 $167,250 8 $111,625 2 $112,000 0 $0 1 $60,000 2 $103,500 APPLICATIONS DENIED 5 $183,800 3 $175,667 63 $142,683 15 $70,133 0 $0 2 $80,500 0 $0 APPLICATIONS WITHDRAWN 1 $198,000 2 $194,000 30 $167,600 2 $84,000 0 $0 0 $0 0 $0 FILES CLOSED FOR INCOMPLETENESS 2 $144,000 0 $0 5 $154,600 0 $0 0 $0 1 $120,000 0 $0
Aggregated Statistics For Year 2007(Based on 1 full tract) A) FHA, FSA/RHS & VA B) Conventional C) Refinancings D) Home Improvement Loans E) Loans on Dwellings For 5+ Families F) Non-occupant Loans on G) Loans On Manufactured Number Average Value Number Average Value Number Average Value Number Average Value Number Average Value Number Average Value Number Average Value
LOANS ORIGINATED 9 $176,778 55 $145,873 101 $133,158 22 $44,227 2 $437,500 20 $109,950 1 $56,000 APPLICATIONS APPROVED, NOT ACCEPTED 0 $0 5 $129,600 28 $114,357 4 $31,250 0 $0 2 $73,500 0 $0 APPLICATIONS DENIED 1 $123,000 5 $95,000 69 $139,884 20 $74,950 0 $0 10 $115,700 1 $103,000 APPLICATIONS WITHDRAWN 2 $161,000 6 $149,667 33 $154,424 2 $50,000 0 $0 6 $89,333 0 $0 FILES CLOSED FOR INCOMPLETENESS 0 $0 3 $62,333 9 $188,333 0 $0 0 $0 1 $64,000 0 $0
Aggregated Statistics For Year 2006(Based on 1 full tract) A) FHA, FSA/RHS & VA B) Conventional C) Refinancings D) Home Improvement Loans E) Loans on Dwellings For 5+ Families F) Non-occupant Loans on G) Loans On Manufactured Number Average Value Number Average Value Number Average Value Number Average Value Number Average Value Number Average Value Number Average Value
LOANS ORIGINATED 4 $157,750 70 $129,357 107 $113,860 21 $43,857 1 $371,000 21 $144,190 1 $60,000 APPLICATIONS APPROVED, NOT ACCEPTED 1 $230,000 7 $113,286 21 $128,952 5 $22,400 0 $0 3 $138,667 0 $0 APPLICATIONS DENIED 3 $181,333 26 $113,115 67 $127,179 19 $41,316 0 $0 10 $114,300 5 $40,600 APPLICATIONS WITHDRAWN 0 $0 17 $138,824 39 $152,179 4 $83,750 0 $0 2 $409,000 0 $0 FILES CLOSED FOR INCOMPLETENESS 0 $0 7 $139,429 13 $148,308 4 $41,250 0 $0 1 $214,000 0 $0
Aggregated Statistics For Year 2005(Based on 1 full tract) A) FHA, FSA/RHS & VA B) Conventional C) Refinancings D) Home Improvement Loans E) Loans on Dwellings For 5+ Families F) Non-occupant Loans on G) Loans On Manufactured Number Average Value Number Average Value Number Average Value Number Average Value Number Average Value Number Average Value Number Average Value
LOANS ORIGINATED 4 $154,750 68 $139,397 106 $118,604 26 $42,923 0 $0 15 $98,267 1 $121,000 APPLICATIONS APPROVED, NOT ACCEPTED 1 $119,000 6 $102,500 21 $136,238 3 $125,000 0 $0 2 $121,000 0 $0 APPLICATIONS DENIED 0 $0 10 $115,000 72 $126,708 21 $47,476 0 $0 7 $97,857 2 $38,500 APPLICATIONS WITHDRAWN 0 $0 11 $93,818 64 $150,922 9 $104,444 1 $131,000 5 $92,800 0 $0 FILES CLOSED FOR INCOMPLETENESS 0 $0 4 $60,250 16 $149,125 0 $0 0 $0 0 $0 0 $0
Aggregated Statistics For Year 2004(Based on 1 full tract) A) FHA, FSA/RHS & VA B) Conventional C) Refinancings D) Home Improvement Loans E) Loans on Dwellings For 5+ Families F) Non-occupant Loans on G) Loans On Manufactured Number Average Value Number Average Value Number Average Value Number Average Value Number Average Value Number Average Value Number Average Value
LOANS ORIGINATED 5 $186,400 70 $116,543 116 $109,948 24 $47,417 2 $253,000 32 $102,219 0 $0 APPLICATIONS APPROVED, NOT ACCEPTED 1 $119,000 7 $107,429 26 $116,500 5 $28,400 0 $0 3 $76,000 0 $0 APPLICATIONS DENIED 0 $0 11 $152,182 80 $108,600 14 $22,500 0 $0 3 $188,667 2 $49,000 APPLICATIONS WITHDRAWN 0 $0 1 $130,000 64 $119,828 2 $42,500 0 $0 1 $77,000 0 $0 FILES CLOSED FOR INCOMPLETENESS 0 $0 1 $180,000 17 $128,000 2 $32,500 0 $0 1 $118,000 0 $0
Aggregated Statistics For Year 2003(Based on 1 full tract) A) FHA, FSA/RHS & VA B) Conventional C) Refinancings D) Home Improvement Loans E) Loans on Dwellings For 5+ Families F) Non-occupant Loans on Number Average Value Number Average Value Number Average Value Number Average Value Number Average Value Number Average Value
LOANS ORIGINATED 15 $128,667 67 $110,881 172 $101,878 23 $29,261 2 $1,150,000 18 $96,500 APPLICATIONS APPROVED, NOT ACCEPTED 0 $0 6 $119,500 43 $107,721 2 $20,000 0 $0 1 $127,000 APPLICATIONS DENIED 0 $0 14 $103,500 77 $102,039 9 $33,111 0 $0 7 $75,429 APPLICATIONS WITHDRAWN 0 $0 6 $116,167 60 $123,117 4 $45,750 0 $0 2 $52,000 FILES CLOSED FOR INCOMPLETENESS 0 $0 0 $0 8 $81,125 0 $0 0 $0 0 $0
Aggregated Statistics For Year 2002(Based on 1 full tract) A) FHA, FSA/RHS & VA B) Conventional C) Refinancings D) Home Improvement Loans E) Loans on Dwellings For 5+ Families F) Non-occupant Loans on Number Average Value Number Average Value Number Average Value Number Average Value Number Average Value Number Average Value
LOANS ORIGINATED 11 $118,000 65 $108,338 124 $96,347 18 $32,222 1 $170,000 17 $83,765 APPLICATIONS APPROVED, NOT ACCEPTED 0 $0 9 $96,444 25 $107,480 3 $11,333 0 $0 1 $65,000 APPLICATIONS DENIED 0 $0 15 $69,533 46 $107,217 7 $22,714 0 $0 3 $60,667 APPLICATIONS WITHDRAWN 2 $105,000 6 $109,833 60 $111,950 3 $66,667 0 $0 2 $49,500 FILES CLOSED FOR INCOMPLETENESS 0 $0 2 $85,000 12 $103,167 0 $0 0 $0 1 $130,000
Aggregated Statistics For Year 2001(Based on 1 full tract) A) FHA, FSA/RHS & VA B) Conventional C) Refinancings D) Home Improvement Loans F) Non-occupant Loans on Number Average Value Number Average Value Number Average Value Number Average Value Number Average Value
LOANS ORIGINATED 19 $113,684 49 $71,224 84 $82,060 26 $34,385 8 $61,875 APPLICATIONS APPROVED, NOT ACCEPTED 0 $0 3 $96,000 12 $77,500 2 $83,500 0 $0 APPLICATIONS DENIED 0 $0 13 $48,308 50 $72,900 12 $14,000 4 $85,000 APPLICATIONS WITHDRAWN 0 $0 2 $100,500 27 $85,259 4 $34,000 2 $96,500 FILES CLOSED FOR INCOMPLETENESS 0 $0 2 $58,500 4 $118,750 0 $0 0 $0
Aggregated Statistics For Year 2000(Based on 1 full tract) A) FHA, FSA/RHS & VA B) Conventional C) Refinancings D) Home Improvement Loans E) Loans on Dwellings For 5+ Families F) Non-occupant Loans on Number Average Value Number Average Value Number Average Value Number Average Value Number Average Value Number Average Value
LOANS ORIGINATED 18 $95,833 38 $85,211 44 $72,500 17 $20,529 1 $52,000 9 $64,556 APPLICATIONS APPROVED, NOT ACCEPTED 2 $94,500 10 $96,300 13 $113,154 3 $23,667 0 $0 2 $47,000 APPLICATIONS DENIED 2 $86,000 15 $48,667 40 $79,675 8 $23,375 0 $0 2 $67,500 APPLICATIONS WITHDRAWN 4 $109,000 6 $85,167 20 $63,800 6 $36,000 0 $0 0 $0 FILES CLOSED FOR INCOMPLETENESS 1 $90,000 0 $0 7 $101,857 1 $30,000 0 $0 0 $0
Aggregated Statistics For Year 1999(Based on 1 full tract) A) FHA, FSA/RHS & VA B) Conventional C) Refinancings D) Home Improvement Loans F) Non-occupant Loans on Number Average Value Number Average Value Number Average Value Number Average Value Number Average Value
LOANS ORIGINATED 15 $96,257 40 $84,956 55 $77,489 20 $20,136 8 $55,350 APPLICATIONS APPROVED, NOT ACCEPTED 1 $119,290 6 $60,917 14 $86,228 1 $32,450 1 $80,160 APPLICATIONS DENIED 3 $113,880 16 $87,557 49 $65,847 10 $40,844 2 $37,220 APPLICATIONS WITHDRAWN 2 $87,795 8 $99,605 42 $65,006 7 $38,717 4 $54,158 FILES CLOSED FOR INCOMPLETENESS 0 $0 0 $0 11 $83,197 0 $0 2 $62,030
Detailed HMDA statistics for the following Tracts:
3074.00
Private Mortgage Insurance Companies Aggregated Statistics For Year 2009(Based on 1 full tract) A) Conventional B) Refinancings Number Average Value Number Average Value
LOANS ORIGINATED 4 $163,250 3 $145,333 APPLICATIONS APPROVED, NOT ACCEPTED 1 $187,000 1 $68,000 APPLICATIONS DENIED 0 $0 0 $0 APPLICATIONS WITHDRAWN 0 $0 0 $0 FILES CLOSED FOR INCOMPLETENESS 0 $0 0 $0
Aggregated Statistics For Year 2008(Based on 1 full tract) A) Conventional B) Refinancings C) Non-occupant Loans on Number Average Value Number Average Value Number Average Value
LOANS ORIGINATED 7 $203,714 7 $165,000 0 $0 APPLICATIONS APPROVED, NOT ACCEPTED 4 $208,250 0 $0 0 $0 APPLICATIONS DENIED 1 $140,000 2 $218,500 2 $194,000 APPLICATIONS WITHDRAWN 0 $0 1 $209,000 0 $0 FILES CLOSED FOR INCOMPLETENESS 0 $0 0 $0 0 $0
Aggregated Statistics For Year 2007(Based on 1 full tract) A) Conventional B) Refinancings C) Non-occupant Loans on Number Average Value Number Average Value Number Average Value
LOANS ORIGINATED 15 $187,600 11 $185,364 1 $162,000 APPLICATIONS APPROVED, NOT ACCEPTED 4 $202,750 3 $188,333 0 $0 APPLICATIONS DENIED 0 $0 0 $0 0 $0 APPLICATIONS WITHDRAWN 1 $205,000 1 $154,000 0 $0 FILES CLOSED FOR INCOMPLETENESS 0 $0 0 $0 0 $0
Aggregated Statistics For Year 2006(Based on 1 full tract) A) Conventional B) Refinancings Number Average Value Number Average Value
LOANS ORIGINATED 12 $180,250 7 $180,000 APPLICATIONS APPROVED, NOT ACCEPTED 1 $237,000 4 $198,000 APPLICATIONS DENIED 1 $195,000 0 $0 APPLICATIONS WITHDRAWN 3 $223,667 1 $139,000 FILES CLOSED FOR INCOMPLETENESS 0 $0 0 $0
Aggregated Statistics For Year 2005(Based on 1 full tract) A) Conventional B) Refinancings C) Non-occupant Loans on Number Average Value Number Average Value Number Average Value
LOANS ORIGINATED 16 $138,625 8 $163,500 4 $103,750 APPLICATIONS APPROVED, NOT ACCEPTED 4 $159,750 1 $150,000 2 $119,000 APPLICATIONS DENIED 0 $0 0 $0 0 $0 APPLICATIONS WITHDRAWN 0 $0 2 $155,500 0 $0 FILES CLOSED FOR INCOMPLETENESS 0 $0 0 $0 0 $0
Aggregated Statistics For Year 2004(Based on 1 full tract) A) Conventional B) Refinancings C) Non-occupant Loans on Number Average Value Number Average Value Number Average Value
LOANS ORIGINATED 16 $124,875 8 $130,750 4 $94,750 APPLICATIONS APPROVED, NOT ACCEPTED 2 $74,000 0 $0 0 $0 APPLICATIONS DENIED 0 $0 0 $0 0 $0 APPLICATIONS WITHDRAWN 0 $0 1 $90,000 0 $0 FILES CLOSED FOR INCOMPLETENESS 0 $0 1 $190,000 0 $0
Aggregated Statistics For Year 2003(Based on 1 full tract) A) Conventional B) Refinancings C) Non-occupant Loans on Number Average Value Number Average Value Number Average Value
LOANS ORIGINATED 26 $122,885 19 $122,632 2 $96,500 APPLICATIONS APPROVED, NOT ACCEPTED 2 $178,000 9 $134,778 0 $0 APPLICATIONS DENIED 0 $0 0 $0 0 $0 APPLICATIONS WITHDRAWN 1 $162,000 1 $68,000 0 $0 FILES CLOSED FOR INCOMPLETENESS 0 $0 0 $0 0 $0
Aggregated Statistics For Year 2002(Based on 1 full tract) A) Conventional B) Refinancings C) Non-occupant Loans on Number Average Value Number Average Value Number Average Value
LOANS ORIGINATED 21 $122,000 12 $108,333 2 $53,000 APPLICATIONS APPROVED, NOT ACCEPTED 3 $109,333 1 $135,000 0 $0 APPLICATIONS DENIED 0 $0 0 $0 0 $0 APPLICATIONS WITHDRAWN 2 $142,000 2 $83,500 0 $0 FILES CLOSED FOR INCOMPLETENESS 0 $0 0 $0 0 $0
Aggregated Statistics For Year 2001(Based on 1 full tract) A) Conventional B) Refinancings C) Non-occupant Loans on Number Average Value Number Average Value Number Average Value
LOANS ORIGINATED 13 $93,615 13 $112,308 2 $52,500 APPLICATIONS APPROVED, NOT ACCEPTED 3 $133,667 2 $116,000 0 $0 APPLICATIONS DENIED 0 $0 0 $0 0 $0 APPLICATIONS WITHDRAWN 0 $0 0 $0 0 $0 FILES CLOSED FOR INCOMPLETENESS 0 $0 0 $0 0 $0
Aggregated Statistics For Year 2000(Based on 1 full tract) A) Conventional B) Refinancings C) Non-occupant Loans on Number Average Value Number Average Value Number Average Value
LOANS ORIGINATED 9 $94,889 7 $130,143 1 $130,000 APPLICATIONS APPROVED, NOT ACCEPTED 2 $115,500 1 $143,000 0 $0 APPLICATIONS DENIED 0 $0 1 $123,000 0 $0 APPLICATIONS WITHDRAWN 1 $131,000 1 $124,000 0 $0 FILES CLOSED FOR INCOMPLETENESS 0 $0 0 $0 0 $0
Aggregated Statistics For Year 1999(Based on 1 full tract) A) Conventional B) Refinancings Number Average Value Number Average Value
LOANS ORIGINATED 10 $129,689 6 $83,183 APPLICATIONS APPROVED, NOT ACCEPTED 0 $0 3 $119,607 APPLICATIONS DENIED 0 $0 0 $0 APPLICATIONS WITHDRAWN 0 $0 0 $0 FILES CLOSED FOR INCOMPLETENESS 1 $66,800 0 $0
Detailed PMIC statistics for the following Tracts:
3074.00
Most common first names in Parkesburg, PA among deceased individuals Name Count Lived (average)
Mary 47 80.7 years John 45 70.0 years William 43 72.5 years Robert 40 66.9 years Charles 32 71.7 years George 26 77.4 years Helen 25 78.4 years Joseph 23 66.5 years Anna 21 79.9 years James 20 68.6 years
Most common last names in Parkesburg, PA among deceased individuals Last name Count Lived (average)
Miller 26 76.8 years Wilson 17 78.6 years Smith 16 74.2 years Thomas 15 76.9 years Williams 12 75.6 years Taylor 11 70.4 years Thompson 11 77.7 years White 11 79.3 years Martin 10 80.1 years Brown 10 66.2 years
Parkesburg compared to Pennsylvania state average:
Unemployed percentage significantly below state average. Hispanic race population percentage above state average. Length of stay since moving in significantly below state average.
Top Patent Applicants
T. Joseph Dennes (23)
Carlos Ruano (6)
Todd P. Wilson (5)
Thomas English (3)
Benjamin Chronister (3)
Thomas J. Dennes (3)
Thomas E. Mcdonald (2)
Gregory James Chapman (2)
Marc Knight (2)
Thomas J. English (2)
Total of 60 patent applications in 2008-2024.


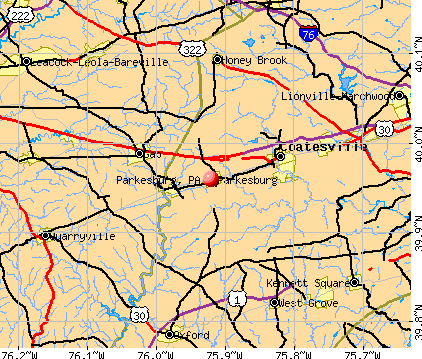


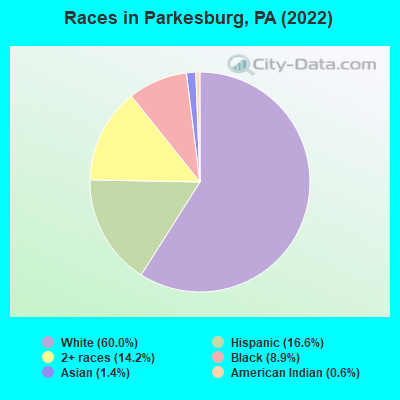
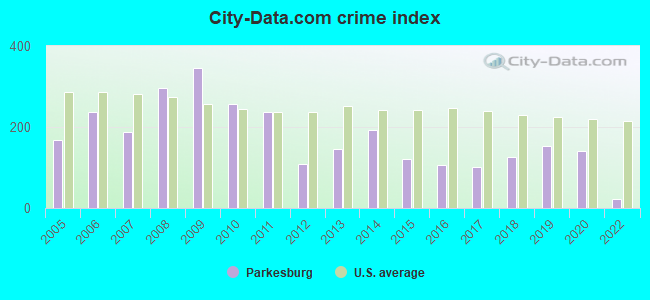
 Recent articles from our blog. Our writers, many of them Ph.D. graduates or candidates, create easy-to-read articles on a wide variety of topics.

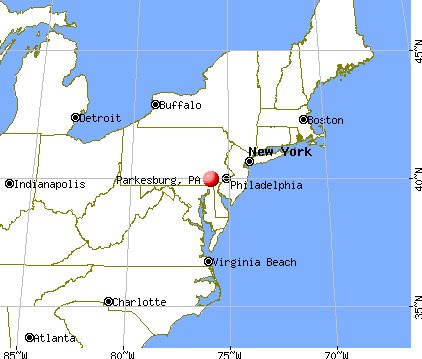
 (21.1 miles
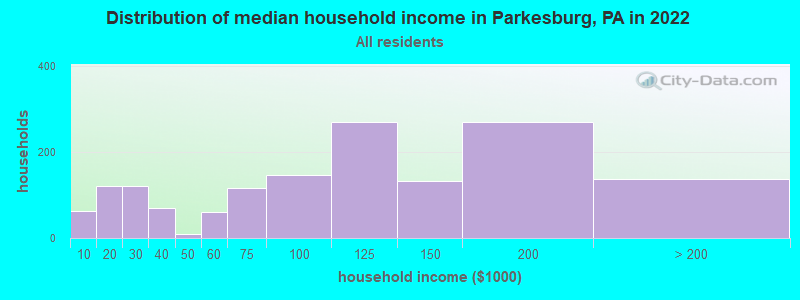
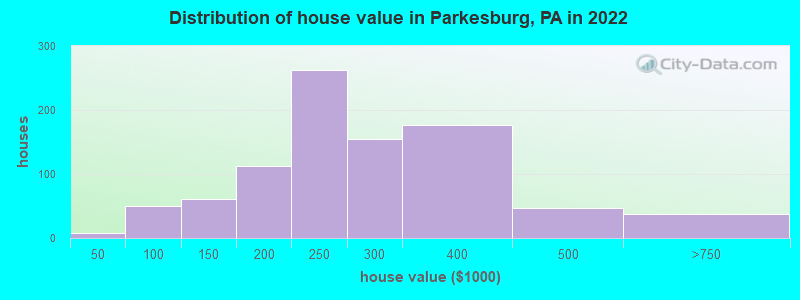
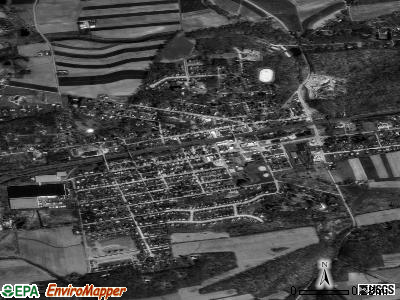
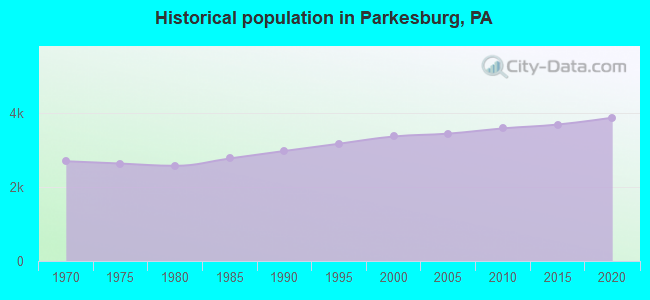
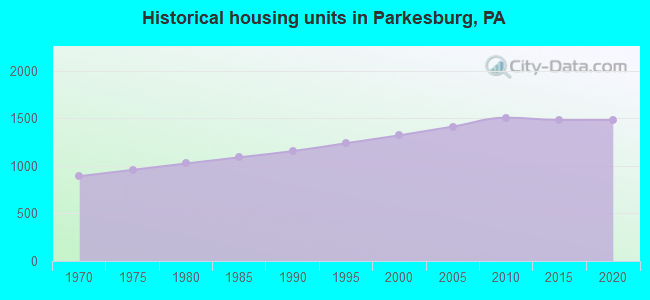
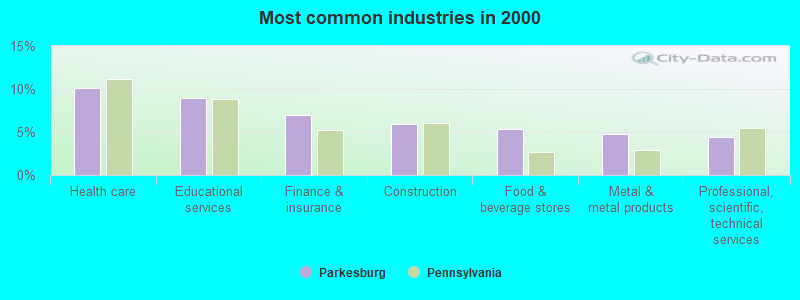
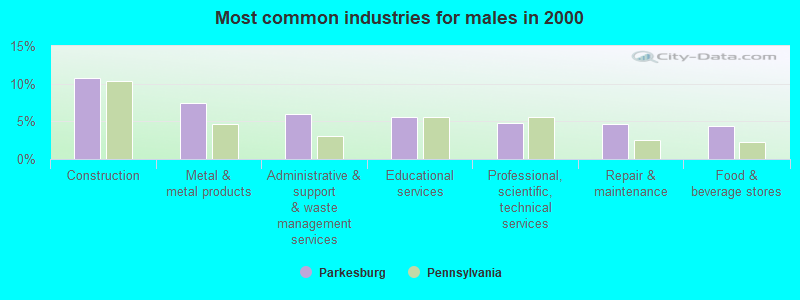
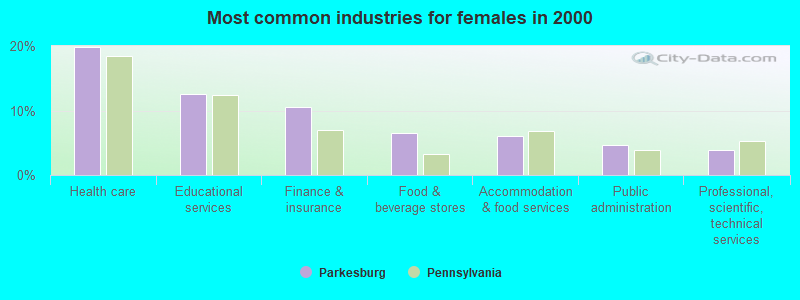
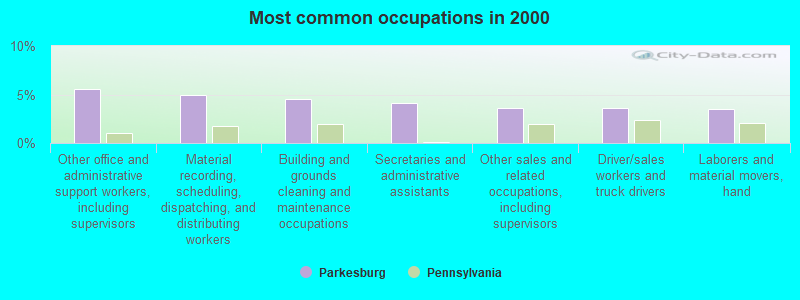
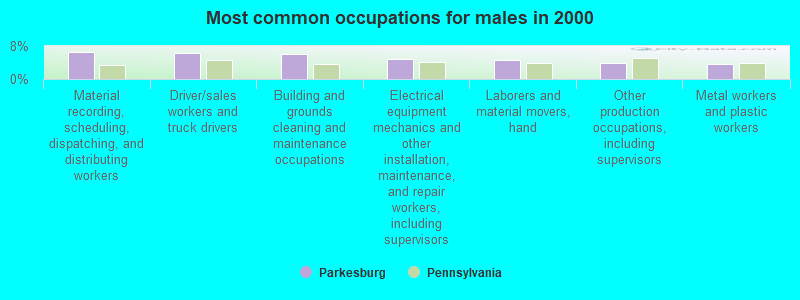
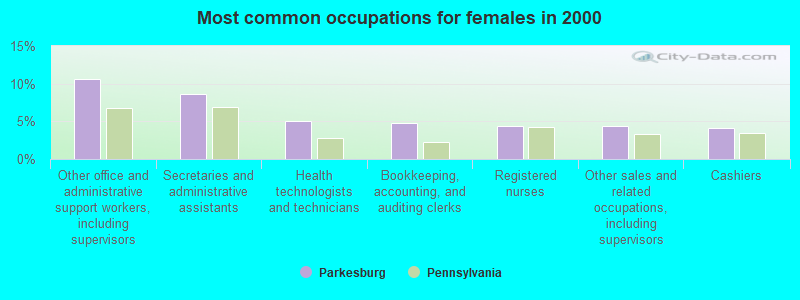


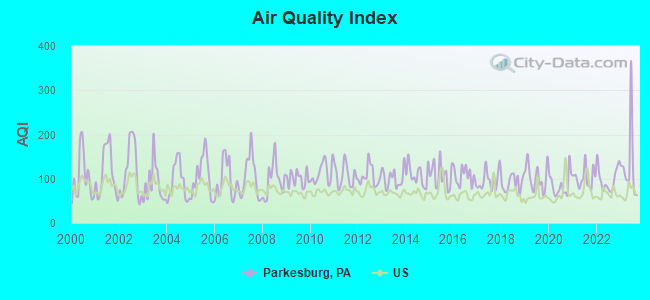
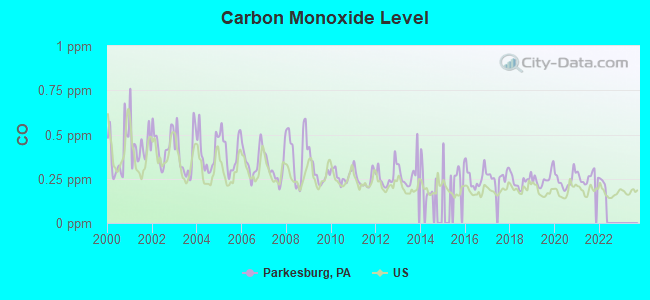
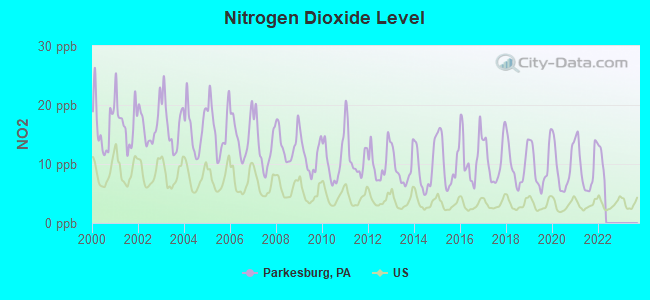
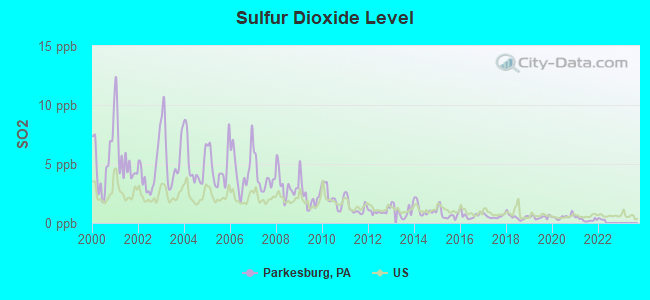
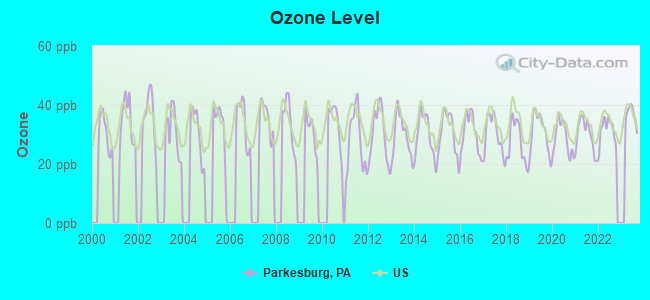
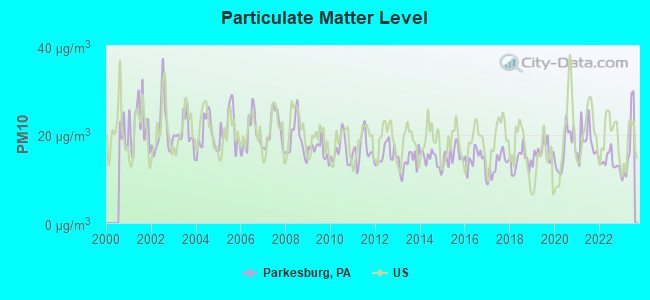
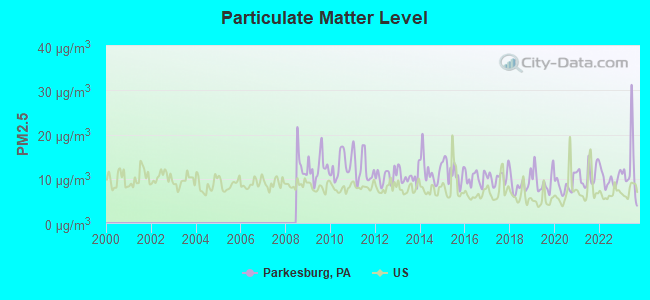
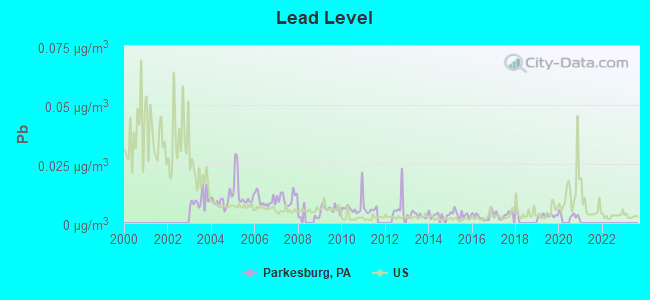
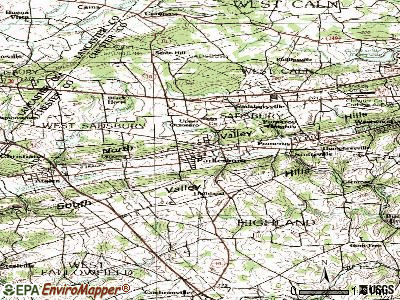
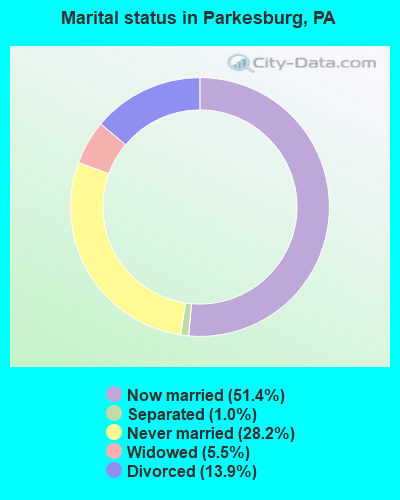
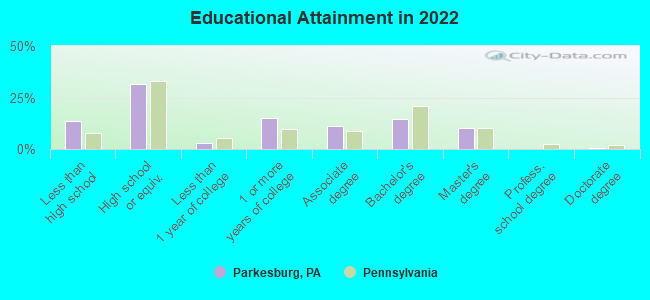
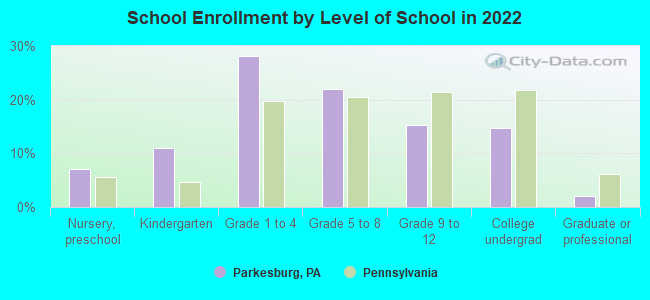
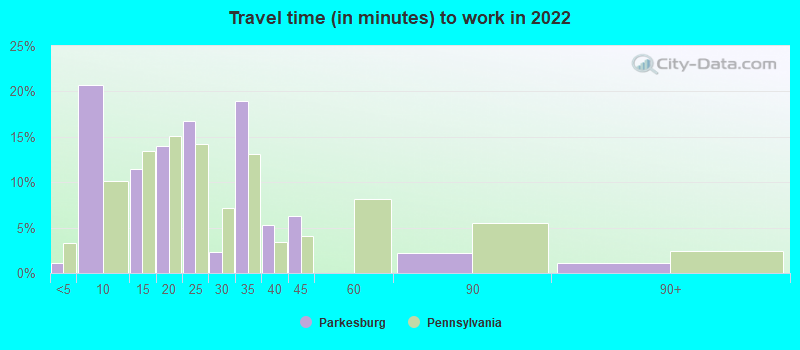
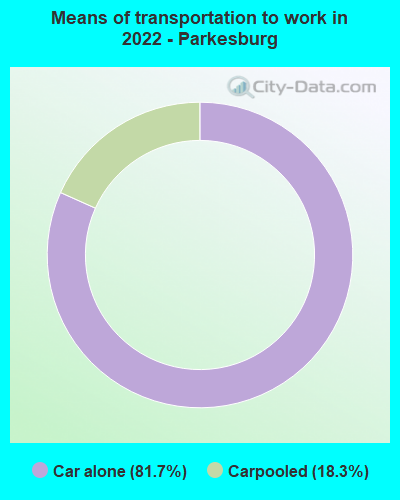
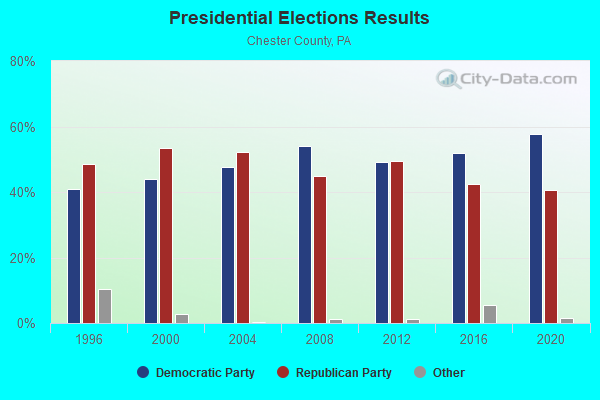
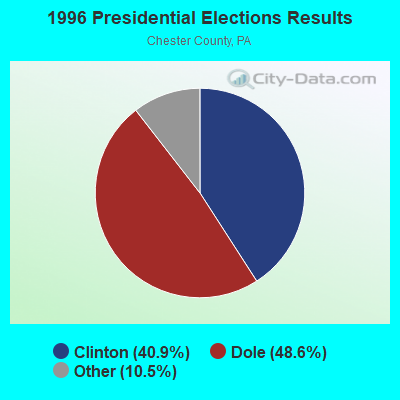
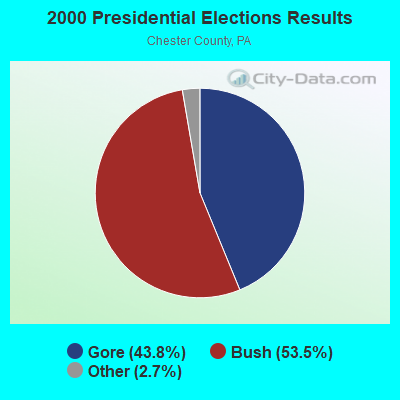
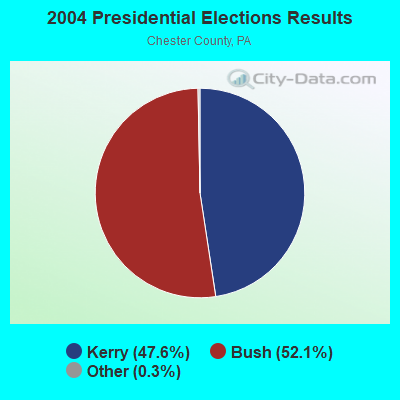
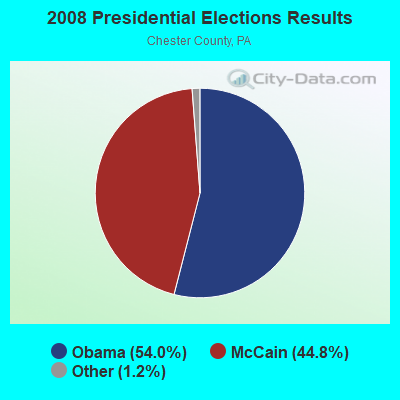
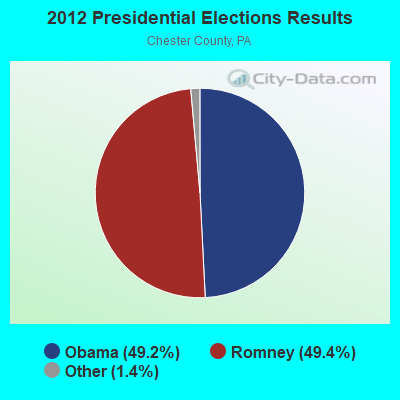
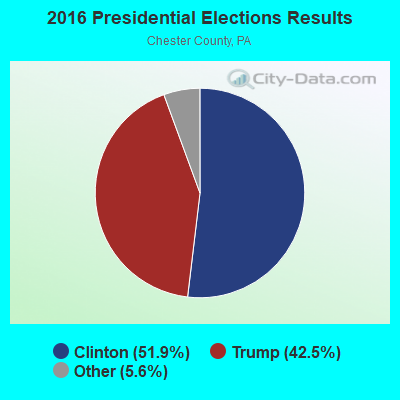
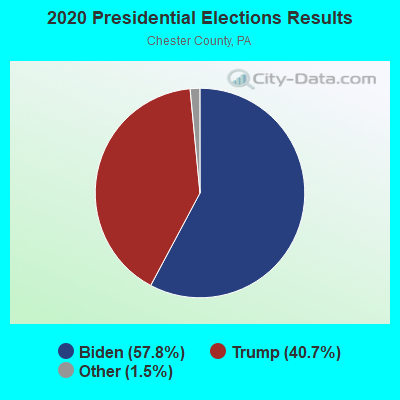
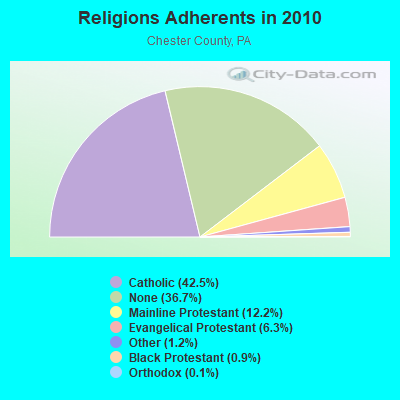
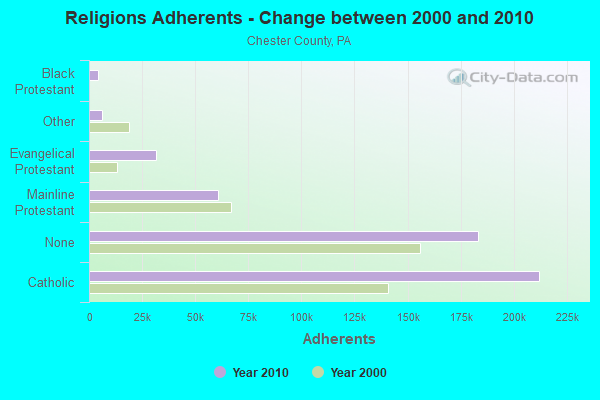
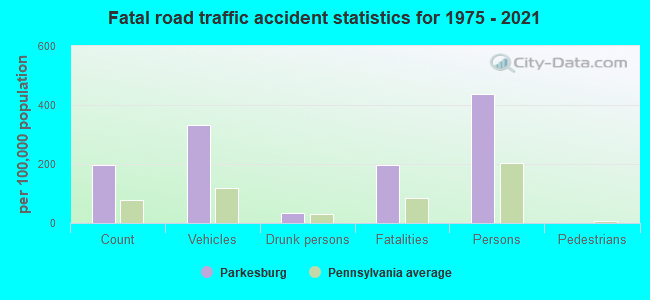
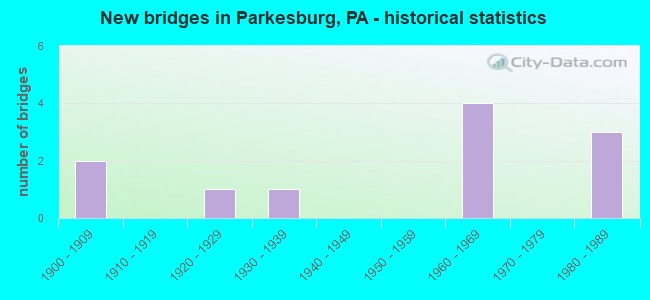
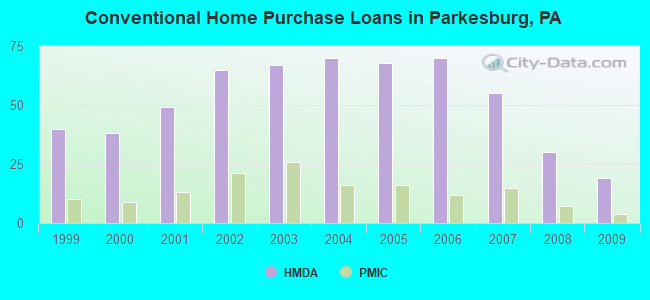
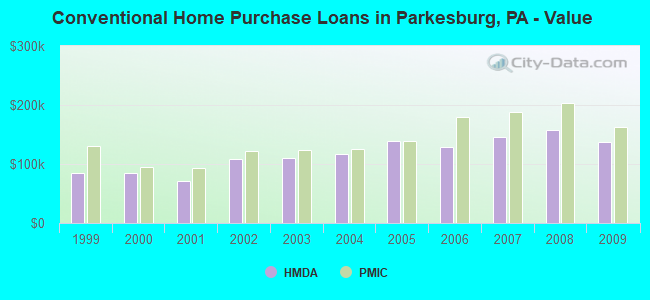
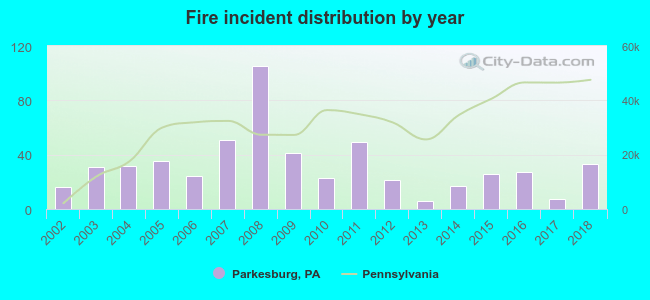 According to the data from the years 2002 - 2018 the average number of fires per year is 32. The highest number of reported fire incidents - 105 took place in 2008, and the least - 6 in 2013. The data has a growing trend.
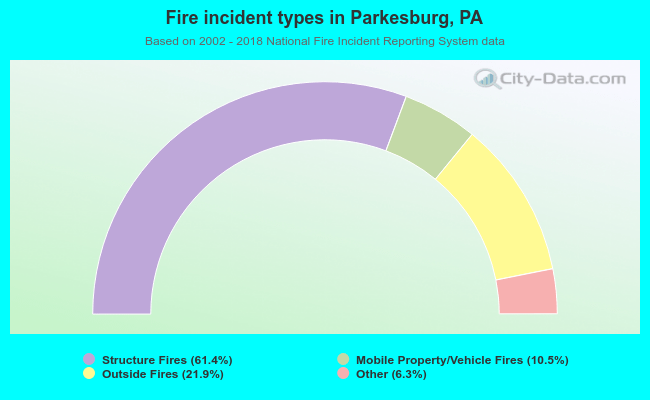 When looking into fire subcategories, the most reports belonged to: Structure Fires (61.4%), and Outside Fires (21.9%).