Pauls Valley, Oklahoma Submit your own pictures of this city and show them to the world
OSM Map
General Map
Google Map
MSN Map
OSM Map
General Map
Google Map
MSN Map
OSM Map
General Map
Google Map
MSN Map
OSM Map
General Map
Google Map
MSN Map
Please wait while loading the map...
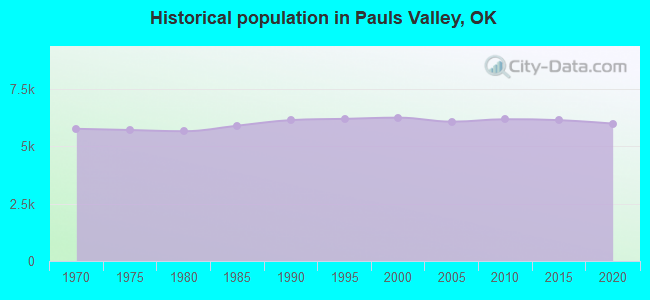
Population in 2022: 6,026 (92% urban, 8% rural). Population change since 2000: -3.7%Males: 3,091 Females: 2,935
March 2022 cost of living index in Pauls Valley: 78.1 (low, U.S. average is 100) Percentage of residents living in poverty in 2022: 20.1%for White Non-Hispanic residents , 24.7% for Black residents , 22.1% for Hispanic or Latino residents , 10.1% for American Indian residents , 15.0% for other race residents , 37.8% for two or more races residents )
Profiles of local businesses
Business Search - 14 Million verified businesses
Data:
Median household income ($)
Median household income (% change since 2000)
Household income diversity
Ratio of average income to average house value (%)
Ratio of average income to average rent
Median household income ($) - White
Median household income ($) - Black or African American
Median household income ($) - Asian
Median household income ($) - Hispanic or Latino
Median household income ($) - American Indian and Alaska Native
Median household income ($) - Multirace
Median household income ($) - Other Race
Median household income for houses/condos with a mortgage ($)
Median household income for apartments without a mortgage ($)
Races - White alone (%)
Races - White alone (% change since 2000)
Races - Black alone (%)
Races - Black alone (% change since 2000)
Races - American Indian alone (%)
Races - American Indian alone (% change since 2000)
Races - Asian alone (%)
Races - Asian alone (% change since 2000)
Races - Hispanic (%)
Races - Hispanic (% change since 2000)
Races - Native Hawaiian and Other Pacific Islander alone (%)
Races - Native Hawaiian and Other Pacific Islander alone (% change since 2000)
Races - Two or more races (%)
Races - Two or more races (% change since 2000)
Races - Other race alone (%)
Races - Other race alone (% change since 2000)
Racial diversity
Unemployment (%)
Unemployment (% change since 2000)
Unemployment (%) - White
Unemployment (%) - Black or African American
Unemployment (%) - Asian
Unemployment (%) - Hispanic or Latino
Unemployment (%) - American Indian and Alaska Native
Unemployment (%) - Multirace
Unemployment (%) - Other Race
Population density (people per square mile)
Population - Males (%)
Population - Females (%)
Population - Males (%) - White
Population - Males (%) - Black or African American
Population - Males (%) - Asian
Population - Males (%) - Hispanic or Latino
Population - Males (%) - American Indian and Alaska Native
Population - Males (%) - Multirace
Population - Males (%) - Other Race
Population - Females (%) - White
Population - Females (%) - Black or African American
Population - Females (%) - Asian
Population - Females (%) - Hispanic or Latino
Population - Females (%) - American Indian and Alaska Native
Population - Females (%) - Multirace
Population - Females (%) - Other Race
Coronavirus confirmed cases (Apr 27, 2024)
Deaths caused by coronavirus (Apr 27, 2024)
Coronavirus confirmed cases (per 100k population) (Apr 27, 2024)
Deaths caused by coronavirus (per 100k population) (Apr 27, 2024)
Daily increase in number of cases (Apr 27, 2024)
Weekly increase in number of cases (Apr 27, 2024)
Cases doubled (in days) (Apr 27, 2024)
Hospitalized patients (Apr 18, 2022)
Negative test results (Apr 18, 2022)
Total test results (Apr 18, 2022)
COVID Vaccine doses distributed (per 100k population) (Sep 19, 2023)
COVID Vaccine doses administered (per 100k population) (Sep 19, 2023)
COVID Vaccine doses distributed (Sep 19, 2023)
COVID Vaccine doses administered (Sep 19, 2023)
Likely homosexual households (%)
Likely homosexual households (% change since 2000)
Likely homosexual households - Lesbian couples (%)
Likely homosexual households - Lesbian couples (% change since 2000)
Likely homosexual households - Gay men (%)
Likely homosexual households - Gay men (% change since 2000)
Cost of living index
Median gross rent ($)
Median contract rent ($)
Median monthly housing costs ($)
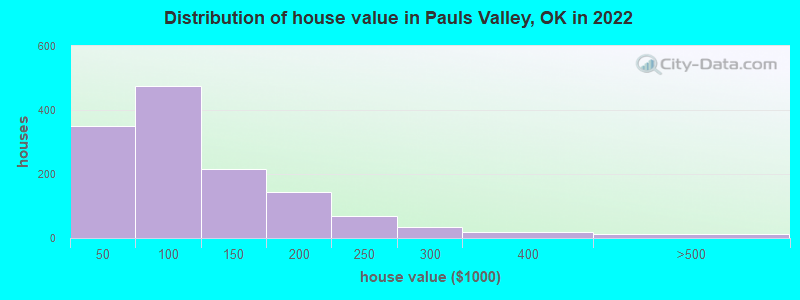
Median house or condo value ($)
Median house or condo value ($ change since 2000)
Mean house or condo value by units in structure - 1, detached ($)
Mean house or condo value by units in structure - 1, attached ($)
Mean house or condo value by units in structure - 2 ($)
Mean house or condo value by units in structure by units in structure - 3 or 4 ($)
Mean house or condo value by units in structure - 5 or more ($)
Mean house or condo value by units in structure - Boat, RV, van, etc. ($)
Mean house or condo value by units in structure - Mobile home ($)
Median house or condo value ($) - White
Median house or condo value ($) - Black or African American
Median house or condo value ($) - Asian
Median house or condo value ($) - Hispanic or Latino
Median house or condo value ($) - American Indian and Alaska Native
Median house or condo value ($) - Multirace
Median house or condo value ($) - Other Race
Median resident age
Resident age diversity
Median resident age - Males
Median resident age - Females
Median resident age - White
Median resident age - Black or African American
Median resident age - Asian
Median resident age - Hispanic or Latino
Median resident age - American Indian and Alaska Native
Median resident age - Multirace
Median resident age - Other Race
Median resident age - Males - White
Median resident age - Males - Black or African American
Median resident age - Males - Asian
Median resident age - Males - Hispanic or Latino
Median resident age - Males - American Indian and Alaska Native
Median resident age - Males - Multirace
Median resident age - Males - Other Race
Median resident age - Females - White
Median resident age - Females - Black or African American
Median resident age - Females - Asian
Median resident age - Females - Hispanic or Latino
Median resident age - Females - American Indian and Alaska Native
Median resident age - Females - Multirace
Median resident age - Females - Other Race
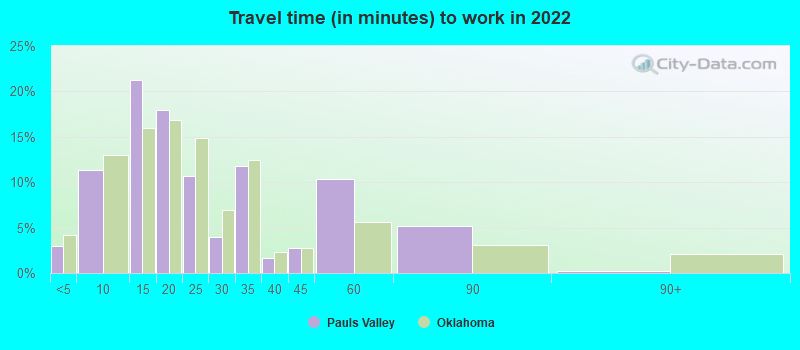
Commute - mean travel time to work (minutes)
Travel time to work - Less than 5 minutes (%)
Travel time to work - Less than 5 minutes (% change since 2000)
Travel time to work - 5 to 9 minutes (%)
Travel time to work - 5 to 9 minutes (% change since 2000)
Travel time to work - 10 to 19 minutes (%)
Travel time to work - 10 to 19 minutes (% change since 2000)
Travel time to work - 20 to 29 minutes (%)
Travel time to work - 20 to 29 minutes (% change since 2000)
Travel time to work - 30 to 39 minutes (%)
Travel time to work - 30 to 39 minutes (% change since 2000)
Travel time to work - 40 to 59 minutes (%)
Travel time to work - 40 to 59 minutes (% change since 2000)
Travel time to work - 60 to 89 minutes (%)
Travel time to work - 60 to 89 minutes (% change since 2000)
Travel time to work - 90 or more minutes (%)
Travel time to work - 90 or more minutes (% change since 2000)
Marital status - Never married (%)
Marital status - Now married (%)
Marital status - Separated (%)
Marital status - Widowed (%)
Marital status - Divorced (%)
Median family income ($)
Median family income (% change since 2000)
Median non-family income ($)
Median non-family income (% change since 2000)
Median per capita income ($)
Median per capita income (% change since 2000)
Median family income ($) - White
Median family income ($) - Black or African American
Median family income ($) - Asian
Median family income ($) - Hispanic or Latino
Median family income ($) - American Indian and Alaska Native
Median family income ($) - Multirace
Median family income ($) - Other Race
Median year house/condo built
Median year apartment built
Year house built - Built 2005 or later (%)
Year house built - Built 2000 to 2004 (%)
Year house built - Built 1990 to 1999 (%)
Year house built - Built 1980 to 1989 (%)
Year house built - Built 1970 to 1979 (%)
Year house built - Built 1960 to 1969 (%)
Year house built - Built 1950 to 1959 (%)
Year house built - Built 1940 to 1949 (%)
Year house built - Built 1939 or earlier (%)
Average household size
Household density (households per square mile)
Average household size - White
Average household size - Black or African American
Average household size - Asian
Average household size - Hispanic or Latino
Average household size - American Indian and Alaska Native
Average household size - Multirace
Average household size - Other Race
Occupied housing units (%)
Vacant housing units (%)
Owner occupied housing units (%)
Renter occupied housing units (%)
Vacancy status - For rent (%)
Vacancy status - For sale only (%)
Vacancy status - Rented or sold, not occupied (%)
Vacancy status - For seasonal, recreational, or occasional use (%)
Vacancy status - For migrant workers (%)
Vacancy status - Other vacant (%)
Residents with income below the poverty level (%)
Residents with income below 50% of the poverty level (%)
Children below poverty level (%)
Poor families by family type - Married-couple family (%)
Poor families by family type - Male, no wife present (%)
Poor families by family type - Female, no husband present (%)
Poverty status for native-born residents (%)
Poverty status for foreign-born residents (%)
Poverty among high school graduates not in families (%)
Poverty among people who did not graduate high school not in families (%)
Residents with income below the poverty level (%) - White
Residents with income below the poverty level (%) - Black or African American
Residents with income below the poverty level (%) - Asian
Residents with income below the poverty level (%) - Hispanic or Latino
Residents with income below the poverty level (%) - American Indian and Alaska Native
Residents with income below the poverty level (%) - Multirace
Residents with income below the poverty level (%) - Other Race
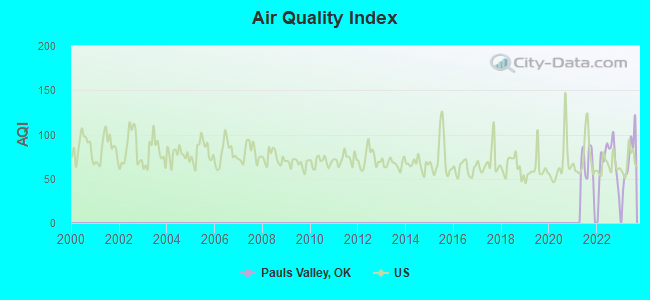
Air pollution - Air Quality Index (AQI)
Air pollution - CO
Air pollution - NO2
Air pollution - SO2
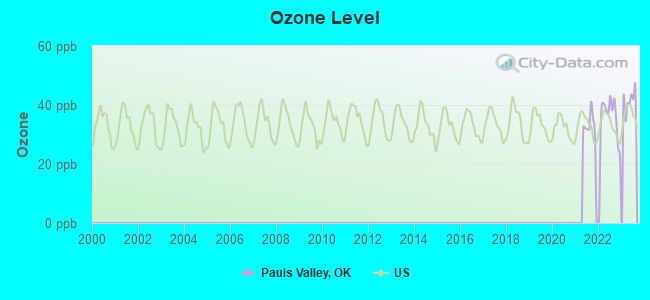
Air pollution - Ozone
Air pollution - PM10
Air pollution - PM25
Air pollution - Pb
Crime - Murders per 100,000 population
Crime - Rapes per 100,000 population
Crime - Robberies per 100,000 population
Crime - Assaults per 100,000 population
Crime - Burglaries per 100,000 population
Crime - Thefts per 100,000 population
Crime - Auto thefts per 100,000 population
Crime - Arson per 100,000 population
Crime - City-data.com crime index
Crime - Violent crime index
Crime - Property crime index
Crime - Murders per 100,000 population (5 year average)
Crime - Rapes per 100,000 population (5 year average)
Crime - Robberies per 100,000 population (5 year average)
Crime - Assaults per 100,000 population (5 year average)
Crime - Burglaries per 100,000 population (5 year average)
Crime - Thefts per 100,000 population (5 year average)
Crime - Auto thefts per 100,000 population (5 year average)
Crime - Arson per 100,000 population (5 year average)
Crime - City-data.com crime index (5 year average)
Crime - Violent crime index (5 year average)
Crime - Property crime index (5 year average)
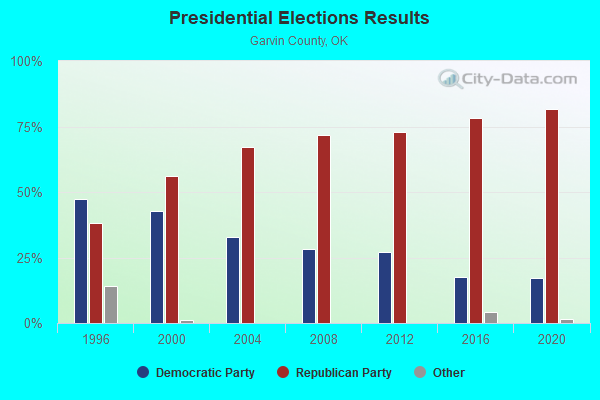
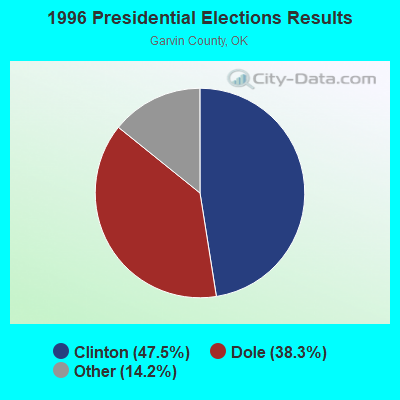
1996 Presidential Elections Results (%) - Democratic Party (Clinton)
1996 Presidential Elections Results (%) - Republican Party (Dole)
1996 Presidential Elections Results (%) - Other
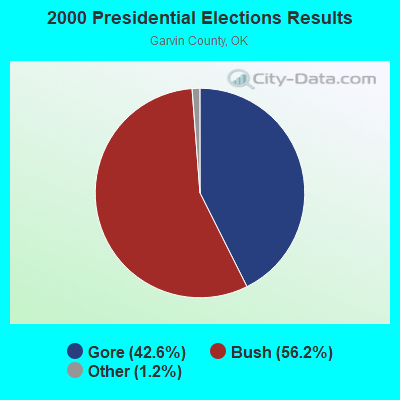
2000 Presidential Elections Results (%) - Democratic Party (Gore)
2000 Presidential Elections Results (%) - Republican Party (Bush)
2000 Presidential Elections Results (%) - Other
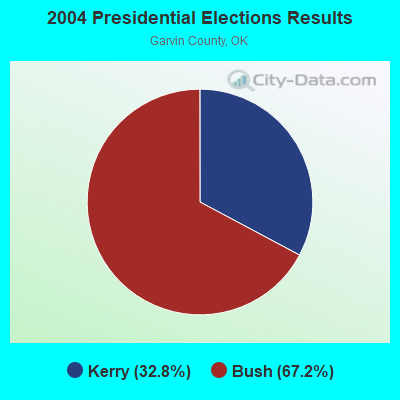
2004 Presidential Elections Results (%) - Democratic Party (Kerry)
2004 Presidential Elections Results (%) - Republican Party (Bush)
2004 Presidential Elections Results (%) - Other
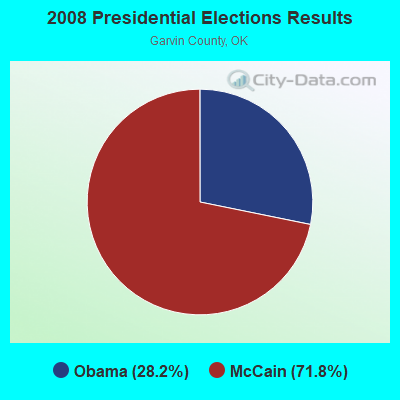
2008 Presidential Elections Results (%) - Democratic Party (Obama)
2008 Presidential Elections Results (%) - Republican Party (McCain)
2008 Presidential Elections Results (%) - Other
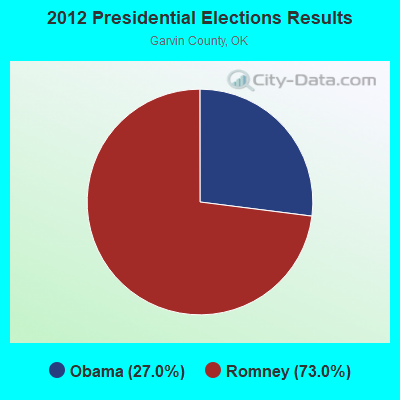
2012 Presidential Elections Results (%) - Democratic Party (Obama)
2012 Presidential Elections Results (%) - Republican Party (Romney)
2012 Presidential Elections Results (%) - Other
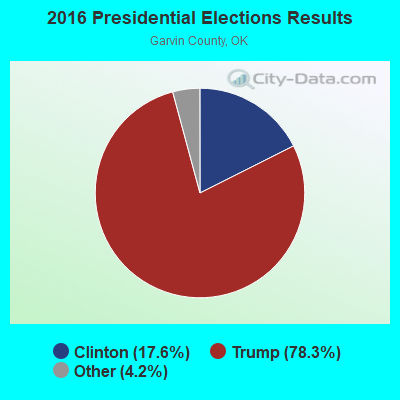
2016 Presidential Elections Results (%) - Democratic Party (Clinton)
2016 Presidential Elections Results (%) - Republican Party (Trump)
2016 Presidential Elections Results (%) - Other
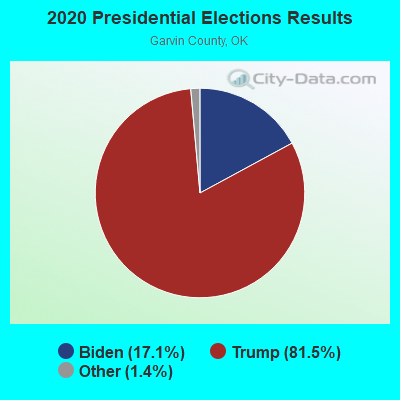
2020 Presidential Elections Results (%) - Democratic Party (Biden)
2020 Presidential Elections Results (%) - Republican Party (Trump)
2020 Presidential Elections Results (%) - Other
Ancestries Reported - Arab (%)
Ancestries Reported - Czech (%)
Ancestries Reported - Danish (%)
Ancestries Reported - Dutch (%)
Ancestries Reported - English (%)
Ancestries Reported - French (%)
Ancestries Reported - French Canadian (%)
Ancestries Reported - German (%)
Ancestries Reported - Greek (%)
Ancestries Reported - Hungarian (%)
Ancestries Reported - Irish (%)
Ancestries Reported - Italian (%)
Ancestries Reported - Lithuanian (%)
Ancestries Reported - Norwegian (%)
Ancestries Reported - Polish (%)
Ancestries Reported - Portuguese (%)
Ancestries Reported - Russian (%)
Ancestries Reported - Scotch-Irish (%)
Ancestries Reported - Scottish (%)
Ancestries Reported - Slovak (%)
Ancestries Reported - Subsaharan African (%)
Ancestries Reported - Swedish (%)
Ancestries Reported - Swiss (%)
Ancestries Reported - Ukrainian (%)
Ancestries Reported - United States (%)
Ancestries Reported - Welsh (%)
Ancestries Reported - West Indian (%)
Ancestries Reported - Other (%)
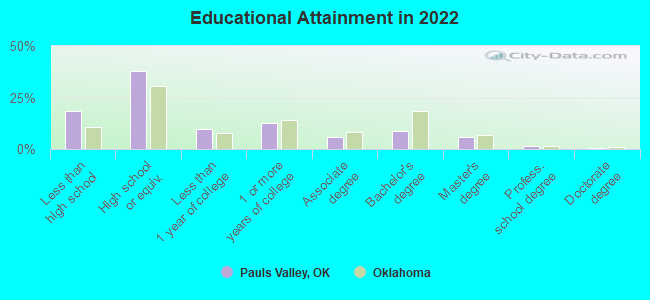
Educational Attainment - No schooling completed (%)
Educational Attainment - Less than high school (%)
Educational Attainment - High school or equivalent (%)
Educational Attainment - Less than 1 year of college (%)
Educational Attainment - 1 or more years of college (%)
Educational Attainment - Associate degree (%)
Educational Attainment - Bachelor's degree (%)
Educational Attainment - Master's degree (%)
Educational Attainment - Professional school degree (%)
Educational Attainment - Doctorate degree (%)
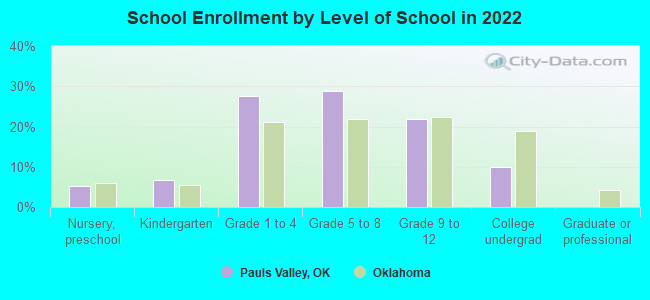
School Enrollment - Nursery, preschool (%)
School Enrollment - Kindergarten (%)
School Enrollment - Grade 1 to 4 (%)
School Enrollment - Grade 5 to 8 (%)
School Enrollment - Grade 9 to 12 (%)
School Enrollment - College undergrad (%)
School Enrollment - Graduate or professional (%)
School Enrollment - Not enrolled in school (%)
School enrollment - Public schools (%)
School enrollment - Private schools (%)
School enrollment - Not enrolled (%)
Median number of rooms in houses and condos
Median number of rooms in apartments
Housing units lacking complete plumbing facilities (%)
Housing units lacking complete kitchen facilities (%)
Density of houses
Urban houses (%)
Rural houses (%)
Households with people 60 years and over (%)
Households with people 65 years and over (%)
Households with people 75 years and over (%)
Households with one or more nonrelatives (%)
Households with no nonrelatives (%)
Population in households (%)
Family households (%)
Nonfamily households (%)
Population in families (%)
Family households with own children (%)
Median number of bedrooms in owner occupied houses
Mean number of bedrooms in owner occupied houses
Median number of bedrooms in renter occupied houses
Mean number of bedrooms in renter occupied houses
Median number of vehichles in owner occupied houses
Mean number of vehichles in owner occupied houses
Median number of vehichles in renter occupied houses
Mean number of vehichles in renter occupied houses
Mortgage status - with mortgage (%)
Mortgage status - with second mortgage (%)
Mortgage status - with home equity loan (%)
Mortgage status - with both second mortgage and home equity loan (%)
Mortgage status - without a mortgage (%)
Average family size
Average family size - White
Average family size - Black or African American
Average family size - Asian
Average family size - Hispanic or Latino
Average family size - American Indian and Alaska Native
Average family size - Multirace
Average family size - Other Race
Geographical mobility - Same house 1 year ago (%)
Geographical mobility - Moved within same county (%)
Geographical mobility - Moved from different county within same state (%)
Geographical mobility - Moved from different state (%)
Geographical mobility - Moved from abroad (%)
Place of birth - Born in state of residence (%)
Place of birth - Born in other state (%)
Place of birth - Native, outside of US (%)
Place of birth - Foreign born (%)
Housing units in structures - 1, detached (%)
Housing units in structures - 1, attached (%)
Housing units in structures - 2 (%)
Housing units in structures - 3 or 4 (%)
Housing units in structures - 5 to 9 (%)
Housing units in structures - 10 to 19 (%)
Housing units in structures - 20 to 49 (%)
Housing units in structures - 50 or more (%)
Housing units in structures - Mobile home (%)
Housing units in structures - Boat, RV, van, etc. (%)
House/condo owner moved in on average (years ago)
Renter moved in on average (years ago)
Year householder moved into unit - Moved in 1999 to March 2000 (%)
Year householder moved into unit - Moved in 1995 to 1998 (%)
Year householder moved into unit - Moved in 1990 to 1994 (%)
Year householder moved into unit - Moved in 1980 to 1989 (%)
Year householder moved into unit - Moved in 1970 to 1979 (%)
Year householder moved into unit - Moved in 1969 or earlier (%)
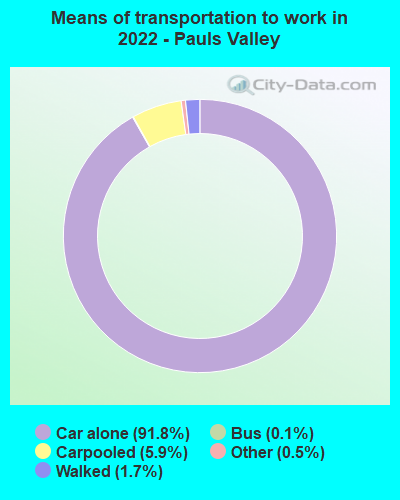
Means of transportation to work - Drove car alone (%)
Means of transportation to work - Carpooled (%)
Means of transportation to work - Public transportation (%)
Means of transportation to work - Bus or trolley bus (%)
Means of transportation to work - Streetcar or trolley car (%)
Means of transportation to work - Subway or elevated (%)
Means of transportation to work - Railroad (%)
Means of transportation to work - Ferryboat (%)
Means of transportation to work - Taxicab (%)
Means of transportation to work - Motorcycle (%)
Means of transportation to work - Bicycle (%)
Means of transportation to work - Walked (%)
Means of transportation to work - Other means (%)
Working at home (%)
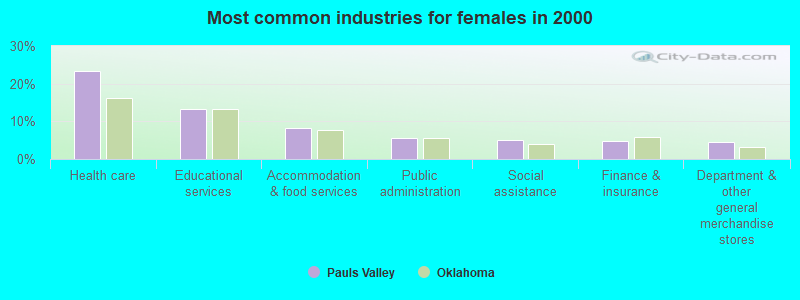
Industry diversity
Most Common Industries - Agriculture, forestry, fishing and hunting, and mining (%)
Most Common Industries - Agriculture, forestry, fishing and hunting (%)
Most Common Industries - Mining, quarrying, and oil and gas extraction (%)
Most Common Industries - Construction (%)
Most Common Industries - Manufacturing (%)
Most Common Industries - Wholesale trade (%)
Most Common Industries - Retail trade (%)
Most Common Industries - Transportation and warehousing, and utilities (%)
Most Common Industries - Transportation and warehousing (%)
Most Common Industries - Utilities (%)
Most Common Industries - Information (%)
Most Common Industries - Finance and insurance, and real estate and rental and leasing (%)
Most Common Industries - Finance and insurance (%)
Most Common Industries - Real estate and rental and leasing (%)
Most Common Industries - Professional, scientific, and management, and administrative and waste management services (%)
Most Common Industries - Professional, scientific, and technical services (%)
Most Common Industries - Management of companies and enterprises (%)
Most Common Industries - Administrative and support and waste management services (%)
Most Common Industries - Educational services, and health care and social assistance (%)
Most Common Industries - Educational services (%)
Most Common Industries - Health care and social assistance (%)
Most Common Industries - Arts, entertainment, and recreation, and accommodation and food services (%)
Most Common Industries - Arts, entertainment, and recreation (%)
Most Common Industries - Accommodation and food services (%)
Most Common Industries - Other services, except public administration (%)
Most Common Industries - Public administration (%)
Occupation diversity
Most Common Occupations - Management, business, science, and arts occupations (%)
Most Common Occupations - Management, business, and financial occupations (%)
Most Common Occupations - Management occupations (%)
Most Common Occupations - Business and financial operations occupations (%)
Most Common Occupations - Computer, engineering, and science occupations (%)
Most Common Occupations - Computer and mathematical occupations (%)
Most Common Occupations - Architecture and engineering occupations (%)
Most Common Occupations - Life, physical, and social science occupations (%)
Most Common Occupations - Education, legal, community service, arts, and media occupations (%)
Most Common Occupations - Community and social service occupations (%)
Most Common Occupations - Legal occupations (%)
Most Common Occupations - Education, training, and library occupations (%)
Most Common Occupations - Arts, design, entertainment, sports, and media occupations (%)
Most Common Occupations - Healthcare practitioners and technical occupations (%)
Most Common Occupations - Health diagnosing and treating practitioners and other technical occupations (%)
Most Common Occupations - Health technologists and technicians (%)
Most Common Occupations - Service occupations (%)
Most Common Occupations - Healthcare support occupations (%)
Most Common Occupations - Protective service occupations (%)
Most Common Occupations - Fire fighting and prevention, and other protective service workers including supervisors (%)
Most Common Occupations - Law enforcement workers including supervisors (%)
Most Common Occupations - Food preparation and serving related occupations (%)
Most Common Occupations - Building and grounds cleaning and maintenance occupations (%)
Most Common Occupations - Personal care and service occupations (%)
Most Common Occupations - Sales and office occupations (%)
Most Common Occupations - Sales and related occupations (%)
Most Common Occupations - Office and administrative support occupations (%)
Most Common Occupations - Natural resources, construction, and maintenance occupations (%)
Most Common Occupations - Farming, fishing, and forestry occupations (%)
Most Common Occupations - Construction and extraction occupations (%)
Most Common Occupations - Installation, maintenance, and repair occupations (%)
Most Common Occupations - Production, transportation, and material moving occupations (%)
Most Common Occupations - Production occupations (%)
Most Common Occupations - Transportation occupations (%)
Most Common Occupations - Material moving occupations (%)
People in Group quarters - Institutionalized population (%)
People in Group quarters - Correctional institutions (%)
People in Group quarters - Federal prisons and detention centers (%)
People in Group quarters - Halfway houses (%)
People in Group quarters - Local jails and other confinement facilities (including police lockups) (%)
People in Group quarters - Military disciplinary barracks (%)
People in Group quarters - State prisons (%)
People in Group quarters - Other types of correctional institutions (%)
People in Group quarters - Nursing homes (%)
People in Group quarters - Hospitals/wards, hospices, and schools for the handicapped (%)
People in Group quarters - Hospitals/wards and hospices for chronically ill (%)
People in Group quarters - Hospices or homes for chronically ill (%)
People in Group quarters - Military hospitals or wards for chronically ill (%)
People in Group quarters - Other hospitals or wards for chronically ill (%)
People in Group quarters - Hospitals or wards for drug/alcohol abuse (%)
People in Group quarters - Mental (Psychiatric) hospitals or wards (%)
People in Group quarters - Schools, hospitals, or wards for the mentally retarded (%)
People in Group quarters - Schools, hospitals, or wards for the physically handicapped (%)
People in Group quarters - Institutions for the deaf (%)
People in Group quarters - Institutions for the blind (%)
People in Group quarters - Orthopedic wards and institutions for the physically handicapped (%)
People in Group quarters - Wards in general hospitals for patients who have no usual home elsewhere (%)
People in Group quarters - Wards in military hospitals for patients who have no usual home elsewhere (%)
People in Group quarters - Juvenile institutions (%)
People in Group quarters - Long-term care (%)
People in Group quarters - Homes for abused, dependent, and neglected children (%)
People in Group quarters - Residential treatment centers for emotionally disturbed children (%)
People in Group quarters - Training schools for juvenile delinquents (%)
People in Group quarters - Short-term care, detention or diagnostic centers for delinquent children (%)
People in Group quarters - Type of juvenile institution unknown (%)
People in Group quarters - Noninstitutionalized population (%)
People in Group quarters - College dormitories (includes college quarters off campus) (%)
People in Group quarters - Military quarters (%)
People in Group quarters - On base (%)
People in Group quarters - Barracks, unaccompanied personnel housing (UPH), (Enlisted/Officer), ;and similar group living quarters for military personnel (%)
People in Group quarters - Transient quarters for temporary residents (%)
People in Group quarters - Military ships (%)
People in Group quarters - Group homes (%)
People in Group quarters - Homes or halfway houses for drug/alcohol abuse (%)
People in Group quarters - Homes for the mentally ill (%)
People in Group quarters - Homes for the mentally retarded (%)
People in Group quarters - Homes for the physically handicapped (%)
People in Group quarters - Other group homes (%)
People in Group quarters - Religious group quarters (%)
People in Group quarters - Dormitories (%)
People in Group quarters - Agriculture workers' dormitories on farms (%)
People in Group quarters - Job Corps and vocational training facilities (%)
People in Group quarters - Other workers' dormitories (%)
People in Group quarters - Crews of maritime vessels (%)
People in Group quarters - Other nonhousehold living situations (%)
People in Group quarters - Other noninstitutional group quarters (%)
Residents speaking English at home (%)
Residents speaking English at home - Born in the United States (%)
Residents speaking English at home - Native, born elsewhere (%)
Residents speaking English at home - Foreign born (%)
Residents speaking Spanish at home (%)
Residents speaking Spanish at home - Born in the United States (%)
Residents speaking Spanish at home - Native, born elsewhere (%)
Residents speaking Spanish at home - Foreign born (%)
Residents speaking other language at home (%)
Residents speaking other language at home - Born in the United States (%)
Residents speaking other language at home - Native, born elsewhere (%)
Residents speaking other language at home - Foreign born (%)
Class of Workers - Employee of private company (%)
Class of Workers - Self-employed in own incorporated business (%)
Class of Workers - Private not-for-profit wage and salary workers (%)
Class of Workers - Local government workers (%)
Class of Workers - State government workers (%)
Class of Workers - Federal government workers (%)
Class of Workers - Self-employed workers in own not incorporated business and Unpaid family workers (%)
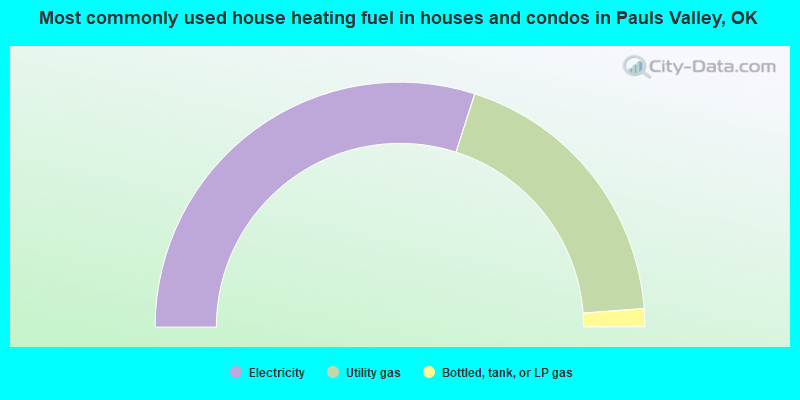
House heating fuel used in houses and condos - Utility gas (%)
House heating fuel used in houses and condos - Bottled, tank, or LP gas (%)
House heating fuel used in houses and condos - Electricity (%)
House heating fuel used in houses and condos - Fuel oil, kerosene, etc. (%)
House heating fuel used in houses and condos - Coal or coke (%)
House heating fuel used in houses and condos - Wood (%)
House heating fuel used in houses and condos - Solar energy (%)
House heating fuel used in houses and condos - Other fuel (%)
House heating fuel used in houses and condos - No fuel used (%)
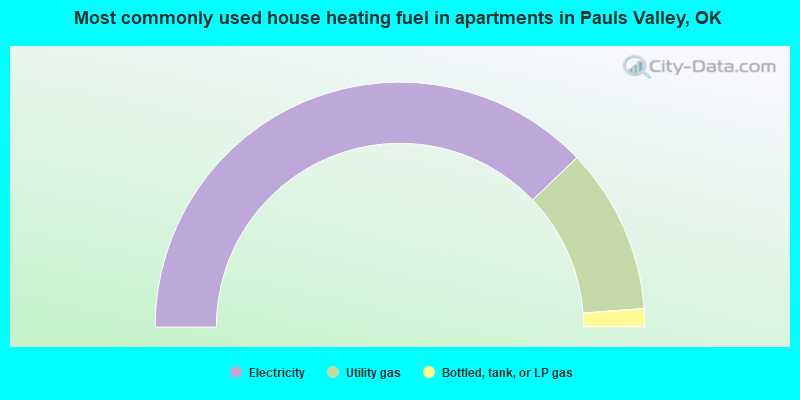
House heating fuel used in apartments - Utility gas (%)
House heating fuel used in apartments - Bottled, tank, or LP gas (%)
House heating fuel used in apartments - Electricity (%)
House heating fuel used in apartments - Fuel oil, kerosene, etc. (%)
House heating fuel used in apartments - Coal or coke (%)
House heating fuel used in apartments - Wood (%)
House heating fuel used in apartments - Solar energy (%)
House heating fuel used in apartments - Other fuel (%)
House heating fuel used in apartments - No fuel used (%)
Armed forces status - In Armed Forces (%)
Armed forces status - Civilian (%)
Armed forces status - Civilian - Veteran (%)
Armed forces status - Civilian - Nonveteran (%)
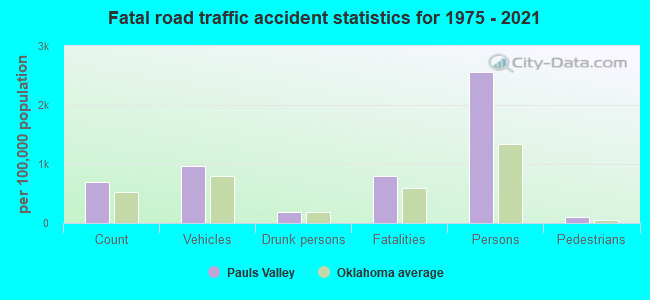
Fatal accidents locations in years 2005-2021
Fatal accidents locations in 2005
Fatal accidents locations in 2006
Fatal accidents locations in 2007
Fatal accidents locations in 2008
Fatal accidents locations in 2009
Fatal accidents locations in 2010
Fatal accidents locations in 2011
Fatal accidents locations in 2012
Fatal accidents locations in 2013
Fatal accidents locations in 2014
Fatal accidents locations in 2015
Fatal accidents locations in 2016
Fatal accidents locations in 2017
Fatal accidents locations in 2018
Fatal accidents locations in 2019
Fatal accidents locations in 2020
Fatal accidents locations in 2021
Alcohol use - People drinking some alcohol every month (%)
Alcohol use - People not drinking at all (%)
Alcohol use - Average days/month drinking alcohol
Alcohol use - Average drinks/week
Alcohol use - Average days/year people drink much
Audiometry - Average condition of hearing (%)
Audiometry - People that can hear a whisper from across a quiet room (%)
Audiometry - People that can hear normal voice from across a quiet room (%)
Audiometry - Ears ringing, roaring, buzzing (%)
Audiometry - Had a job exposure to loud noise (%)
Audiometry - Had off-work exposure to loud noise (%)
Blood Pressure & Cholesterol - Has high blood pressure (%)
Blood Pressure & Cholesterol - Checking blood pressure at home (%)
Blood Pressure & Cholesterol - Frequently checking blood cholesterol (%)
Blood Pressure & Cholesterol - Has high cholesterol level (%)
Consumer Behavior - Money monthly spent on food at supermarket/grocery store
Consumer Behavior - Money monthly spent on food at other stores
Consumer Behavior - Money monthly spent on eating out
Consumer Behavior - Money monthly spent on carryout/delivered foods
Consumer Behavior - Income spent on food at supermarket/grocery store (%)
Consumer Behavior - Income spent on food at other stores (%)
Consumer Behavior - Income spent on eating out (%)
Consumer Behavior - Income spent on carryout/delivered foods (%)
Current Health Status - General health condition (%)
Current Health Status - Blood donors (%)
Current Health Status - Has blood ever tested for HIV virus (%)
Current Health Status - Left-handed people (%)
Dermatology - People using sunscreen (%)
Diabetes - Diabetics (%)
Diabetes - Had a blood test for high blood sugar (%)
Diabetes - People taking insulin (%)
Diet Behavior & Nutrition - Diet health (%)
Diet Behavior & Nutrition - Milk product consumption (# of products/month)
Diet Behavior & Nutrition - Meals not home prepared (#/week)
Diet Behavior & Nutrition - Meals from fast food or pizza place (#/week)
Diet Behavior & Nutrition - Ready-to-eat foods (#/month)
Diet Behavior & Nutrition - Frozen meals/pizza (#/month)
Drug Use - People that ever used marijuana or hashish (%)
Drug Use - Ever used hard drugs (%)
Drug Use - Ever used any form of cocaine (%)
Drug Use - Ever used heroin (%)
Drug Use - Ever used methamphetamine (%)
Health Insurance - People covered by health insurance (%)
Kidney Conditions-Urology - Avg. # of times urinating at night
Medical Conditions - People with asthma (%)
Medical Conditions - People with anemia (%)
Medical Conditions - People with psoriasis (%)
Medical Conditions - People with overweight (%)
Medical Conditions - Elderly people having difficulties in thinking or remembering (%)
Medical Conditions - People who ever received blood transfusion (%)
Medical Conditions - People having trouble seeing even with glass/contacts (%)
Medical Conditions - People with arthritis (%)
Medical Conditions - People with gout (%)
Medical Conditions - People with congestive heart failure (%)
Medical Conditions - People with coronary heart disease (%)
Medical Conditions - People with angina pectoris (%)
Medical Conditions - People who ever had heart attack (%)
Medical Conditions - People who ever had stroke (%)
Medical Conditions - People with emphysema (%)
Medical Conditions - People with thyroid problem (%)
Medical Conditions - People with chronic bronchitis (%)
Medical Conditions - People with any liver condition (%)
Medical Conditions - People who ever had cancer or malignancy (%)
Mental Health - People who have little interest in doing things (%)
Mental Health - People feeling down, depressed, or hopeless (%)
Mental Health - People who have trouble sleeping or sleeping too much (%)
Mental Health - People feeling tired or having little energy (%)
Mental Health - People with poor appetite or overeating (%)
Mental Health - People feeling bad about themself (%)
Mental Health - People who have trouble concentrating on things (%)
Mental Health - People moving or speaking slowly or too fast (%)
Mental Health - People having thoughts they would be better off dead (%)
Oral Health - Average years since last visit a dentist
Oral Health - People embarrassed because of mouth (%)
Oral Health - People with gum disease (%)
Oral Health - General health of teeth and gums (%)
Oral Health - Average days a week using dental floss/device
Oral Health - Average days a week using mouthwash for dental problem
Oral Health - Average number of teeth
Pesticide Use - Households using pesticides to control insects (%)
Pesticide Use - Households using pesticides to kill weeds (%)
Physical Activity - People doing vigorous-intensity work activities (%)
Physical Activity - People doing moderate-intensity work activities (%)
Physical Activity - People walking or bicycling (%)
Physical Activity - People doing vigorous-intensity recreational activities (%)
Physical Activity - People doing moderate-intensity recreational activities (%)
Physical Activity - Average hours a day doing sedentary activities
Physical Activity - Average hours a day watching TV or videos
Physical Activity - Average hours a day using computer
Physical Functioning - People having limitations keeping them from working (%)
Physical Functioning - People limited in amount of work they can do (%)
Physical Functioning - People that need special equipment to walk (%)
Physical Functioning - People experiencing confusion/memory problems (%)
Physical Functioning - People requiring special healthcare equipment (%)
Prescription Medications - Average number of prescription medicines taking
Preventive Aspirin Use - Adults 40+ taking low-dose aspirin (%)
Reproductive Health - Vaginal deliveries (%)
Reproductive Health - Cesarean deliveries (%)
Reproductive Health - Deliveries resulted in a live birth (%)
Reproductive Health - Pregnancies resulted in a delivery (%)
Reproductive Health - Women breastfeeding newborns (%)
Reproductive Health - Women that had a hysterectomy (%)
Reproductive Health - Women that had both ovaries removed (%)
Reproductive Health - Women that have ever taken birth control pills (%)
Reproductive Health - Women taking birth control pills (%)
Reproductive Health - Women that have ever used Depo-Provera or injectables (%)
Reproductive Health - Women that have ever used female hormones (%)
Sexual Behavior - People 18+ that ever had sex (vaginal, anal, or oral) (%)
Sexual Behavior - Males 18+ that ever had vaginal sex with a woman (%)
Sexual Behavior - Males 18+ that ever performed oral sex on a woman (%)
Sexual Behavior - Males 18+ that ever had anal sex with a woman (%)
Sexual Behavior - Males 18+ that ever had any sex with a man (%)
Sexual Behavior - Females 18+ that ever had vaginal sex with a man (%)
Sexual Behavior - Females 18+ that ever performed oral sex on a man (%)
Sexual Behavior - Females 18+ that ever had anal sex with a man (%)
Sexual Behavior - Females 18+ that ever had any kind of sex with a woman (%)
Sexual Behavior - Average age people first had sex
Sexual Behavior - Average number of female sex partners in lifetime (males 18+)
Sexual Behavior - Average number of female vaginal sex partners in lifetime (males 18+)
Sexual Behavior - Average age people first performed oral sex on a woman (18+)
Sexual Behavior - Average number of woman performed oral sex on in lifetime (18+)
Sexual Behavior - Average number of male sex partners in lifetime (males 18+)
Sexual Behavior - Average number of male anal sex partners in lifetime (males 18+)
Sexual Behavior - Average age people first performed oral sex on a man (18+)
Sexual Behavior - Average number of male oral sex partners in lifetime (18+)
Sexual Behavior - People using protection when performing oral sex (%)
Sexual Behavior - Average number of times people have vaginal or anal sex a year
Sexual Behavior - People having sex without condom (%)
Sexual Behavior - Average number of male sex partners in lifetime (females 18+)
Sexual Behavior - Average number of male vaginal sex partners in lifetime (females 18+)
Sexual Behavior - Average number of female sex partners in lifetime (females 18+)
Sexual Behavior - Circumcised males 18+ (%)
Sleep Disorders - Average hours sleeping at night
Sleep Disorders - People that has trouble sleeping (%)
Smoking-Cigarette Use - People smoking cigarettes (%)
Taste & Smell - People 40+ having problems with smell (%)
Taste & Smell - People 40+ having problems with taste (%)
Taste & Smell - People 40+ that ever had wisdom teeth removed (%)
Taste & Smell - People 40+ that ever had tonsils teeth removed (%)
Taste & Smell - People 40+ that ever had a loss of consciousness because of a head injury (%)
Taste & Smell - People 40+ that ever had a broken nose or other serious injury to face or skull (%)
Taste & Smell - People 40+ that ever had two or more sinus infections (%)
Weight - Average height (inches)
Weight - Average weight (pounds)
Weight - Average BMI
Weight - People that are obese (%)
Weight - People that ever were obese (%)
Weight - People trying to lose weight (%)
Officers per 1,000 residents here:
2.46Oklahoma average:
2.27
Latest news from Pauls Valley, OK collected exclusively by city-data.com from local newspapers, TV, and radio stations
Ancestries: American (11.9%), Irish (9.0%), English (5.2%), Scotch-Irish (4.4%), Italian (2.2%), European (1.9%).
Current Local Time:
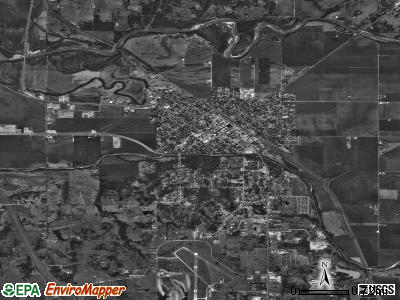
Land area: 8.34 square miles.
Population density: 722 people per square mile (low).
497 residents are foreign born (7.5% Latin America ).
This city:
8.1%Oklahoma:
6.1%
Median real estate property taxes paid for housing units with mortgages in 2022: $896 (0.6%)Median real estate property taxes paid for housing units with no mortgage in 2022: $477 (0.7%)
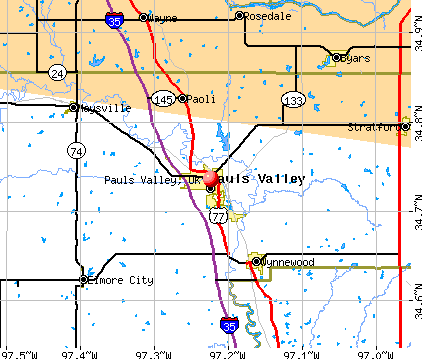
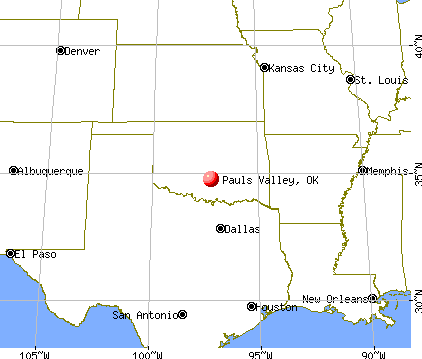
Nearest city with pop. 50,000+: Norman, OK
Nearest city with pop. 200,000+: Oklahoma City, OK
Nearest city with pop. 1,000,000+: Dallas, TX
Nearest cities:
Rosedale, OK (3.6 miles),
Latitude: 34.74 N, Longitude: 97.22 W
Daytime population change due to commuting: +1,375 (+22.5%)Workers who live and work in this city: 1,327 (52.1%)
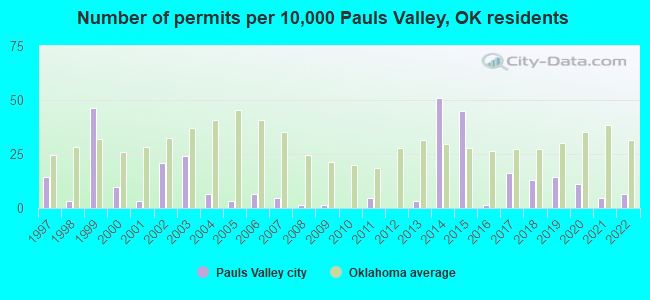
Single-family new house construction building permits:
2022: 4 buildings , average cost: $197,5002021: 3 buildings , average cost: $239,0002020: 7 buildings , average cost: $89,2002019: 9 buildings , average cost: $89,2002018: 8 buildings , average cost: $89,2002017: 10 buildings , average cost: $89,2002016: 1 building , cost: $108,0002015: 28 buildings , average cost: $87,1002014: 32 buildings , average cost: $85,5002013: 2 buildings , average cost: $129,5002011: 3 buildings , average cost: $137,3002009: 1 building , cost: $200,0002008: 1 building , cost: $220,0002007: 3 buildings , average cost: $78,3002006: 4 buildings , average cost: $153,6002005: 2 buildings , average cost: $234,6002004: 4 buildings , average cost: $130,3002003: 15 buildings , average cost: $63,2002002: 13 buildings , average cost: $63,2002001: 2 buildings , average cost: $170,0002000: 6 buildings , average cost: $91,2001999: 29 buildings , average cost: $66,7001998: 2 buildings , average cost: $60,0001997: 9 buildings , average cost: $75,700Unemployment in December 2023:
Population change in the 1990s: +76 (+1.2%).
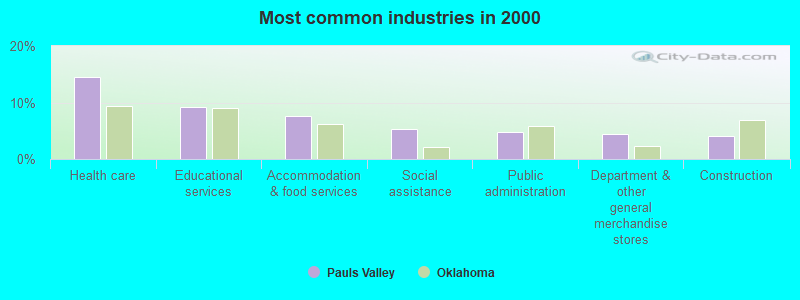
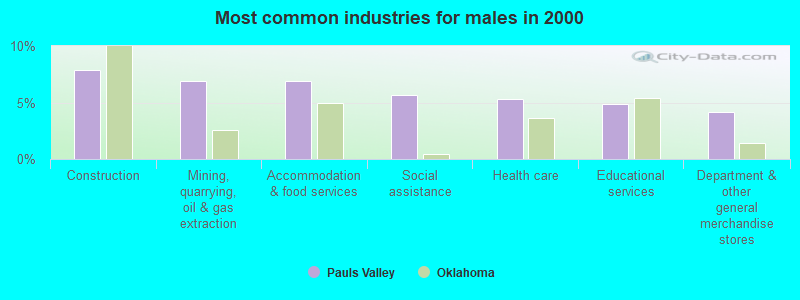
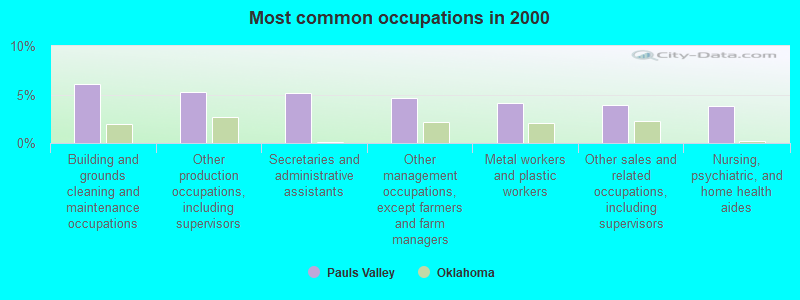
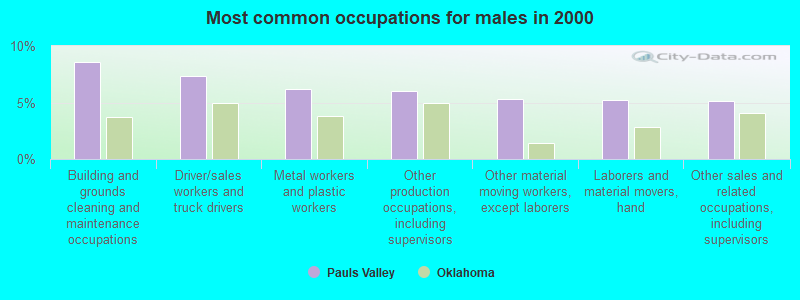
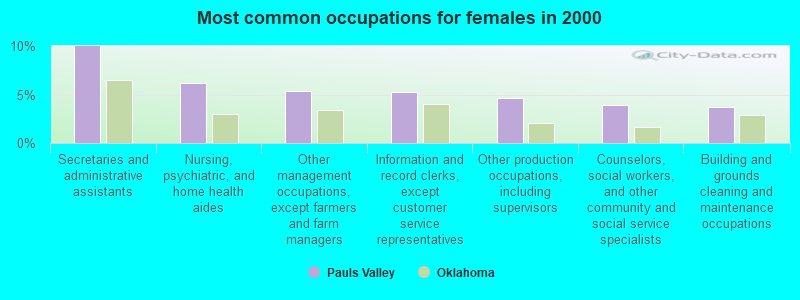
Most common occupations in Pauls Valley, OK (%)
Both Males Females
Building and grounds cleaning and maintenance occupations (6.1%)
Other production occupations, including supervisors (5.3%)
Secretaries and administrative assistants (5.2%)
Other management occupations, except farmers and farm managers (4.7%)
Metal workers and plastic workers (4.1%)
Other sales and related occupations, including supervisors (3.9%)
Nursing, psychiatric, and home health aides (3.8%)
Building and grounds cleaning and maintenance occupations (8.6%)
Driver/sales workers and truck drivers (7.4%)
Metal workers and plastic workers (6.2%)
Other production occupations, including supervisors (6.0%)
Other material moving workers, except laborers (5.3%)
Laborers and material movers, hand (5.3%)
Other sales and related occupations, including supervisors (5.2%)
Secretaries and administrative assistants (10.0%)
Nursing, psychiatric, and home health aides (6.2%)
Other management occupations, except farmers and farm managers (5.4%)
Information and record clerks, except customer service representatives (5.3%)
Other production occupations, including supervisors (4.7%)
Counselors, social workers, and other community and social service specialists (3.9%)
Building and grounds cleaning and maintenance occupations (3.8%)
Air pollution and air quality trends(lower is better)
AQI Ozone
Tornado activity:
Pauls Valley-area historical tornado activity is slightly above Oklahoma state average. It is 212% greater than the overall U.S. average.
On 4/19/1972, a category F4 (max. wind speeds 207-260 mph) tornado 13.1 miles away from the Pauls Valley city center killed 5 people and injured 6 people and caused between $5000 and $50,000 in damages.
On 9/14/1957, a category F4 tornado 14.9 miles away from the city center killed 2 people and injured 6 people and caused between $50,000 and $500,000 in damages.
Earthquake activity:
Pauls Valley-area historical earthquake activity is significantly above Oklahoma state average. It is 731% greater than the overall U.S. average. On 11/6/2011 at 03:53:10, a magnitude 5.7 (5.7 MW, Depth: 3.2 mi, Class: Moderate, Intensity: VI - VII) earthquake occurred 60.9 miles away from Pauls Valley center On 9/3/2016 at 12:02:44, a magnitude 5.8 (5.8 MW, Depth: 3.5 mi) earthquake occurred 118.0 miles away from Pauls Valley center On 11/7/2016 at 01:44:24, a magnitude 5.0 (5.0 MW, Depth: 2.8 mi) earthquake occurred 90.0 miles away from the city center On 11/8/2011 at 02:46:57, a magnitude 4.8 (4.8 MW, Depth: 3.1 mi, Class: Light, Intensity: IV - V) earthquake occurred 60.3 miles away from Pauls Valley center On 11/5/2011 at 07:12:45, a magnitude 4.8 (4.8 MW, Depth: 1.9 mi) earthquake occurred 62.0 miles away from the city center On 2/13/2016 at 17:07:06, a magnitude 5.1 (5.1 MW, Depth: 5.2 mi) earthquake occurred 147.3 miles away from Pauls Valley center Magnitude types: moment magnitude (MW) Natural disasters: The number of natural disasters in Garvin County (29) is a lot greater than the US average (15).Major Disasters (Presidential) Declared: 20Emergencies Declared: 6Storms: 14, Floods: 12, Tornadoes: 9, Winter Storms: 8, Fires: 3, Winds: 2, Heavy Rain: 1, Hurricane: 1, Ice Storm: 1, Snow: 1, Other: 1 (Note: some incidents may be assigned to more than one category). Hospitals and medical centers in Pauls Valley: PAULS VALLEY GENERAL HOSPITAL (Government - Hospital District or Authority, 100 VALLEY DRIVE) SOUTHERN OKLAHOMA RESOURCE CENTER OF PAULS VALLEY ("ROUTE 1, BOX 44A") PAULS VALLEY CARE CENTER (1413 SOUTH CHICKASAW)
WASHITA VALLEY LIVING CENTER (105 WASHINGTON)
FMCNA - PAULS VALLEY (310 S CHICKASAW)
PAULS VALLEY GENERAL HOSPITAL HOME SERVICES (100 VALLEY DRIVE)
PROFESSIONAL HOME CARE OF GARVIN COUNTY (2510 WEST GRANT AVENUE)
Amtrak station: PAULS VALLEY (1 SANTA FE PLAZA)
.
Services: fully wheelchair accessible.
Colleges/universities with over 2000 students nearest to Pauls Valley:
East Central University (about 32 miles; Ada, OK ; Full-time enrollment: 4,030)
University of Oklahoma-Norman Campus (about 36 miles; Norman, OK ; FT enrollment: 22,496)
Mid-America Christian University (about 47 miles; Oklahoma City, OK ; FT enrollment: 2,869)
Oklahoma City Community College (about 50 miles; Oklahoma City, OK ; FT enrollment: 8,904)
Rose State College (about 51 miles; Midwest City, OK ; FT enrollment: 4,896)
University of Oklahoma-Health Sciences Center (about 54 miles; Oklahoma City, OK ; FT enrollment: 2,507)
Oklahoma State University-Oklahoma City (about 56 miles; Oklahoma City, OK ; FT enrollment: 4,784)
Public high schools in Pauls Valley:
Public elementary/middle schools in Pauls Valley: WHITEBEAD PUBLIC SCHOOL Students: 410, Location: 16476 NORTH COUNTY ROAD 3200, Grades: PK-8)JACKSON ES Students: 304, Location: 1015 SOUTH WALNUT, Grades: 1-3)LEE ES Students: 237, Location: 301 WEST BERT, Grades: 4-6)See full list of schools located in Pauls Valley Library in Pauls Valley: PAULS VALLEY-NORA SPARKS WARREN MEM LIBRARY Operating income: $122,806; Location: 210 N WILLOW ST; 36,011 books ; 349 audio materials ; 673 video materials ; 23 state licensed databases ; 57 print serial subscriptions )
Notable location: (A) . Display/hide its location on the map
Shopping Centers: (1) , Valley Plaza Shopping Center (2) . Display/hide their locations on the map
Churches in Pauls Valley include: (A) , Southside Church (B) , Presbyterian Church (C) , Methodist Church (D) , Life Spring Family Church (E) , First Christian Church (F) , First Baptist Church (G) , First Church of God (H) , First Assembly of God (I) . Display/hide their locations on the map
Cemeteries: (1) , The Old Cemetery (2) , Mount Olivet Cemetery (3) , State School Cemetery (4) . Display/hide their locations on the map
Reservoirs: (A) , Oknoname 04915 Reservoir (B) . Display/hide their locations on the map
Park in Pauls Valley: (1) . Display/hide its location on the map
Tourist attractions: (1) , Santa Fe Depot (Cultural Attractions- Events- & Facilities; 204 South Santa Fe Street) (2) , Kings Kids (Amusement & Theme Parks; 122 West Charles Avenue) (3) , Royal Twin Theatre (117 East Paul Avenue) (4) . Display/hide their approximate locations on the map
Hotels: (1) , Days Inn Pauls Valley (2606 West Grant Avenue) (2) , Days Inn (Highway 19 And I # 35) (3) , Economy Inn Express (1409 South Chickasaw Street) (4) , Garden Inn Motel (Highway 19 & I 35) (5) , Sands Inn (Interstate 35 & S H) (6) , Relax Inn (2506 West Grant Avenue) (7) . Display/hide their approximate locations on the map
Courts: (1) , Garvin County - District Judge- Special Judge District Court (Courthouse) (2) . Display/hide their approximate locations on the map
Birthplace of: Barbara Pyle - Environmentalist, G. D. Spradlin - Actor, Jean Shepard - Country singer.
Garvin County has a predicted average indoor radon screening level less than 2 pCi/L (pico curies per liter) - Low Potential Drinking water stations with addresses in Pauls Valley and their reported violations in the past:
GARVIN CO RWD #1 (Population served: 1,445, Groundwater):
Past health violations:
MCL, Monthly (TCR) - In SEP-2008, Contaminant: Coliform. Follow-up actions: St Public Notif requested (OCT-27-2008), St Violation/Reminder Notice (OCT-27-2008), St Compliance achieved (OCT-31-2008), St Public Notif received (OCT-31-2008)
MCL, Monthly (TCR) - In AUG-2007, Contaminant: Coliform. Follow-up actions: St Public Notif requested (SEP-26-2007), St Violation/Reminder Notice (2 times from SEP-26-2007 to OCT-17-2007), St Compliance achieved (OCT-22-2007), St Public Notif received (OCT-22-2007)
MCL, Acute (TCR) - In AUG-2007, Contaminant: Coliform. Follow-up actions: St Public Notif requested (AUG-09-2007), St Boil Water Order (AUG-09-2007), St Compliance achieved (AUG-10-2007), St Violation/Reminder Notice (OCT-17-2007), St Public Notif received (OCT-22-2007)
Past monitoring violations:
Initial Tap Sampling for Pb and Cu - In OCT-01-2009, Contaminant: Lead and Copper Rule. Follow-up actions: St Public Notif requested (JAN-27-2010), St Violation/Reminder Notice (JAN-27-2010), St Public Notif received (FEB-16-2010), St Compliance achieved (AUG-09-2010)
Address: 32151 HWY 19 Population served: 1,150, Purch surface water):
Past health violations:
MCL, Monthly (TCR) - In JUN-2007, Contaminant: Coliform. Follow-up actions: St Public Notif requested (JUL-25-2007), St Violation/Reminder Notice (JUL-25-2007), St Compliance achieved (AUG-08-2007), St Public Notif received (AUG-08-2007)
Past monitoring violations:
Monitoring, Routine (IDSE) - Between JAN-2009 and MAR-2009, Contaminant: Total Haloacetic Acids (HAA5). Follow-up actions: St Compliance achieved (MAY-08-2014)
Monitoring, Routine (IDSE) - Between JAN-2009 and MAR-2009, Contaminant: TTHM. Follow-up actions: St Compliance achieved (MAY-08-2014)
One routine major monitoring violation
Average household size: This city:
2.4 peopleOklahoma:
2.5 people
Percentage of family households: This city:
59.4%Whole state:
66.8%
Percentage of households with unmarried partners: This city:
6.3%Whole state:
5.9%
Likely homosexual households (counted as self-reported same-sex unmarried-partner households)
Lesbian couples: 0.3% of all households Gay men: 0.2% of all households
People in group quarters in Pauls Valley in 2010:
139 people in state prisons
44 people in nursing facilities/skilled-nursing facilities
28 people in local jails and other municipal confinement facilities
8 people in group homes intended for adults
People in group quarters in Pauls Valley in 2000:
176 people in other nonhousehold living situations
115 people in nursing homes
62 people in local jails and other confinement facilities (including police lockups)
21 people in homes for the mentally retarded
Banks with branches in Pauls Valley (2011 data):
The Pauls Valley National Bank: Motor Bank Branch, at 101 West Paul Avenue, Www.Pvnational.com, Pauls Valley Branch. Info updated 2011/03/14: Bank assets: $214.3 mil, Deposits: $188.1 mil, local headquarters , positive income , 6 total offices , Holding Company: Valley Bancshares Incorporated
First United Bank and Trust Company: Pauls Valley Meridian Branch at 2000 West Grant, branch established on 2009/03/28; Pauls Valley Branch at 315 West Grant Avenue, branch established on 1893/10/01. Info updated 2006/11/03: Bank assets: $2,060.2 mil, Deposits: $1,702.6 mil, headquarters in Durant, OK, positive income , Commercial Lending Specialization, 31 total offices , Holding Company: Durant Bancorp, Inc.
International Bank of Commerce: Pauls Valley Branch at 700 W. Grant, branch established on 1988/06/30. Info updated 2007/03/28: Bank assets: $9,621.9 mil, Deposits: $6,548.8 mil, headquarters in Laredo, TX, positive income , Commercial Lending Specialization, 197 total offices , Holding Company: International Bancshares Corporation
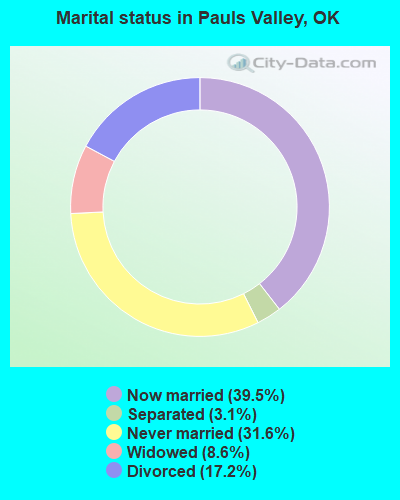
For population 15 years and over in Pauls Valley:
Never married: 31.6%Now married: 39.5%Separated: 3.1%Widowed: 8.6%Divorced: 17.2% For population 25 years and over in Pauls Valley:
High school or higher: 80.7%Bachelor's degree or higher: 15.1%Graduate or professional degree: 6.9%Unemployed: 8.2%Mean travel time to work (commute): 22.8 minutes
Education Gini index (Inequality in education) Here:
12.7Oklahoma average:
11.3
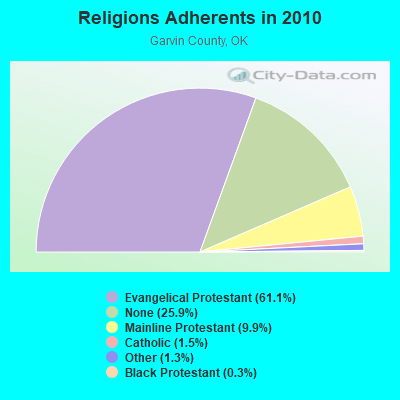
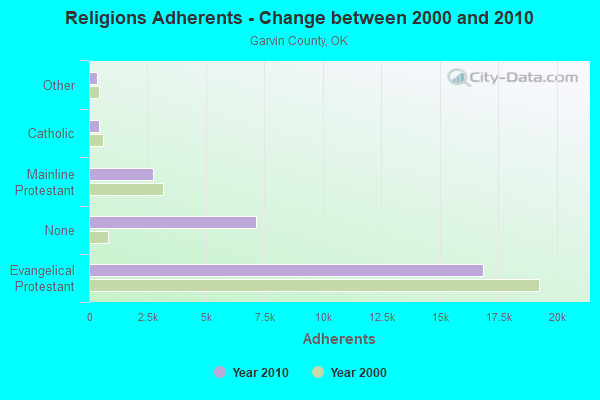
Religion statistics for Pauls Valley, OK (based on Garvin County data)
Religion Adherents Congregations Evangelical Protestant 16,855 70 Mainline Protestant 2,733 13 Catholic 410 3 Other 361 3 Black Protestant 74 1 None 7,143 -
Source: Clifford Grammich, Kirk Hadaway, Richard Houseal, Dale E.Jones, Alexei Krindatch, Richie Stanley and Richard H.Taylor. 2012. 2010 U.S.Religion Census: Religious Congregations & Membership Study. Association of Statisticians of American Religious Bodies. Jones, Dale E., et al. 2002. Congregations and Membership in the United States 2000. Nashville, TN: Glenmary Research Center. Graphs represent county-level data
Food Environment Statistics: Number of grocery stores : 12This county :
4.43 / 10,000 pop.Oklahoma :
1.97 / 10,000 pop.
Number of convenience stores (no gas) : 2Garvin County :
0.74 / 10,000 pop.Oklahoma :
0.76 / 10,000 pop.
Number of convenience stores (with gas) : 16Garvin County :
5.90 / 10,000 pop.State :
4.35 / 10,000 pop.
Number of full-service restaurants : 22Garvin County :
8.12 / 10,000 pop.State :
6.89 / 10,000 pop.
Adult diabetes rate : Garvin County :
11.4%State :
10.3%
Adult obesity rate : This county :
28.9%State :
29.2%
Health and Nutrition: Healthy diet rate : This city:
47.1%Oklahoma:
48.6%
Average overall health of teeth and gums : This city:
42.7%Oklahoma:
45.2%
Average BMI : This city:
28.9Oklahoma:
28.7
People feeling badly about themselves : Pauls Valley:
22.2%State:
21.4%
People not drinking alcohol at all : Average hours sleeping at night : Pauls Valley:
6.8Oklahoma:
6.8
Overweight people : Pauls Valley:
34.3%Oklahoma:
33.9%
General health condition : Pauls Valley:
52.9%State:
55.2%
Average condition of hearing : Pauls Valley:
76.6%State:
78.4%
More about Health and Nutrition of Pauls Valley, OK Residents
Local government employment and payroll (March 2022)
Function
Full-time employees
Monthly full-time payroll
Average yearly full-time wage
Part-time employees
Monthly part-time payroll
Parks and Recreation
17 $46,859 $33,077 28 $16,087 Police Protection - Officers
15 $63,027 $50,422 0 $0 Water Supply
11 $32,614 $35,579 0 $0 Firefighters
10 $42,602 $51,122 0 $0 Other and Unallocable
10 $25,838 $31,006 0 $0 Solid Waste Management
9 $23,469 $31,292 0 $0 Streets and Highways
6 $18,921 $37,842 0 $0 Police - Other
5 $12,139 $29,134 0 $0 Financial Administration
3 $23,424 $93,696 0 $0 Local Libraries
3 $8,166 $32,664 1 $1,036 Health
3 $6,244 $24,976 0 $0 Other Government Administration
3 $29,183 $116,732 0 $0 Sewerage
3 $7,744 $30,976 0 $0 Judicial and Legal
1 $2,749 $32,988 1 $694
Totals for Government
99 $342,979 $41,573 30 $17,817
Pauls Valley government finances - Expenditure in 2021 (per resident):
Current Operations - Hospitals: $14,182,000 ($2353.47)
Parks and Recreation: $2,006,000 ($332.89)Police Protection: $1,860,000 ($308.66)Central Staff Services: $1,723,000 ($285.93)Solid Waste Management: $1,136,000 ($188.52)Local Fire Protection: $1,080,000 ($179.22)Air Transportation: $901,000 ($149.52)Water Utilities: $837,000 ($138.90)Regular Highways: $616,000 ($102.22)Housing and Community Development: $580,000 ($96.25)Sewerage: $491,000 ($81.48)Miscellaneous Commercial Activities - Other: $336,000 ($55.76)Libraries: $278,000 ($46.13)Health - Other: $128,000 ($21.24)General - Other: $122,000 ($20.25)General - Interest on Debt: $246,000 ($40.82)
Other Capital Outlay - Regular Highways: $558,000 ($92.60)
Police Protection: $125,000 ($20.74)Parks and Recreation: $114,000 ($18.92)Libraries: $75,000 ($12.45)Housing and Community Development: $66,000 ($10.95)Air Transportation: $50,000 ($8.30)General - Other: $12,000 ($1.99)Solid Waste Management: $11,000 ($1.83)Local Fire Protection: $8,000 ($1.33)Central Staff Services: $7,000 ($1.16)Water Utilities - Interest on Debt: $174,000 ($28.87)
Pauls Valley government finances - Revenue in 2021 (per resident):
Charges - Solid Waste Management: $1,818,000 ($301.69)
Parks and Recreation: $1,227,000 ($203.62)Sewerage: $589,000 ($97.74)Air Transportation: $409,000 ($67.87)Federal Intergovernmental - Sewerage: $127,000 ($21.08)
Water Utilities: $89,000 ($14.77)Other: $13,000 ($2.16)Local Intergovernmental - Other: $6,000 ($1.00)
Miscellaneous - General Revenue - Other: $747,000 ($123.96)
Fines and Forfeits: $299,000 ($49.62)Rents: $79,000 ($13.11)Donations From Private Sources: $39,000 ($6.47)Interest Earnings: $38,000 ($6.31)Royalties: $4,000 ($0.66)Revenue - Water Utilities: $1,570,000 ($260.54)
State Intergovernmental - Other: $407,000 ($67.54)
General Local Government Support: $204,000 ($33.85)Highways: $89,000 ($14.77)Sewerage: $6,000 ($1.00)Water Utilities: $6,000 ($1.00)Tax - General Sales and Gross Receipts: $7,886,000 ($1308.66)
Other Selective Sales: $538,000 ($89.28)Public Utilities Sales: $430,000 ($71.36)Property: $130,000 ($21.57)Other License: $30,000 ($4.98)Other: $29,000 ($4.81)
Pauls Valley government finances - Debt in 2021 (per resident):
Long Term Debt - Beginning Outstanding - Unspecified Public Purpose: $12,674,000 ($2103.22)
Outstanding Unspecified Public Purpose: $11,378,000 ($1888.15)Retired Unspecified Public Purpose: $1,296,000 ($215.07)
Pauls Valley government finances - Cash and Securities in 2021 (per resident):
Bond Funds - Cash and Securities: $3,350,000 ($555.92)
Other Funds - Cash and Securities: $6,209,000 ($1030.37)
Sinking Funds - Cash and Securities: $1,557,000 ($258.38)
Businesses in Pauls Valley, OK
Name Count Name Count
AT&T 2 McDonald's 1 Ace Hardware 1 Nike 2 Arby's 1 Pizza Hut 1 Ashley Furniture 1 RadioShack 1 Comfort Inn 1 SONIC Drive-In 2 Days Inn 1 Subway 1 FedEx 1 T-Mobile 1 Ford 1 Taco Bell 1 H&R Block 1 U-Haul 1 Holiday Inn 1 U.S. Cellular 1 KFC 1 UPS 3 La-Z-Boy 1 Walmart 1
Strongest AM radio stations in Pauls Valley:
KOMA (1520 AM; 50 kW; OKLAHOMA CITY, OK; Owner: RENDA BROADCASTING CORP. OF NEVADA)
KRMG (740 AM; 50 kW; TULSA, OK; Owner: CXR HOLDINGS, INC.)
WWLS (640 AM; 5 kW; MOORE, OK; Owner: CITADEL BROADCASTING COMPANY)
WBAP (820 AM; 50 kW; FORT WORTH, TX; Owner: WBAP-KSCS OPERATING, LTD.)
KFAQ (1170 AM; 50 kW; TULSA, OK; Owner: JOURNAL BROADCAST CORPORATION)
KRLD (1080 AM; 50 kW; DALLAS, TX; Owner: TEXAS INFINITY BROADCASTING L.P.)
KTOK (1000 AM; 5 kW; OKLAHOMA CITY, OK; Owner: CLEAR CHANNEL BROADCASTING LICENSES, INC.)
KFXR (1190 AM; 50 kW; DALLAS, TX; Owner: CLEAR CHANNEL BROADCASTING LICENSES, INC.)
KESS (1270 AM; 50 kW; FORT WORTH, TX; Owner: KESS-AM LICENSE CORP.)
KAHZ (1360 AM; 50 kW; HURST, TX)
KZMP (1540 AM; 50 kW; UNIVERSITY PARK, TX; Owner: ENTRAVISION HOLDINGS, LLC)
KYNG (950 AM; 10 kW; DENISON-SHERMAN, TX; Owner: KRBE LICO, INC.)
WKY (930 AM; 5 kW; OKLAHOMA CITY, OK; Owner: CITADEL BROADCASTING COMPANY)
Strongest FM radio stations in Pauls Valley:
KIXO (106.1 FM; SULPHUR, OK; Owner: DFWU, INC.)
KKNG-FM (93.3 FM; NEWCASTLE, OK; Owner: TYLER BROADCASTING CORPORATION)
KBLP (105.1 FM; LINDSAY, OK; Owner: SO. CENTRAL OKLA. B/C & ADVERTISING)
KSYY (105.3 FM; KINGFISHER, OK; Owner: CITADEL BROADCASTING COMPANY)
KYKC (100.1 FM; BYNG, OK; Owner: CENTRAL OKLAHOMA COMMUNICATIONS CO.)
KFXT (90.7 FM; SULPHUR, OK; Owner: SISTER SHERRY LYNN FOUNDATION, INC.)
TV broadcast stations around Pauls Valley:
KWTV (Channel 9; OKLAHOMA CITY, OK; Owner: GRIFFIN ENTITIES, L.L.C.)
KDSA-LP (Channel 11; NORMAN, OK; Owner: DAY STAR BROADCASTING CORPORATION)
KTEN (Channel 10; ADA, OK; Owner: CHANNEL 49 ACQUISITION CORPORATION)
KXII (Channel 12; SHERMAN, TX; Owner: KXII LICENSEE CORP.)
K44BQ (Channel 44; ARDMORE, OK; Owner: TRINITY BROADCASTING NETWORK)
KQOK (Channel 30; SHAWNEE, OK; Owner: SHAWNEE BROADCASTING, INC.)
K32EK (Channel 32; ARDMORE, OK; Owner: LOCKE SUPPLY COMPANY)
KOKT-LP (Channel 20; SULPHUR, OK; Owner: EQUITY BROADCASTING CORPORATION)
National Bridge Inventory (NBI) Statistics 64 Number of bridges863ft / 263m Total length $56,070,000 Total costs424,375 Total average daily traffic116,285 Total average daily truck traffic
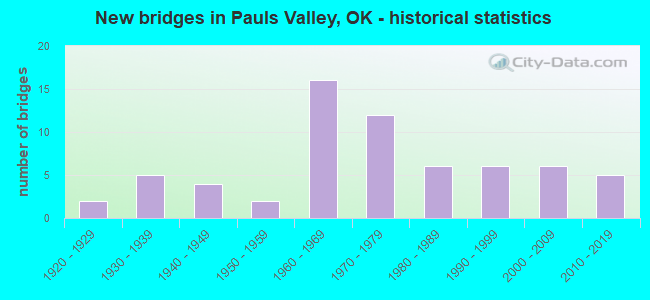
New bridges - historical statistics
2 1920-1929 5 1930-1939 4 1940-1949 2 1950-1959 16 1960-1969 12 1970-1979 6 1980-1989 6 1990-1999 6 2000-2009 5 2010-2019
See full National Bridge Inventory statistics for Pauls Valley, OK
Fire-safe hotels and motels in Pauls Valley, Oklahoma:
Days Inn, 3203 W Grant Ave, Pauls Valley, Oklahoma 73075 Phone: (405) 238-7548
Comfort Inn & Suites, 103 S Humphrey Blvd, Pauls Valley, Oklahoma 73075 Phone: (405) 207-9730, Fax: (405) 238-1439
Holiday Inn Express Hotel & Suites, 2412 W Grant Ave, Pauls Valley, Oklahoma 73075 Phone: (405) 207-9434, Fax: (405) 207-9435
Americas Best Value Inn, 2511 W Grant Ave, Pauls Valley, Oklahoma 73075 Phone: (405) 238-7313, Fax: (405) 238-2648
Hampton Inn & Suites, Pauls Valley, 105 So Humphrey Blvd, Pauls Valley, Oklahoma 73075 Phone: (405) 238-7700, Fax: (405) 238-7701
Hampton Inn & Suites, Pauls Valley, 105 So Humphrey Blvd, Pauls valley, Oklahoma 73075 Phone: (405) 238-7700, Fax: (405) 238-7701
All 6 fire-safe hotels and motels in Pauls Valley, Oklahoma
Most common first names in Pauls Valley, OK among deceased individuals Name Count Lived (average)
John 95 74.9 years James 93 73.3 years William 92 77.4 years Mary 76 78.6 years Robert 60 69.5 years Charles 44 75.1 years George 41 77.8 years Willie 29 82.3 years Ruby 28 78.3 years Joe 27 72.7 years
Most common last names in Pauls Valley, OK among deceased individuals Last name Count Lived (average)
Smith 62 73.5 years Jones 36 72.7 years Williams 35 77.7 years Johnson 32 72.7 years Davis 28 75.2 years Thompson 27 75.2 years Baker 27 75.6 years Ward 25 79.0 years Turner 25 74.7 years Jackson 19 73.8 years
Pauls Valley compared to Oklahoma state average:
Median house value below state average. Unemployed percentage below state average. Length of stay since moving in significantly above state average. Number of college students below state average. Pauls Valley on our top lists :
#29 on the list of "Top 101 cities with the largest percentage of people in other nonhousehold living situations (population 1,000+)"
#78 on the list of "Top 101 cities with largest percentage of males in industries: retail trade (population 5,000+)"
Top Patent Applicants
Oliver Wendell Mccracken (3)
Lorin Jacobson (2)
O. Wendell Mccracken (2)
John Gordon Nelson (1)
James E. Capers (1)
Thomas D. Miller (1)
John G. Nelson (1)
Thomas Olsen (1)
Total of 11 patent applications in 2008-2024.


 Recent articles from our blog. Our writers, many of them Ph.D. graduates or candidates, create easy-to-read articles on a wide variety of topics.

 (35.4 miles
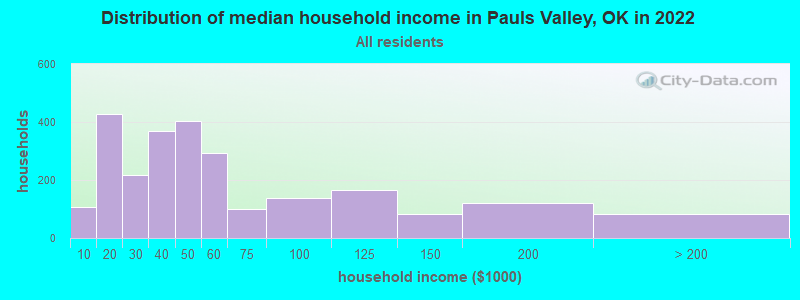


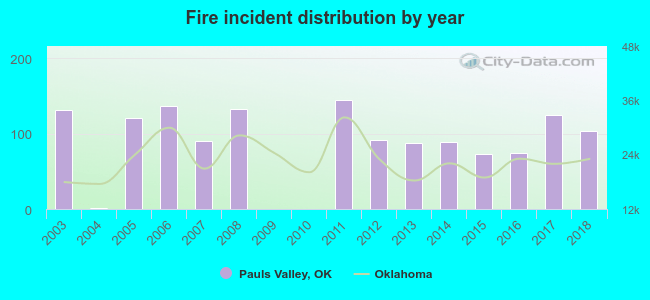 Based on the data from the years 2003 - 2018 the average number of fires per year is 87. The highest number of fire incidents - 144 took place in 2011, and the least - 0 in 2009. The data has a dropping trend.
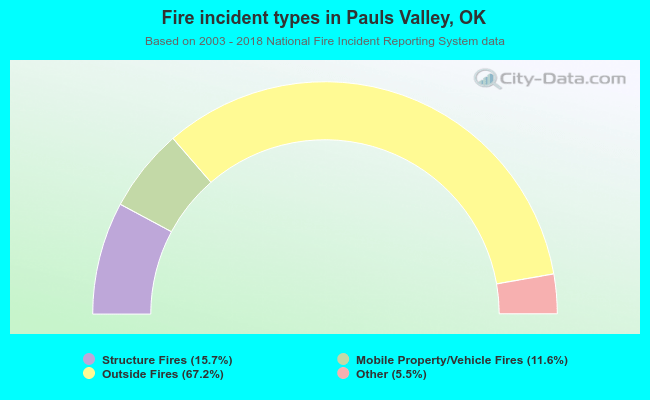 When looking into fire subcategories, the most incidents belonged to: Outside Fires (67.2%), and Structure Fires (15.7%).