Pekin, Illinois

Pekin: Mineral springs park and the park pavillion
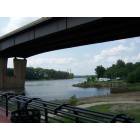
Pekin: River at Pekin

Pekin: view of illinois river from Pekin's riverfront Park
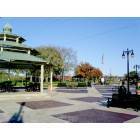
Pekin: Gazebo in Riverfront Park
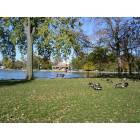
Pekin: Mineral Springs Park Pavilion and lagoon

Pekin: Coal Car on Court St.
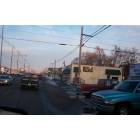
Pekin: Derby Street - Pekin, Illinois
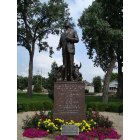
Pekin: Dirksen statue in Mineral Springs Park
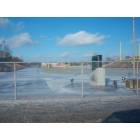
Pekin: Pekin Community High School Stadium and Track - Pekin, Illinois
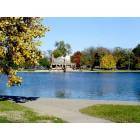
Pekin: Lagoon and Pavilion at Mineral Springs Park. Sidewalk leading into picture.
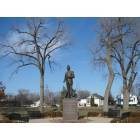
Pekin: Tribute to Everett M. Dirksen located in the Mineral Springs Park
- see
14
more - add
your
Submit your own pictures of this city and show them to the world
- OSM Map
- General Map
- Google Map
- MSN Map
Population change since 2000: -7.7%
 |
| Males: 15,605 | |
| Females: 15,655 |
| Median resident age: | 41.3 years |
| Illinois median age: | 39.1 years |
Zip codes: 61554.
| Pekin: | $51,327 |
| IL: | $76,708 |
Estimated per capita income in 2022: $31,789 (it was $19,616 in 2000)
Pekin city income, earnings, and wages data
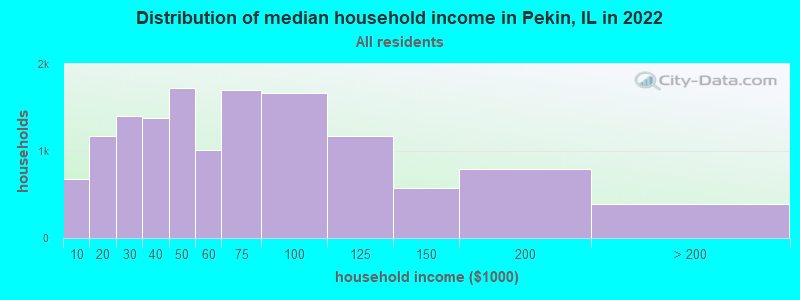
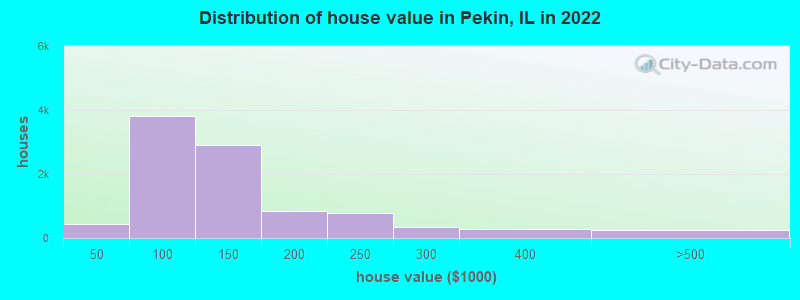
Estimated median house or condo value in 2022: $113,763 (it was $76,100 in 2000)
| Pekin: | $113,763 |
| IL: | $251,600 |
Mean prices in 2022: all housing units: $196,810; detached houses: $199,437; townhouses or other attached units: $209,576; in 2-unit structures: $135,998; in 3-to-4-unit structures: $453,088; in 5-or-more-unit structures: $233,466; mobile homes: $29,584
Median gross rent in 2022: $757.
(14.1% for White Non-Hispanic residents, 61.5% for Black residents, 6.9% for Hispanic or Latino residents, 100.0% for American Indian residents, 52.8% for Native Hawaiian and other Pacific Islander residents, 12.9% for two or more races residents)
Detailed information about poverty and poor residents in Pekin, IL

Compare current foreclosures in Pekin, IL:
| Photo | Address | Area | Beds / Baths | Price | Details |
|---|---|---|---|---|---|

|
#1
2nd St
Pekin, IL 61554
|
1,058 sq. feet
|
1 baths 3 beds |
$127,000
|
show details |

|
#2
State St
Pekin, IL 61554
|
1,652 sq. feet
|
1 baths 6 beds |
$29,900
|
show details |

|
#3
S 7th St
Pekin, IL 61554
|
2,040 sq. feet
|
3 baths 3 beds |
show details | |

|
#4
Royal Ave
Pekin, IL 61554
|
1,324 sq. feet
|
1 baths 3 beds |
show details | |

|
#5
Windsor St
Pekin, IL 61554
|
1,149 sq. feet
|
1 baths 3 beds |
show details | |

|
#6
Franklin St
Pekin, IL 61554
|
1,254 sq. feet
|
2 baths 3 beds |
show details | |

|
#7
Kaskaskia Rd
Pekin, IL 61554
|
2,292 sq. feet
|
2 baths 3 beds |
show details | |

|
#8
Florence Ave
Pekin, IL 61554
|
1,934 sq. feet
|
1 baths 3 beds |
show details | |

|
#9
N 18th St
Pekin, IL 61554
|
1,548 sq. feet
|
1 baths 3 beds |
show details | |

|
#10
Illinois St
Pekin, IL 61554
|
1,008 sq. feet
|
1 baths 2 beds |
show details |
| Photo | Address | Area | Beds / Baths | Price | Details |
|---|---|---|---|---|---|

|
#11
Henry St
Pekin, IL 61554
|
918 sq. feet
|
1 baths 2 beds |
show details | |

|
#12
Illinois St
Pekin, IL 61554
|
840 sq. feet
|
1 baths 2 beds |
show details | |

|
#13
Douglas Rd
Pekin, IL 61554
|
974 sq. feet
|
1 baths 2 beds |
show details | |

|
#14
Parkway Ln
Pekin, IL 61554
|
1,066 sq. feet
|
2 baths 3 beds |
show details | |

|
#15
Radisson Rd
Pekin, IL 61554
|
1,528 sq. feet
|
1 baths 3 beds |
show details | |

|
#16
Cypress St
Pekin, IL 61554
|
1,040 sq. feet
|
2 baths 3 beds |
show details | |

|
#17
Arrow St
Pekin, IL 61554
|
1,120 sq. feet
|
1 baths 3 beds |
show details | |

|
#18
Grand View Ave
Pekin, IL 61554
|
1,256 sq. feet
|
2 baths 3 beds |
show details | |

|
#19
Memory Ln
Pekin, IL 61554
|
1,200 sq. feet
|
1 baths 3 beds |
show details | |

|
#20
Fenley Ave
Pekin, IL 61554
|
944 sq. feet
|
1 baths 3 beds |
show details |
| Photo | Address | Area | Beds / Baths | Price | Details |
|---|---|---|---|---|---|

|
#21
Hillyer St
Pekin, IL 61554
|
726 sq. feet
|
3 baths 4 beds |
show details | |

|
#22
Catherine St
Pekin, IL 61554
|
1,076 sq. feet
|
1 baths 3 beds |
show details | |

|
#23
Charlotte St
Pekin, IL 61554
|
1,384 sq. feet
|
1 baths 3 beds |
show details | |

|
#24
Jefferson St
Pekin, IL 61554
|
1,064 sq. feet
|
2 baths 3 beds |
show details | |

|
#25
Charlotte St
Pekin, IL 61554
|
1,382 sq. feet
|
2 baths 3 beds |
show details | |

|
#26
Highwood Ave
Pekin, IL 61554
|
2,055 sq. feet
|
2 baths 3 beds |
show details | |

|
#27
N Capitol St
Pekin, IL 61554
|
814 sq. feet
|
1 baths 2 beds |
show details | |

|
#28
Hilltop Dr
Pekin, IL 61554
|
1,422 sq. feet
|
1 baths 3 beds |
show details | |

|
#29
Elm St
Pekin, IL 61554
|
1,280 sq. feet
|
2 baths 4 beds |
show details | |

|
#30
Center St
Pekin, IL 61554
|
808 sq. feet
|
1 baths 3 beds |
show details |
| Photo | Address | Area | Beds / Baths | Price | Details |
|---|---|---|---|---|---|

|
#31
Valentine Ave
Pekin, IL 61554
|
1,850 sq. feet
|
1 baths 3 beds |
show details | |

|
#32
Willow St
Pekin, IL 61554
|
1,547 sq. feet
|
1 baths 3 beds |
show details | |

|
#33
Summer St
Pekin, IL 61554
|
876 sq. feet
|
1 baths 2 beds |
show details | |

|
#34
Sierra Ct
Pekin, IL 61554
|
1,650 sq. feet
|
1 baths 3 beds |
show details | |

|
#35
Stout St
Pekin, IL 61554
|
1,448 sq. feet
|
2 baths 3 beds |
show details | |

|
#36
Rainbow Dr
Pekin, IL 61554
|
1,014 sq. feet
|
1 baths 3 beds |
show details | |

|
#37
Rosenberg Ct
Pekin, IL 61554
|
1,180 sq. feet
|
1 baths 3 beds |
show details | |

|
#38
Partridge Rd
Pekin, IL 61554
|
1,092 sq. feet
|
1 baths 3 beds |
show details | |

|
#39
State St
Pekin, IL 61554
|
1,280 sq. feet
|
2 baths 4 beds |
show details | |

|
#40
Fisher St
Pekin, IL 61554
|
936 sq. feet
|
1 baths 1 beds |
show details |
| Photo | Address | Area | Beds / Baths | Price | Details |
|---|---|---|---|---|---|

|
#41
Coolidge Ave
Pekin, IL 61554
|
1,700 sq. feet
|
1 baths 3 beds |
show details | |

|
#42
Glen Ln
Pekin, IL 61554
|
1,590 sq. feet
|
1 baths 3 beds |
show details | |

|
#43
Alton St
Pekin, IL 61554
|
864 sq. feet
|
1 baths 3 beds |
show details | |

|
#44
N 8th St
Pekin, IL 61554
|
- sq. feet
|
- baths - beds |
show details | |

|
#45
N 16th St
Pekin, IL 61554
|
- sq. feet
|
- baths - beds |
show details | |

|
#46
N 2nd St
Pekin, IL 61554
|
- sq. feet
|
- baths - beds |
show details | |

|
#47
S 6th St
Pekin, IL 61554
|
- sq. feet
|
- baths - beds |
show details | |

|
#48
S 3rd St
Pekin, IL 61554
|
- sq. feet
|
- baths - beds |
show details | |

|
#49
N 4th St
Pekin, IL 61554
|
- sq. feet
|
- baths - beds |
show details | |

|
Check over 1 million property listings on Foreclosure.com!
|
browse all offers | |||


- 28,35889.3%White alone
- 1,2003.8%Two or more races
- 9012.8%Hispanic
- 7512.4%Black alone
- 2070.7%Asian alone
- 2040.6%American Indian alone
- 530.2%Native Hawaiian and Other
Pacific Islander alone
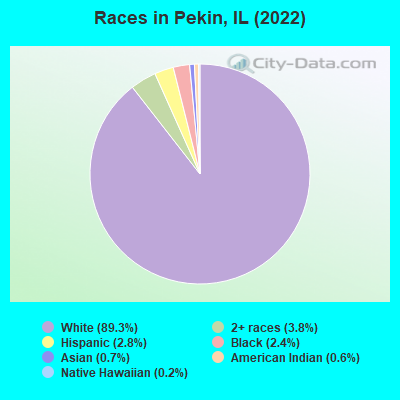
Races in Pekin detailed stats: ancestries, foreign born residents, place of birth
According to our research of Illinois and other state lists, there were 126 registered sex offenders living in Pekin, Illinois as of April 27, 2024.
The ratio of all residents to sex offenders in Pekin is 269 to 1.
Type |
2009 |
2010 |
2011 |
2012 |
2013 |
2014 |
2015 |
2016 |
2017 |
2018 |
2019 |
2020 |
2021 |
2022 |
|---|---|---|---|---|---|---|---|---|---|---|---|---|---|---|
| Murders (per 100,000) | 0 (0.0) | 3 (8.8) | 0 (0.0) | 1 (2.9) | 4 (11.7) | 0 (0.0) | 1 (3.0) | 0 (0.0) | 0 (0.0) | 0 (0.0) | 0 (0.0) | 0 (0.0) | 4 (12.7) | 5 (16.0) |
| Rapes (per 100,000) | 0 (0.0) | 15 (44.0) | 26 (76.0) | 21 (61.4) | 14 (41.1) | 36 (105.6) | 25 (74.1) | 25 (75.6) | 18 (54.8) | 37 (113.7) | 18 (56.2) | 22 (69.1) | 33 (104.5) | 45 (144.0) |
| Robberies (per 100,000) | 4 (12.0) | 6 (17.6) | 15 (43.9) | 19 (55.6) | 9 (26.4) | 8 (23.5) | 6 (17.8) | 15 (45.4) | 10 (30.4) | 16 (49.2) | 8 (25.0) | 7 (22.0) | 5 (15.8) | 4 (12.8) |
| Assaults (per 100,000) | 35 (104.8) | 92 (269.8) | 95 (277.8) | 137 (400.9) | 84 (246.4) | 52 (152.6) | 81 (239.9) | 99 (299.5) | 96 (292.1) | 82 (252.0) | 106 (330.9) | 100 (314.1) | 68 (215.2) | 49 (156.8) |
| Burglaries (per 100,000) | 71 (212.7) | 170 (498.6) | 152 (444.5) | 156 (456.5) | 167 (490.0) | 110 (322.8) | 98 (290.3) | 90 (272.3) | 128 (389.5) | 127 (390.3) | 102 (318.4) | 106 (333.0) | 109 (345.0) | 88 (281.6) |
| Thefts (per 100,000) | 240 (719.0) | 634 (1,860) | 607 (1,775) | 698 (2,042) | 708 (2,077) | 602 (1,766) | 639 (1,893) | 562 (1,700) | 358 (1,089) | 610 (1,875) | 490 (1,530) | 494 (1,552) | 429 (1,358) | 586 (1,875) |
| Auto thefts (per 100,000) | 16 (47.9) | 39 (114.4) | 20 (58.5) | 22 (64.4) | 10 (29.3) | 24 (70.4) | 32 (94.8) | 12 (36.3) | 20 (60.9) | 25 (76.8) | 26 (81.2) | 39 (122.5) | 47 (148.8) | 38 (121.6) |
| Arson (per 100,000) | 1 (3.0) | 4 (11.7) | 1 (2.9) | 8 (23.4) | 5 (14.7) | 2 (5.9) | 3 (8.9) | 6 (18.2) | 8 (24.3) | 4 (12.3) | 3 (9.4) | 1 (3.1) | 3 (9.5) | 2 (6.4) |
| City-Data.com crime index | 72.0 | 230.5 | 236.3 | 270.7 | 233.3 | 221.0 | 222.1 | 224.0 | 187.1 | 264.6 | 208.6 | 219.9 | 247.0 | 286.8 |
The City-Data.com crime index weighs serious crimes and violent crimes more heavily. Higher means more crime, U.S. average is 246.1. It adjusts for the number of visitors and daily workers commuting into cities.
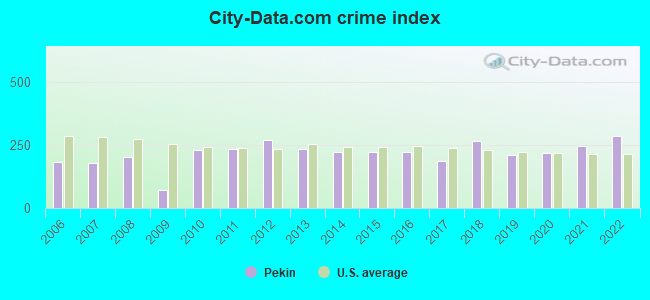
Crime rate in Pekin detailed stats: murders, rapes, robberies, assaults, burglaries, thefts, arson
Full-time law enforcement employees in 2021, including police officers: 58 (50 officers - 45 male; 5 female).
| Officers per 1,000 residents here: | 1.58 |
| Illinois average: | 2.84 |
 Recent articles from our blog. Our writers, many of them Ph.D. graduates or candidates, create easy-to-read articles on a wide variety of topics.

 | GLBT in Pekin, IL (6 replies) |
| Need Good Criminal Defense Attorney in Peoria Pekin IL area (1 reply) |
| Potential Relocation - Job in Pekin - Where to Rent/Peoria Pekin Area? (3 replies) |
| Relocating to pekin il - need housing help (rentals!) (1 reply) |
| Peoria to Morton IL? PLEASE READ (2 replies) |
| Moving to Pekin? (12 replies) |
Latest news from Pekin, IL collected exclusively by city-data.com from local newspapers, TV, and radio stations
Ancestries: German (21.8%), American (13.3%), European (11.3%), English (8.2%), Irish (6.9%), Italian (4.9%).
Current Local Time: CST time zone
Incorporated on 08/10/1874
Elevation: 500 feet
Land area: 13.1 square miles.
Population density: 2,377 people per square mile (low).
535 residents are foreign born
| This city: | 1.7% |
| Illinois: | 14.1% |
Median real estate property taxes paid for housing units with mortgages in 2022: $2,286 (2.1%)
Median real estate property taxes paid for housing units with no mortgage in 2022: $2,366 (2.0%)
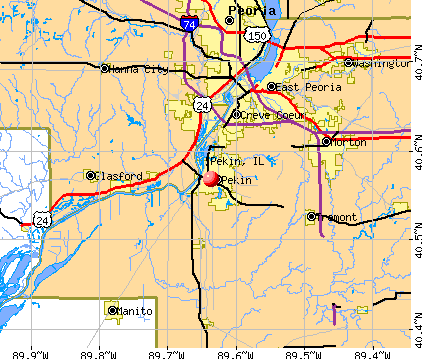
Nearest city with pop. 50,000+: Peoria, IL  (10.7 miles , pop. 112,936).
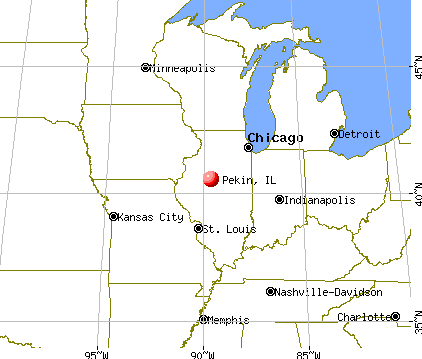
Nearest city with pop. 200,000+: Chicago, IL (134.6 miles , pop. 2,896,016).
Nearest cities:
), ), ), )Latitude: 40.57 N, Longitude: 89.64 W
Daytime population change due to commuting: -1,424 (-4.5%)
Workers who live and work in this city: 5,159 (36.7%)
Area code: 309

Pekin, Illinois accommodation & food services, waste management - Economy and Business Data
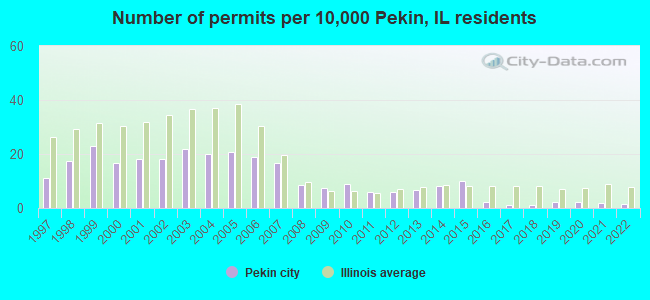
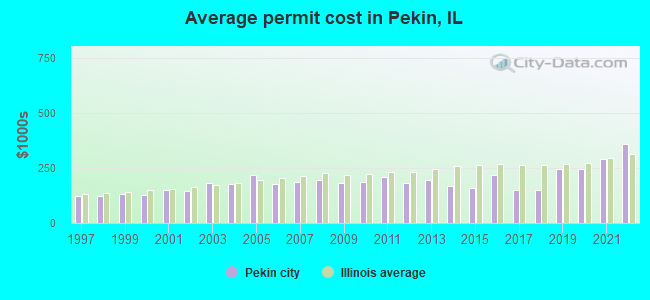
Single-family new house construction building permits:
- 2022: 5 buildings, average cost: $357,400
- 2021: 6 buildings, average cost: $289,900
- 2020: 8 buildings, average cost: $242,700
- 2019: 7 buildings, average cost: $242,700
- 2018: 4 buildings, average cost: $150,500
- 2017: 4 buildings, average cost: $150,500
- 2016: 8 buildings, average cost: $218,800
- 2015: 34 buildings, average cost: $157,500
- 2014: 28 buildings, average cost: $167,400
- 2013: 22 buildings, average cost: $196,200
- 2012: 20 buildings, average cost: $181,900
- 2011: 20 buildings, average cost: $210,300
- 2010: 30 buildings, average cost: $185,700
- 2009: 25 buildings, average cost: $182,400
- 2008: 29 buildings, average cost: $193,400
- 2007: 56 buildings, average cost: $183,800
- 2006: 64 buildings, average cost: $175,000
- 2005: 70 buildings, average cost: $216,000
- 2004: 68 buildings, average cost: $176,000
- 2003: 74 buildings, average cost: $179,800
- 2002: 62 buildings, average cost: $147,200
- 2001: 62 buildings, average cost: $150,400
- 2000: 56 buildings, average cost: $125,200
- 1999: 78 buildings, average cost: $129,900
- 1998: 59 buildings, average cost: $120,500
- 1997: 37 buildings, average cost: $122,600
| Here: | 4.9% |
| Illinois: | 4.2% |

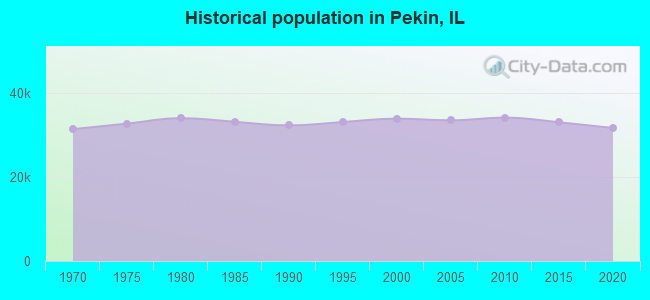
Population change in the 1990s: +1,572 (+4.9%).
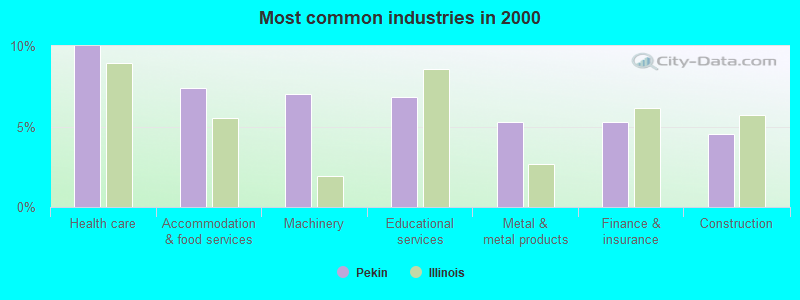
- Health care (10.0%)
- Accommodation & food services (7.4%)
- Machinery (7.0%)
- Educational services (6.8%)
- Metal & metal products (5.3%)
- Finance & insurance (5.3%)
- Construction (4.5%)
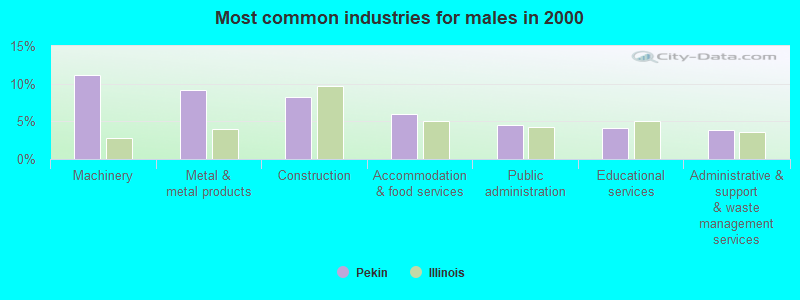
- Machinery (11.1%)
- Metal & metal products (9.1%)
- Construction (8.3%)
- Accommodation & food services (6.0%)
- Public administration (4.6%)
- Educational services (4.2%)
- Administrative & support & waste management services (3.9%)
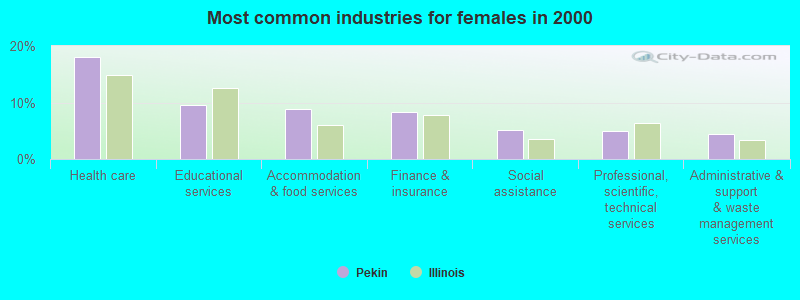
- Health care (18.0%)
- Educational services (9.6%)
- Accommodation & food services (8.9%)
- Finance & insurance (8.3%)
- Social assistance (5.2%)
- Professional, scientific, technical services (4.9%)
- Administrative & support & waste management services (4.4%)
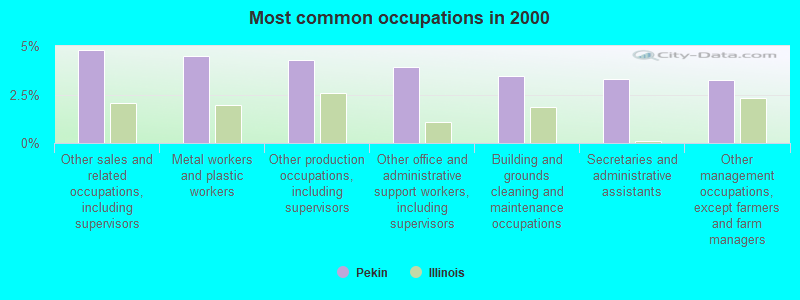
- Other sales and related occupations, including supervisors (4.8%)
- Metal workers and plastic workers (4.5%)
- Other production occupations, including supervisors (4.3%)
- Other office and administrative support workers, including supervisors (3.9%)
- Building and grounds cleaning and maintenance occupations (3.5%)
- Secretaries and administrative assistants (3.3%)
- Other management occupations, except farmers and farm managers (3.2%)
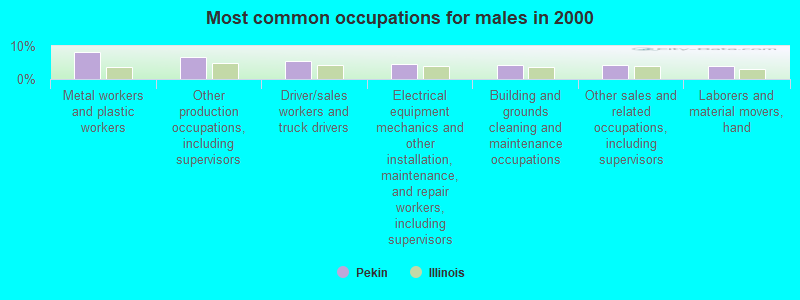
- Metal workers and plastic workers (8.3%)
- Other production occupations, including supervisors (6.7%)
- Driver/sales workers and truck drivers (5.5%)
- Electrical equipment mechanics and other installation, maintenance, and repair workers, including supervisors (4.6%)
- Building and grounds cleaning and maintenance occupations (4.3%)
- Other sales and related occupations, including supervisors (4.1%)
- Laborers and material movers, hand (4.0%)

- Secretaries and administrative assistants (6.7%)
- Other office and administrative support workers, including supervisors (6.3%)
- Other sales and related occupations, including supervisors (5.5%)
- Information and record clerks, except customer service representatives (5.1%)
- Nursing, psychiatric, and home health aides (4.2%)
- Preschool, kindergarten, elementary, and middle school teachers (4.2%)
- Cashiers (3.9%)
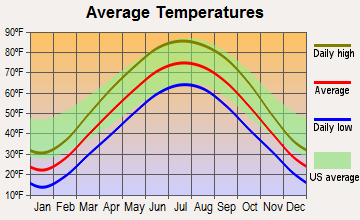
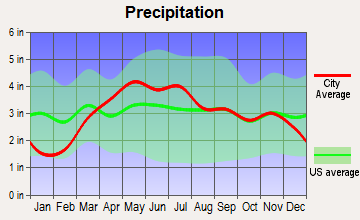
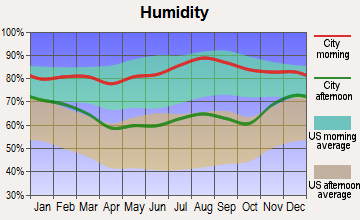
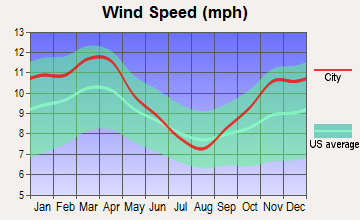
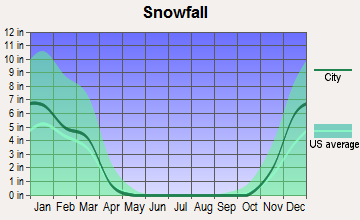
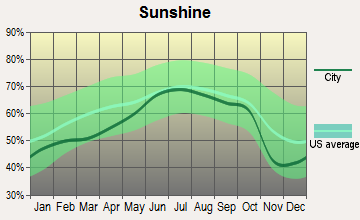
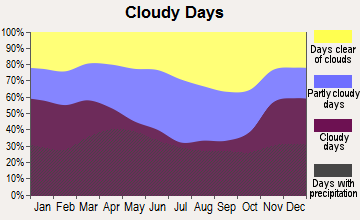
Average climate in Pekin, Illinois
Based on data reported by over 4,000 weather stations
|
|


(lower is better)
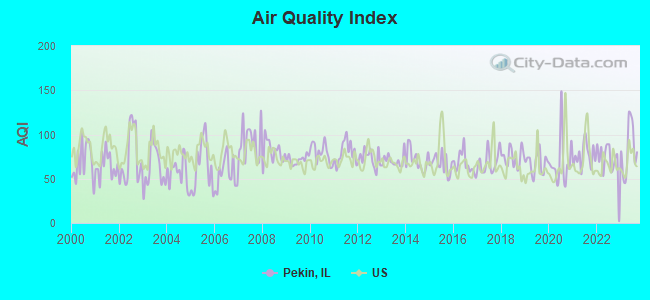
Air Quality Index (AQI) level in 2023 was 83.2. This is about average.
| City: | 83.2 |
| U.S.: | 72.6 |
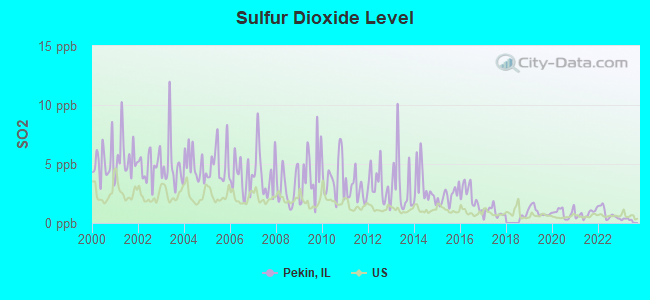
Sulfur Dioxide (SO2) [ppb] level in 2023 was 0.218. This is significantly better than average. Closest monitor was 1.2 miles away from the city center.
| City: | 0.218 |
| U.S.: | 1.515 |
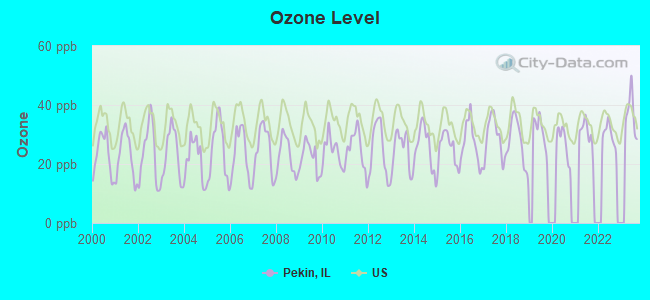
Ozone [ppb] level in 2023 was 36.9. This is about average. Closest monitor was 8.4 miles away from the city center.
| City: | 36.9 |
| U.S.: | 33.3 |
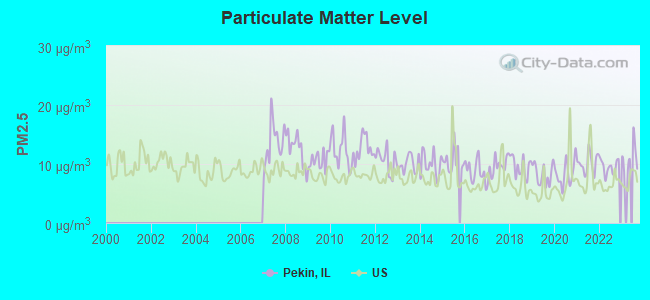
Particulate Matter (PM2.5) [µg/m3] level in 2023 was 11.1. This is worse than average. Closest monitor was 9.3 miles away from the city center.
| City: | 11.1 |
| U.S.: | 8.1 |
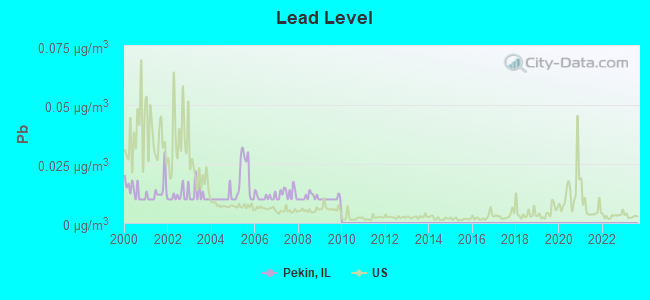
Lead (Pb) [µg/m3] level in 2009 was 0.0102. This is about average. Closest monitor was 0.4 miles away from the city center.
| City: | 0.0102 |
| U.S.: | 0.0093 |
Tornado activity:
Pekin-area historical tornado activity is slightly above Illinois state average. It is 89% greater than the overall U.S. average.
On 6/29/1976, a category F4 (max. wind speeds 207-260 mph) tornado 17.1 miles away from the Pekin city center caused between $50,000 and $500,000 in damages.
On 7/13/2004, a category F4 tornado 22.7 miles away from the city center injured 3 people.
Earthquake activity:
Pekin-area historical earthquake activity is significantly above Illinois state average. It is 139% greater than the overall U.S. average.On 4/18/2008 at 09:36:59, a magnitude 5.4 (5.1 MB, 4.8 MS, 5.4 MW, 5.2 MW, Class: Moderate, Intensity: VI - VII) earthquake occurred 173.6 miles away from the city center
On 6/10/1987 at 23:48:54, a magnitude 5.1 (4.9 MB, 4.4 MS, 4.6 MS, 5.1 LG) earthquake occurred 152.6 miles away from Pekin center
On 4/18/2008 at 09:36:59, a magnitude 5.2 (5.2 MW, Depth: 8.9 mi) earthquake occurred 173.6 miles away from the city center
On 6/18/2002 at 17:37:15, a magnitude 5.0 (4.3 MB, 4.6 MW, 5.0 LG) earthquake occurred 204.3 miles away from Pekin center
On 4/18/2008 at 15:14:16, a magnitude 4.8 (4.5 MB, 4.8 MW, 4.6 MW, Class: Light, Intensity: IV - V) earthquake occurred 173.4 miles away from the city center
On 4/3/1974 at 23:05:02, a magnitude 4.7 (4.5 MB, 4.7 LG) earthquake occurred 159.5 miles away from Pekin center
Magnitude types: regional Lg-wave magnitude (LG), body-wave magnitude (MB), surface-wave magnitude (MS), moment magnitude (MW)
Natural disasters:
The number of natural disasters in Tazewell County (14) is near the US average (15).Major Disasters (Presidential) Declared: 10
Emergencies Declared: 3
Causes of natural disasters: Storms: 10, Floods: 8, Tornadoes: 4, Snows: 2, Winds: 2, Hurricane: 1, Snowstorm: 1, Winter Storm: 1, Other: 1 (Note: some incidents may be assigned to more than one category).
Hospitals in Pekin:
- DAVIES SQUARE (1817 CRESENT DRIVE)
- MARIGOLD ESTATES (3240 BARNEY AVENUE)
- PEKIN MEMORIAL HOSPITAL (Voluntary non-profit - Private, 600 SOUTH 13TH STREET)
Nursing Homes in Pekin:
- AMERICANA HEALTHCARE CENTER (ALLENTOWN RD)
- B J PERINO NURSING HOME INC (601 PRINCE ST)
- HALLMARK HOUSE NURSING CENTER (2501 ALLENTOWN ROAD)
- PEKIN MANOR (1520 EL CAMINO DRIVE)
- TIMBERCREEK REHAB AND HEALTHCARE CENTER (2220 STATE STREET)
Dialysis Facilities in Pekin:
Home Health Centers in Pekin:
Airports located in Pekin:
- Pekin Municipal Airport (C15) (Runways: 1, Air Taxi Ops: 2,000, Itinerant Ops: 4,000, Local Ops: 3,000)
Colleges/universities with over 2000 students nearest to Pekin:
- Bradley University (about 10 miles; Peoria, IL; Full-time enrollment: 5,152)
- Illinois Central College (about 12 miles; East Peoria, IL; FT enrollment: 7,158)
- Heartland Community College (about 33 miles; Normal, IL; FT enrollment: 3,958)
- Illinois State University (about 35 miles; Normal, IL; FT enrollment: 18,804)
- Illinois Wesleyan University (about 35 miles; Bloomington, IL; FT enrollment: 2,323)
- Western Illinois University (about 56 miles; Macomb, IL; FT enrollment: 10,755)
- University of Illinois at Springfield (about 58 miles; Springfield, IL; FT enrollment: 3,748)
Public high school in Pekin:
- PEKIN COMMUNITY HIGH SCHOOL (Students: 2,241, Location: 1903 COURT ST, Grades: 9-12)
Private high schools in Pekin:
Biggest public elementary/middle schools in Pekin:
- WILSON INTERMEDIATE SCHOOL (Students: 619, Location: 900 KOCH ST, Grades: 4-6)
- WASHINGTON INTERMEDIATE SCHOOL (Students: 518, Location: 501 WASHINGTON ST, Grades: 4-6)
- BROADMOOR JUNIOR HIGH SCHOOL (Students: 426, Location: 501 MAYWOOD AVE, Grades: 7-8)
- EDISON JUNIOR HIGH SCHOOL (Students: 374, Location: 1400 EARL ST, Grades: 7-8)
- JEFFERSON ELEM SCHOOL (Students: 316, Location: 900 S CAPITOL ST, Grades: KG-3)
- C B SMITH ELEM SCHOOL (Students: 308, Location: 1314 MATILDA ST, Grades: KG-3)
- WILLOW ELEM SCHOOL (Students: 274, Location: 1110 VEERMAN ST, Grades: KG-3)
- L E STARKE ELEM SCHOOL (Students: 224, Location: 1610 HOLIDAY DR, Grades: KG-3)
- RANKIN ELEM SCHOOL (Students: 187, Location: 13716 5TH ST, Grades: KG-8)
- DIRKSEN ELEMENTARY SCHOOL (Location: 501 MAYWOOD AVE, Grades: KG-3)
Private elementary/middle schools in Pekin:
User-submitted facts and corrections:
- Birthplace, Jeff Bill (1977) -- collegiate tennis player (Illinois State University)
Points of interest:
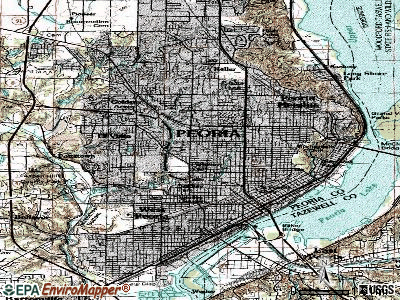
Notable locations in Pekin: Pekin Commercial Park (A), Sunset Hills Golf Course (B), Parkview Golf Course (C), Tazewell County Jail (D), Tazewell County Courthouse (E), Pekin Public Library (F), Pekin City Hall (G), Federal Correctional Institution Pekin (H), Tazewell County Sheriff Office (I), Pekin Fire Department Station 2 (J), Pekin Fire Department (K), Advanced Medical Transport (L), Pekin Fire Department Station 3 (M). Display/hide their locations on the map
Shopping Centers: Pekin Mall Shopping Center (1), Vogels Market Square Shopping Center (2), Sunset Plaza Shopping Center (3). Display/hide their locations on the map
Churches in Pekin include: Liberty Baptist Church (A), Congregational Church (B), First Presbyterian Church (C), Calvary Baptist Church (D), First Assembly of God Church (E), First Baptist Church (F), First Christian Church (G), First Church of the Nazarene (H), First Congregational Church (I). Display/hide their locations on the map
Cemeteries: Veteran's Memorial Cemetery (1), Lakeside Cemetery (2), Lakeview Cemetery (3). Display/hide their locations on the map
Lakes and reservoirs: Pekin Lake (A), Sunset Hills Lake Number 1 (B), Sunset Hills Lake Number 2 (C), Sunset Hills Golf Course Lake (D), Home Lake (E). Display/hide their locations on the map
Parks in Pekin include: James Park (1), John T McNaughton Park (2), Everett Dirksen Park (3), Willow Park (4), Mineral Springs Park (5), Blinkiron Park (6). Display/hide their locations on the map
Hotels: Concorde Inn & Suites (2801 Court Street), Econo Lodge & Suites (3240 North Vandever Avenue), Comfort Inn Pekin (3240 North Vandever Avenue), Holiday Inn Express Hotel & Suites (3615 Kelly Avenue).
Courts: Tazewell County - Circuit Courts Office- Small Claims (Floor 3), Tazewell County - Circuit Courts Office- Administrative Secretary (Floor 1), Tazewell County - Circuit Courts Office- Civil (Floor 1), Catherine Court (1 Marion), Tazewell County - Circuit Courts Office- Felony (Floor 3), Court Catherine (1 Marion Point), Tazewell County - Circuit Courts Office- Misdemeanor (Floor 1).
Birthplace of: Everett Dirksen - Army officer, Erik Brann - Guitarist, Henry Andrews Bumstead - Physicist, Ormond Stone - Astronomer, Sol Bloom - Politician, Wyllis Cooper - Screenwriter, D.A. Points - PGA Tour Golf player (born: 12/1/76), Eric Monti - Professional golfer, Bryce Aneloski - Ice hockey player, Hank Bruder - Football player.
Drinking water stations with addresses in Pekin and their reported violations in the past:
PEKIN PAINTBALL PARK (Population served: 25, Groundwater):Past monitoring violations:LET IT SHINE LLC (Population served: 25, Purch groundwater):
- One regular monitoring violation
Past monitoring violations:TOWERLINE SPEEDWAY (Population served: 25, Groundwater):
- One regular monitoring violation
Past monitoring violations:MIDWAY TAP (Population served: 25, Groundwater):
- One regular monitoring violation
Past monitoring violations:
- One regular monitoring violation
Drinking water stations with addresses in Pekin that have no violations reported:
- R L KING POST VFW 1232 (Population served: 70, Primary Water Source Type: Groundwater)
- PEKIN BOAT CLUB (Population served: 25, Primary Water Source Type: Groundwater)
- TOBIN-NANNINGA MARINE CORPS (Population served: 25, Primary Water Source Type: Groundwater)
| This city: | 2.3 people |
| Illinois: | 2.6 people |
| This city: | 63.1% |
| Whole state: | 65.8% |
| This city: | 7.8% |
| Whole state: | 6.3% |
Likely homosexual households (counted as self-reported same-sex unmarried-partner households)
- Lesbian couples: 0.3% of all households
- Gay men: 0.1% of all households
People in group quarters in Pekin in 2010:
- 1,652 people in federal prisons
- 281 people in nursing facilities/skilled-nursing facilities
- 67 people in group homes intended for adults
- 21 people in emergency and transitional shelters (with sleeping facilities) for people experiencing homelessness
- 12 people in residential treatment centers for adults
- 6 people in college/university student housing
- 3 people in other noninstitutional facilities
People in group quarters in Pekin in 2000:
- 1,629 people in federal prisons and detention centers
- 299 people in nursing homes
- 99 people in homes for the mentally retarded
- 91 people in other noninstitutional group quarters
- 73 people in local jails and other confinement facilities (including police lockups)
- 16 people in homes for the mentally ill
- 2 people in religious group quarters
Banks with most branches in Pekin (2011 data):
- Herget Bank, National Association: Sunset Branch, Pekin Branch, at 33 South 4th Street, Broadway Facility. Info updated 2006/11/03: Bank assets: $267.3 mil, Deposits: $238.4 mil, local headquarters, positive income, Mortgage Lending Specialization, 5 total offices, Holding Company: Herget Financial Corp.
- Pekin National Bank: at 333 Court Street, Park-Sheridan Facility, Drive-In South Facility. Info updated 2006/11/03: Bank assets: $23.9 mil, Deposits: $19.0 mil, local headquarters, positive income, Mortgage Lending Specialization, 3 total offices, Holding Company: Pnb Bancshares, Inc.
- Heartland Bank and Trust Company: Pekin Broadway Branch at 2807 Broadway, branch established on 1999/01/04; First State Pekin Branch at 3400 Court Street, branch established on 1971/02/09. Info updated 2011/08/08: Bank assets: $1,943.8 mil, Deposits: $1,632.9 mil, headquarters in Bloomington, IL, positive income, Commercial Lending Specialization, 49 total offices, Holding Company: Heartland Bancorp, Inc.
- Woodforest National Bank: Pekin Illinois Branch at 3320 Veterans Drive, branch established on 2007/03/24. Info updated 2011/05/10: Bank assets: $3,488.9 mil, Deposits: $3,097.6 mil, headquarters in Houston, TX, positive income, Commercial Lending Specialization, 766 total offices, Holding Company: Woodforest Financial Group Employee Stock Ownership Plan (With 401(K) Provisions)
- Morton Community Bank: Pekin Savings Branch at 601 Court St, branch established on 1882/01/01. Info updated 2010/12/15: Bank assets: $2,667.0 mil, Deposits: $2,086.4 mil, headquarters in Morton, IL, positive income, Commercial Lending Specialization, 32 total offices, Holding Company: Hometown Community Bancorp, Inc. Esop And Trust
- South Side Trust & Savings Bank of Peoria: Pekin Il Branch at 3200 Veterans Drive, branch established on 2011/05/02. Info updated 2006/11/03: Bank assets: $668.3 mil, Deposits: $535.4 mil, headquarters in Peoria, IL, positive income, 14 total offices, Holding Company: Mid Illinois Bancorp, Inc.
- First Federal Savings and Loan Association of Pekin: First Federal Savings And Loan Assoc at 532 Court Street, branch established on 1893/01/01. Info updated 2011/07/21: Bank assets: $26.7 mil, Deposits: $21.3 mil, local headquarters, positive income, Mortgage Lending Specialization, 1 total offices
- Associated Bank, National Association: Pekin Downtown Branch at 300 South 4th Street, branch established on 1883/01/01. Info updated 2008/09/12: Bank assets: $21,715.0 mil, Deposits: $15,244.4 mil, headquarters in Green Bay, WI, positive income, Commercial Lending Specialization, 282 total offices, Holding Company: Associated Banc-Corp
- Commerce Bank: Pekin Branch at 110 N 5th St, branch established on 1887/08/10. Info updated 2011/07/07: Bank assets: $20,493.6 mil, Deposits: $16,805.3 mil, headquarters in Kansas City, MO, positive income, 206 total offices, Holding Company: Commerce Bancshares, Inc.
- 2 other banks with 2 local branches
For population 15 years and over in Pekin:
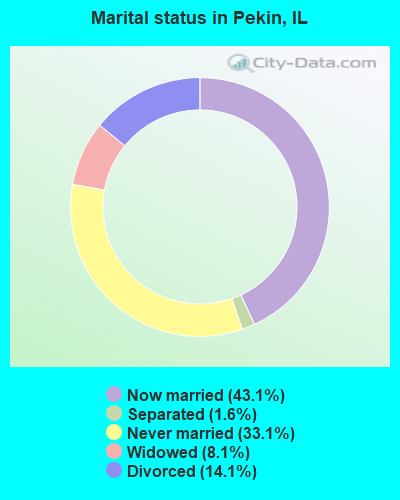
- Never married: 33.1%
- Now married: 43.1%
- Separated: 1.6%
- Widowed: 8.1%
- Divorced: 14.1%
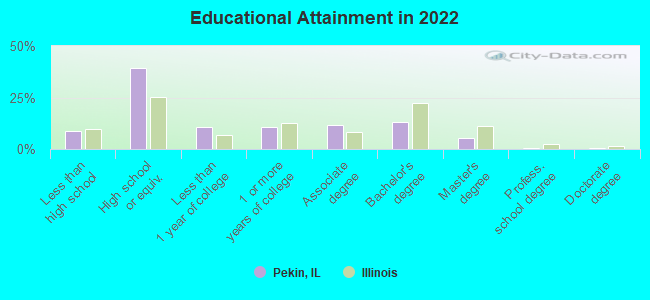
For population 25 years and over in Pekin:
- High school or higher: 89.8%
- Bachelor's degree or higher: 18.1%
- Graduate or professional degree: 5.6%
- Unemployed: 4.8%
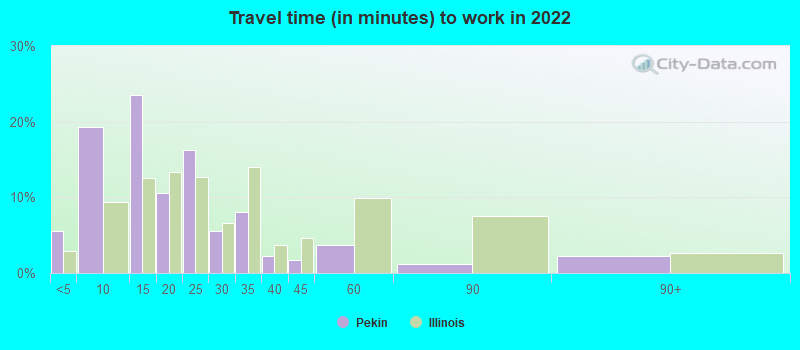
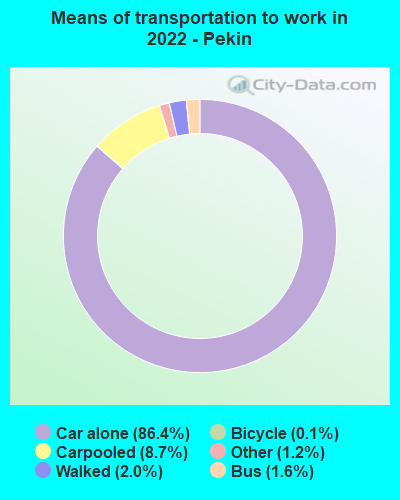
- Mean travel time to work (commute): 20.4 minutes
| Here: | 9.1 |
| Illinois average: | 12.5 |
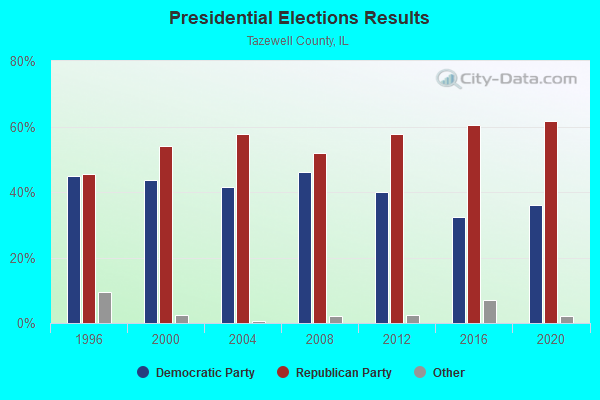
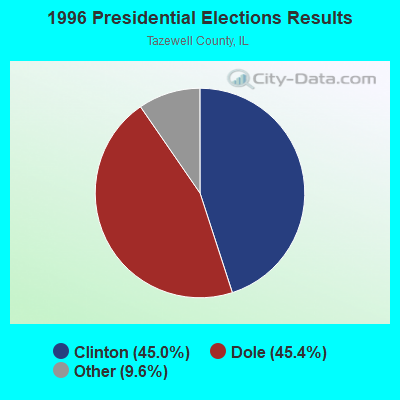
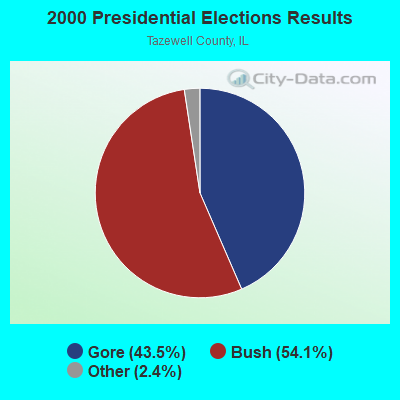
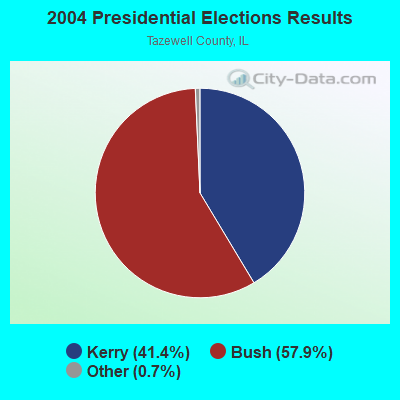
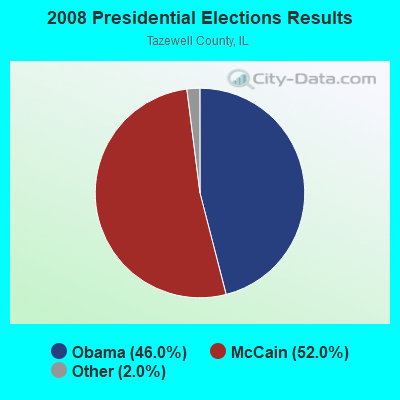
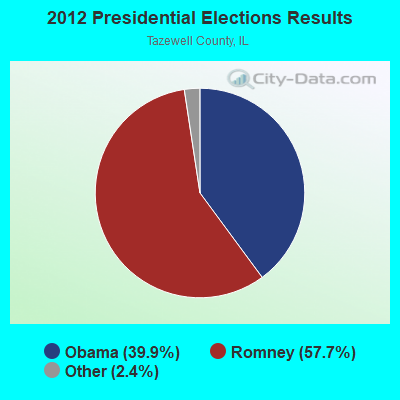

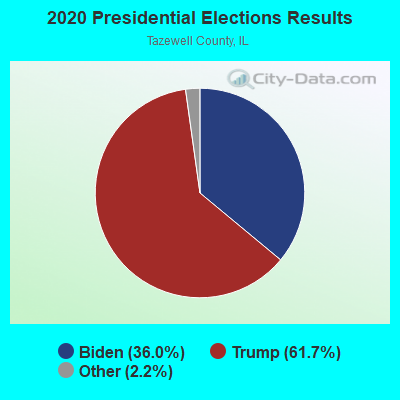
Graphs represent county-level data. Detailed 2008 Election Results
Religion statistics for Pekin, IL (based on Tazewell County data)
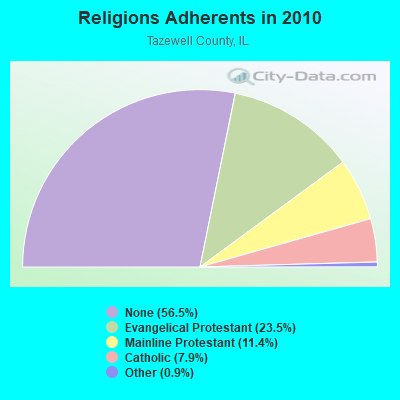
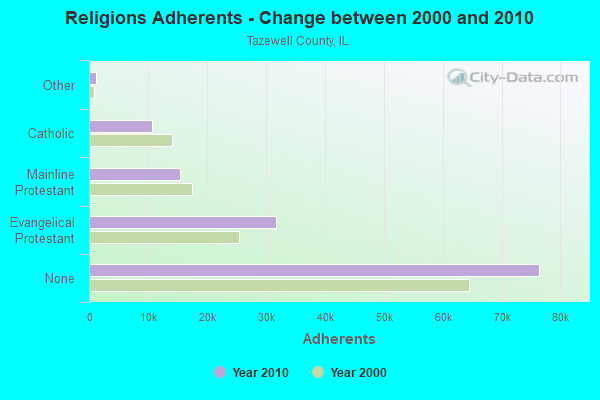
| Religion | Adherents | Congregations |
|---|---|---|
| Evangelical Protestant | 31,756 | 118 |
| Mainline Protestant | 15,404 | 40 |
| Catholic | 10,650 | 7 |
| Other | 1,154 | 6 |
| None | 76,430 | - |
Food Environment Statistics:
| Tazewell County: | 0.99 / 10,000 pop. |
| State: | 2.24 / 10,000 pop. |
| This county: | 0.08 / 10,000 pop. |
| Illinois: | 0.08 / 10,000 pop. |
| Here: | 0.46 / 10,000 pop. |
| State: | 0.75 / 10,000 pop. |
| This county: | 4.51 / 10,000 pop. |
| State: | 2.61 / 10,000 pop. |
| Tazewell County: | 7.72 / 10,000 pop. |
| Illinois: | 6.86 / 10,000 pop. |
| Here: | 8.7% |
| Illinois: | 8.3% |
| Here: | 27.1% |
| Illinois: | 25.2% |
| This county: | 8.2% |
| State: | 14.5% |
Health and Nutrition:
| Here: | 52.1% |
| Illinois: | 49.5% |
| Here: | 50.0% |
| State: | 47.2% |
| Pekin: | 28.5 |
| Illinois: | 28.6 |
| Pekin: | 19.5% |
| Illinois: | 20.5% |
| Pekin: | 9.8% |
| State: | 10.8% |
| Here: | 6.9 |
| State: | 6.8 |
| Pekin: | 33.9% |
| Illinois: | 33.4% |
| This city: | 58.8% |
| Illinois: | 56.4% |
| This city: | 79.1% |
| Illinois: | 79.9% |
More about Health and Nutrition of Pekin, IL Residents
| Local government employment and payroll (March 2022) | |||||
| Function | Full-time employees | Monthly full-time payroll | Average yearly full-time wage | Part-time employees | Monthly part-time payroll |
|---|---|---|---|---|---|
| Firefighters | 55 | $421,593 | $91,984 | 0 | $0 |
| Police Protection - Officers | 53 | $409,108 | $92,628 | 0 | $0 |
| Streets and Highways | 17 | $117,741 | $83,111 | 0 | $0 |
| Financial Administration | 11 | $65,915 | $71,907 | 0 | $0 |
| Solid Waste Management | 11 | $52,954 | $57,768 | 0 | $0 |
| Local Libraries | 11 | $41,510 | $45,284 | 14 | $14,039 |
| Police - Other | 10 | $46,225 | $55,470 | 0 | $0 |
| Other and Unallocable | 6 | $32,975 | $65,950 | 4 | $4,707 |
| Other Government Administration | 6 | $46,039 | $92,078 | 6 | $2,500 |
| Sewerage | 5 | $34,212 | $82,109 | 0 | $0 |
| Elementary and Secondary - Other Total | 3 | $19,763 | $79,052 | 121 | $242,938 |
| Airports | 1 | $5,690 | $68,280 | 0 | $0 |
| Fire - Other | 1 | $8,997 | $107,964 | 0 | $0 |
| Housing and Community Development (Local) | 1 | $7,341 | $88,092 | 0 | $0 |
| Totals for Government | 191 | $1,310,063 | $82,308 | 145 | $264,184 |
Pekin government finances - Expenditure in 2021 (per resident):
- Construction - Regular Highways: $9,045,000 ($289.35)
- Current Operations - Police Protection: $11,342,000 ($362.83)
Local Fire Protection: $10,315,000 ($329.97)
General - Other: $7,678,000 ($245.62)
Regular Highways: $2,532,000 ($81.00)
Central Staff Services: $2,525,000 ($80.77)
Solid Waste Management: $2,400,000 ($76.78)
Sewerage: $2,109,000 ($67.47)
Libraries: $1,392,000 ($44.53)
General Public Buildings: $552,000 ($17.66)
Financial Administration: $473,000 ($15.13)
Air Transportation: $365,000 ($11.68)
Judicial and Legal Services: $87,000 ($2.78)
- General - Interest on Debt: $326,000 ($10.43)
- Other Capital Outlay - Central Staff Services: $421,000 ($13.47)
Libraries: $265,000 ($8.48)
Housing and Community Development: $136,000 ($4.35)
- Total Salaries and Wages: $15,911,000 ($508.99)
Pekin government finances - Revenue in 2021 (per resident):
- Charges - Sewerage: $8,156,000 ($260.91)
Other: $3,286,000 ($105.12)
Solid Waste Management: $2,268,000 ($72.55)
Parks and Recreation: $76,000 ($2.43)
Parking Facilities: $8,000 ($0.26)
- Federal Intergovernmental - Housing and Community Development: $738,000 ($23.61)
Other: $31,000 ($0.99)
- Miscellaneous - General Revenue - Other: $5,268,000 ($168.52)
Fines and Forfeits: $474,000 ($15.16)
Interest Earnings: $380,000 ($12.16)
- State Intergovernmental - General Local Government Support: $13,845,000 ($442.90)
Highways: $1,225,000 ($39.19)
Other: $113,000 ($3.61)
Public Welfare: $9,000 ($0.29)
- Tax - Property: $7,404,000 ($236.85)
General Sales and Gross Receipts: $6,085,000 ($194.66)
Public Utilities Sales: $749,000 ($23.96)
Motor Fuels Sales: $587,000 ($18.78)
Other License: $284,000 ($9.09)
Pekin government finances - Debt in 2021 (per resident):
- Long Term Debt - Beginning Outstanding - Unspecified Public Purpose: $8,975,000 ($287.11)
Outstanding Unspecified Public Purpose: $8,160,000 ($261.04)
Retired Unspecified Public Purpose: $815,000 ($26.07)
Pekin government finances - Cash and Securities in 2021 (per resident):
- Other Funds - Cash and Securities: $15,260,000 ($488.16)
| Businesses in Pekin, IL | ||||
| Name | Count | Name | Count | |
|---|---|---|---|---|
| Ace Hardware | 1 | Kmart | 1 | |
| Advance Auto Parts | 1 | Kroger | 1 | |
| Applebee's | 1 | Lane Furniture | 1 | |
| Arby's | 1 | Little Caesars Pizza | 1 | |
| AutoZone | 1 | Long John Silver's | 1 | |
| Burger King | 1 | MasterBrand Cabinets | 1 | |
| CVS | 1 | McDonald's | 3 | |
| Carson Pirie Scott | 1 | Menards | 1 | |
| Chevrolet | 1 | Papa John's Pizza | 1 | |
| Circle K | 1 | Payless | 1 | |
| Curves | 1 | Pizza Hut | 1 | |
| DHL | 1 | Quiznos | 1 | |
| Dairy Queen | 1 | RadioShack | 1 | |
| Deb | 1 | Rue21 | 1 | |
| Domino's Pizza | 1 | SONIC Drive-In | 1 | |
| Econo Lodge | 1 | Sears | 2 | |
| Fashion Bug | 1 | Sprint Nextel | 1 | |
| FedEx | 2 | Staples | 1 | |
| Firestone Complete Auto Care | 1 | Starbucks | 1 | |
| Ford | 1 | Steak 'n Shake | 1 | |
| GNC | 1 | Subway | 2 | |
| GameStop | 1 | Super 8 | 1 | |
| Goodwill | 1 | T-Mobile | 2 | |
| H&R Block | 2 | Taco Bell | 1 | |
| Hardee's | 1 | U-Haul | 3 | |
| Hobby Lobby | 1 | UPS | 5 | |
| Holiday Inn | 1 | Verizon Wireless | 1 | |
| Jimmy John's | 1 | Walgreens | 2 | |
| Jones New York | 1 | Walmart | 1 | |
| KFC | 1 | Wendy's | 1 | |
Strongest AM radio stations in Pekin:
- WVEL (1140 AM; daytime; 5 kW; PEKIN, IL)
- WWFS (1290 AM; 5 kW; PEORIA, IL; Owner: MONTEREY LICENSES, LLC)
- WMBD (1470 AM; 5 kW; PEORIA, IL; Owner: MONTEREY LICENSES, LLC)
- WOAM (1350 AM; 1 kW; PEORIA, IL; Owner: KELLY COMMUNICATIONS, INC.)
- WPEO (1020 AM; daytime; 1 kW; PEORIA, IL)
- WSCR (670 AM; 50 kW; CHICAGO, IL; Owner: INFINITY BROADCASTING OPERATIONS, INC.)
- WLS (890 AM; 50 kW; CHICAGO, IL; Owner: WLS, INC.)
- WGN (720 AM; 50 kW; CHICAGO, IL; Owner: WGN CONTINENTAL BROADCASTING CO.)
- WBBM (780 AM; 50 kW; CHICAGO, IL; Owner: INFINITY BROADCASTING OPERATIONS, INC.)
- WYLL (1160 AM; 50 kW; CHICAGO, IL; Owner: SCA LICENSE CORPORATION)
- WMVP (1000 AM; 50 kW; CHICAGO, IL; Owner: ABC, INC.)
- KXEN (1010 AM; 50 kW; FESTUS-ST. LOUIS, MO; Owner: BDJ RADIO ENTERPRISES, LLC)
- KMOX (1120 AM; 50 kW; ST. LOUIS, MO; Owner: INFINITY BROADCASTING OPERATIONS, INC.)
Strongest FM radio stations in Pekin:
- WCIC (91.5 FM; PEKIN, IL; Owner: ILLINOIS BIBLE INSTITUTE, INC.)
- WCBU (89.9 FM; PEORIA, IL; Owner: BRADLEY UNIVERSITY)
- WGLO (95.5 FM; PEKIN, IL; Owner: REGENT BROADCASTING OF PEORIA, INC.)
- WBNH (88.5 FM; PEKIN, IL; Owner: CENTRAL ILLINOIS RADIO FELLOWSHIP, INC.)
- WXMP (105.7 FM; PEORIA, IL; Owner: AAA ENTERTAINMENT LICENSING LLC)
- WPBG (93.3 FM; PEORIA, IL; Owner: MONTEREY LICENSES, LLC)
- WXCL (104.9 FM; PEKIN, IL; Owner: AAA ENTERTAINMENT LICENSING LLC)
- WPPY (101.1 FM; GLASFORD, IL; Owner: REGENT BROADCASTING OF PEORIA, INC.)
- WIXO (99.9 FM; BARTONVILLE, IL; Owner: REGENT BROADCASTING OF PEORIA, INC.)
- WSWT (106.9 FM; PEORIA, IL; Owner: MONTEREY LICENSES, LLC)
- W278AE (103.5 FM; PEORIA, IL; Owner: ILLINOIS STATE UNIVERSITY)
- WZPW (92.3 FM; PEORIA, IL; Owner: B&G BROADCASTING, INC.)
- WWCT (96.5 FM; FARMINGTON, IL; Owner: AAA ENTERTAINMENT LICENSING LLC)
- WDQX (102.3 FM; MORTON, IL; Owner: AAA ENTERTAINMENT LICENSING LLC)
- WFYR (97.3 FM; ELMWOOD, IL; Owner: REGENT BROADCASTING OF PEORIA, INC.)
- WBYS-FM (107.9 FM; CANTON, IL; Owner: WPW BROADCASTING, INC.)
- WPMJ (94.3 FM; CHILLICOTHE, IL; Owner: KELLY COMMUNICATIONS, INC.)
- WRVP (98.5 FM; EUREKA, IL; Owner: REGENT BROADCASTING OF PEORIA, INC.)
TV broadcast stations around Pekin:
- WTVP (Channel 47; PEORIA, IL; Owner: ILLINOIS VALLEY PUB TELECOMM CORP)
- WHOI (Channel 19; PEORIA, IL; Owner: CHELSEY BROADCASTING COMPANY OF PEORIA, LLC)
- W41BO (Channel 41; PEORIA, IL; Owner: TRINITY BROADCASTING NETWORK)
- WEEK-TV (Channel 25; PEORIA, IL; Owner: WEEK-TV LICENSE, INC.)
- WMBD-TV (Channel 31; PEORIA, IL; Owner: NEXSTAR BROADCASTING OF PEORIA, L.L.C.)
- WAOE (Channel 59; PEORIA, IL; Owner: FOUR SEASONS PEORIA, LLC)
- WYZZ-TV (Channel 43; BLOOMINGTON, IL; Owner: WYZZ LICENSEE, INC.)
- W67CW (Channel 67; PEORIA, IL; Owner: M.C. PRODUCTIONS)
- National Bridge Inventory (NBI) Statistics
- 14Number of bridges
- 108ft / 32.9mTotal length
- $1,126,000Total costs
- 35,075Total average daily traffic
- 3,184Total average daily truck traffic
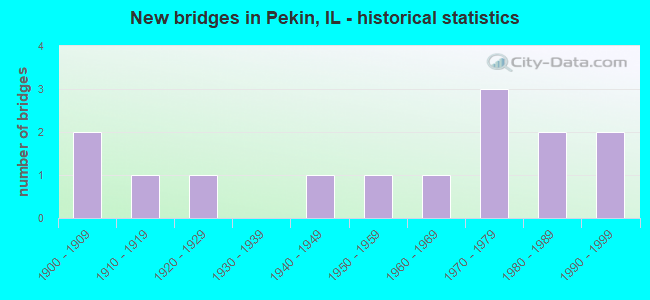
- New bridges - historical statistics
- 21900-1909
- 11910-1919
- 11920-1929
- 11940-1949
- 11950-1959
- 11960-1969
- 31970-1979
- 21980-1989
- 21990-1999
FCC Registered Antenna Towers: 74 (See the full list of FCC Registered Antenna Towers)
FCC Registered Commercial Land Mobile Towers: 2 (See the full list of FCC Registered Commercial Land Mobile Towers in Pekin, IL)
FCC Registered Broadcast Land Mobile Towers: 21 (See the full list of FCC Registered Broadcast Land Mobile Towers)
FCC Registered Microwave Towers: 23 (See the full list of FCC Registered Microwave Towers in this town)
FCC Registered Paging Towers: 1 (See the full list of FCC Registered Paging Towers)
FCC Registered Maritime Coast & Aviation Ground Towers: 2 (See the full list of FCC Registered Maritime Coast & Aviation Ground Towers)
FCC Registered Amateur Radio Licenses: 210 (See the full list of FCC Registered Amateur Radio Licenses in Pekin)
FAA Registered Aircraft Manufacturers and Dealers: 3 (See the full list of FAA Registered Manufacturers and Dealers in Pekin)
FAA Registered Aircraft: 29 (See the full list of FAA Registered Aircraft)
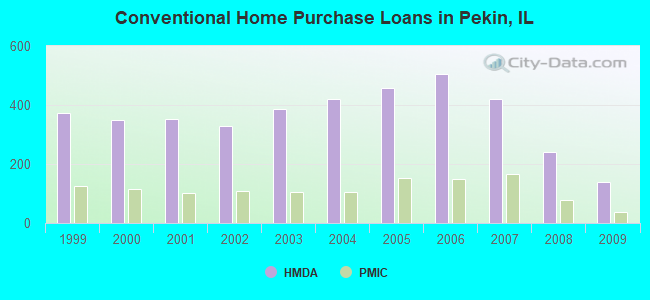
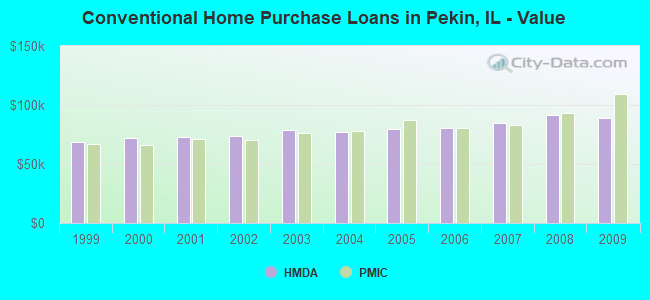
| Home Mortgage Disclosure Act Aggregated Statistics For Year 2009 (Based on 2 full and 5 partial tracts) | ||||||||||||||
| A) FHA, FSA/RHS & VA Home Purchase Loans | B) Conventional Home Purchase Loans | C) Refinancings | D) Home Improvement Loans | E) Loans on Dwellings For 5+ Families | F) Non-occupant Loans on < 5 Family Dwellings (A B C & D) | G) Loans On Manufactured Home Dwelling (A B C & D) | ||||||||
|---|---|---|---|---|---|---|---|---|---|---|---|---|---|---|
| Number | Average Value | Number | Average Value | Number | Average Value | Number | Average Value | Number | Average Value | Number | Average Value | Number | Average Value | |
| LOANS ORIGINATED | 152 | $89,503 | 138 | $89,313 | 591 | $99,403 | 28 | $40,255 | 5 | $257,004 | 61 | $69,031 | 1 | $149,000 |
| APPLICATIONS APPROVED, NOT ACCEPTED | 5 | $111,788 | 3 | $54,470 | 38 | $107,286 | 5 | $44,736 | 0 | $0 | 4 | $79,082 | 0 | $0 |
| APPLICATIONS DENIED | 14 | $79,247 | 14 | $72,317 | 146 | $87,545 | 47 | $31,308 | 1 | $19,440 | 10 | $63,065 | 0 | $0 |
| APPLICATIONS WITHDRAWN | 12 | $68,344 | 9 | $78,039 | 129 | $101,702 | 4 | $66,250 | 0 | $0 | 3 | $50,483 | 0 | $0 |
| FILES CLOSED FOR INCOMPLETENESS | 1 | $75,190 | 0 | $0 | 19 | $87,057 | 1 | $919,520 | 0 | $0 | 1 | $44,680 | 0 | $0 |
Detailed HMDA statistics for the following Tracts: 0206.00 , 0207.00, 0208.00, 0209.00, 0210.00, 0211.01, 0211.02
| Private Mortgage Insurance Companies Aggregated Statistics For Year 2009 (Based on 2 full and 5 partial tracts) | ||||||
| A) Conventional Home Purchase Loans | B) Refinancings | C) Non-occupant Loans on < 5 Family Dwellings (A & B) | ||||
|---|---|---|---|---|---|---|
| Number | Average Value | Number | Average Value | Number | Average Value | |
| LOANS ORIGINATED | 38 | $109,205 | 28 | $96,986 | 2 | $64,500 |
| APPLICATIONS APPROVED, NOT ACCEPTED | 7 | $86,191 | 5 | $81,464 | 0 | $0 |
| APPLICATIONS DENIED | 5 | $49,788 | 3 | $137,223 | 3 | $45,000 |
| APPLICATIONS WITHDRAWN | 2 | $118,495 | 3 | $172,027 | 0 | $0 |
| FILES CLOSED FOR INCOMPLETENESS | 1 | $34,390 | 1 | $63,000 | 0 | $0 |
Detailed PMIC statistics for the following Tracts: 0206.00 , 0207.00, 0208.00, 0209.00, 0210.00, 0211.01, 0211.02
2002 - 2018 National Fire Incident Reporting System (NFIRS) incidents
- Fire incident types reported to NFIRS in Pekin, IL
- 1,21343.5%Outside Fires
- 1,09839.4%Structure Fires
- 30611.0%Mobile Property/Vehicle Fires
- 1736.2%Other
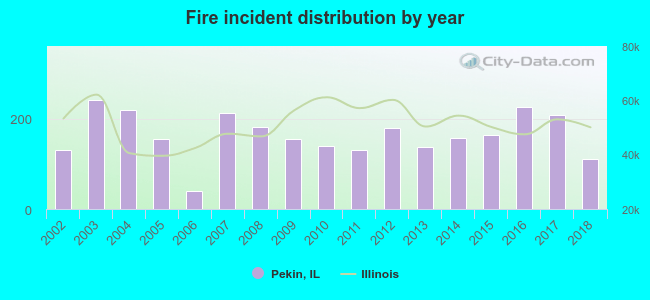 Based on the data from the years 2002 - 2018 the average number of fires per year is 164. The highest number of fire incidents - 241 took place in 2003, and the least - 39 in 2006. The data has a decreasing trend.
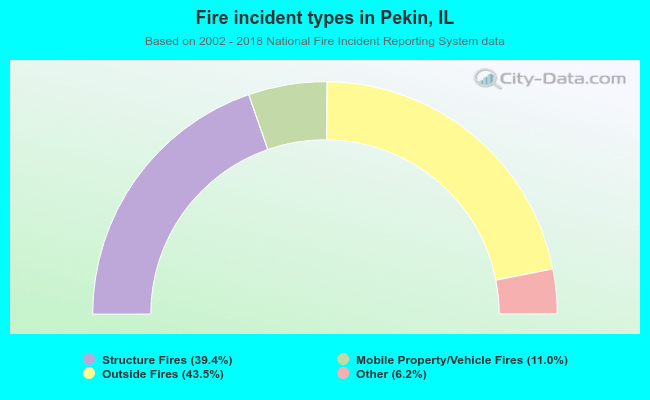 When looking into fire subcategories, the most incidents belonged to: Outside Fires (43.5%), and Structure Fires (39.4%).
Fire-safe hotels and motels in Pekin, Illinois:
- Comfort Inn Pekin, 3240 Vandever Ave, Pekin, Illinois 61554 , Phone: (309) 353-4047, Fax: (309) 353-4047
- Holiday Inn Express, 3615 Kelly Ave, Pekin, Illinois 61554 , Phone: (309) 353-3305, Fax: (309) 353-3308
- Super 8, 3830 Kelly St, Pekin, Illinois 61554 , Phone: (309) 347-8888, Fax: (309) 347-8888
| Most common first names in Pekin, IL among deceased individuals | ||
| Name | Count | Lived (average) |
|---|---|---|
| Mary | 298 | 80.3 years |
| William | 281 | 74.4 years |
| John | 269 | 75.0 years |
| Robert | 269 | 71.2 years |
| James | 241 | 70.1 years |
| Charles | 221 | 73.8 years |
| George | 169 | 77.2 years |
| Helen | 165 | 79.4 years |
| Dorothy | 160 | 77.7 years |
| Margaret | 129 | 79.6 years |
| Most common last names in Pekin, IL among deceased individuals | ||
| Last name | Count | Lived (average) |
|---|---|---|
| Smith | 143 | 74.7 years |
| Johnson | 80 | 76.0 years |
| Miller | 75 | 74.4 years |
| Martin | 74 | 76.7 years |
| Jones | 73 | 78.0 years |
| Davis | 67 | 76.9 years |
| Brown | 60 | 77.4 years |
| Williams | 57 | 76.0 years |
| Taylor | 48 | 71.3 years |
| Morris | 42 | 73.6 years |
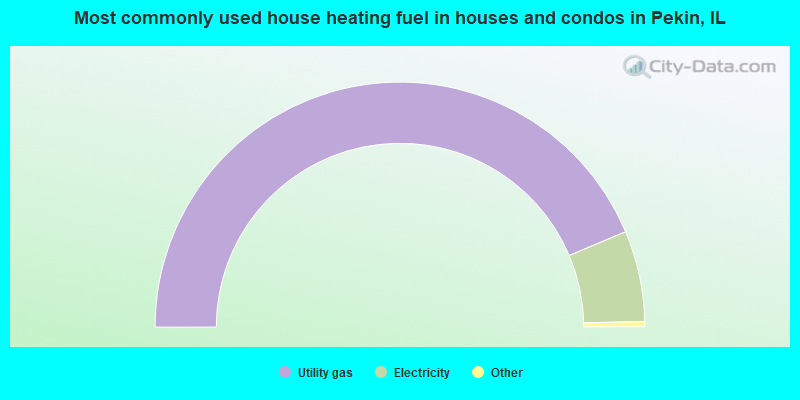
- 87.3%Utility gas
- 12.0%Electricity
- 0.2%Bottled, tank, or LP gas
- 0.2%No fuel used
- 0.2%Other fuel
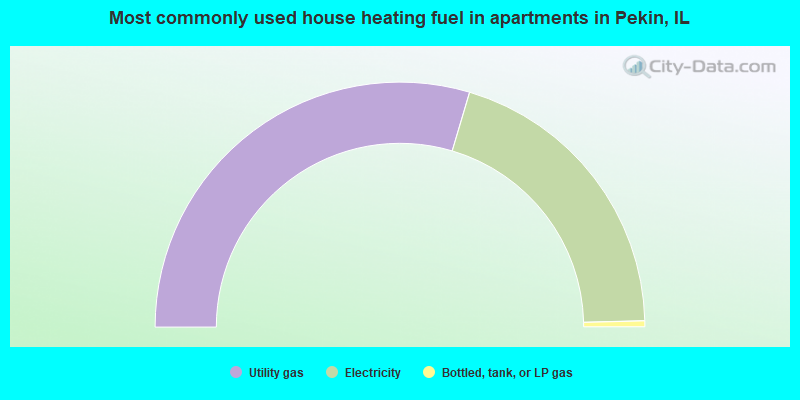
- 59.2%Utility gas
- 40.0%Electricity
- 0.8%Bottled, tank, or LP gas
Pekin compared to Illinois state average:
- Median house value below state average.
- Unemployed percentage significantly below state average.
- Black race population percentage significantly below state average.
- Hispanic race population percentage significantly below state average.
- Foreign-born population percentage significantly below state average.
- Length of stay since moving in above state average.
- Institutionalized population percentage significantly above state average.
- Number of college students below state average.
Pekin on our top lists:
- #41 on the list of "Top 101 cities with the largest percentage of people in federal prisons and detention centers (population 1,000+)"
- #10 on the list of "Top 101 counties with the lowest percentage of residents relocating to foreign countries in 2011"
- #32 on the list of "Top 101 counties with the lowest percentage of residents relocating from foreign countries between 2010 and 2011"
- #56 on the list of "Top 101 counties with the largest number of people without health insurance coverage in 2000 (pop. 50,000+)"

|
|
Total of 84 patent applications in 2008-2024.