Percentage of residents living in poverty in 2022: 24.9%
(66.7% for White Non-Hispanic residents, 24.8% for Hispanic or Latino residents, 11.9% for American Indian residents, 28.8% for other race residents, 20.1% for two or more races residents)
170.05%Native Hawaiian and Other Pacific Islander alone
According to our research of Arizona and other state lists, there were 10 registered sex offenders living in San Luis, Arizona as of April 27, 2024. The ratio of all residents to sex offenders in San Luis is 3,148 to 1. The ratio of registered sex offenders to all residents in this city is much lower than the state average.
Crime rates in San Luis by year
Type
2012
2013
2014
2015
2016
2017
2018
2019
2020
2021
2022
Murders (per 100,000)
0 (0.0)
1 (3.5)
0 (0.0)
0 (0.0)
1 (3.1)
0 (0.0)
1 (3.0)
0 (0.0)
0 (0.0)
0 (0.0)
0 (0.0)
Rapes (per 100,000)
6 (21.3)
4 (14.2)
2 (6.2)
3 (9.4)
1 (3.1)
3 (9.1)
3 (9.1)
0 (0.0)
2 (5.6)
1 (2.7)
0 (0.0)
Robberies (per 100,000)
1 (3.6)
3 (10.6)
4 (12.5)
5 (15.7)
1 (3.1)
6 (18.3)
1 (3.0)
2 (5.8)
2 (5.6)
1 (2.7)
1 (2.6)
Assaults (per 100,000)
22 (78.1)
29 (102.7)
44 (137.2)
46 (144.6)
36 (111.7)
35 (106.6)
3 (9.1)
31 (90.7)
21 (59.0)
29 (78.1)
19 (49.3)
Burglaries (per 100,000)
158 (560.9)
139 (492.4)
114 (355.6)
118 (371.0)
79 (245.1)
122 (371.7)
56 (169.3)
53 (155.0)
37 (104.0)
40 (107.7)
30 (77.9)
Thefts (per 100,000)
352 (1,250)
345 (1,222)
292 (910.8)
242 (760.8)
294 (912.3)
325 (990.2)
317 (958.5)
262 (766.3)
201 (565.0)
145 (390.4)
141 (366.0)
Auto thefts (per 100,000)
72 (255.6)
55 (194.8)
51 (159.1)
53 (166.6)
54 (167.6)
76 (231.5)
99 (299.3)
105 (307.1)
86 (241.7)
59 (158.9)
41 (106.4)
Arson (per 100,000)
4 (14.2)
1 (3.5)
0 (0.0)
0 (0.0)
0 (0.0)
2 (6.1)
0 (0.0)
2 (5.8)
0 (0.0)
1 (2.7)
1 (2.6)
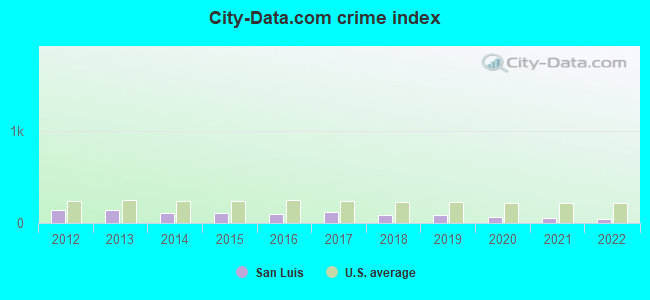
City-Data.com crime index
143.4
141.1
110.2
110.9
99.0
118.3
90.2
86.0
67.2
54.4
39.2
The City-Data.com crime index weighs serious crimes and violent crimes more heavily. Higher means more crime, U.S. average is 246.1. It adjusts for the number of visitors and daily workers commuting into cities.
Latest news from San Luis, AZ collected exclusively by city-data.com from local newspapers, TV, and radio stations
Current Local Time: MST (no DST) time zone
Incorporated in 1979
Land area: 26.4 square miles.
Population density: 1,353 people per square mile (low).
16,318 residents are foreign born (44.8% Latin America).
This city:
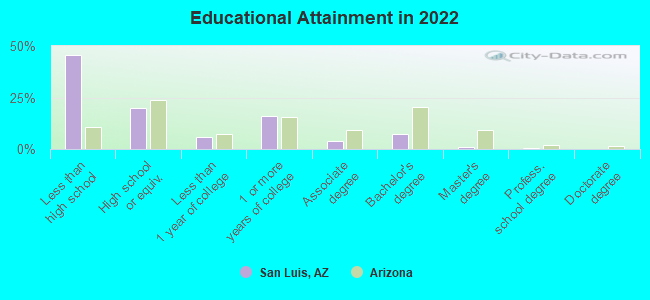
45.6%
Arizona:
13.0%
Median real estate property taxes paid for housing units with mortgages in 2022: $1,414 (0.6%) Median real estate property taxes paid for housing units with no mortgage in 2022: $1,224 (0.6%)
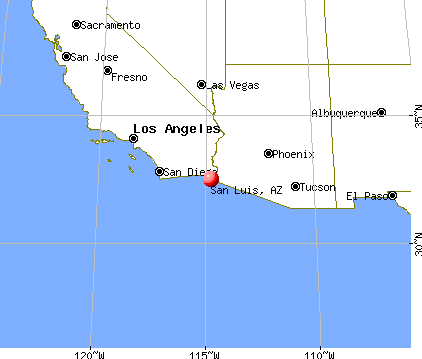
Nearest city with pop. 50,000+: Yuma, AZ (16.2 miles , pop. 77,515).
Nearest city with pop. 200,000+: San Diego, CA (139.9 miles , pop. 1,223,400).
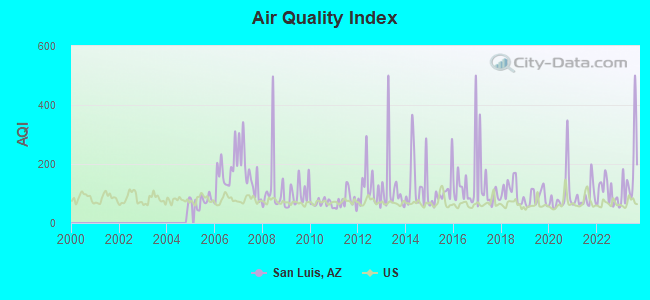
Air Quality Index (AQI) level in 2023 was 168. This is significantly worse than average.
City:
168
U.S.:
73
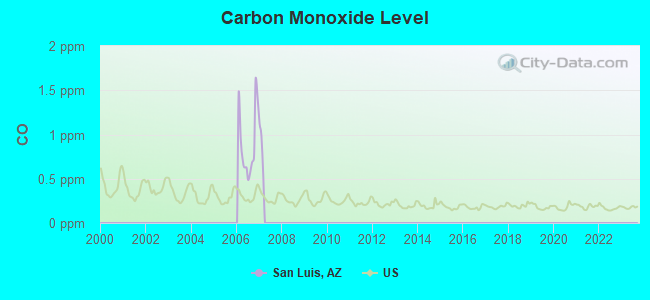
Carbon Monoxide (CO) [ppm] level in 2006 was 0.903. This is significantly worse than average.Closest monitor was 2.1 miles away from the city center.
City:
0.903
U.S.:
0.251
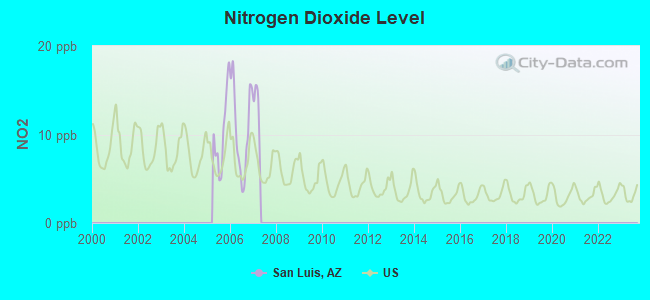
Nitrogen Dioxide (NO2) [ppb] level in 2006 was 10.6. This is significantly worse than average.Closest monitor was 21.2 miles away from the city center.
City:
10.6
U.S.:
5.1
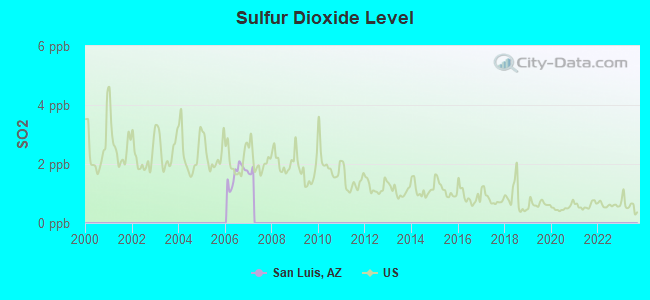
Sulfur Dioxide (SO2) [ppb] level in 2006 was 1.65. This is about average.Closest monitor was 16.1 miles away from the city center.
City:
1.65
U.S.:
1.51
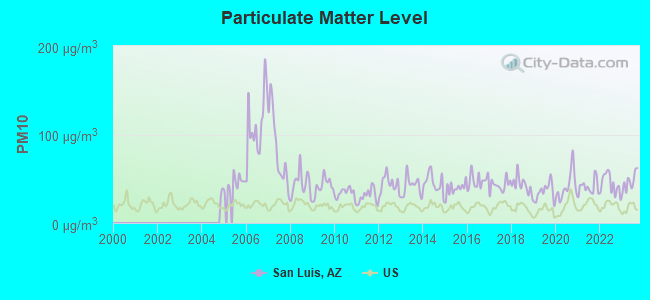
Particulate Matter (PM10) [µg/m3] level in 2023 was 46.8. This is significantly worse than average.Closest monitor was 2.1 miles away from the city center.
City:
46.8
U.S.:
19.2
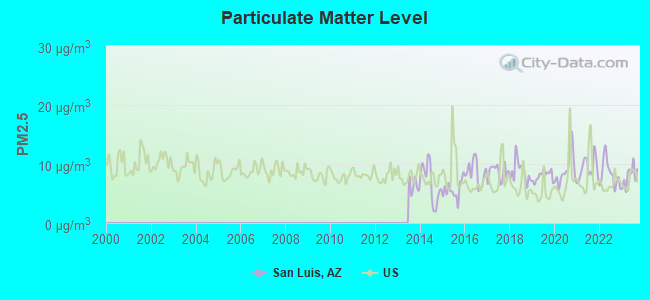
Particulate Matter (PM2.5) [µg/m3] level in 2023 was 7.97. This is about average.Closest monitor was 14.3 miles away from the city center.
City:
7.97
U.S.:
8.11
Earthquake activity:
San Luis-area historical earthquake activity is significantly above Arizona state average. It is 4228% greater than the overall U.S. average.
On 6/28/1992 at 11:57:34, a magnitude 7.6 (6.2 MB, 7.6 MS, 7.3 MW, Depth: 0.7 mi, Class: Major, Intensity: VIII - XII) earthquake occurred 155.0 miles away from the city center, causing 3 deaths (1 shaking deaths, 2 other deaths) and 400 injuries, causing $100,000,000 total damage and $40,000,000 insured losses On 5/19/1940 at 04:36:40, a magnitude 7.2 (7.2 UK) earthquake occurred 73.7 miles away from the city center, causing $33,000,000 total damage On 12/31/1934 at 18:45:56, a magnitude 7.1 (7.1 UK) earthquake occurred 59.3 miles away from the city center On 10/15/1979 at 23:16:54, a magnitude 7.0 (5.7 MB, 6.9 MS, 7.0 ML, 6.4 MW) earthquake occurred 55.3 miles away from the city center On 10/16/1999 at 09:46:44, a magnitude 7.4 (6.3 MB, 7.4 MS, 7.2 MW, 7.3 ML) earthquake occurred 169.5 miles away from San Luis center On 7/21/1952 at 11:52:14, a magnitude 7.7 (7.7 UK) earthquake occurred 298.7 miles away from the city center, causing $50,000,000 total damage Magnitude types: body-wave magnitude (MB), local magnitude (ML), surface-wave magnitude (MS), moment magnitude (MW)
Natural disasters:
The number of natural disasters in Yuma County (5) is a lot smaller than the US average (15). Major Disasters (Presidential) Declared: 3 Emergencies Declared: 1
Causes of natural disasters: Floods: 2, Heavy Rain: 1, Hurricane: 1, Storm: 1, Tornado: 1, Wind: 1, Other: 1 (Note: some incidents may be assigned to more than one category).
Hospitals and medical centers near San Luis:
CARING TOUCH HOME CARE LLC (Home Health Center, about 15 miles away; YUMA, AZ)
ADVANTAGE HEALTH INC (Home Health Center, about 15 miles away; YUMA, AZ)
YUMA DIALYSIS (DVA) (Dialysis Facility, about 15 miles away; YUMA, AZ)
YUMA NURSING CENTER (Nursing Home, about 15 miles away; YUMA, AZ)
LIFE CARE CENTER OF YUMA (Nursing Home, about 15 miles away; YUMA, AZ)
ANGELS PRN, INC (Home Health Center, about 16 miles away; YUMA, AZ)
YUMA REGIONAL MEDICAL CENTER Acute Care Hospitals (about 16 miles away; YUMA, AZ)
THERE IS NEW HIGH SCHOOL IN SAN LUIS. THIS IS NOT A CHARTER HIGH SCHOOL. IT IS CALLED SAN LUIS HIGH SCHOOL, THE MASCOT IS THE SIDEWINDERS.
added by CAMANEY
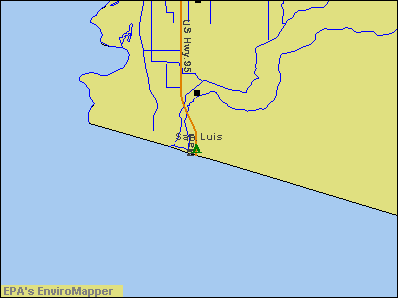
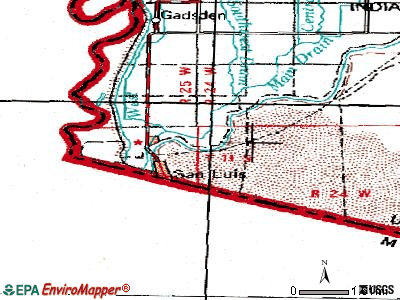
Notable locations in San Luis: Port of Entry San Luis (A), San Luis Library (B), Arizona State Prison Complex Yuma (C), San Luis Fire Department (D), Rural / Metro Fire Department Station 7 (E). Display/hide their locations on the map
Yuma County has a predicted average indoor radon screening level between 2 and 4 pCi/L (pico curies per liter) - Moderate Potential
Average household size:
This city:
4.2 people
Arizona:
2.6 people
Percentage of family households:
This city:
92.9%
Whole state:
66.2%
Percentage of households with unmarried partners:
This city:
4.5%
Whole state:
7.8%
Likely homosexual households (counted as self-reported same-sex unmarried-partner households)
Lesbian couples: 0.2% of all households
Gay men: 0.2% of all households
People in group quarters in San Luis in 2010:
502 people in federal detention centers
11 people in group homes intended for adults
11 people in other noninstitutional facilities
2,316 people in state prisons in 2000
4 people in other nonhousehold living situations in 2000
Banks with branches in San Luis (2011 data):
SunBank, National Association: San Luis Branch at 1613 North Main Street, branch established on 2008/03/07. Info updated 2010/07/12: Bank assets: $31.4 mil, Deposits: $23.9 mil, headquarters in Phoenix, AZ, negative income in the last year, 16 total offices, Holding Company: Dickinson Financial Corporation Ii
JPMorgan Chase Bank, National Association: San Luis Branch at 623 Main Street, branch established on 1964/04/06. Info updated 2011/11/10: Bank assets: $1,811,678.0 mil, Deposits: $1,190,738.0 mil, headquarters in Columbus, OH, positive income, International Specialization, 5577 total offices, Holding Company: Jpmorgan Chase & Co.
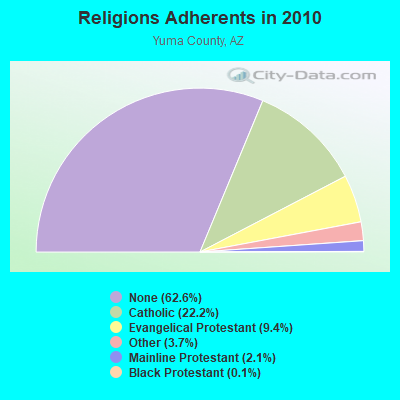
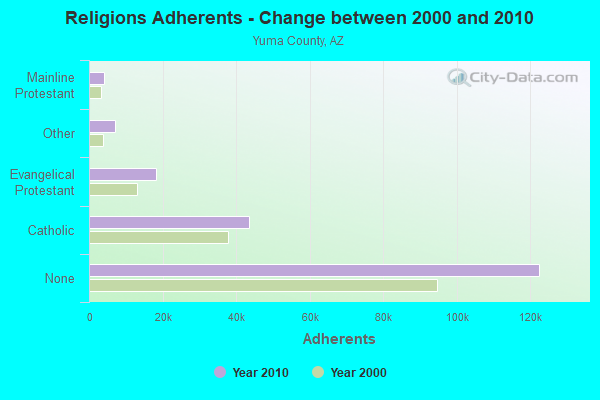
Religion statistics for San Luis, AZ (based on Yuma County data)
Religion
Adherents
Congregations
Catholic
43,401
7
Evangelical Protestant
18,341
92
Other
7,164
25
Mainline Protestant
4,078
14
Black Protestant
222
3
None
122,545
-
Source: Clifford Grammich, Kirk Hadaway, Richard Houseal, Dale E.Jones, Alexei Krindatch, Richie Stanley and Richard H.Taylor. 2012. 2010 U.S.Religion Census: Religious Congregations & Membership Study. Association of Statisticians of American Religious Bodies. Jones, Dale E., et al. 2002. Congregations and Membership in the United States 2000. Nashville, TN: Glenmary Research Center. Graphs represent county-level data
Aircraft: MAULE MX-7-180A (Category: Land, Seats: 5, Weight: Up to 12,499 Pounds), Engine: LYCOMING O&VO-360 SER (180 HP) (Reciprocating) N-Number: 1993F, N1993F, N-1993F, Serial Number: 20003C, Airworthiness Date: 09/23/1993, Certificate Issue Date: 06/17/2010 Registrant (Individual): Alejandro Salas Tamayo, Po Box 5374, San Luis, AZ 85349
Aircraft: PIPER PA-31T1 (Category: Land, Engines: 2, Seats: 7, Weight: Up to 12,499 Pounds), Engine: P&W CANADA PT6A-60A (1050 HP) (Turbo-prop) N-Number: 479SW, N479SW, N-479SW, Serial Number: 31T-7904047, Year manufactured: 1979, Airworthiness Date: 08/24/1979, Certificate Issue Date: 12/15/2016 Registrant (LLC): Ccv Aviation LLC, Po Box 5834, San Luis, AZ 85349
Aircraft: CESSNA T182T (Category: Land, Seats: 4, Weight: Up to 12,499 Pounds), Engine: LYCOMING TI0-540 SER (310 HP) (Reciprocating) N-Number: 5330A, N5330A, N-5330A, Serial Number: T18208190, Year manufactured: 2003, Airworthiness Date: 03/26/2003, Certificate Issue Date: 05/29/2014 Registrant (LLC): Gila Aviation LLC, Po Box 10346, San Luis, AZ 85349
Aircraft: BEECH 58 (Category: Land, Engines: 2, Seats: 6, Weight: Up to 12,499 Pounds, Speed: 165 mph), Engine: Reciprocating N-Number: 6639K, N6639K, N-6639K, Serial Number: TH-1049, Year manufactured: 1979, Airworthiness Date: 06/19/1979, Certificate Issue Date: 01/31/2011 Registrant (LLC): Xp Skyhawk LLC, Po Box 10346, San Luis, AZ 85349
Aircraft: BEECH 58P (Category: Land, Engines: 2, Seats: 6, Weight: Up to 12,499 Pounds, Speed: 123 mph), Engine: Reciprocating N-Number: 6743C, N6743C, N-6743C, Serial Number: TJ-269, Year manufactured: 1980, Certificate Issue Date: 04/16/2015 Registrant (LLC): Xp Skyhawk LLC, Po Box 10346, San Luis, AZ 85349
Aircraft: PIPER PA-22-160 (Category: Land, Seats: 4, Weight: Up to 12,499 Pounds, Speed: 94 mph), Engine: LYCOMING 0-320 SERIES (180 HP) (Reciprocating) N-Number: 8830D, N8830D, N-8830D, Serial Number: 22-6000, Airworthiness Date: 02/21/1958, Certificate Issue Date: 03/24/2015 Registrant (Individual): Alejandro Tamayo, Po Box 5374, San Luis, AZ 85349
Aircraft: CESSNA 210B (Category: Land, Seats: 4, Weight: Up to 12,499 Pounds, Speed: 141 mph), Engine: CONT MOTOR I0-470 SERIES (260 HP) (Reciprocating) N-Number: 9775X, N9775X, N-9775X, Serial Number: 21058075, Year manufactured: 1962, Airworthiness Date: 08/29/1962, Certificate Issue Date: 08/05/2014 Registrant (Individual): Juan H Ritchie, Po Box 3223, San Luis, AZ 85349 Deregistered:Cancel Date: 04/18/2018
Home Mortgage Disclosure Act Aggregated Statistics For Year 2009 (Based on 3 partial tracts)
A) FHA, FSA/RHS & VA Home Purchase Loans
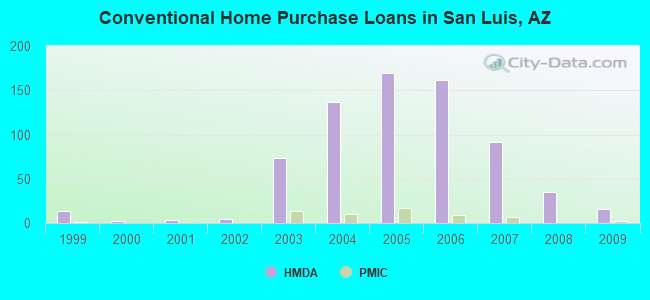
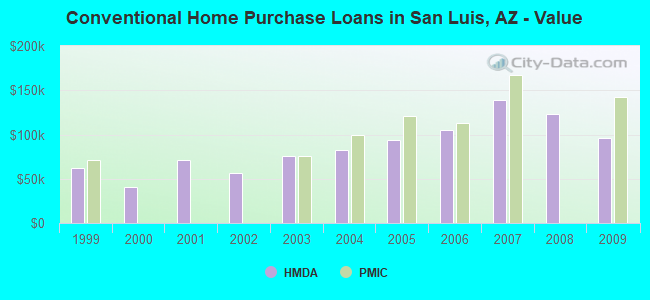
B) Conventional Home Purchase Loans
C) Refinancings
D) Home Improvement Loans
F) Non-occupant Loans on < 5 Family Dwellings (A B C & D)
G) Loans On Manufactured Home Dwelling (A B C & D)
Number
Average Value
Number
Average Value
Number
Average Value
Number
Average Value
Number
Average Value
Number
Average Value
LOANS ORIGINATED
107
$113,599
16
$96,163
115
$104,304
11
$38,288
6
$105,222
3
$71,483
APPLICATIONS APPROVED, NOT ACCEPTED
7
$105,719
0
$0
22
$91,514
3
$42,100
1
$133,980
0
$0
APPLICATIONS DENIED
34
$107,784
8
$110,830
97
$114,634
23
$17,675
5
$54,548
11
$75,044
APPLICATIONS WITHDRAWN
7
$120,593
7
$82,381
57
$112,857
7
$34,583
5
$76,600
4
$86,635
FILES CLOSED FOR INCOMPLETENESS
1
$192,590
0
$0
11
$101,003
0
$0
0
$0
1
$66,140
Aggregated Statistics For Year 2008 (Based on 3 partial tracts)
A) FHA, FSA/RHS & VA Home Purchase Loans
B) Conventional Home Purchase Loans
C) Refinancings
D) Home Improvement Loans
F) Non-occupant Loans on < 5 Family Dwellings (A B C & D)
G) Loans On Manufactured Home Dwelling (A B C & D)
Number
Average Value
Number
Average Value
Number
Average Value
Number
Average Value
Number
Average Value
Number
Average Value
LOANS ORIGINATED
69
$125,262
35
$122,893
165
$105,778
28
$42,849
18
$104,223
6
$52,608
APPLICATIONS APPROVED, NOT ACCEPTED
4
$129,042
4
$126,662
30
$116,650
5
$43,076
4
$145,202
0
$0
APPLICATIONS DENIED
6
$144,058
11
$133,359
136
$116,136
42
$46,115
15
$89,111
14
$66,966
APPLICATIONS WITHDRAWN
2
$128,070
10
$125,185
44
$113,923
12
$76,759
3
$99,430
2
$85,240
FILES CLOSED FOR INCOMPLETENESS
1
$125,060
0
$0
8
$128,286
2
$77,440
0
$0
0
$0
Aggregated Statistics For Year 2007 (Based on 3 partial tracts)
A) FHA, FSA/RHS & VA Home Purchase Loans
B) Conventional Home Purchase Loans
C) Refinancings
D) Home Improvement Loans
F) Non-occupant Loans on < 5 Family Dwellings (A B C & D)
G) Loans On Manufactured Home Dwelling (A B C & D)
Number
Average Value
Number
Average Value
Number
Average Value
Number
Average Value
Number
Average Value
Number
Average Value
LOANS ORIGINATED
20
$141,328
91
$139,353
217
$112,700
59
$59,379
23
$132,534
10
$69,855
APPLICATIONS APPROVED, NOT ACCEPTED
0
$0
12
$113,954
50
$106,689
12
$68,376
8
$110,441
2
$79,655
APPLICATIONS DENIED
1
$177,200
38
$161,055
187
$116,236
69
$61,802
27
$121,320
15
$56,793
APPLICATIONS WITHDRAWN
2
$120,820
14
$141,811
61
$112,287
14
$72,063
9
$105,277
0
$0
FILES CLOSED FOR INCOMPLETENESS
0
$0
4
$147,300
26
$135,666
1
$58,710
1
$106,100
1
$41,870
Aggregated Statistics For Year 2006 (Based on 3 partial tracts)
A) FHA, FSA/RHS & VA Home Purchase Loans
B) Conventional Home Purchase Loans
C) Refinancings
D) Home Improvement Loans
E) Loans on Dwellings For 5+ Families
F) Non-occupant Loans on < 5 Family Dwellings (A B C & D)
G) Loans On Manufactured Home Dwelling (A B C & D)
Number
Average Value
Number
Average Value
Number
Average Value
Number
Average Value
Number
Average Value
Number
Average Value
Number
Average Value
LOANS ORIGINATED
30
$122,420
162
$104,701
291
$106,060
62
$62,161
1
$308,430
51
$106,104
15
$84,794
APPLICATIONS APPROVED, NOT ACCEPTED
0
$0
23
$90,470
66
$101,942
9
$62,263
0
$0
20
$88,833
3
$81,370
APPLICATIONS DENIED
1
$142,600
35
$124,369
220
$102,936
79
$56,501
0
$0
21
$116,835
19
$59,133
APPLICATIONS WITHDRAWN
2
$76,130
29
$114,277
105
$111,861
15
$64,436
0
$0
7
$111,821
3
$74,087
FILES CLOSED FOR INCOMPLETENESS
0
$0
6
$85,745
38
$117,313
3
$83,817
0
$0
3
$82,807
1
$62,340
Aggregated Statistics For Year 2005 (Based on 3 partial tracts)
A) FHA, FSA/RHS & VA Home Purchase Loans
B) Conventional Home Purchase Loans
C) Refinancings
D) Home Improvement Loans
F) Non-occupant Loans on < 5 Family Dwellings (A B C & D)
G) Loans On Manufactured Home Dwelling (A B C & D)
Number
Average Value
Number
Average Value
Number
Average Value
Number
Average Value
Number
Average Value
Number
Average Value
LOANS ORIGINATED
47
$98,477
170
$93,805
237
$87,769
31
$49,435
49
$91,322
12
$63,476
APPLICATIONS APPROVED, NOT ACCEPTED
2
$100,680
28
$82,892
53
$78,814
3
$54,030
7
$65,369
1
$76,940
APPLICATIONS DENIED
4
$102,722
37
$96,301
249
$88,070
57
$38,901
15
$77,975
15
$75,260
APPLICATIONS WITHDRAWN
3
$105,960
34
$95,708
80
$96,823
7
$96,971
6
$89,085
4
$71,925
FILES CLOSED FOR INCOMPLETENESS
1
$72,570
6
$94,665
29
$95,834
2
$12,105
3
$87,457
1
$76,030
Aggregated Statistics For Year 2004 (Based on 3 partial tracts)
A) FHA, FSA/RHS & VA Home Purchase Loans
B) Conventional Home Purchase Loans
C) Refinancings
D) Home Improvement Loans
E) Loans on Dwellings For 5+ Families
F) Non-occupant Loans on < 5 Family Dwellings (A B C & D)
G) Loans On Manufactured Home Dwelling (A B C & D)
Number
Average Value
Number
Average Value
Number
Average Value
Number
Average Value
Number
Average Value
Number
Average Value
Number
Average Value
LOANS ORIGINATED
63
$85,137
137
$82,139
157
$70,293
23
$28,736
1
$2,442,300
34
$78,601
9
$69,656
APPLICATIONS APPROVED, NOT ACCEPTED
5
$77,270
16
$82,468
46
$72,659
7
$35,306
0
$0
4
$72,505
3
$62,383
APPLICATIONS DENIED
5
$96,442
32
$79,844
155
$72,780
43
$25,372
0
$0
13
$83,474
14
$47,371
APPLICATIONS WITHDRAWN
9
$70,283
24
$108,457
55
$88,004
3
$75,320
0
$0
5
$74,364
1
$139,970
FILES CLOSED FOR INCOMPLETENESS
0
$0
5
$104,714
14
$83,273
1
$35,750
0
$0
1
$95,550
1
$94,850
Aggregated Statistics For Year 2003 (Based on 3 partial tracts)
A) FHA, FSA/RHS & VA Home Purchase Loans
B) Conventional Home Purchase Loans
C) Refinancings
D) Home Improvement Loans
F) Non-occupant Loans on < 5 Family Dwellings (A B C & D)
Number
Average Value
Number
Average Value
Number
Average Value
Number
Average Value
Number
Average Value
LOANS ORIGINATED
53
$76,498
74
$75,438
147
$68,426
12
$14,821
14
$59,859
APPLICATIONS APPROVED, NOT ACCEPTED
2
$94,765
6
$87,610
30
$70,143
0
$0
3
$48,117
APPLICATIONS DENIED
3
$87,447
18
$80,076
111
$70,708
15
$13,583
6
$85,517
APPLICATIONS WITHDRAWN
6
$70,568
10
$82,311
43
$81,190
2
$60,360
1
$51,970
FILES CLOSED FOR INCOMPLETENESS
0
$0
0
$0
4
$76,772
0
$0
0
$0
Aggregated Statistics For Year 2002 (Based on 1 partial tract)
A) FHA, FSA/RHS & VA Home Purchase Loans
B) Conventional Home Purchase Loans
C) Refinancings
D) Home Improvement Loans
F) Non-occupant Loans on < 5 Family Dwellings (A B C & D)
Number
Average Value
Number
Average Value
Number
Average Value
Number
Average Value
Number
Average Value
LOANS ORIGINATED
8
$73,285
4
$56,685
4
$54,652
1
$16,650
1
$47,570
APPLICATIONS APPROVED, NOT ACCEPTED
0
$0
0
$0
1
$37,260
0
$0
0
$0
APPLICATIONS DENIED
1
$63,230
2
$68,280
7
$57,506
3
$17,177
0
$0
APPLICATIONS WITHDRAWN
1
$43,210
3
$44,463
3
$64,943
1
$20,610
0
$0
FILES CLOSED FOR INCOMPLETENESS
0
$0
0
$0
1
$33,500
0
$0
0
$0
Aggregated Statistics For Year 2001 (Based on 1 partial tract)
A) FHA, FSA/RHS & VA Home Purchase Loans
B) Conventional Home Purchase Loans
C) Refinancings
D) Home Improvement Loans
Number
Average Value
Number
Average Value
Number
Average Value
Number
Average Value
LOANS ORIGINATED
3
$66,860
3
$71,220
5
$51,214
1
$1,980
APPLICATIONS APPROVED, NOT ACCEPTED
0
$0
0
$0
1
$66,790
0
$0
APPLICATIONS DENIED
0
$0
2
$89,785
4
$64,218
2
$17,740
APPLICATIONS WITHDRAWN
0
$0
1
$22,590
2
$52,920
0
$0
FILES CLOSED FOR INCOMPLETENESS
0
$0
0
$0
1
$23,590
0
$0
Aggregated Statistics For Year 2000 (Based on 1 partial tract)
A) FHA, FSA/RHS & VA Home Purchase Loans
B) Conventional Home Purchase Loans
C) Refinancings
D) Home Improvement Loans
Number
Average Value
Number
Average Value
Number
Average Value
Number
Average Value
LOANS ORIGINATED
3
$74,260
2
$41,025
2
$61,940
0
$0
APPLICATIONS APPROVED, NOT ACCEPTED
0
$0
1
$27,150
0
$0
0
$0
APPLICATIONS DENIED
1
$57,280
2
$64,515
1
$65,210
1
$23,390
APPLICATIONS WITHDRAWN
0
$0
0
$0
0
$0
0
$0
FILES CLOSED FOR INCOMPLETENESS
0
$0
0
$0
0
$0
0
$0
Aggregated Statistics For Year 1999 (Based on 2 partial tracts)
A) FHA, FSA/RHS & VA Home Purchase Loans
B) Conventional Home Purchase Loans
C) Refinancings
D) Home Improvement Loans
F) Non-occupant Loans on < 5 Family Dwellings (A B C & D)
2003 - 2018 National Fire Incident Reporting System (NFIRS) incidents
According to the data from the years 2003 - 2018 the average number of fires per year is 23. The highest number of reported fire incidents - 46 took place in 2004, and the least - 0 in 2008. The data has a growing trend.
When looking into fire subcategories, the most reports belonged to: Outside Fires (33.3%), and Mobile Property/Vehicle Fires (30.9%).
Fire incident types reported to NFIRS in San Luis, AZ


 Recent articles from our blog. Our writers, many of them Ph.D. graduates or candidates, create easy-to-read articles on a wide variety of topics.

 (16.2 miles

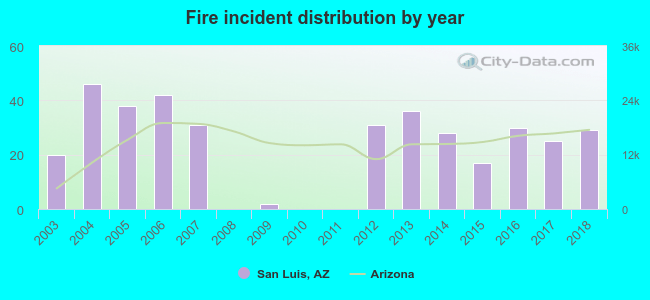 According to the data from the years 2003 - 2018 the average number of fires per year is 23. The highest number of reported fire incidents - 46 took place in 2004, and the least - 0 in 2008. The data has a growing trend.
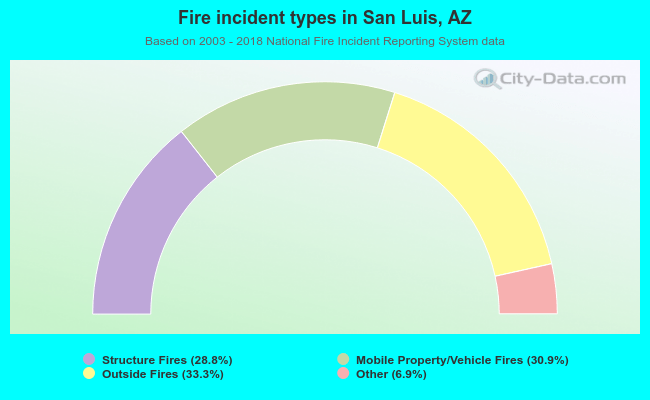 When looking into fire subcategories, the most reports belonged to: Outside Fires (33.3%), and Mobile Property/Vehicle Fires (30.9%).