Seaside Park, New Jersey Submit your own pictures of this borough and show them to the world
OSM Map
General Map
Google Map
MSN Map
OSM Map
General Map
Google Map
MSN Map
OSM Map
General Map
Google Map
MSN Map
OSM Map
General Map
Google Map
MSN Map
Please wait while loading the map...
Population in 2022: 1,473 (100% urban, 0% rural). Population change since 2000: -34.9%Males: 721 Females: 752
March 2022 cost of living index in Seaside Park: 126.6 (high, U.S. average is 100) Percentage of residents living in poverty in 2022: 9.9%for White Non-Hispanic residents , 46.5% for Black residents , 51.6% for two or more races residents )Business Search - 14 Million verified businesses
Data:
Median household income ($)
Median household income (% change since 2000)
Household income diversity
Ratio of average income to average house value (%)
Ratio of average income to average rent
Median household income ($) - White
Median household income ($) - Black or African American
Median household income ($) - Asian
Median household income ($) - Hispanic or Latino
Median household income ($) - American Indian and Alaska Native
Median household income ($) - Multirace
Median household income ($) - Other Race
Median household income for houses/condos with a mortgage ($)
Median household income for apartments without a mortgage ($)
Races - White alone (%)
Races - White alone (% change since 2000)
Races - Black alone (%)
Races - Black alone (% change since 2000)
Races - American Indian alone (%)
Races - American Indian alone (% change since 2000)
Races - Asian alone (%)
Races - Asian alone (% change since 2000)
Races - Hispanic (%)
Races - Hispanic (% change since 2000)
Races - Native Hawaiian and Other Pacific Islander alone (%)
Races - Native Hawaiian and Other Pacific Islander alone (% change since 2000)
Races - Two or more races (%)
Races - Two or more races (% change since 2000)
Races - Other race alone (%)
Races - Other race alone (% change since 2000)
Racial diversity
Unemployment (%)
Unemployment (% change since 2000)
Unemployment (%) - White
Unemployment (%) - Black or African American
Unemployment (%) - Asian
Unemployment (%) - Hispanic or Latino
Unemployment (%) - American Indian and Alaska Native
Unemployment (%) - Multirace
Unemployment (%) - Other Race
Population density (people per square mile)
Population - Males (%)
Population - Females (%)
Population - Males (%) - White
Population - Males (%) - Black or African American
Population - Males (%) - Asian
Population - Males (%) - Hispanic or Latino
Population - Males (%) - American Indian and Alaska Native
Population - Males (%) - Multirace
Population - Males (%) - Other Race
Population - Females (%) - White
Population - Females (%) - Black or African American
Population - Females (%) - Asian
Population - Females (%) - Hispanic or Latino
Population - Females (%) - American Indian and Alaska Native
Population - Females (%) - Multirace
Population - Females (%) - Other Race
Coronavirus confirmed cases (Apr 26, 2024)
Deaths caused by coronavirus (Apr 26, 2024)
Coronavirus confirmed cases (per 100k population) (Apr 26, 2024)
Deaths caused by coronavirus (per 100k population) (Apr 26, 2024)
Daily increase in number of cases (Apr 26, 2024)
Weekly increase in number of cases (Apr 26, 2024)
Cases doubled (in days) (Apr 26, 2024)
Hospitalized patients (Apr 18, 2022)
Negative test results (Apr 18, 2022)
Total test results (Apr 18, 2022)
COVID Vaccine doses distributed (per 100k population) (Sep 19, 2023)
COVID Vaccine doses administered (per 100k population) (Sep 19, 2023)
COVID Vaccine doses distributed (Sep 19, 2023)
COVID Vaccine doses administered (Sep 19, 2023)
Likely homosexual households (%)
Likely homosexual households (% change since 2000)
Likely homosexual households - Lesbian couples (%)
Likely homosexual households - Lesbian couples (% change since 2000)
Likely homosexual households - Gay men (%)
Likely homosexual households - Gay men (% change since 2000)
Cost of living index
Median gross rent ($)
Median contract rent ($)
Median monthly housing costs ($)
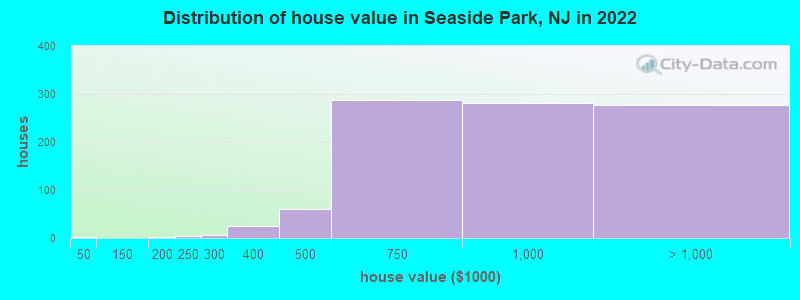
Median house or condo value ($)
Median house or condo value ($ change since 2000)
Mean house or condo value by units in structure - 1, detached ($)
Mean house or condo value by units in structure - 1, attached ($)
Mean house or condo value by units in structure - 2 ($)
Mean house or condo value by units in structure by units in structure - 3 or 4 ($)
Mean house or condo value by units in structure - 5 or more ($)
Mean house or condo value by units in structure - Boat, RV, van, etc. ($)
Mean house or condo value by units in structure - Mobile home ($)
Median house or condo value ($) - White
Median house or condo value ($) - Black or African American
Median house or condo value ($) - Asian
Median house or condo value ($) - Hispanic or Latino
Median house or condo value ($) - American Indian and Alaska Native
Median house or condo value ($) - Multirace
Median house or condo value ($) - Other Race
Median resident age
Resident age diversity
Median resident age - Males
Median resident age - Females
Median resident age - White
Median resident age - Black or African American
Median resident age - Asian
Median resident age - Hispanic or Latino
Median resident age - American Indian and Alaska Native
Median resident age - Multirace
Median resident age - Other Race
Median resident age - Males - White
Median resident age - Males - Black or African American
Median resident age - Males - Asian
Median resident age - Males - Hispanic or Latino
Median resident age - Males - American Indian and Alaska Native
Median resident age - Males - Multirace
Median resident age - Males - Other Race
Median resident age - Females - White
Median resident age - Females - Black or African American
Median resident age - Females - Asian
Median resident age - Females - Hispanic or Latino
Median resident age - Females - American Indian and Alaska Native
Median resident age - Females - Multirace
Median resident age - Females - Other Race
Commute - mean travel time to work (minutes)
Travel time to work - Less than 5 minutes (%)
Travel time to work - Less than 5 minutes (% change since 2000)
Travel time to work - 5 to 9 minutes (%)
Travel time to work - 5 to 9 minutes (% change since 2000)
Travel time to work - 10 to 19 minutes (%)
Travel time to work - 10 to 19 minutes (% change since 2000)
Travel time to work - 20 to 29 minutes (%)
Travel time to work - 20 to 29 minutes (% change since 2000)
Travel time to work - 30 to 39 minutes (%)
Travel time to work - 30 to 39 minutes (% change since 2000)
Travel time to work - 40 to 59 minutes (%)
Travel time to work - 40 to 59 minutes (% change since 2000)
Travel time to work - 60 to 89 minutes (%)
Travel time to work - 60 to 89 minutes (% change since 2000)
Travel time to work - 90 or more minutes (%)
Travel time to work - 90 or more minutes (% change since 2000)
Marital status - Never married (%)
Marital status - Now married (%)
Marital status - Separated (%)
Marital status - Widowed (%)
Marital status - Divorced (%)
Median family income ($)
Median family income (% change since 2000)
Median non-family income ($)
Median non-family income (% change since 2000)
Median per capita income ($)
Median per capita income (% change since 2000)
Median family income ($) - White
Median family income ($) - Black or African American
Median family income ($) - Asian
Median family income ($) - Hispanic or Latino
Median family income ($) - American Indian and Alaska Native
Median family income ($) - Multirace
Median family income ($) - Other Race
Median year house/condo built
Median year apartment built
Year house built - Built 2005 or later (%)
Year house built - Built 2000 to 2004 (%)
Year house built - Built 1990 to 1999 (%)
Year house built - Built 1980 to 1989 (%)
Year house built - Built 1970 to 1979 (%)
Year house built - Built 1960 to 1969 (%)
Year house built - Built 1950 to 1959 (%)
Year house built - Built 1940 to 1949 (%)
Year house built - Built 1939 or earlier (%)
Average household size
Household density (households per square mile)
Average household size - White
Average household size - Black or African American
Average household size - Asian
Average household size - Hispanic or Latino
Average household size - American Indian and Alaska Native
Average household size - Multirace
Average household size - Other Race
Occupied housing units (%)
Vacant housing units (%)
Owner occupied housing units (%)
Renter occupied housing units (%)
Vacancy status - For rent (%)
Vacancy status - For sale only (%)
Vacancy status - Rented or sold, not occupied (%)
Vacancy status - For seasonal, recreational, or occasional use (%)
Vacancy status - For migrant workers (%)
Vacancy status - Other vacant (%)
Residents with income below the poverty level (%)
Residents with income below 50% of the poverty level (%)
Children below poverty level (%)
Poor families by family type - Married-couple family (%)
Poor families by family type - Male, no wife present (%)
Poor families by family type - Female, no husband present (%)
Poverty status for native-born residents (%)
Poverty status for foreign-born residents (%)
Poverty among high school graduates not in families (%)
Poverty among people who did not graduate high school not in families (%)
Residents with income below the poverty level (%) - White
Residents with income below the poverty level (%) - Black or African American
Residents with income below the poverty level (%) - Asian
Residents with income below the poverty level (%) - Hispanic or Latino
Residents with income below the poverty level (%) - American Indian and Alaska Native
Residents with income below the poverty level (%) - Multirace
Residents with income below the poverty level (%) - Other Race
Air pollution - Air Quality Index (AQI)
Air pollution - CO
Air pollution - NO2
Air pollution - SO2
Air pollution - Ozone
Air pollution - PM10
Air pollution - PM25
Air pollution - Pb
Crime - Murders per 100,000 population
Crime - Rapes per 100,000 population
Crime - Robberies per 100,000 population
Crime - Assaults per 100,000 population
Crime - Burglaries per 100,000 population
Crime - Thefts per 100,000 population
Crime - Auto thefts per 100,000 population
Crime - Arson per 100,000 population
Crime - City-data.com crime index
Crime - Violent crime index
Crime - Property crime index
Crime - Murders per 100,000 population (5 year average)
Crime - Rapes per 100,000 population (5 year average)
Crime - Robberies per 100,000 population (5 year average)
Crime - Assaults per 100,000 population (5 year average)
Crime - Burglaries per 100,000 population (5 year average)
Crime - Thefts per 100,000 population (5 year average)
Crime - Auto thefts per 100,000 population (5 year average)
Crime - Arson per 100,000 population (5 year average)
Crime - City-data.com crime index (5 year average)
Crime - Violent crime index (5 year average)
Crime - Property crime index (5 year average)
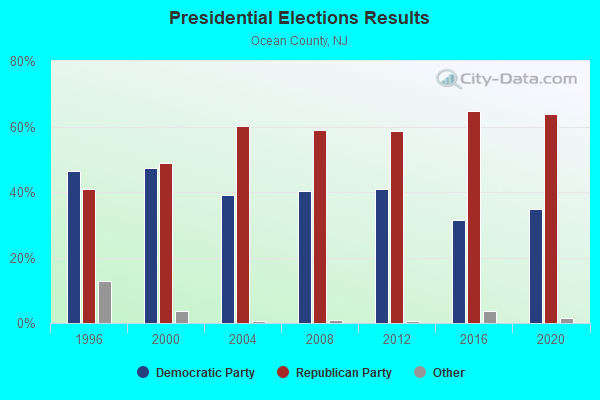
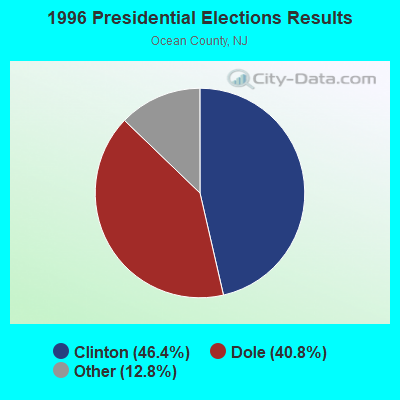
1996 Presidential Elections Results (%) - Democratic Party (Clinton)
1996 Presidential Elections Results (%) - Republican Party (Dole)
1996 Presidential Elections Results (%) - Other
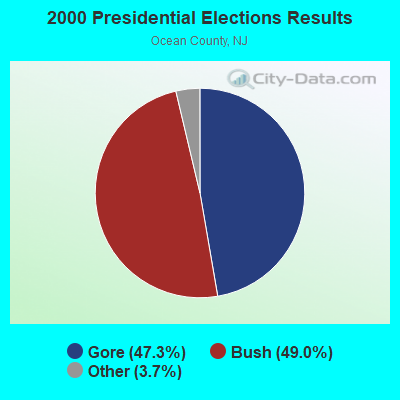
2000 Presidential Elections Results (%) - Democratic Party (Gore)
2000 Presidential Elections Results (%) - Republican Party (Bush)
2000 Presidential Elections Results (%) - Other
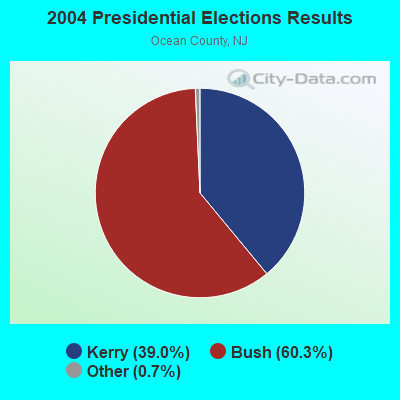
2004 Presidential Elections Results (%) - Democratic Party (Kerry)
2004 Presidential Elections Results (%) - Republican Party (Bush)
2004 Presidential Elections Results (%) - Other
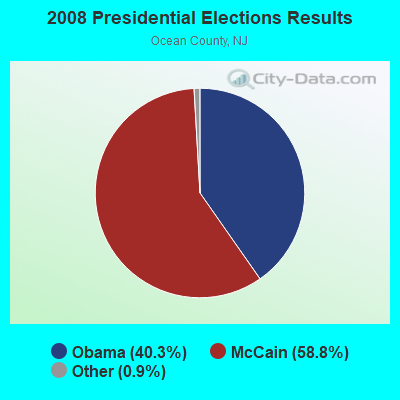
2008 Presidential Elections Results (%) - Democratic Party (Obama)
2008 Presidential Elections Results (%) - Republican Party (McCain)
2008 Presidential Elections Results (%) - Other
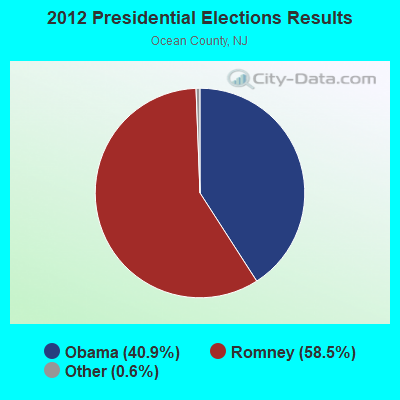
2012 Presidential Elections Results (%) - Democratic Party (Obama)
2012 Presidential Elections Results (%) - Republican Party (Romney)
2012 Presidential Elections Results (%) - Other
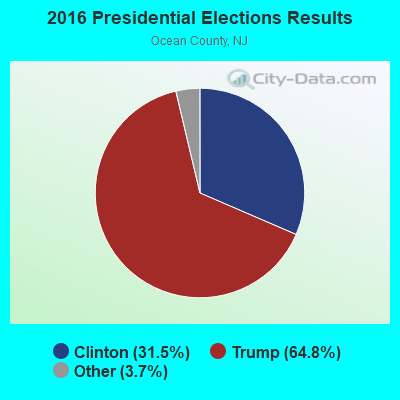
2016 Presidential Elections Results (%) - Democratic Party (Clinton)
2016 Presidential Elections Results (%) - Republican Party (Trump)
2016 Presidential Elections Results (%) - Other
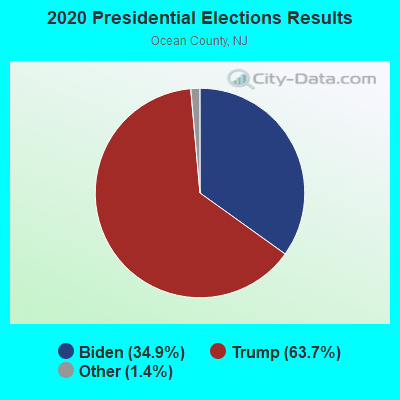
2020 Presidential Elections Results (%) - Democratic Party (Biden)
2020 Presidential Elections Results (%) - Republican Party (Trump)
2020 Presidential Elections Results (%) - Other
Ancestries Reported - Arab (%)
Ancestries Reported - Czech (%)
Ancestries Reported - Danish (%)
Ancestries Reported - Dutch (%)
Ancestries Reported - English (%)
Ancestries Reported - French (%)
Ancestries Reported - French Canadian (%)
Ancestries Reported - German (%)
Ancestries Reported - Greek (%)
Ancestries Reported - Hungarian (%)
Ancestries Reported - Irish (%)
Ancestries Reported - Italian (%)
Ancestries Reported - Lithuanian (%)
Ancestries Reported - Norwegian (%)
Ancestries Reported - Polish (%)
Ancestries Reported - Portuguese (%)
Ancestries Reported - Russian (%)
Ancestries Reported - Scotch-Irish (%)
Ancestries Reported - Scottish (%)
Ancestries Reported - Slovak (%)
Ancestries Reported - Subsaharan African (%)
Ancestries Reported - Swedish (%)
Ancestries Reported - Swiss (%)
Ancestries Reported - Ukrainian (%)
Ancestries Reported - United States (%)
Ancestries Reported - Welsh (%)
Ancestries Reported - West Indian (%)
Ancestries Reported - Other (%)
Educational Attainment - No schooling completed (%)
Educational Attainment - Less than high school (%)
Educational Attainment - High school or equivalent (%)
Educational Attainment - Less than 1 year of college (%)
Educational Attainment - 1 or more years of college (%)
Educational Attainment - Associate degree (%)
Educational Attainment - Bachelor's degree (%)
Educational Attainment - Master's degree (%)
Educational Attainment - Professional school degree (%)
Educational Attainment - Doctorate degree (%)
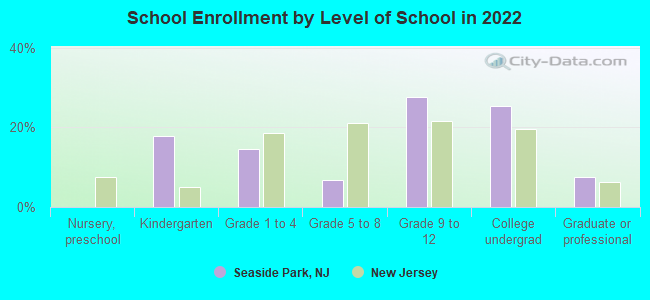
School Enrollment - Nursery, preschool (%)
School Enrollment - Kindergarten (%)
School Enrollment - Grade 1 to 4 (%)
School Enrollment - Grade 5 to 8 (%)
School Enrollment - Grade 9 to 12 (%)
School Enrollment - College undergrad (%)
School Enrollment - Graduate or professional (%)
School Enrollment - Not enrolled in school (%)
School enrollment - Public schools (%)
School enrollment - Private schools (%)
School enrollment - Not enrolled (%)
Median number of rooms in houses and condos
Median number of rooms in apartments
Housing units lacking complete plumbing facilities (%)
Housing units lacking complete kitchen facilities (%)
Density of houses
Urban houses (%)
Rural houses (%)
Households with people 60 years and over (%)
Households with people 65 years and over (%)
Households with people 75 years and over (%)
Households with one or more nonrelatives (%)
Households with no nonrelatives (%)
Population in households (%)
Family households (%)
Nonfamily households (%)
Population in families (%)
Family households with own children (%)
Median number of bedrooms in owner occupied houses
Mean number of bedrooms in owner occupied houses
Median number of bedrooms in renter occupied houses
Mean number of bedrooms in renter occupied houses
Median number of vehichles in owner occupied houses
Mean number of vehichles in owner occupied houses
Median number of vehichles in renter occupied houses
Mean number of vehichles in renter occupied houses
Mortgage status - with mortgage (%)
Mortgage status - with second mortgage (%)
Mortgage status - with home equity loan (%)
Mortgage status - with both second mortgage and home equity loan (%)
Mortgage status - without a mortgage (%)
Average family size
Average family size - White
Average family size - Black or African American
Average family size - Asian
Average family size - Hispanic or Latino
Average family size - American Indian and Alaska Native
Average family size - Multirace
Average family size - Other Race
Geographical mobility - Same house 1 year ago (%)
Geographical mobility - Moved within same county (%)
Geographical mobility - Moved from different county within same state (%)
Geographical mobility - Moved from different state (%)
Geographical mobility - Moved from abroad (%)
Place of birth - Born in state of residence (%)
Place of birth - Born in other state (%)
Place of birth - Native, outside of US (%)
Place of birth - Foreign born (%)
Housing units in structures - 1, detached (%)
Housing units in structures - 1, attached (%)
Housing units in structures - 2 (%)
Housing units in structures - 3 or 4 (%)
Housing units in structures - 5 to 9 (%)
Housing units in structures - 10 to 19 (%)
Housing units in structures - 20 to 49 (%)
Housing units in structures - 50 or more (%)
Housing units in structures - Mobile home (%)
Housing units in structures - Boat, RV, van, etc. (%)
House/condo owner moved in on average (years ago)
Renter moved in on average (years ago)
Year householder moved into unit - Moved in 1999 to March 2000 (%)
Year householder moved into unit - Moved in 1995 to 1998 (%)
Year householder moved into unit - Moved in 1990 to 1994 (%)
Year householder moved into unit - Moved in 1980 to 1989 (%)
Year householder moved into unit - Moved in 1970 to 1979 (%)
Year householder moved into unit - Moved in 1969 or earlier (%)
Means of transportation to work - Drove car alone (%)
Means of transportation to work - Carpooled (%)
Means of transportation to work - Public transportation (%)
Means of transportation to work - Bus or trolley bus (%)
Means of transportation to work - Streetcar or trolley car (%)
Means of transportation to work - Subway or elevated (%)
Means of transportation to work - Railroad (%)
Means of transportation to work - Ferryboat (%)
Means of transportation to work - Taxicab (%)
Means of transportation to work - Motorcycle (%)
Means of transportation to work - Bicycle (%)
Means of transportation to work - Walked (%)
Means of transportation to work - Other means (%)
Working at home (%)
Industry diversity
Most Common Industries - Agriculture, forestry, fishing and hunting, and mining (%)
Most Common Industries - Agriculture, forestry, fishing and hunting (%)
Most Common Industries - Mining, quarrying, and oil and gas extraction (%)
Most Common Industries - Construction (%)
Most Common Industries - Manufacturing (%)
Most Common Industries - Wholesale trade (%)
Most Common Industries - Retail trade (%)
Most Common Industries - Transportation and warehousing, and utilities (%)
Most Common Industries - Transportation and warehousing (%)
Most Common Industries - Utilities (%)
Most Common Industries - Information (%)
Most Common Industries - Finance and insurance, and real estate and rental and leasing (%)
Most Common Industries - Finance and insurance (%)
Most Common Industries - Real estate and rental and leasing (%)
Most Common Industries - Professional, scientific, and management, and administrative and waste management services (%)
Most Common Industries - Professional, scientific, and technical services (%)
Most Common Industries - Management of companies and enterprises (%)
Most Common Industries - Administrative and support and waste management services (%)
Most Common Industries - Educational services, and health care and social assistance (%)
Most Common Industries - Educational services (%)
Most Common Industries - Health care and social assistance (%)
Most Common Industries - Arts, entertainment, and recreation, and accommodation and food services (%)
Most Common Industries - Arts, entertainment, and recreation (%)
Most Common Industries - Accommodation and food services (%)
Most Common Industries - Other services, except public administration (%)
Most Common Industries - Public administration (%)
Occupation diversity
Most Common Occupations - Management, business, science, and arts occupations (%)
Most Common Occupations - Management, business, and financial occupations (%)
Most Common Occupations - Management occupations (%)
Most Common Occupations - Business and financial operations occupations (%)
Most Common Occupations - Computer, engineering, and science occupations (%)
Most Common Occupations - Computer and mathematical occupations (%)
Most Common Occupations - Architecture and engineering occupations (%)
Most Common Occupations - Life, physical, and social science occupations (%)
Most Common Occupations - Education, legal, community service, arts, and media occupations (%)
Most Common Occupations - Community and social service occupations (%)
Most Common Occupations - Legal occupations (%)
Most Common Occupations - Education, training, and library occupations (%)
Most Common Occupations - Arts, design, entertainment, sports, and media occupations (%)
Most Common Occupations - Healthcare practitioners and technical occupations (%)
Most Common Occupations - Health diagnosing and treating practitioners and other technical occupations (%)
Most Common Occupations - Health technologists and technicians (%)
Most Common Occupations - Service occupations (%)
Most Common Occupations - Healthcare support occupations (%)
Most Common Occupations - Protective service occupations (%)
Most Common Occupations - Fire fighting and prevention, and other protective service workers including supervisors (%)
Most Common Occupations - Law enforcement workers including supervisors (%)
Most Common Occupations - Food preparation and serving related occupations (%)
Most Common Occupations - Building and grounds cleaning and maintenance occupations (%)
Most Common Occupations - Personal care and service occupations (%)
Most Common Occupations - Sales and office occupations (%)
Most Common Occupations - Sales and related occupations (%)
Most Common Occupations - Office and administrative support occupations (%)
Most Common Occupations - Natural resources, construction, and maintenance occupations (%)
Most Common Occupations - Farming, fishing, and forestry occupations (%)
Most Common Occupations - Construction and extraction occupations (%)
Most Common Occupations - Installation, maintenance, and repair occupations (%)
Most Common Occupations - Production, transportation, and material moving occupations (%)
Most Common Occupations - Production occupations (%)
Most Common Occupations - Transportation occupations (%)
Most Common Occupations - Material moving occupations (%)
People in Group quarters - Institutionalized population (%)
People in Group quarters - Correctional institutions (%)
People in Group quarters - Federal prisons and detention centers (%)
People in Group quarters - Halfway houses (%)
People in Group quarters - Local jails and other confinement facilities (including police lockups) (%)
People in Group quarters - Military disciplinary barracks (%)
People in Group quarters - State prisons (%)
People in Group quarters - Other types of correctional institutions (%)
People in Group quarters - Nursing homes (%)
People in Group quarters - Hospitals/wards, hospices, and schools for the handicapped (%)
People in Group quarters - Hospitals/wards and hospices for chronically ill (%)
People in Group quarters - Hospices or homes for chronically ill (%)
People in Group quarters - Military hospitals or wards for chronically ill (%)
People in Group quarters - Other hospitals or wards for chronically ill (%)
People in Group quarters - Hospitals or wards for drug/alcohol abuse (%)
People in Group quarters - Mental (Psychiatric) hospitals or wards (%)
People in Group quarters - Schools, hospitals, or wards for the mentally retarded (%)
People in Group quarters - Schools, hospitals, or wards for the physically handicapped (%)
People in Group quarters - Institutions for the deaf (%)
People in Group quarters - Institutions for the blind (%)
People in Group quarters - Orthopedic wards and institutions for the physically handicapped (%)
People in Group quarters - Wards in general hospitals for patients who have no usual home elsewhere (%)
People in Group quarters - Wards in military hospitals for patients who have no usual home elsewhere (%)
People in Group quarters - Juvenile institutions (%)
People in Group quarters - Long-term care (%)
People in Group quarters - Homes for abused, dependent, and neglected children (%)
People in Group quarters - Residential treatment centers for emotionally disturbed children (%)
People in Group quarters - Training schools for juvenile delinquents (%)
People in Group quarters - Short-term care, detention or diagnostic centers for delinquent children (%)
People in Group quarters - Type of juvenile institution unknown (%)
People in Group quarters - Noninstitutionalized population (%)
People in Group quarters - College dormitories (includes college quarters off campus) (%)
People in Group quarters - Military quarters (%)
People in Group quarters - On base (%)
People in Group quarters - Barracks, unaccompanied personnel housing (UPH), (Enlisted/Officer), ;and similar group living quarters for military personnel (%)
People in Group quarters - Transient quarters for temporary residents (%)
People in Group quarters - Military ships (%)
People in Group quarters - Group homes (%)
People in Group quarters - Homes or halfway houses for drug/alcohol abuse (%)
People in Group quarters - Homes for the mentally ill (%)
People in Group quarters - Homes for the mentally retarded (%)
People in Group quarters - Homes for the physically handicapped (%)
People in Group quarters - Other group homes (%)
People in Group quarters - Religious group quarters (%)
People in Group quarters - Dormitories (%)
People in Group quarters - Agriculture workers' dormitories on farms (%)
People in Group quarters - Job Corps and vocational training facilities (%)
People in Group quarters - Other workers' dormitories (%)
People in Group quarters - Crews of maritime vessels (%)
People in Group quarters - Other nonhousehold living situations (%)
People in Group quarters - Other noninstitutional group quarters (%)
Residents speaking English at home (%)
Residents speaking English at home - Born in the United States (%)
Residents speaking English at home - Native, born elsewhere (%)
Residents speaking English at home - Foreign born (%)
Residents speaking Spanish at home (%)
Residents speaking Spanish at home - Born in the United States (%)
Residents speaking Spanish at home - Native, born elsewhere (%)
Residents speaking Spanish at home - Foreign born (%)
Residents speaking other language at home (%)
Residents speaking other language at home - Born in the United States (%)
Residents speaking other language at home - Native, born elsewhere (%)
Residents speaking other language at home - Foreign born (%)
Class of Workers - Employee of private company (%)
Class of Workers - Self-employed in own incorporated business (%)
Class of Workers - Private not-for-profit wage and salary workers (%)
Class of Workers - Local government workers (%)
Class of Workers - State government workers (%)
Class of Workers - Federal government workers (%)
Class of Workers - Self-employed workers in own not incorporated business and Unpaid family workers (%)
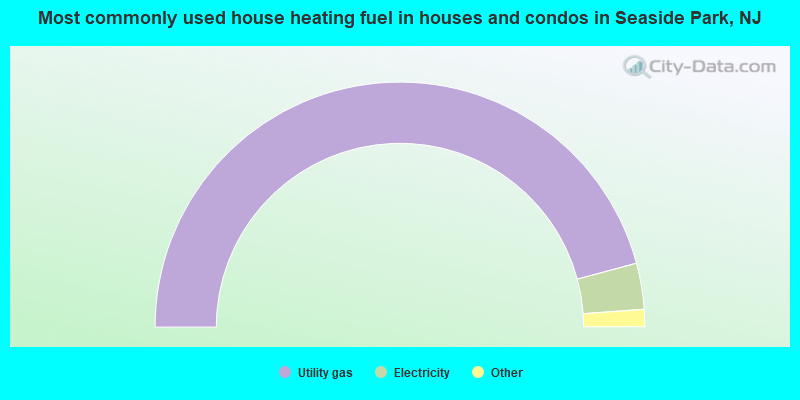
House heating fuel used in houses and condos - Utility gas (%)
House heating fuel used in houses and condos - Bottled, tank, or LP gas (%)
House heating fuel used in houses and condos - Electricity (%)
House heating fuel used in houses and condos - Fuel oil, kerosene, etc. (%)
House heating fuel used in houses and condos - Coal or coke (%)
House heating fuel used in houses and condos - Wood (%)
House heating fuel used in houses and condos - Solar energy (%)
House heating fuel used in houses and condos - Other fuel (%)
House heating fuel used in houses and condos - No fuel used (%)
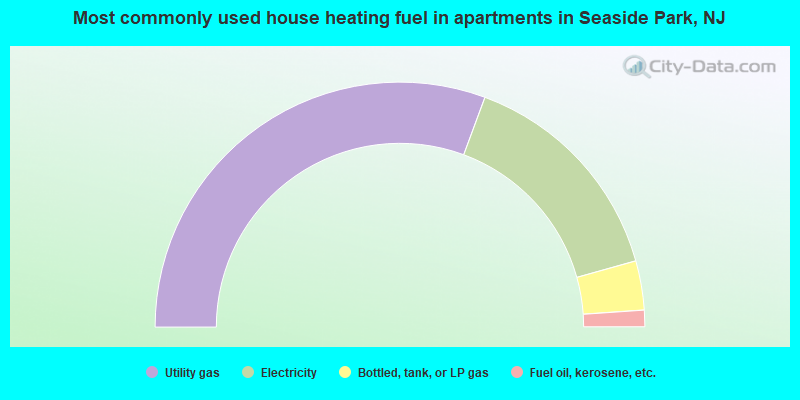
House heating fuel used in apartments - Utility gas (%)
House heating fuel used in apartments - Bottled, tank, or LP gas (%)
House heating fuel used in apartments - Electricity (%)
House heating fuel used in apartments - Fuel oil, kerosene, etc. (%)
House heating fuel used in apartments - Coal or coke (%)
House heating fuel used in apartments - Wood (%)
House heating fuel used in apartments - Solar energy (%)
House heating fuel used in apartments - Other fuel (%)
House heating fuel used in apartments - No fuel used (%)
Armed forces status - In Armed Forces (%)
Armed forces status - Civilian (%)
Armed forces status - Civilian - Veteran (%)
Armed forces status - Civilian - Nonveteran (%)
Fatal accidents locations in years 2005-2021
Fatal accidents locations in 2005
Fatal accidents locations in 2006
Fatal accidents locations in 2007
Fatal accidents locations in 2008
Fatal accidents locations in 2009
Fatal accidents locations in 2010
Fatal accidents locations in 2011
Fatal accidents locations in 2012
Fatal accidents locations in 2013
Fatal accidents locations in 2014
Fatal accidents locations in 2015
Fatal accidents locations in 2016
Fatal accidents locations in 2017
Fatal accidents locations in 2018
Fatal accidents locations in 2019
Fatal accidents locations in 2020
Fatal accidents locations in 2021
Alcohol use - People drinking some alcohol every month (%)
Alcohol use - People not drinking at all (%)
Alcohol use - Average days/month drinking alcohol
Alcohol use - Average drinks/week
Alcohol use - Average days/year people drink much
Audiometry - Average condition of hearing (%)
Audiometry - People that can hear a whisper from across a quiet room (%)
Audiometry - People that can hear normal voice from across a quiet room (%)
Audiometry - Ears ringing, roaring, buzzing (%)
Audiometry - Had a job exposure to loud noise (%)
Audiometry - Had off-work exposure to loud noise (%)
Blood Pressure & Cholesterol - Has high blood pressure (%)
Blood Pressure & Cholesterol - Checking blood pressure at home (%)
Blood Pressure & Cholesterol - Frequently checking blood cholesterol (%)
Blood Pressure & Cholesterol - Has high cholesterol level (%)
Consumer Behavior - Money monthly spent on food at supermarket/grocery store
Consumer Behavior - Money monthly spent on food at other stores
Consumer Behavior - Money monthly spent on eating out
Consumer Behavior - Money monthly spent on carryout/delivered foods
Consumer Behavior - Income spent on food at supermarket/grocery store (%)
Consumer Behavior - Income spent on food at other stores (%)
Consumer Behavior - Income spent on eating out (%)
Consumer Behavior - Income spent on carryout/delivered foods (%)
Current Health Status - General health condition (%)
Current Health Status - Blood donors (%)
Current Health Status - Has blood ever tested for HIV virus (%)
Current Health Status - Left-handed people (%)
Dermatology - People using sunscreen (%)
Diabetes - Diabetics (%)
Diabetes - Had a blood test for high blood sugar (%)
Diabetes - People taking insulin (%)
Diet Behavior & Nutrition - Diet health (%)
Diet Behavior & Nutrition - Milk product consumption (# of products/month)
Diet Behavior & Nutrition - Meals not home prepared (#/week)
Diet Behavior & Nutrition - Meals from fast food or pizza place (#/week)
Diet Behavior & Nutrition - Ready-to-eat foods (#/month)
Diet Behavior & Nutrition - Frozen meals/pizza (#/month)
Drug Use - People that ever used marijuana or hashish (%)
Drug Use - Ever used hard drugs (%)
Drug Use - Ever used any form of cocaine (%)
Drug Use - Ever used heroin (%)
Drug Use - Ever used methamphetamine (%)
Health Insurance - People covered by health insurance (%)
Kidney Conditions-Urology - Avg. # of times urinating at night
Medical Conditions - People with asthma (%)
Medical Conditions - People with anemia (%)
Medical Conditions - People with psoriasis (%)
Medical Conditions - People with overweight (%)
Medical Conditions - Elderly people having difficulties in thinking or remembering (%)
Medical Conditions - People who ever received blood transfusion (%)
Medical Conditions - People having trouble seeing even with glass/contacts (%)
Medical Conditions - People with arthritis (%)
Medical Conditions - People with gout (%)
Medical Conditions - People with congestive heart failure (%)
Medical Conditions - People with coronary heart disease (%)
Medical Conditions - People with angina pectoris (%)
Medical Conditions - People who ever had heart attack (%)
Medical Conditions - People who ever had stroke (%)
Medical Conditions - People with emphysema (%)
Medical Conditions - People with thyroid problem (%)
Medical Conditions - People with chronic bronchitis (%)
Medical Conditions - People with any liver condition (%)
Medical Conditions - People who ever had cancer or malignancy (%)
Mental Health - People who have little interest in doing things (%)
Mental Health - People feeling down, depressed, or hopeless (%)
Mental Health - People who have trouble sleeping or sleeping too much (%)
Mental Health - People feeling tired or having little energy (%)
Mental Health - People with poor appetite or overeating (%)
Mental Health - People feeling bad about themself (%)
Mental Health - People who have trouble concentrating on things (%)
Mental Health - People moving or speaking slowly or too fast (%)
Mental Health - People having thoughts they would be better off dead (%)
Oral Health - Average years since last visit a dentist
Oral Health - People embarrassed because of mouth (%)
Oral Health - People with gum disease (%)
Oral Health - General health of teeth and gums (%)
Oral Health - Average days a week using dental floss/device
Oral Health - Average days a week using mouthwash for dental problem
Oral Health - Average number of teeth
Pesticide Use - Households using pesticides to control insects (%)
Pesticide Use - Households using pesticides to kill weeds (%)
Physical Activity - People doing vigorous-intensity work activities (%)
Physical Activity - People doing moderate-intensity work activities (%)
Physical Activity - People walking or bicycling (%)
Physical Activity - People doing vigorous-intensity recreational activities (%)
Physical Activity - People doing moderate-intensity recreational activities (%)
Physical Activity - Average hours a day doing sedentary activities
Physical Activity - Average hours a day watching TV or videos
Physical Activity - Average hours a day using computer
Physical Functioning - People having limitations keeping them from working (%)
Physical Functioning - People limited in amount of work they can do (%)
Physical Functioning - People that need special equipment to walk (%)
Physical Functioning - People experiencing confusion/memory problems (%)
Physical Functioning - People requiring special healthcare equipment (%)
Prescription Medications - Average number of prescription medicines taking
Preventive Aspirin Use - Adults 40+ taking low-dose aspirin (%)
Reproductive Health - Vaginal deliveries (%)
Reproductive Health - Cesarean deliveries (%)
Reproductive Health - Deliveries resulted in a live birth (%)
Reproductive Health - Pregnancies resulted in a delivery (%)
Reproductive Health - Women breastfeeding newborns (%)
Reproductive Health - Women that had a hysterectomy (%)
Reproductive Health - Women that had both ovaries removed (%)
Reproductive Health - Women that have ever taken birth control pills (%)
Reproductive Health - Women taking birth control pills (%)
Reproductive Health - Women that have ever used Depo-Provera or injectables (%)
Reproductive Health - Women that have ever used female hormones (%)
Sexual Behavior - People 18+ that ever had sex (vaginal, anal, or oral) (%)
Sexual Behavior - Males 18+ that ever had vaginal sex with a woman (%)
Sexual Behavior - Males 18+ that ever performed oral sex on a woman (%)
Sexual Behavior - Males 18+ that ever had anal sex with a woman (%)
Sexual Behavior - Males 18+ that ever had any sex with a man (%)
Sexual Behavior - Females 18+ that ever had vaginal sex with a man (%)
Sexual Behavior - Females 18+ that ever performed oral sex on a man (%)
Sexual Behavior - Females 18+ that ever had anal sex with a man (%)
Sexual Behavior - Females 18+ that ever had any kind of sex with a woman (%)
Sexual Behavior - Average age people first had sex
Sexual Behavior - Average number of female sex partners in lifetime (males 18+)
Sexual Behavior - Average number of female vaginal sex partners in lifetime (males 18+)
Sexual Behavior - Average age people first performed oral sex on a woman (18+)
Sexual Behavior - Average number of woman performed oral sex on in lifetime (18+)
Sexual Behavior - Average number of male sex partners in lifetime (males 18+)
Sexual Behavior - Average number of male anal sex partners in lifetime (males 18+)
Sexual Behavior - Average age people first performed oral sex on a man (18+)
Sexual Behavior - Average number of male oral sex partners in lifetime (18+)
Sexual Behavior - People using protection when performing oral sex (%)
Sexual Behavior - Average number of times people have vaginal or anal sex a year
Sexual Behavior - People having sex without condom (%)
Sexual Behavior - Average number of male sex partners in lifetime (females 18+)
Sexual Behavior - Average number of male vaginal sex partners in lifetime (females 18+)
Sexual Behavior - Average number of female sex partners in lifetime (females 18+)
Sexual Behavior - Circumcised males 18+ (%)
Sleep Disorders - Average hours sleeping at night
Sleep Disorders - People that has trouble sleeping (%)
Smoking-Cigarette Use - People smoking cigarettes (%)
Taste & Smell - People 40+ having problems with smell (%)
Taste & Smell - People 40+ having problems with taste (%)
Taste & Smell - People 40+ that ever had wisdom teeth removed (%)
Taste & Smell - People 40+ that ever had tonsils teeth removed (%)
Taste & Smell - People 40+ that ever had a loss of consciousness because of a head injury (%)
Taste & Smell - People 40+ that ever had a broken nose or other serious injury to face or skull (%)
Taste & Smell - People 40+ that ever had two or more sinus infections (%)
Weight - Average height (inches)
Weight - Average weight (pounds)
Weight - Average BMI
Weight - People that are obese (%)
Weight - People that ever were obese (%)
Weight - People trying to lose weight (%)
Officers per 1,000 residents here:
7.98New Jersey average:
5.53
Latest news from Seaside Park, NJ collected exclusively by city-data.com from local newspapers, TV, and radio stations
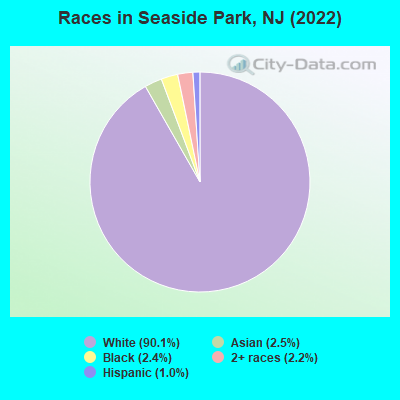
Ancestries: Irish (23.3%), Italian (22.0%), German (8.2%), Polish (6.0%), Israeli (4.2%), Portuguese (2.7%).
Current Local Time:
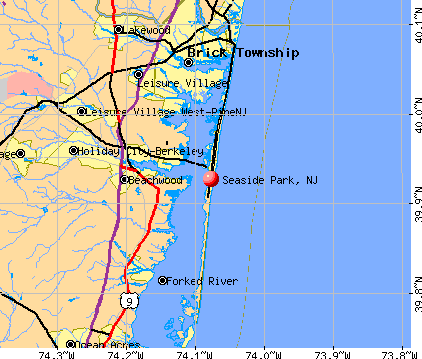
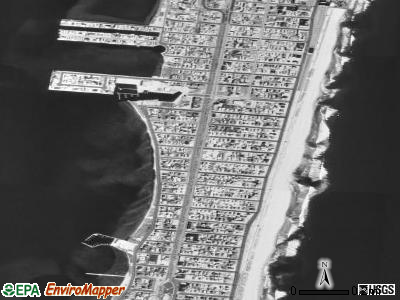
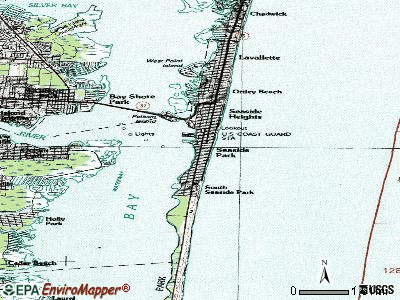
Land area: 0.65 square miles.
Population density: 2,266 people per square mile (low).
97 residents are foreign born (3.0% Europe , 1.5% Asia , 0.7% Latin America ).
This borough:
5.3%New Jersey:
23.2%
Median real estate property taxes paid for housing units with mortgages in 2022: $9,146 (1.0%)Median real estate property taxes paid for housing units with no mortgage in 2022: $9,653 (1.1%)
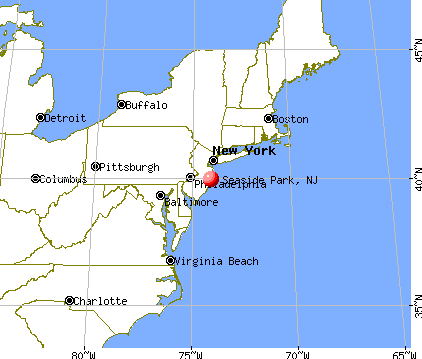
Nearest city with pop. 50,000+: Toms River, NJ
Nearest city with pop. 200,000+: Staten Island, NY
Nearest city with pop. 1,000,000+: Brooklyn, NY
Nearest cities:
Latitude: 39.93 N, Longitude: 74.08 W
Unemployment in December 2023: Population change in the 1990s: +402 (+21.6%).
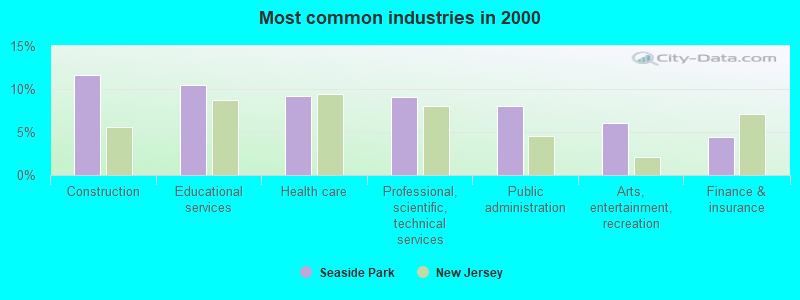
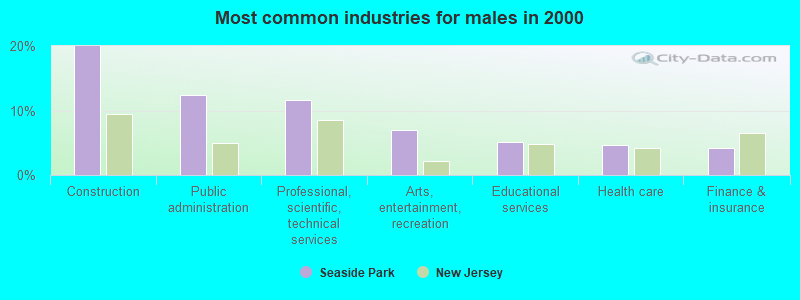
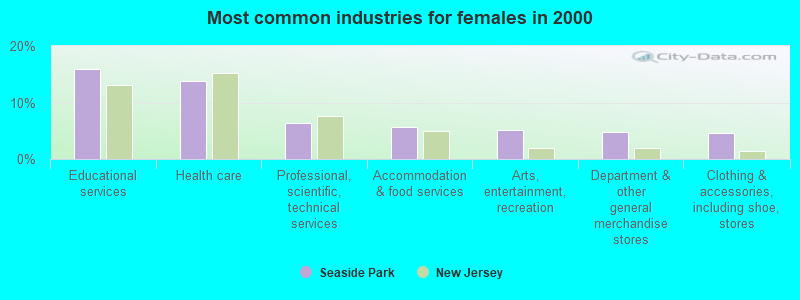
Most common industries in Seaside Park, NJ (%)
Both Males Females
Construction (11.6%)
Educational services (10.5%)
Health care (9.2%)
Professional, scientific, technical services (9.0%)
Public administration (8.0%)
Arts, entertainment, recreation (6.0%)
Finance & insurance (4.5%)
Construction (20.0%)
Public administration (12.4%)
Professional, scientific, technical services (11.7%)
Arts, entertainment, recreation (7.0%)
Educational services (5.2%)
Health care (4.6%)
Finance & insurance (4.3%)
Educational services (15.9%)
Health care (13.8%)
Professional, scientific, technical services (6.4%)
Accommodation & food services (5.6%)
Arts, entertainment, recreation (5.0%)
Department & other general merchandise stores (4.9%)
Clothing & accessories, including shoe, stores (4.7%)
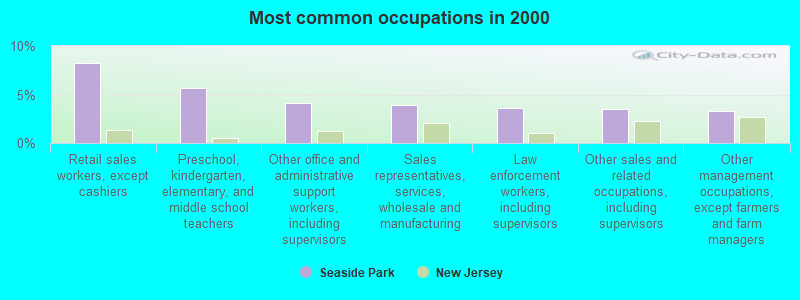
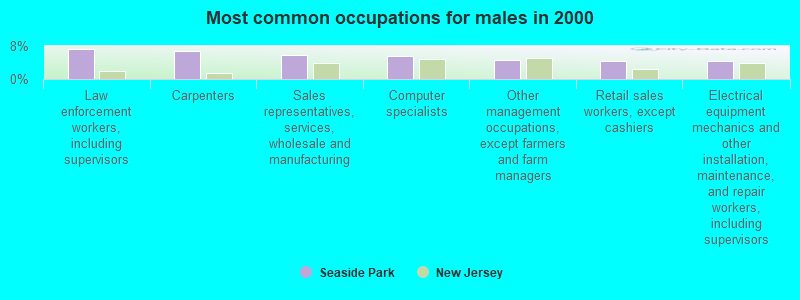
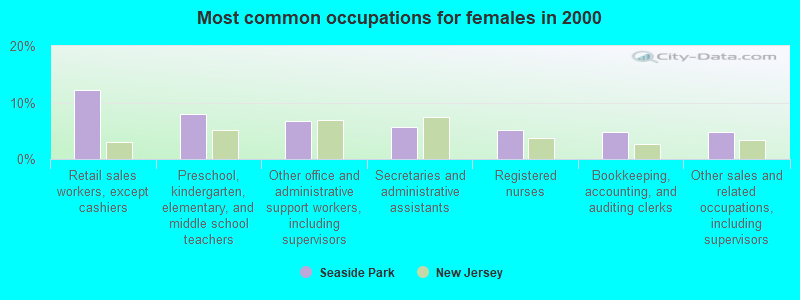
Most common occupations in Seaside Park, NJ (%)
Both Males Females
Retail sales workers, except cashiers (8.3%)
Preschool, kindergarten, elementary, and middle school teachers (5.7%)
Other office and administrative support workers, including supervisors (4.1%)
Sales representatives, services, wholesale and manufacturing (3.9%)
Law enforcement workers, including supervisors (3.6%)
Other sales and related occupations, including supervisors (3.5%)
Other management occupations, except farmers and farm managers (3.3%)
Law enforcement workers, including supervisors (7.2%)
Carpenters (6.7%)
Sales representatives, services, wholesale and manufacturing (5.9%)
Computer specialists (5.6%)
Other management occupations, except farmers and farm managers (4.6%)
Retail sales workers, except cashiers (4.4%)
Electrical equipment mechanics and other installation, maintenance, and repair workers, including supervisors (4.3%)
Retail sales workers, except cashiers (12.1%)
Preschool, kindergarten, elementary, and middle school teachers (8.0%)
Other office and administrative support workers, including supervisors (6.7%)
Secretaries and administrative assistants (5.6%)
Registered nurses (5.0%)
Bookkeeping, accounting, and auditing clerks (4.9%)
Other sales and related occupations, including supervisors (4.9%)
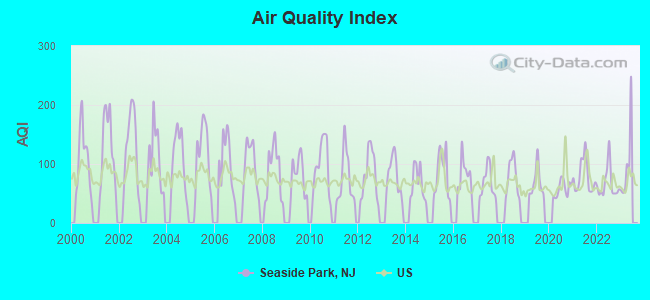
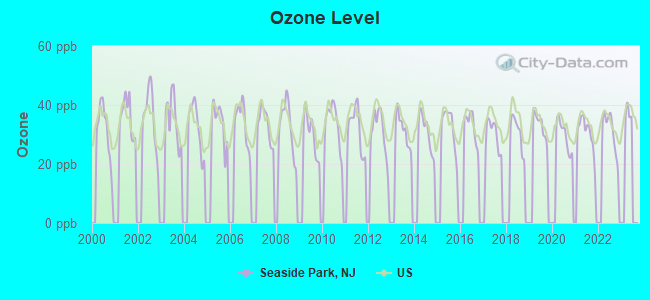
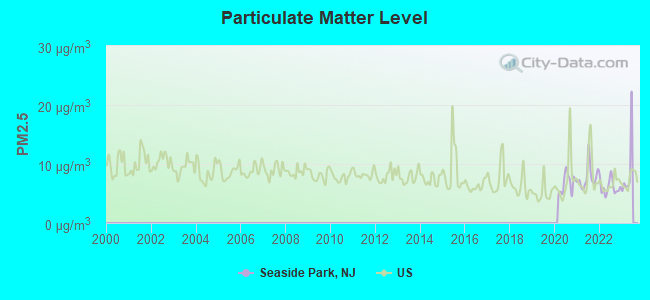
Air pollution and air quality trends(lower is better)
AQI Ozone PM2.5
Tornado activity:
Seaside Park-area historical tornado activity is below New Jersey state average. It is 57% smaller than the overall U.S. average.
On 7/21/1983, a category F3 (max. wind speeds 158-206 mph) tornado 20.8 miles away from the Seaside Park borough center caused between $500,000 and $5,000,000 in damages.
On 6/29/1982, a category F2 (max. wind speeds 113-157 mph) tornado 9.7 miles away from the borough center caused between $500,000 and $5,000,000 in damages.
Earthquake activity:
Seaside Park-area historical earthquake activity is significantly above New Jersey state average. It is 70% smaller than the overall U.S. average. On 8/23/2011 at 17:51:04, a magnitude 5.8 (5.8 MW, Depth: 3.7 mi, Class: Moderate, Intensity: VI - VII) earthquake occurred 250.1 miles away from Seaside Park center On 1/16/1994 at 01:49:16, a magnitude 4.6 (4.6 MB, 4.6 LG, Depth: 3.1 mi, Class: Light, Intensity: IV - V) earthquake occurred 107.3 miles away from the city center On 10/7/1983 at 10:18:46, a magnitude 5.3 (5.1 MB, 5.3 LG, 5.1 ML) earthquake occurred 278.8 miles away from Seaside Park center On 8/22/1992 at 12:20:32, a magnitude 4.8 (4.8 MB, 3.8 MS, 4.7 LG, Depth: 6.2 mi) earthquake occurred 208.4 miles away from the city center On 1/16/1994 at 00:42:43, a magnitude 4.2 (4.2 MB, 4.0 LG, Depth: 3.1 mi) earthquake occurred 105.7 miles away from the city center On 4/20/2002 at 10:50:47, a magnitude 5.3 (5.3 ML, Depth: 3.0 mi) earthquake occurred 317.7 miles away from the city center Magnitude types: regional Lg-wave magnitude (LG), body-wave magnitude (MB), local magnitude (ML), surface-wave magnitude (MS), moment magnitude (MW) Natural disasters: The number of natural disasters in Ocean County (27) is a lot greater than the US average (15).Major Disasters (Presidential) Declared: 16Emergencies Declared: 9Storms: 7, Floods: 6, Hurricanes: 6, Snowstorms: 4, Blizzards: 2, Fires: 2, Heavy Rains: 2, Water Shortages: 2, Winter Storms: 2, Tropical Depression: 1, Wind: 1, Other: 3 (Note: some incidents may be assigned to more than one category). Hospitals and medical centers near Seaside Park: TALLWOODS CARE CENTER (Nursing Home, about 5 miles away; BAYVILLE, NJ)
CRYSTAL LAKE HLTHCARE AND REHAB (Nursing Home, about 7 miles away; BAYVILLE, NJ)
HOLISTICARE HOSPICE LLC (Hospital, about 7 miles away; TOMS RIVER, NJ)
BEY LEA VILLAGE (Nursing Home, about 8 miles away; TOMS RIVER, NJ)
BEY LEA VILLAGE NURSING AND REHABILITATION CENTER (Nursing Home, about 8 miles away; TOMS RIVER, NJ)
GARDEN STATE REHABILITATION HOSP (Hospital, about 8 miles away; TOMS RIVER, NJ)
HEALTHSOUTH REHAB HOSPITAL OF TOMS RIVER (Nursing Home, about 8 miles away; TOMS RIVER, NJ)
Operable nuclear power plant near Seaside Park:
9 miles: Oyster Creek in Forked River, NJ.
Colleges/universities with over 2000 students nearest to Seaside Park:
Ocean County College (about 8 miles; Toms River, NJ ; Full-time enrollment: 7,471)
Beth Medrash Govoha (about 14 miles; Lakewood, NJ ; FT enrollment: 6,700)
Monmouth University (about 25 miles; West Long Branch, NJ ; FT enrollment: 5,986)
Brookdale Community College (about 28 miles; Lincroft, NJ ; FT enrollment: 10,879)
Burlington County College (about 31 miles; Pemberton, NJ ; FT enrollment: 7,928)
Mercer County Community College (about 38 miles; West Windsor, NJ ; FT enrollment: 5,728)
The Richard Stockton College of New Jersey (about 39 miles; Galloway, NJ ; FT enrollment: 8,360)
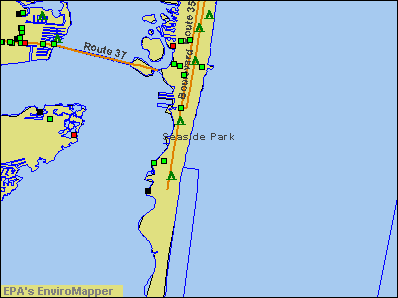
Notable locations in Seaside Park: (A) , Seaside Park Volunteer Fire Department (B) . Display/hide their locations on the map
Churches in Seaside Park include: (A) , Union Church of Seaside Park (B) . Display/hide their locations on the map
Tourist attractions:
Hotels:
Birthplace of: Gary Michael Cappetta - Schoolteacher, Lawrence Dentico - Mobster.
Ocean County has a predicted average indoor radon screening level less than 2 pCi/L (pico curies per liter) - Low Potential Drinking water stations with addresses in Seaside Park and their reported violations in the past:
SEASIDE PARK WATER DEPT (Population served: 15,000, Groundwater):
Past health violations:
MCL, Monthly (TCR) - In AUG-2009, Contaminant: Coliform. Follow-up actions: St Public Notif received (SEP-01-2009), St Public Notif requested (SEP-04-2009), St Formal NOV issued (SEP-04-2009), St Compliance achieved (SEP-08-2009)
Past monitoring violations:
25 regular monitoring violations
Population served: 64, Groundwater):
Past health violations:
MCL, Monthly (TCR) - In NOV-2008, Contaminant: Coliform. Follow-up actions: St Compliance achieved (DEC-09-2008), St Public Notif requested (JAN-03-2009), St Formal NOV issued (JAN-03-2009)
Past monitoring violations:
Follow-up Or Routine LCR Tap M/R - In JAN-01-2006, Contaminant: Lead and Copper Rule. Follow-up actions: St Compliance achieved (AUG-28-2006)
4 routine major monitoring violations
4 minor monitoring violations
2 regular monitoring violations
Average household size: This borough:
1.9 peopleNew Jersey:
2.7 people
Percentage of family households: This borough:
48.6%Whole state:
69.3%
Percentage of households with unmarried partners: This borough:
5.4%Whole state:
5.9%
Likely homosexual households (counted as self-reported same-sex unmarried-partner households)
Lesbian couples: 0.5% of all households Gay men: 0.6% of all households
Banks with branches in Seaside Park (2011 data):
Wells Fargo Bank, National Association: Seaside Park Branch at 1000 Ne Central Avenue, branch established on 1972/05/06. Info updated 2011/04/05: Bank assets: $1,161,490.0 mil, Deposits: $905,653.0 mil, headquarters in Sioux Falls, SD, positive income , 6395 total offices , Holding Company: Wells Fargo & Company
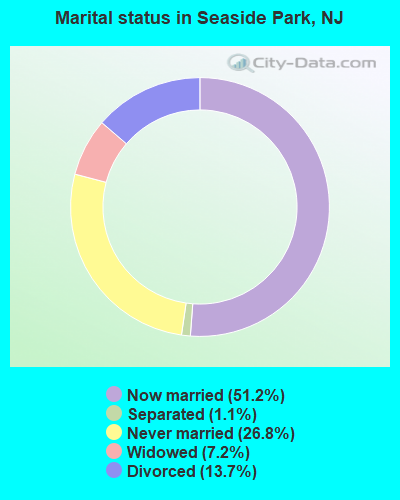
For population 15 years and over in Seaside Park:
Never married: 26.8%Now married: 51.2%Separated: 1.1%Widowed: 7.2%Divorced: 13.7% For population 25 years and over in Seaside Park:
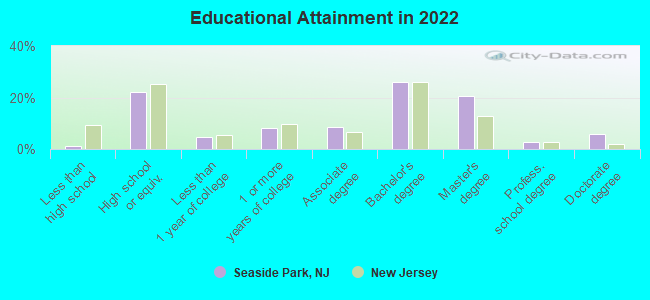
High school or higher: 98.4%Bachelor's degree or higher: 53.2%Graduate or professional degree: 26.8%Unemployed: 5.7%Mean travel time to work (commute): 25.7 minutes
Education Gini index (Inequality in education) Here:
10.3New Jersey average:
12.8
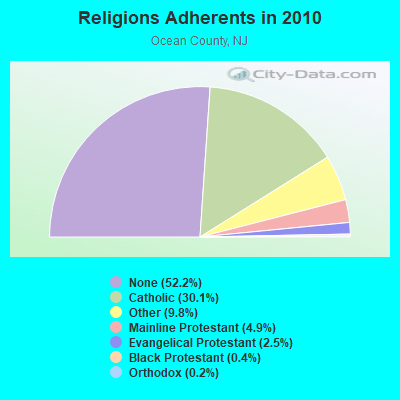
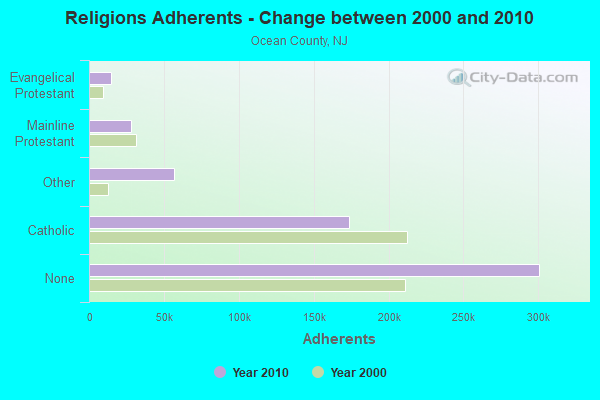
Religion statistics for Seaside Park, NJ (based on Ocean County data)
Religion Adherents Congregations Catholic 173,318 26 Other 56,416 108 Mainline Protestant 28,029 74 Evangelical Protestant 14,510 79 Black Protestant 2,303 11 Orthodox 1,280 4 None 300,711 -
Source: Clifford Grammich, Kirk Hadaway, Richard Houseal, Dale E.Jones, Alexei Krindatch, Richie Stanley and Richard H.Taylor. 2012. 2010 U.S.Religion Census: Religious Congregations & Membership Study. Association of Statisticians of American Religious Bodies. Jones, Dale E., et al. 2002. Congregations and Membership in the United States 2000. Nashville, TN: Glenmary Research Center. Graphs represent county-level data
Food Environment Statistics: Number of grocery stores : 90Here :
1.59 / 10,000 pop.State :
2.90 / 10,000 pop.
Number of supercenters and club stores : 2Here :
0.04 / 10,000 pop.New Jersey :
0.06 / 10,000 pop.
Number of convenience stores (no gas) : 110Ocean County :
1.95 / 10,000 pop.State :
1.76 / 10,000 pop.
Number of convenience stores (with gas) : 49Ocean County :
0.87 / 10,000 pop.State :
0.81 / 10,000 pop.
Number of full-service restaurants : 359Ocean County :
6.36 / 10,000 pop.New Jersey :
7.15 / 10,000 pop.
Adult diabetes rate : This county :
9.2%New Jersey :
8.3%
Adult obesity rate : This county :
26.4%State :
23.3%
Low-income preschool obesity rate : Ocean County :
13.2%New Jersey :
18.0%
Health and Nutrition: Healthy diet rate : Seaside Park:
46.3%State:
50.6%
Average overall health of teeth and gums : This city:
53.4%New Jersey:
48.5%
Average BMI : Seaside Park:
28.3New Jersey:
28.5
People feeling badly about themselves : Here:
16.2%New Jersey:
20.0%
People not drinking alcohol at all : This city:
9.1%New Jersey:
11.1%
Average hours sleeping at night : Seaside Park:
6.8New Jersey:
6.8
Overweight people : This city:
35.3%State:
33.6%
General health condition : This city:
59.4%New Jersey:
56.9%
Average condition of hearing : Seaside Park:
84.5%State:
80.0%
More about Health and Nutrition of Seaside Park, NJ Residents
Local government employment and payroll (March 2022)
Function
Full-time employees
Monthly full-time payroll
Average yearly full-time wage
Part-time employees
Monthly part-time payroll
Police Protection - Officers
13 $125,161 $115,533 6 $20,296 Streets and Highways
11 $65,056 $70,970 2 $1,843 Judicial and Legal
2 $7,371 $44,226 0 $0 Financial Administration
2 $13,115 $78,690 0 $0 Water Supply
2 $20,808 $124,848 0 $0 Solid Waste Management
2 $4,750 $28,500 0 $0 Parks and Recreation
1 $5,110 $61,320 1 $2,044 Other and Unallocable
0 $0 7 $13,225 Other Government Administration
0 $0 7 $4,163
Totals for Government
33 $241,371 $87,771 23 $41,571
Seaside Park government finances - Expenditure in 2017 (per resident):
Assistance and Subsidies - Public Welfare, Federal Categorical Assistance Programs: $1,000 ($0.68)
Current Operations - Local Fire Protection: $5,685,000 ($3859.47)
Police Protection: $2,218,000 ($1505.77)Central Staff Services: $354,000 ($240.33)Judicial and Legal Services: $235,000 ($159.54)Financial Administration: $199,000 ($135.10)General Public Buildings: $139,000 ($94.37)Solid Waste Management: $112,000 ($76.04)General - Other: $70,000 ($47.52)Health - Other: $25,000 ($16.97)Parks and Recreation: $21,000 ($14.26)General - Interest on Debt: $75,000 ($50.92)
Intergovernmental to Local - Other - Police Protection: $12,777,000 ($8674.13)
Other - Financial Administration: $5,865,000 ($3981.67)Other - Transit Utilities: $5,000 ($3.39)Other - Public Welfare - Other: $4,000 ($2.72)Total Salaries and Wages: $261,000 ($177.19)
Seaside Park government finances - Revenue in 2017 (per resident):
Revenue - Water Utilities: $2,536,000 ($1721.66)
State Intergovernmental - Other: $8,873,000 ($6023.76)
Highways: $275,000 ($186.69)Sewerage: $50,000 ($33.94)Tax - Property: $14,703,000 ($9981.67)
Seaside Park government finances - Debt in 2017 (per resident):
Long Term Debt - Outstanding Unspecified Public Purpose: $2,750,000 ($1866.94)
Beginning Outstanding - Unspecified Public Purpose: $1,884,000 ($1279.02)Issue, Unspecified Public Purpose: $1,335,000 ($906.31)Retired Unspecified Public Purpose: $470,000 ($319.08)Short Term Debt Outstanding - Beginning: $3,361,000 ($2281.74)
Seaside Park government finances - Cash and Securities in 2017 (per resident):
Bond Funds - Cash and Securities: $865,000 ($587.24)
6.12% of this county's 2021 resident taxpayers lived in other counties in 2020 ($95,565 average adjusted gross income )
Here:
6.12%New Jersey average:
6.70%
0.01% of residents moved from foreign countries ($88 average AGI )Ocean County:
0.01%New Jersey average:
0.01%
Top counties from which taxpayers relocated into this county between 2020 and 2021:
5.03% of this county's 2020 resident taxpayers moved to other counties in 2021 ($85,282 average adjusted gross income )
Here:
5.03%New Jersey average:
7.02%
0.01% of residents moved to foreign countries ($90 average AGI )Ocean County:
0.01%New Jersey average:
0.02%
Top counties to which taxpayers relocated from this county between 2020 and 2021: Businesses in Seaside Park, NJ
Strongest AM radio stations in Seaside Park:
WOBM (1160 AM; 9 kW; LAKEWOOD TOWNSHIP, NJ; Owner: NORTH SHORE BROADCASTING CORP.)
WMCA (570 AM; 50 kW; NEW YORK, NY; Owner: SALEM MEDIA OF NEW YORK, LLC)
WOR (710 AM; 50 kW; NEW YORK, NY; Owner: BUCKLEY BROADCASTING CORPORATION)
WPHT (1210 AM; 50 kW; PHILADELPHIA, PA; Owner: INFINITY BROADCASTING OPERATIONS, INC.)
WFAN (660 AM; 50 kW; NEW YORK, NY; Owner: INFINITY BROADCASTING OPERATIONS, INC.)
WWJZ (640 AM; 50 kW; MOUNT HOLLY, NJ; Owner: ABC, INC.)
WABC (770 AM; 50 kW; NEW YORK, NY; Owner: WABC-AM RADIO, INC.)
WINS (1010 AM; 50 kW; NEW YORK, NY; Owner: INFINITY BROADCASTING OPERATIONS, INC.)
WVCH (740 AM; 50 kW; CHESTER, PA; Owner: WVCH COMMUNICATIONS, INC.)
WPEN (950 AM; 50 kW; PHILADELPHIA, PA; Owner: GREATER PHILADELPHIA RADIO, INC.)
WEPN (1050 AM; 50 kW; NEW YORK, NY; Owner: NEW YORK AM RADIO, LLC)
WCBS (880 AM; 50 kW; NEW YORK, NY; Owner: INFINITY BROADCASTING OPERATIONS, INC.)
WZZD (990 AM; 50 kW; PHILADELPHIA, PA; Owner: PENNSYLVANIA MEDIA ASSOCIATES, INC.)
Strongest FM radio stations in Seaside Park:
WOBM-FM (92.7 FM; TOMS RIVER, NJ; Owner: SEASHORE BROADCASTING CORP.)
WWNJ (91.1 FM; DOVER TOWNSHIP, NJ; Owner: MERCER COUNTY COMMUNITY COLLEGE)
WJRZ-FM (100.1 FM; MANAHAWKIN, NJ; Owner: JERSEY SHORE BROADCASTING CORPORATION)
W264AM (100.7 FM; TOMS RIVER, NJ; Owner: JERSEY SHORE BROADCASTING CORPORATION)
WBBO (98.5 FM; OCEAN ACRES, NJ; Owner: MILLENNIUM SHORE LICENSE HOLDCO, LLC)
WCHR-FM (105.7 FM; MANAHAWKIN, NJ; Owner: NASSAU BROADCASTING II, L.L.C.)
WNJM (89.9 FM; MANAHAWKIN, NJ; Owner: NEW JERSEY PUBLIC BROADCASTING AUTH.)
WJLK-FM (94.3 FM; ASBURY PARK, NJ; Owner: MILLENNIUM SHORE LICENSE HOLDCO, LLC)
WHTG-FM (106.3 FM; EATONTOWN, NJ; Owner: PRESS COMMUNICATIONS, LLC)
WRAT (95.9 FM; POINT PLEASANT, NJ; Owner: THE SENTINEL PUBLISHING CO.)
W300AO (107.9 FM; MANAHAWKIN, NJ; Owner: JERSEY SHORE BROADCASTING CORPORATION)
WKXW-FM (101.5 FM; TRENTON, NJ; Owner: MILLENNIUM CENTRAL NEW JERSEY LICENSE HOLDCO, LLC)
WYRS (90.7 FM; MANAHAWKIN, NJ; Owner: PENN JERSEY EDUCATIONAL RADIO CORP.)
TV broadcast stations around Seaside Park:
WWSI (Channel 62; ATLANTIC CITY, NJ; Owner: HISPANIC BROADCASTERS OF PHILADELPHIA, L.L.C.)
WNYW (Channel 5; NEW YORK, NY; Owner: FOX TELEVISION STATIONS, INC.)
WCBS-TV (Channel 2; NEW YORK, NY; Owner: CBS BROADCASTING INC.)
WABC-TV (Channel 7; NEW YORK, NY; Owner: AMERICAN BROADCASTING COMPANIES, INC)
WPIX (Channel 11; NEW YORK, NY; Owner: WPIX, INC.)
WWOR-TV (Channel 9; SECAUCUS, NJ; Owner: FOX TELEVISION STATIONS, INC.)
WUVP (Channel 65; VINELAND, NJ; Owner: UNIVISION PHILADELPHIA LLC)
WPXN-TV (Channel 31; NEW YORK, NY; Owner: PAXSON COMMUNICATIONS LICENSE COMPANY, LLC)
WNBC (Channel 4; NEW YORK, NY; Owner: NATIONAL BROADCASTING COMPANY, INC.)
WNET (Channel 13; NEWARK, NJ; Owner: EDUCATIONAL BROADCASTING CORPORATION)
WXTV (Channel 41; PATERSON, NJ; Owner: WXTV LICENSE PARTNERSHIP, G.P.)
WNJT (Channel 52; TRENTON, NJ; Owner: NEW JERSEY PUBLIC BROADCASTING AUTHORITY)
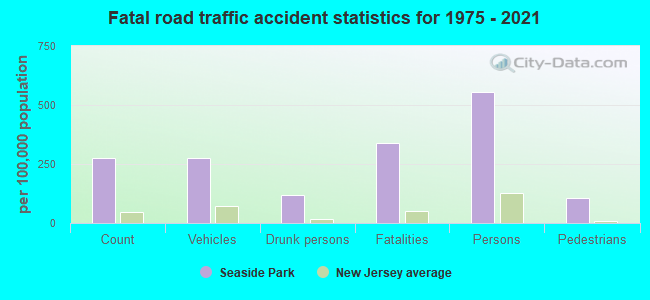
Seaside Park fatal accident statistics for 1975 - 2021
Seaside Park fatal accident list:
Mar 17, 2010 00:01 AM, J Street, Lat: 39.930444, Lon: -74.078111, Vehicles: 1, Persons: 2, Fatalities: 2, Drunk persons involved: 1Vehicles: 1, Persons: 2, Pedestrians: 1, Fatalities: 1Vehicles: 1, Persons: 2, Pedestrians: 1, Fatalities: 1Vehicles: 1, Persons: 2, Fatalities: 1Vehicles: 1, Persons: 2, Fatalities: 1, Drunk persons involved: 1
FCC Registered Cell Phone Towers: 1
1214 Barnegat Avenue (77415) (Lat: 39.914528 Lon: -74.081889), Type: Tank, Structure height: 36.6 m, Call Sign: KNKN836Assigned Frequencies: 869.040 MHz, 869.040 MHz, 869.040 MHz, 824.040 MHz, 824.040 MHz, 824.040 MHz, 890.010 MHz, 890.010 MHz, 890.010 MHz, 845.010 MHz, 845.010 MHz, 845.010 MHzGrant Date: 09/01/2020, Expiration Date: 10/01/2030, Certifier: David C JatlowRegistrant: At&t Services, Inc., 208 S Akard St, 20f, Dallas, TX 75202, Phone: (855) 699-7073, Fax: (214) 746-6410, Email:
FCC Registered Broadcast Land Mobile Towers: 6
Sixth Ave And W Central Ave (Lat: 39.924000 Lon: -74.074028), Call Sign: KBS321, Licensee ID: L00051214, Assigned Frequencies: 33.7800 MHz, Grant Date: 11/11/2011, Expiration Date: 01/14/2022, Cancellation Date: 03/19/2022, Registrant: Seaside Park, Borough Of, Seaside Park, NJ 08752, Phone: (908) 793-8000 Island Beach State Park (Lat: 39.886778 Lon: -74.460139), Call Sign: KEH925, Assigned Frequencies: 159.375 MHz, 159.465 MHz, Grant Date: 08/10/2021, Expiration Date: 09/03/2031, Registrant: Nj Forest Fire Service, 209 Hillhurst Avenue, Trenton, NJ 08619-2435, Phone: (160) 958-7784, Fax: (609) 984-0378, Email:
6th And W Central Ave (Lat: 39.924000 Lon: -74.074028), Call Sign: KEA463, Licensee ID: L00051214, Assigned Frequencies: 37.1800 MHz, Grant Date: 11/11/2011, Expiration Date: 01/14/2022, Cancellation Date: 03/19/2022, Registrant: Seaside Park, Borough Of, Seaside Park, NJ 08752, Phone: (908) 793-8000 Seaside Park Police Dept 6th & Sw Central (Lat: 39.918722 Lon: -74.076806), Call Sign: KNHE211, Licensee ID: L00016788, Assigned Frequencies: 39.7600 MHz, 39.9200 MHz, Grant Date: 06/04/2013, Expiration Date: 08/09/2023, Cancellation Date: 01/26/2023, Registrant: State Of New Jersey, Box 7068, West Trenton, NJ 08625, Phone: (201) 793-8000, Email:
6th & Central Aves (Lat: 39.924000 Lon: -74.074028), Structure height: 9 m, Call Sign: WPDB680, Licensee ID: L00051214, Assigned Frequencies: 155.205 MHz, 155.280 MHz, Grant Date: 06/09/1998, Expiration Date: 09/02/2003, Cancellation Date: 11/02/2003, Registrant: Seaside Park, Boro Of, Seaside Park, NJ 08752, Phone: (908) 793-8000 1400 North Ocean Avenue (Lat: 39.932500 Lon: -74.072611), Type: Mtower, Structure height: 0 m, Overall height: 7 m, Call Sign: WRPE541, Assigned Frequencies: 13.5000 MHz, Grant Date: 01/25/2022, Expiration Date: 01/25/2032, Certifier: Hugh Roarty, Registrant: Rutgers, The State University Of New Jersey, 71 Dudley Road, New Brunswick, NJ 08901, Phone: (908) 208-2970, Email:
FCC Registered Amateur Radio Licenses: 8 (
See the full list of FCC Registered Amateur Radio Licenses in Seaside Park )
FAA Registered Aircraft: 1
Aircraft: JAKEL HELMUT RV-9A (Category: Land, Seats: 2, Weight: Up to 12,499 Pounds), Engine: LYCOMING O-320 (150 HP) (Reciprocating)N-Number: 130KW, N130KW, N-130KW, Serial Number: 90301, Year manufactured: 2014, Airworthiness Date: 11/29/2014, Certificate Issue Date: 01/14/2014Registrant (Individual): Hugh Waller, 106 F St, Seaside Park, NJ 08752
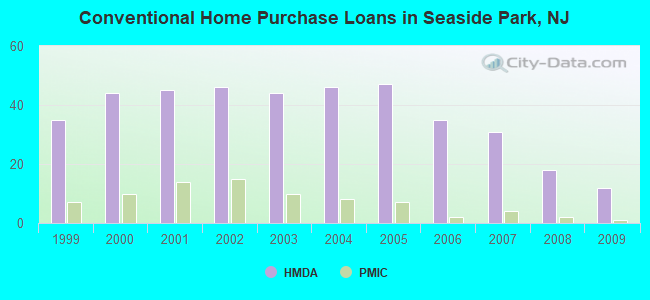
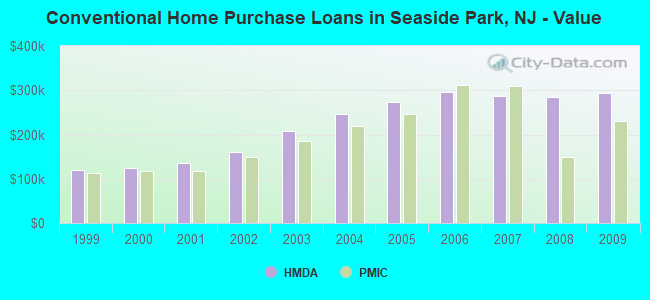
Home Mortgage Disclosure Act Aggregated Statistics For Year 2009(Based on 1 partial tract) A) FHA, FSA/RHS & VA B) Conventional C) Refinancings D) Home Improvement Loans F) Non-occupant Loans on Number Average Value Number Average Value Number Average Value Number Average Value Number Average Value
LOANS ORIGINATED 1 $267,940 12 $293,390 40 $298,096 1 $218,270 35 $313,220 APPLICATIONS APPROVED, NOT ACCEPTED 0 $0 2 $266,505 3 $241,923 0 $0 3 $281,690 APPLICATIONS DENIED 1 $377,650 3 $264,427 16 $260,129 2 $106,065 10 $278,474 APPLICATIONS WITHDRAWN 0 $0 3 $269,733 5 $311,292 0 $0 4 $289,138 FILES CLOSED FOR INCOMPLETENESS 0 $0 1 $211,750 1 $208,100 0 $0 1 $194,290
Aggregated Statistics For Year 2008(Based on 1 partial tract) A) FHA, FSA/RHS & VA B) Conventional C) Refinancings D) Home Improvement Loans E) Loans on Dwellings For 5+ Families F) Non-occupant Loans on Number Average Value Number Average Value Number Average Value Number Average Value Number Average Value Number Average Value
LOANS ORIGINATED 1 $184,510 18 $284,034 26 $267,627 2 $159,960 1 $249,920 28 $294,022 APPLICATIONS APPROVED, NOT ACCEPTED 0 $0 3 $220,123 4 $228,672 0 $0 0 $0 6 $258,450 APPLICATIONS DENIED 0 $0 3 $351,057 17 $272,243 2 $75,665 0 $0 10 $263,802 APPLICATIONS WITHDRAWN 0 $0 2 $227,285 7 $246,874 1 $115,460 0 $0 4 $220,665 FILES CLOSED FOR INCOMPLETENESS 0 $0 1 $215,780 2 $346,105 0 $0 0 $0 2 $208,105
Aggregated Statistics For Year 2007(Based on 1 partial tract) B) Conventional C) Refinancings D) Home Improvement Loans E) Loans on Dwellings For 5+ Families F) Non-occupant Loans on Number Average Value Number Average Value Number Average Value Number Average Value Number Average Value
LOANS ORIGINATED 31 $287,941 33 $287,741 3 $197,490 1 $490,820 40 $279,966 APPLICATIONS APPROVED, NOT ACCEPTED 4 $233,420 7 $281,727 1 $221,530 0 $0 6 $311,995 APPLICATIONS DENIED 8 $344,569 16 $311,159 2 $160,055 0 $0 15 $342,798 APPLICATIONS WITHDRAWN 2 $267,560 9 $318,814 1 $150,750 0 $0 6 $280,060 FILES CLOSED FOR INCOMPLETENESS 3 $352,847 3 $309,567 0 $0 0 $0 2 $398,275
Aggregated Statistics For Year 2006(Based on 1 partial tract) B) Conventional C) Refinancings D) Home Improvement Loans F) Non-occupant Loans on Number Average Value Number Average Value Number Average Value Number Average Value
LOANS ORIGINATED 35 $296,479 47 $288,561 6 $112,267 50 $303,155 APPLICATIONS APPROVED, NOT ACCEPTED 4 $291,440 5 $254,212 1 $109,330 4 $354,495 APPLICATIONS DENIED 10 $288,275 21 $259,524 3 $96,283 12 $268,983 APPLICATIONS WITHDRAWN 7 $293,070 11 $244,806 1 $131,380 8 $256,509 FILES CLOSED FOR INCOMPLETENESS 1 $221,910 4 $326,635 0 $0 2 $256,245
Aggregated Statistics For Year 2005(Based on 1 partial tract) B) Conventional C) Refinancings D) Home Improvement Loans E) Loans on Dwellings For 5+ Families F) Non-occupant Loans on Number Average Value Number Average Value Number Average Value Number Average Value Number Average Value
LOANS ORIGINATED 47 $273,344 47 $254,939 5 $124,786 1 $727,500 55 $274,978 APPLICATIONS APPROVED, NOT ACCEPTED 8 $290,265 8 $264,804 1 $57,540 0 $0 10 $256,974 APPLICATIONS DENIED 9 $246,826 14 $240,901 2 $103,765 0 $0 11 $252,113 APPLICATIONS WITHDRAWN 5 $342,670 13 $253,146 1 $281,180 0 $0 7 $301,811 FILES CLOSED FOR INCOMPLETENESS 0 $0 2 $387,245 0 $0 0 $0 2 $219,900
Aggregated Statistics For Year 2004(Based on 1 partial tract) A) FHA, FSA/RHS & VA B) Conventional C) Refinancings D) Home Improvement Loans E) Loans on Dwellings For 5+ Families F) Non-occupant Loans on Number Average Value Number Average Value Number Average Value Number Average Value Number Average Value Number Average Value
LOANS ORIGINATED 1 $170,510 46 $245,992 42 $211,112 4 $156,030 1 $399,710 56 $227,194 APPLICATIONS APPROVED, NOT ACCEPTED 0 $0 6 $224,182 8 $185,062 1 $193,530 0 $0 7 $236,571 APPLICATIONS DENIED 0 $0 10 $252,888 14 $217,570 4 $128,792 0 $0 14 $219,269 APPLICATIONS WITHDRAWN 0 $0 5 $298,518 10 $196,806 0 $0 0 $0 6 $235,243 FILES CLOSED FOR INCOMPLETENESS 0 $0 1 $252,220 2 $160,535 1 $110,090 0 $0 2 $139,630
Aggregated Statistics For Year 2003(Based on 1 partial tract) A) FHA, FSA/RHS & VA B) Conventional C) Refinancings D) Home Improvement Loans E) Loans on Dwellings For 5+ Families F) Non-occupant Loans on Number Average Value Number Average Value Number Average Value Number Average Value Number Average Value Number Average Value
LOANS ORIGINATED 1 $171,090 44 $207,833 101 $169,813 4 $69,622 1 $321,460 78 $187,081 APPLICATIONS APPROVED, NOT ACCEPTED 0 $0 4 $202,638 14 $180,881 1 $73,840 0 $0 7 $193,197 APPLICATIONS DENIED 0 $0 7 $173,470 19 $165,069 2 $45,455 0 $0 11 $190,597 APPLICATIONS WITHDRAWN 0 $0 6 $189,467 14 $140,452 1 $35,290 0 $0 7 $186,183 FILES CLOSED FOR INCOMPLETENESS 0 $0 1 $100,310 3 $124,733 1 $67,320 0 $0 1 $150,750
Aggregated Statistics For Year 2002(Based on 1 partial tract) A) FHA, FSA/RHS & VA B) Conventional C) Refinancings D) Home Improvement Loans E) Loans on Dwellings For 5+ Families F) Non-occupant Loans on Number Average Value Number Average Value Number Average Value Number Average Value Number Average Value Number Average Value
LOANS ORIGINATED 2 $124,960 46 $160,974 63 $218,673 3 $67,513 1 $343,130 56 $225,502 APPLICATIONS APPROVED, NOT ACCEPTED 0 $0 6 $178,407 8 $144,594 1 $34,910 0 $0 7 $169,797 APPLICATIONS DENIED 0 $0 8 $160,178 16 $129,429 3 $44,753 0 $0 9 $151,053 APPLICATIONS WITHDRAWN 0 $0 5 $171,700 8 $480,051 0 $0 0 $0 3 $199,537 FILES CLOSED FOR INCOMPLETENESS 0 $0 2 $172,525 3 $141,740 0 $0 0 $0 2 $124,860
Aggregated Statistics For Year 2001(Based on 1 partial tract) A) FHA, FSA/RHS & VA B) Conventional C) Refinancings D) Home Improvement Loans F) Non-occupant Loans on Number Average Value Number Average Value Number Average Value Number Average Value Number Average Value
LOANS ORIGINATED 2 $111,820 45 $135,577 36 $142,848 1 $49,870 40 $139,256 APPLICATIONS APPROVED, NOT ACCEPTED 0 $0 4 $121,122 8 $116,039 2 $23,880 4 $106,928 APPLICATIONS DENIED 1 $49,870 5 $118,610 13 $138,524 3 $39,703 6 $97,882 APPLICATIONS WITHDRAWN 0 $0 3 $140,847 7 $124,396 1 $42,770 2 $172,430 FILES CLOSED FOR INCOMPLETENESS 0 $0 0 $0 3 $123,520 0 $0 0 $0
Aggregated Statistics For Year 2000(Based on 1 partial tract) A) FHA, FSA/RHS & VA B) Conventional C) Refinancings D) Home Improvement Loans E) Loans on Dwellings For 5+ Families F) Non-occupant Loans on Number Average Value Number Average Value Number Average Value Number Average Value Number Average Value Number Average Value
LOANS ORIGINATED 3 $138,480 44 $124,112 14 $108,079 3 $47,630 1 $68,660 27 $117,822 APPLICATIONS APPROVED, NOT ACCEPTED 1 $84,970 2 $207,815 3 $128,763 2 $37,595 0 $0 1 $159,580 APPLICATIONS DENIED 0 $0 8 $105,322 6 $98,457 2 $36,440 0 $0 6 $121,345 APPLICATIONS WITHDRAWN 0 $0 5 $120,220 5 $105,144 1 $35,100 0 $0 3 $125,883 FILES CLOSED FOR INCOMPLETENESS 0 $0 2 $92,640 1 $65,400 0 $0 0 $0 1 $149,410
Aggregated Statistics For Year 1999(Based on 1 partial tract) A) FHA, FSA/RHS & VA B) Conventional C) Refinancings D) Home Improvement Loans E) Loans on Dwellings For 5+ Families F) Non-occupant Loans on Number Average Value Number Average Value Number Average Value Number Average Value Number Average Value Number Average Value
LOANS ORIGINATED 2 $119,555 35 $118,990 19 $120,304 4 $50,452 1 $81,770 22 $105,313 APPLICATIONS APPROVED, NOT ACCEPTED 0 $0 5 $102,952 5 $112,616 1 $32,470 0 $0 3 $113,017 APPLICATIONS DENIED 0 $0 8 $83,626 10 $75,716 3 $28,223 0 $0 6 $92,333 APPLICATIONS WITHDRAWN 0 $0 4 $106,170 6 $102,062 0 $0 0 $0 3 $99,357 FILES CLOSED FOR INCOMPLETENESS 0 $0 1 $86,410 1 $214,180 0 $0 0 $0 0 $0
Detailed HMDA statistics for the following Tracts:
7280.00
Private Mortgage Insurance Companies Aggregated Statistics For Year 2009(Based on 1 partial tract) A) Conventional C) Non-occupant Loans on Number Average Value Number Average Value
LOANS ORIGINATED 1 $229,580 1 $130,420 APPLICATIONS APPROVED, NOT ACCEPTED 0 $0 0 $0 APPLICATIONS DENIED 1 $105,680 0 $0 APPLICATIONS WITHDRAWN 0 $0 0 $0 FILES CLOSED FOR INCOMPLETENESS 0 $0 0 $0
Aggregated Statistics For Year 2008(Based on 1 partial tract) A) Conventional B) Refinancings C) Non-occupant Loans on Number Average Value Number Average Value Number Average Value
LOANS ORIGINATED 2 $148,455 0 $0 1 $238,020 APPLICATIONS APPROVED, NOT ACCEPTED 1 $382,640 1 $164,370 1 $445,740 APPLICATIONS DENIED 0 $0 1 $172,240 1 $206,760 APPLICATIONS WITHDRAWN 0 $0 0 $0 0 $0 FILES CLOSED FOR INCOMPLETENESS 0 $0 0 $0 0 $0
Aggregated Statistics For Year 2007(Based on 1 partial tract) A) Conventional B) Refinancings C) Non-occupant Loans on Number Average Value Number Average Value Number Average Value
LOANS ORIGINATED 4 $310,332 1 $187,580 3 $302,787 APPLICATIONS APPROVED, NOT ACCEPTED 0 $0 0 $0 0 $0 APPLICATIONS DENIED 0 $0 0 $0 0 $0 APPLICATIONS WITHDRAWN 0 $0 0 $0 0 $0 FILES CLOSED FOR INCOMPLETENESS 0 $0 0 $0 0 $0
Aggregated Statistics For Year 2006(Based on 1 partial tract) A) Conventional B) Refinancings C) Non-occupant Loans on Number Average Value Number Average Value Number Average Value
LOANS ORIGINATED 2 $312,250 1 $358,670 2 $306,115 APPLICATIONS APPROVED, NOT ACCEPTED 2 $226,035 0 $0 1 $376,120 APPLICATIONS DENIED 0 $0 0 $0 0 $0 APPLICATIONS WITHDRAWN 0 $0 0 $0 0 $0 FILES CLOSED FOR INCOMPLETENESS 0 $0 0 $0 0 $0
Aggregated Statistics For Year 2005(Based on 1 partial tract) A) Conventional C) Non-occupant Loans on Number Average Value Number Average Value
LOANS ORIGINATED 7 $247,011 5 $267,254 APPLICATIONS APPROVED, NOT ACCEPTED 1 $253,750 1 $178,950 APPLICATIONS DENIED 0 $0 0 $0 APPLICATIONS WITHDRAWN 0 $0 0 $0 FILES CLOSED FOR INCOMPLETENESS 0 $0 0 $0
Aggregated Statistics For Year 2004(Based on 1 partial tract) A) Conventional C) Non-occupant Loans on Number Average Value Number Average Value
LOANS ORIGINATED 8 $219,108 5 $223,792 APPLICATIONS APPROVED, NOT ACCEPTED 2 $197,075 1 $260,080 APPLICATIONS DENIED 1 $98,970 0 $0 APPLICATIONS WITHDRAWN 1 $57,920 0 $0 FILES CLOSED FOR INCOMPLETENESS 0 $0 0 $0
Aggregated Statistics For Year 2003(Based on 1 partial tract) A) Conventional B) Refinancings C) Non-occupant Loans on Number Average Value Number Average Value Number Average Value
LOANS ORIGINATED 10 $185,432 1 $152,100 6 $200,878 APPLICATIONS APPROVED, NOT ACCEPTED 2 $205,800 1 $251,070 2 $204,555 APPLICATIONS DENIED 0 $0 0 $0 0 $0 APPLICATIONS WITHDRAWN 1 $137,330 0 $0 0 $0 FILES CLOSED FOR INCOMPLETENESS 0 $0 0 $0 0 $0
Aggregated Statistics For Year 2002(Based on 1 partial tract) A) Conventional B) Refinancings C) Non-occupant Loans on Number Average Value Number Average Value Number Average Value
LOANS ORIGINATED 15 $150,282 1 $97,050 9 $160,196 APPLICATIONS APPROVED, NOT ACCEPTED 4 $131,958 0 $0 3 $117,253 APPLICATIONS DENIED 1 $57,730 0 $0 1 $121,790 APPLICATIONS WITHDRAWN 0 $0 0 $0 0 $0 FILES CLOSED FOR INCOMPLETENESS 0 $0 0 $0 0 $0
Aggregated Statistics For Year 2001(Based on 1 partial tract) A) Conventional B) Refinancings C) Non-occupant Loans on Number Average Value Number Average Value Number Average Value
LOANS ORIGINATED 14 $116,587 1 $175,110 9 $113,908 APPLICATIONS APPROVED, NOT ACCEPTED 2 $123,520 0 $0 1 $131,380 APPLICATIONS DENIED 1 $50,830 0 $0 0 $0 APPLICATIONS WITHDRAWN 0 $0 0 $0 0 $0 FILES CLOSED FOR INCOMPLETENESS 1 $57,160 0 $0 0 $0
Aggregated Statistics For Year 2000(Based on 1 partial tract) A) Conventional C) Non-occupant Loans on Number Average Value Number Average Value
LOANS ORIGINATED 10 $117,880 6 $118,245 APPLICATIONS APPROVED, NOT ACCEPTED 2 $108,560 1 $117,190 APPLICATIONS DENIED 1 $60,990 0 $0 APPLICATIONS WITHDRAWN 0 $0 0 $0 FILES CLOSED FOR INCOMPLETENESS 0 $0 0 $0
Aggregated Statistics For Year 1999(Based on 1 partial tract) A) Conventional B) Refinancings C) Non-occupant Loans on Number Average Value Number Average Value Number Average Value
LOANS ORIGINATED 7 $114,047 1 $115,790 5 $111,302 APPLICATIONS APPROVED, NOT ACCEPTED 2 $120,620 0 $0 1 $188,850 APPLICATIONS DENIED 0 $0 0 $0 0 $0 APPLICATIONS WITHDRAWN 0 $0 0 $0 0 $0 FILES CLOSED FOR INCOMPLETENESS 0 $0 0 $0 0 $0
Detailed PMIC statistics for the following Tracts:
7280.00
Seaside Park compared to New Jersey state average:
Median house value above state average. Unemployed percentage below state average. Black race population percentage significantly below state average. Hispanic race population percentage significantly below state average. Median age significantly above state average. Foreign-born population percentage significantly below state average. Number of college students below state average. Percentage of population with a bachelor's degree or higher above state average. Seaside Park on our top lists :
#92 on the list of "Top 100 cities with highest ratio of median house value to median household income"
#10 on the list of "Top 101 counties with the highest percentage of residents that smoked 100+ cigarettes in their lives"
#12 on the list of "Top 101 counties with the lowest number of infant deaths per 1000 residents 2007-2013 (pop. 50,000+)"
#16 on the list of "Top 101 counties with the largest increase in the number of births per 1000 residents 2000-2006 to 2007-2013 (pop 50,000+)"
#21 on the list of "Top 101 counties with the largest number of people without health insurance coverage in 2000 (pop. 50,000+)"
#23 on the list of "Top 101 counties with the lowest percentage of residents that keep firearms around their homes"
Top Patent Applicants
James D. Ralph (13)
Robert D. Pearson (2)
Ken Macchiaverna (1)
Marybeth C. Degeorgis (1)
Total of 17 patent applications in 2008-2024.


 Recent articles from our blog. Our writers, many of them Ph.D. graduates or candidates, create easy-to-read articles on a wide variety of topics.

 (6.0 miles
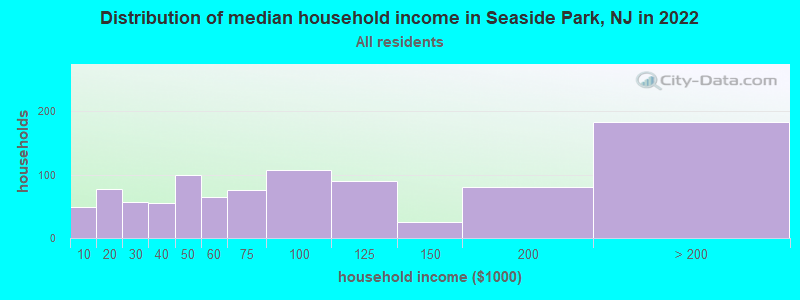

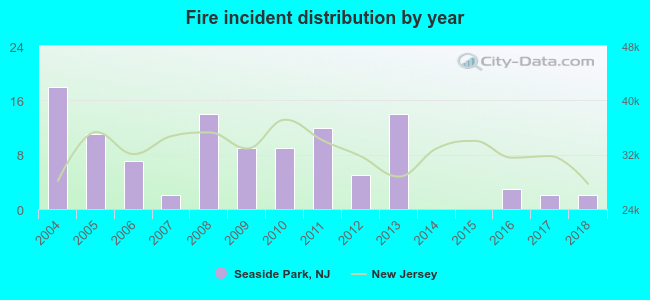 According to the data from the years 2004 - 2018 the average number of fires per year is 7. The highest number of fires - 18 took place in 2004, and the least - 0 in 2014. The data has a dropping trend.
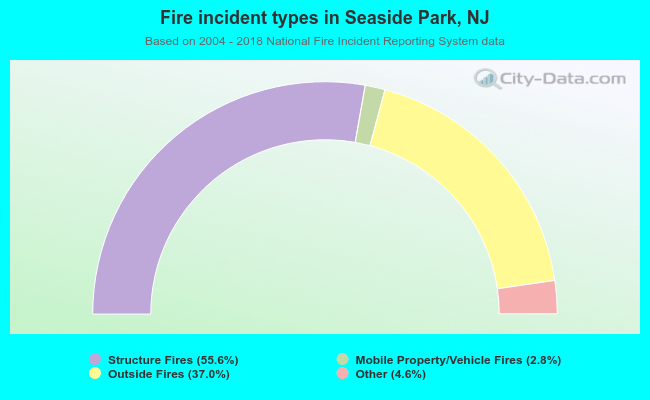 When looking into fire subcategories, the most incidents belonged to: Structure Fires (55.6%), and Outside Fires (37.0%).