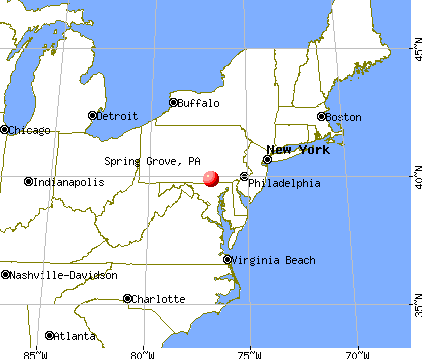
Spring Grove, Pennsylvania
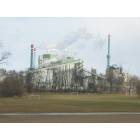
Spring Grove: Picture of the Glatfelter Paper Plant
Spring Grove: Picture of the Glatfelter Paper Plant
- add
your
Submit your own pictures of this borough and show them to the world
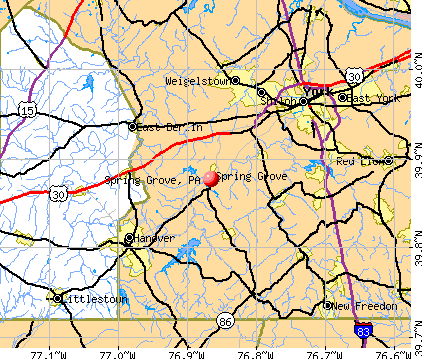
- OSM Map
- General Map
- Google Map
- MSN Map
Population change since 2000: +16.3%
 |
| Males: 1,088 | |
| Females: 1,296 |
| Median resident age: | 41.5 years |
| Pennsylvania median age: | 40.9 years |
Zip codes: 17362.
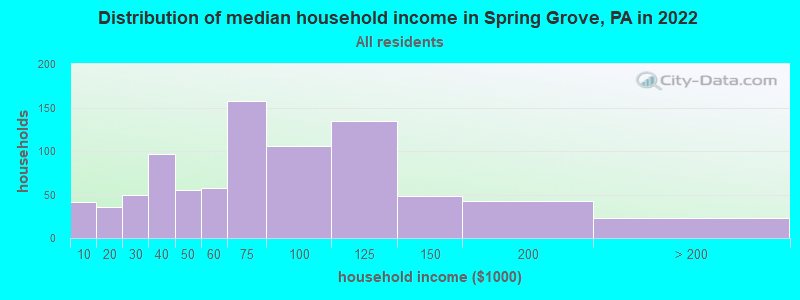
| Spring Grove: | $66,308 |
| PA: | $71,798 |
Estimated per capita income in 2022: $31,601 (it was $20,124 in 2000)
Spring Grove borough income, earnings, and wages data
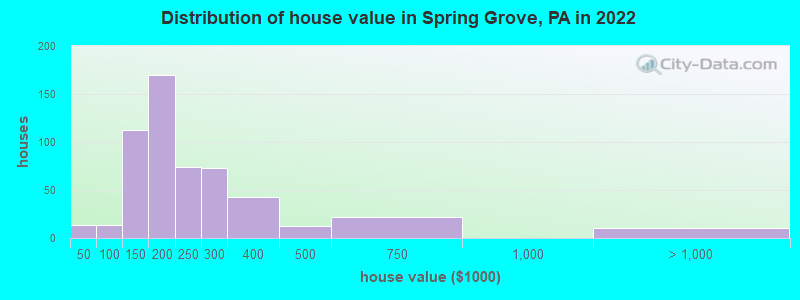
Estimated median house or condo value in 2022: $193,517 (it was $95,300 in 2000)
| Spring Grove: | $193,517 |
| PA: | $245,500 |
Mean prices in 2022: all housing units: $220,412; detached houses: $244,861; townhouses or other attached units: $131,216; in 2-unit structures: $186,166
Median gross rent in 2022: $1,115.
(9.9% for White Non-Hispanic residents, 24.8% for Hispanic or Latino residents, 23.3% for two or more races residents)
Detailed information about poverty and poor residents in Spring Grove, PA


Compare current foreclosures near Spring Grove, PA:
| Photo | Address | Area | Beds / Baths | Price | Details |
|---|---|---|---|---|---|

|
#1
Hanover St
Spring Grove, PA 17362
|
1,256 sq. feet
|
2 baths 3 beds |
show details | |

|
#2
York Rd
Spring Grove, PA 17362
|
1,066 sq. feet
|
1 baths 3 beds |
show details | |

|
#3
Rosepointe Way
Spring Grove, PA 17362
|
1,842 sq. feet
|
2 baths 2 beds |
show details | |

|
#4
Cedar Dr
Spring Grove, PA 17362
|
1,288 sq. feet
|
1 baths 3 beds |
show details | |

|
#5
Three Hill Rd
Spring Grove, PA 17362
|
2,268 sq. feet
|
1 baths 3 beds |
show details | |

|
#6
Jefferson Rd
Spring Grove, PA 17362
|
1,470 sq. feet
|
1 baths 3 beds |
show details | |

|
#7
Hill Top Dr E
Spring Grove, PA 17362
|
2,270 sq. feet
|
1 baths 3 beds |
show details | |

|
#8
Baltimore St
Spring Grove, PA 17362
|
1,344 sq. feet
|
1 baths 3 beds |
show details | |

|
#9
Berlin St
Spring Grove, PA 17362
|
1,000 sq. feet
|
1 baths 3 beds |
show details | |

|
#10
Senft Rd
Spring Grove, PA 17362
|
2,374 sq. feet
|
2 baths 4 beds |
show details |
| Photo | Address | Area | Beds / Baths | Price | Details |
|---|---|---|---|---|---|

|
#11
Baltimore St
Spring Grove, PA 17362
|
1,344 sq. feet
|
1 baths 3 beds |
show details | |

|
#12
Iron Ridge Rd
Spring Grove, PA 17362
|
1,216 sq. feet
|
2 baths 3 beds |
show details | |

|
#13
Lauren Ln
Spring Grove, PA 17362
|
3,646 sq. feet
|
3 baths 4 beds |
show details | |

|
#14
Zeiglers Church Rd
Spring Grove, PA 17362
|
2,299 sq. feet
|
2 baths 4 beds |
show details | |

|
#15
Waltersdorff Rd
Spring Grove, PA 17362
|
1,650 sq. feet
|
2 baths 4 beds |
show details | |

|
#16
Zeiglers Church Rd
Spring Grove, PA 17362
|
1,282 sq. feet
|
2 baths 3 beds |
show details | |

|
#17
W Highland Ave
Spring Grove, PA 17362
|
- sq. feet
|
- baths - beds |
show details | |

|
#18
Roth Church Rd
Spring Grove, PA 17362
|
- sq. feet
|
- baths - beds |
show details | |

|
#19
S East Street
Spring Grove, PA 17362
|
- sq. feet
|
- baths - beds |
show details | |

|
#20
N Water St
Spring Grove, PA 17362
|
- sq. feet
|
- baths - beds |
show details |
| Photo | Address | Area | Beds / Baths | Price | Details |
|---|---|---|---|---|---|

|
#21
Abbottstown Pike
Abbottstown, PA 17301
|
1,300 sq. feet
|
1 baths 3 beds |
$379,900
|
show details |

|
#22
Mount Rose Ave
York, PA 17403
|
1,615 sq. feet
|
1 baths 3 beds |
show details | |

|
#23
Madison Ave
York, PA 17404
|
1,612 sq. feet
|
1 baths 5 beds |
show details | |

|
#24
S Royal St
York, PA 17401
|
968 sq. feet
|
1 baths 3 beds |
show details | |

|
#25
Reservoir Dr
Dover, PA 17315
|
2,064 sq. feet
|
3 baths 3 beds |
show details | |

|
#26
Sara Ln
Hanover, PA 17331
|
1,632 sq. feet
|
2 baths 3 beds |
show details | |

|
#27
Park St
Dover, PA 17315
|
1,280 sq. feet
|
1 baths 3 beds |
show details | |

|
#28
Homestead Dr
Hanover, PA 17331
|
- sq. feet
|
2 baths 3 beds |
show details | |

|
#29
Filbert St
Hanover, PA 17331
|
1,128 sq. feet
|
2 baths 3 beds |
show details | |

|
#30
Devers Rd
York, PA 17404
|
1,036 sq. feet
|
1 baths 3 beds |
show details |
| Photo | Address | Area | Beds / Baths | Price | Details |
|---|---|---|---|---|---|

|
#31
Sticks Rd
Glen Rock, PA 17327
|
- sq. feet
|
1 baths 2 beds |
show details | |

|
#32
Joshua Dr
Hanover, PA 17331
|
- sq. feet
|
2 baths 5 beds |
show details | |

|
#33
Chestnut St
York, PA 17403
|
1,472 sq. feet
|
1 baths 3 beds |
show details | |

|
#34
Manor Rd
Red Lion, PA 17356
|
1,144 sq. feet
|
1 baths 3 beds |
show details | |

|
#35
Chapel Rd
Hanover, PA 17331
|
1,850 sq. feet
|
2 baths 3 beds |
show details | |

|
#36
Majestic Cir
Dallastown, PA 17313
|
2,140 sq. feet
|
2 baths 4 beds |
show details | |

|
#37
Meadow Cross Way
York, PA 17402
|
6,348 sq. feet
|
4 baths 5 beds |
show details | |

|
#38
Littlestown Rd
Hanover, PA 17331
|
1,568 sq. feet
|
1 baths 3 beds |
show details | |

|
#39
Cape Horn Rd
Red Lion, PA 17356
|
1,189 sq. feet
|
1 baths 3 beds |
show details | |

|
#40
Bollinger Rd
Littlestown, PA 17340
|
1,343 sq. feet
|
2 baths 3 beds |
show details |
| Photo | Address | Area | Beds / Baths | Price | Details |
|---|---|---|---|---|---|

|
#41
Rosebrook Dr
York, PA 17402
|
3,179 sq. feet
|
3 baths 4 beds |
show details | |

|
#42
N Sherman Street Ext
Mount Wolf, PA 17347
|
1,813 sq. feet
|
2 baths 4 beds |
show details | |

|
#43
Country Club Rd
Red Lion, PA 17356
|
1,152 sq. feet
|
1 baths 2 beds |
show details | |

|
#44
S Main St
Red Lion, PA 17356
|
1,680 sq. feet
|
2 baths 4 beds |
show details | |

|
#45
Freysville Rd
York, PA 17406
|
5,064 sq. feet
|
1 baths 3 beds |
show details | |

|
#46
Braggtown Rd
York Springs, PA 17372
|
1,634 sq. feet
|
1 baths 3 beds |
show details | |

|
#47
Conewago Ave
Manchester, PA 17345
|
768 sq. feet
|
1 baths 2 beds |
show details | |

|
#48
Baltimore Rd
Dillsburg, PA 17019
|
2,352 sq. feet
|
2 baths 3 beds |
show details | |

|
#49
Ledger Dr
Hanover, PA 17331
|
2,085 sq. feet
|
2 baths 4 beds |
show details | |

|
Check over 1 million property listings on Foreclosure.com!
|
browse all offers | |||


- 1,86486.3%White alone
- 23310.8%Hispanic
- 341.6%Two or more races
- 231.1%Black alone
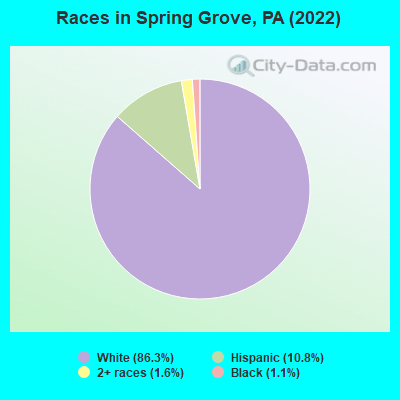
Races in Spring Grove detailed stats: ancestries, foreign born residents, place of birth
According to our research of Pennsylvania and other state lists, there were 18 registered sex offenders living in Spring Grove, Pennsylvania as of April 28, 2024.
The ratio of all residents to sex offenders in Spring Grove is 132 to 1.
 Recent articles from our blog. Our writers, many of them Ph.D. graduates or candidates, create easy-to-read articles on a wide variety of topics.

 | Considering relocation from Intermountain West to York/Dallastown area for job (1 reply) |
| York sphere of influence (21 replies) |
| Moving to Spring Grove with 12 year old son with autism (2 replies) |
| Considering move to Hanover, PA area (7 replies) |
| atl-dc-sf....to york? (9 replies) |
| I am MUSLIM in Hanover (11 replies) |
Latest news from Spring Grove, PA collected exclusively by city-data.com from local newspapers, TV, and radio stations
Ancestries: German (59.1%), American (14.5%), Irish (2.0%), English (1.2%), Scottish (1.2%), Pennsylvania German (1.2%).
Current Local Time: EST time zone
Elevation: 467 feet
Land area: 0.76 square miles.
Population density: 3,138 people per square mile (average).
14 residents are foreign born
| This borough: | 0.6% |
| Pennsylvania: | 7.3% |
Median real estate property taxes paid for housing units with mortgages in 2022: $3,523 (1.9%)
Median real estate property taxes paid for housing units with no mortgage in 2022: $3,096 (1.4%)
Nearest city with pop. 50,000+: Lancaster, PA  (31.8 miles , pop. 56,348).
Nearest city with pop. 200,000+: Baltimore, MD (41.5 miles , pop. 651,154).
Nearest city with pop. 1,000,000+: Philadelphia, PA (91.6 miles , pop. 1,517,550).
Nearest cities:
), ), ), ), ), ), ), )Latitude: 39.88 N, Longitude: 76.87 W
Area code: 717
Property values in Spring Grove, PA

| Here: | 2.5% |
| Pennsylvania: | 2.9% |
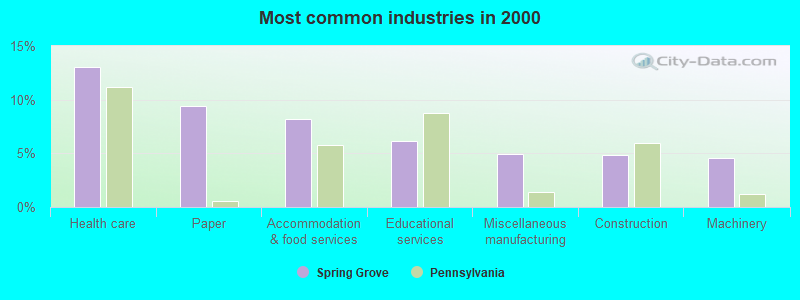
- Health care (13.0%)
- Paper (9.4%)
- Accommodation & food services (8.2%)
- Educational services (6.2%)
- Miscellaneous manufacturing (4.9%)
- Construction (4.8%)
- Machinery (4.6%)
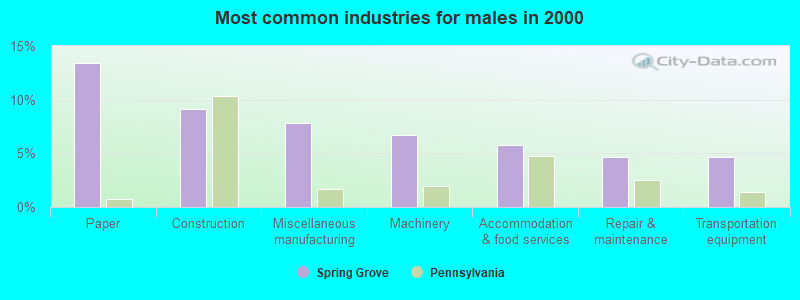
- Paper (13.4%)
- Construction (9.1%)
- Miscellaneous manufacturing (7.8%)
- Machinery (6.7%)
- Accommodation & food services (5.8%)
- Repair & maintenance (4.6%)
- Transportation equipment (4.6%)
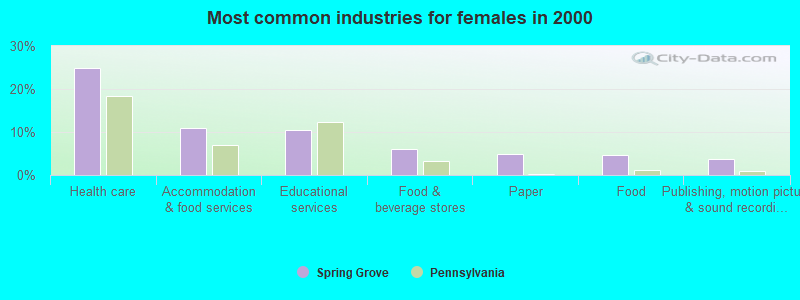
- Health care (24.9%)
- Accommodation & food services (11.0%)
- Educational services (10.4%)
- Food & beverage stores (6.0%)
- Paper (5.0%)
- Food (4.6%)
- Publishing, motion picture & sound recording industries (3.7%)
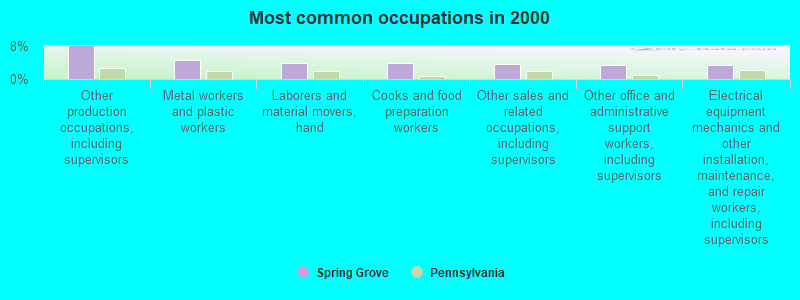
- Other production occupations, including supervisors (8.0%)
- Metal workers and plastic workers (4.7%)
- Laborers and material movers, hand (3.8%)
- Cooks and food preparation workers (3.8%)
- Other sales and related occupations, including supervisors (3.7%)
- Other office and administrative support workers, including supervisors (3.3%)
- Electrical equipment mechanics and other installation, maintenance, and repair workers, including supervisors (3.3%)

- Other production occupations, including supervisors (11.0%)
- Metal workers and plastic workers (8.9%)
- Electrical equipment mechanics and other installation, maintenance, and repair workers, including supervisors (5.9%)
- Laborers and material movers, hand (4.5%)
- Vehicle and mobile equipment mechanics, installers, and repairers (4.3%)
- Driver/sales workers and truck drivers (3.3%)
- Cooks and food preparation workers (3.2%)
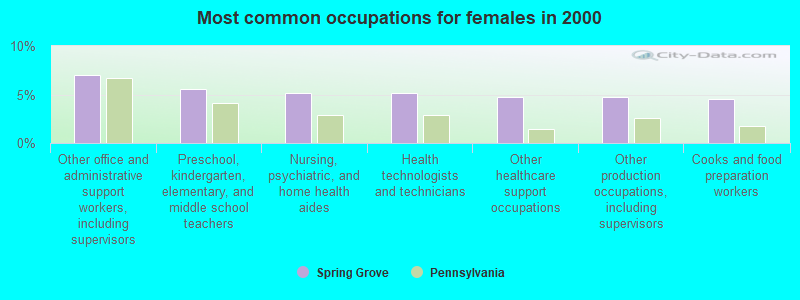
- Other office and administrative support workers, including supervisors (7.1%)
- Preschool, kindergarten, elementary, and middle school teachers (5.6%)
- Nursing, psychiatric, and home health aides (5.2%)
- Health technologists and technicians (5.2%)
- Other healthcare support occupations (4.8%)
- Other production occupations, including supervisors (4.8%)
- Cooks and food preparation workers (4.6%)
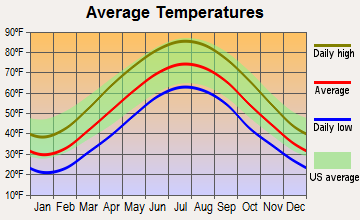
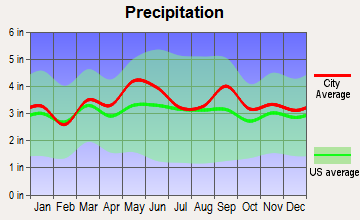
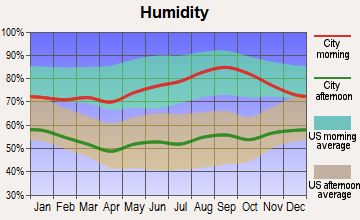
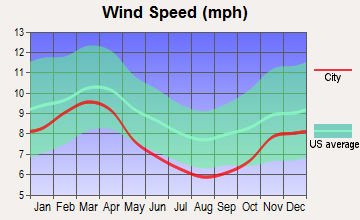
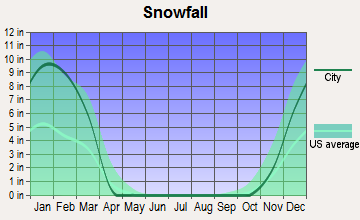
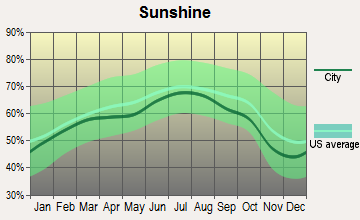
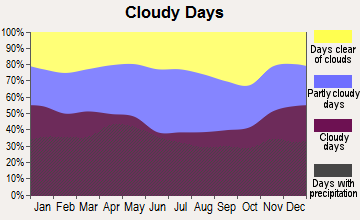
Average climate in Spring Grove, Pennsylvania
Based on data reported by over 4,000 weather stations
(lower is better)
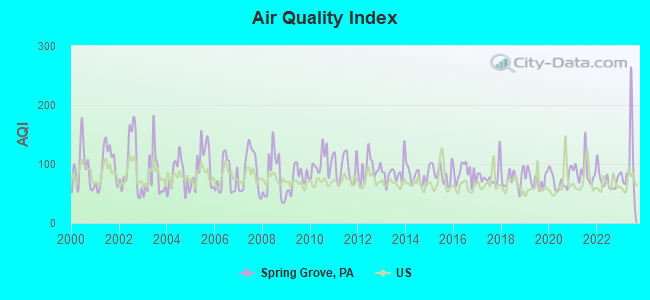
Air Quality Index (AQI) level in 2023 was 98.0. This is worse than average.
| City: | 98.0 |
| U.S.: | 72.6 |
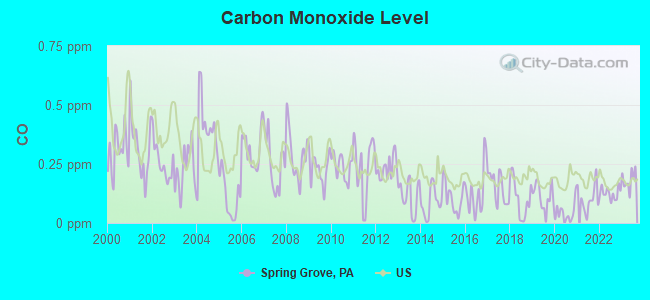
Carbon Monoxide (CO) [ppm] level in 2023 was 0.183. This is better than average. Closest monitor was 10.7 miles away from the city center.
| City: | 0.183 |
| U.S.: | 0.251 |
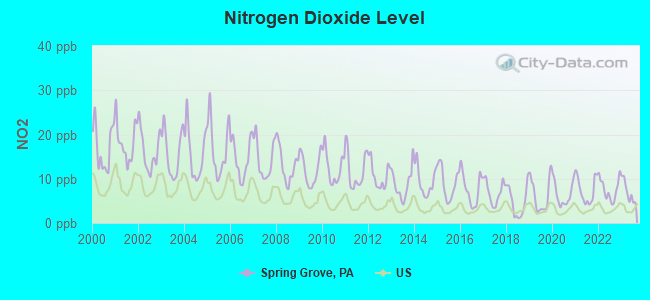
Nitrogen Dioxide (NO2) [ppb] level in 2023 was 7.08. This is worse than average. Closest monitor was 9.4 miles away from the city center.
| City: | 7.08 |
| U.S.: | 5.11 |
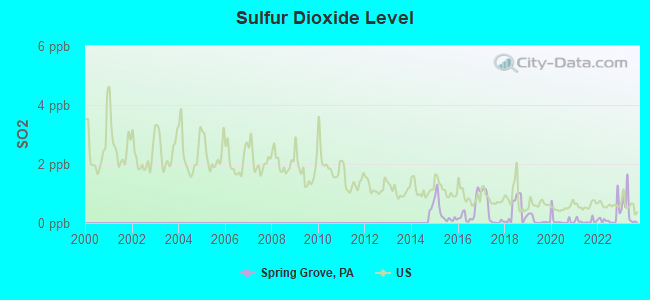
Sulfur Dioxide (SO2) [ppb] level in 2023 was 0.475. This is significantly better than average. Closest monitor was 9.4 miles away from the city center.
| City: | 0.475 |
| U.S.: | 1.515 |
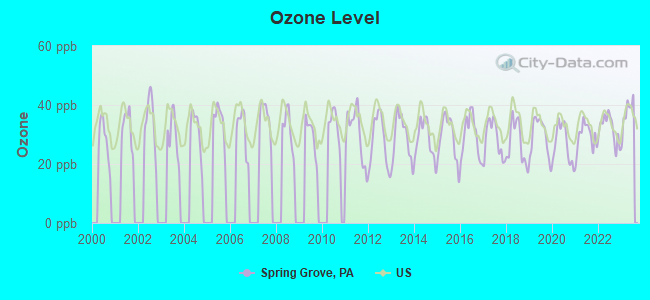
Ozone [ppb] level in 2023 was 37.2. This is about average. Closest monitor was 10.7 miles away from the city center.
| City: | 37.2 |
| U.S.: | 33.3 |
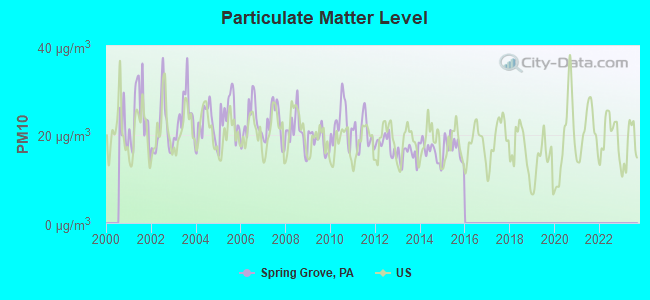
Particulate Matter (PM10) [µg/m3] level in 2015 was 17.0. This is about average. Closest monitor was 7.6 miles away from the city center.
| City: | 17.0 |
| U.S.: | 19.2 |
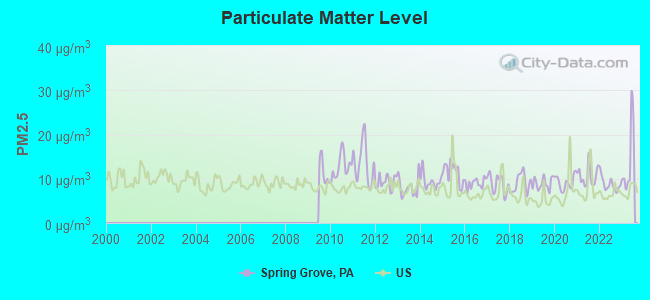
Particulate Matter (PM2.5) [µg/m3] level in 2023 was 14.2. This is significantly worse than average. Closest monitor was 10.7 miles away from the city center.
| City: | 14.2 |
| U.S.: | 8.1 |
Tornado activity:
Spring Grove-area historical tornado activity is slightly above Pennsylvania state average. It is 16% greater than the overall U.S. average.
On 4/5/1952, a category F3 (max. wind speeds 158-206 mph) tornado 8.1 miles away from the Spring Grove borough center injured 4 people and caused between $500,000 and $5,000,000 in damages.
On 6/7/1980, a category F3 tornado 9.0 miles away from the borough center caused between $50,000 and $500,000 in damages.
Earthquake activity:
Spring Grove-area historical earthquake activity is significantly above Pennsylvania state average. It is 59% smaller than the overall U.S. average.On 8/23/2011 at 17:51:04, a magnitude 5.8 (5.8 MW, Depth: 3.7 mi, Class: Moderate, Intensity: VI - VII) earthquake occurred 147.8 miles away from the city center
On 1/16/1994 at 01:49:16, a magnitude 4.6 (4.6 MB, 4.6 LG, Depth: 3.1 mi, Class: Light, Intensity: IV - V) earthquake occurred 53.9 miles away from Spring Grove center
On 9/25/1998 at 19:52:52, a magnitude 5.2 (4.8 MB, 4.3 MS, 5.2 LG, 4.5 MW, Depth: 3.1 mi) earthquake occurred 216.2 miles away from the city center
On 1/16/1994 at 00:42:43, a magnitude 4.2 (4.2 MB, 4.0 LG, Depth: 3.1 mi) earthquake occurred 55.1 miles away from the city center
On 8/25/2011 at 05:07:52, a magnitude 4.5 (4.5 ML, Depth: 4.2 mi) earthquake occurred 146.1 miles away from Spring Grove center
On 1/31/1986 at 16:46:43, a magnitude 5.0 (5.0 MB) earthquake occurred 254.7 miles away from the city center
Magnitude types: regional Lg-wave magnitude (LG), body-wave magnitude (MB), local magnitude (ML), surface-wave magnitude (MS), moment magnitude (MW)
Natural disasters:
The number of natural disasters in York County (18) is near the US average (15).Major Disasters (Presidential) Declared: 13
Emergencies Declared: 5
Causes of natural disasters: Winter Storms: 5, Floods: 3, Hurricanes: 3, Snowstorms: 3, Storms: 3, Tropical Storms: 3, Blizzard: 1, Heavy Rain: 1, Snowfall: 1, Tropical Depression: 1, Other: 1 (Note: some incidents may be assigned to more than one category).
Hospitals and medical centers near Spring Grove:
- KEYSTONE HOME CARE, INC (Home Health Center, about 8 miles away; HANOVER, PA)
- SKILLS OF CENTRAL PENNSYLVANIA INC - ALLEGHENY (Hospital, about 8 miles away; HANOVER, PA)
- ASERACARE HOSPICE (Hospital, about 8 miles away; YORK, PA)
- HANOVER HOSPITAL Acute Care Hospitals (about 8 miles away; HANOVER, PA)
- COLONIAL MANOR NURSING HOME (Nursing Home, about 8 miles away; YORK, PA)
- MARGARET E. MOUL HOME (Nursing Home, about 9 miles away; YORK, PA)
- MANORCARE HEALTH SERVICES-YORK NORTH (Nursing Home, about 9 miles away; YORK, PA)
Heliports located in Spring Grove:
Colleges/universities with over 2000 students nearest to Spring Grove:
- York College Pennsylvania (about 9 miles; York, PA; Full-time enrollment: 5,140)
- YTI Career Institute-York (about 14 miles; York, PA; FT enrollment: 2,212)
- Gettysburg College (about 20 miles; Gettysburg, PA; FT enrollment: 2,772)
- Messiah College (about 21 miles; Mechanicsburg, PA; FT enrollment: 3,035)
- McDaniel College (about 22 miles; Westminster, MD; FT enrollment: 2,558)
- Pennsylvania State University-Penn State Harrisburg (about 24 miles; Middletown, PA; FT enrollment: 3,797)
- Carroll Community College (about 25 miles; Westminster, MD; FT enrollment: 2,682)
Public high school in Spring Grove:
- SPRING GROVE AREA HS (Students: 1,240, Location: 1490 ROTH CHURCH ROAD, Grades: 9-12)
Private high schools in Spring Grove:
Public elementary/middle schools in Spring Grove:
- SPRING GROVE AREA MS (Students: 631, Location: 244 OLD HANOVER RD, Grades: 7-8)
- SPRING GROVE AREA INTRMD SCH (Students: 592, Location: 1480 ROTH CHURCH RD, Grades: 5-6)
- SPRING GROVE EL SCH (Students: 580, Location: 1450 ROTH'S CHURCH ROAD, Grades: KG-4)
Private elementary/middle school in Spring Grove:
Points of interest:
Notable locations in Spring Grove: Glatfelter Memorial Library (A), Friendship Hose Company 1 Station 4 (B). Display/hide their locations on the map
Birthplace of: Michael Bortner - Politician.
Drinking water stations with addresses in Spring Grove and their reported violations in the past:
PORTERS COMM FIRE CO (Population served: 200, Groundwater):Past health violations:SPRING GROVE JEHOVAHS WITNESS (Population served: 105, Groundwater):Past monitoring violations:
- MCL, Monthly (TCR) - Between JUL-2013 and SEP-2013, Contaminant: Coliform. Follow-up actions: St Formal NOV issued (OCT-17-2013), St Violation/Reminder Notice (OCT-17-2013), St Public Notif requested (OCT-17-2013), St Compliance achieved (JAN-14-2014)
- Monitoring, Source Water (GWR) - Between AUG-27-2013 and SEP-27-2013, Contaminant: E. COLI. Follow-up actions: St Violation/Reminder Notice (OCT-17-2013), St Compliance achieved (OCT-17-2013)
Past health violations:Past monitoring violations:
- MCL, Monthly (TCR) - Between JUL-2013 and SEP-2013, Contaminant: Coliform. Follow-up actions: St Public Notif requested (NOV-18-2013), St Violation/Reminder Notice (NOV-18-2013), St Compliance achieved (JAN-14-2014)
- One routine major monitoring violation
Drinking water stations with addresses in Spring Grove that have no violations reported:
- GOOFYS EATERY & SPIRITS INC (Population served: 200, Primary Water Source Type: Groundwater)
| This borough: | 2.5 people |
| Pennsylvania: | 2.5 people |
| This borough: | 71.2% |
| Whole state: | 65.0% |
| This borough: | 10.1% |
| Whole state: | 6.6% |
Likely homosexual households (counted as self-reported same-sex unmarried-partner households)
- Lesbian couples: 0.5% of all households
- Gay men: 0.2% of all households
Banks with branches in Spring Grove (2011 data):
- Manufacturers and Traders Trust Company: Spring Grove Branch at 33 Roth's Church Road, branch established on 1988/01/13. Info updated 2011/08/08: Bank assets: $76,887.1 mil, Deposits: $60,064.2 mil, headquarters in Buffalo, NY, positive income, Commercial Lending Specialization, 808 total offices, Holding Company: M&T Bank Corporation
- Susquehanna Bank: Spring Grove Branch at 502 North Main Street, branch established on 2005/03/15. Info updated 2012/02/28: Bank assets: $14,849.0 mil, Deposits: $10,294.4 mil, headquarters in Lititz, PA, positive income, Commercial Lending Specialization, 308 total offices, Holding Company: Susquehanna Bancshares, Inc.
- Sovereign Bank, National Association: Spring Grove Branch at 39 Hanover St, branch established on 1993/01/20. Info updated 2012/01/31: Bank assets: $78,146.9 mil, Deposits: $48,042.9 mil, headquarters in Wilmington, DE, positive income, Commercial Lending Specialization, 718 total offices, Holding Company: Banco Santander, S.A.
For population 15 years and over in Spring Grove:
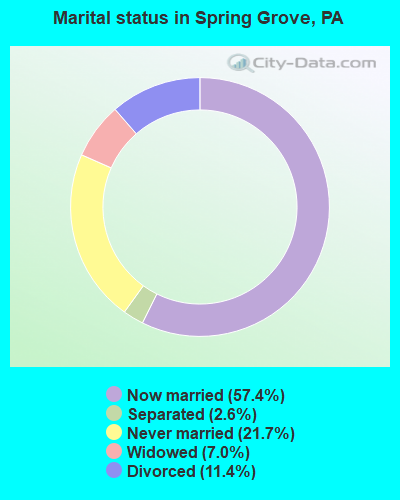
- Never married: 21.7%
- Now married: 57.4%
- Separated: 2.6%
- Widowed: 7.0%
- Divorced: 11.4%
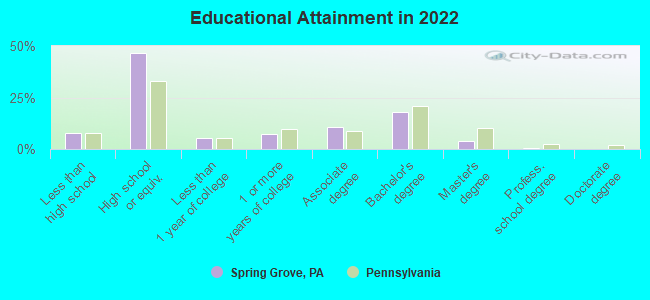
For population 25 years and over in Spring Grove:
- High school or higher: 92.1%
- Bachelor's degree or higher: 22.3%
- Graduate or professional degree: 4.5%
- Unemployed: 3.6%
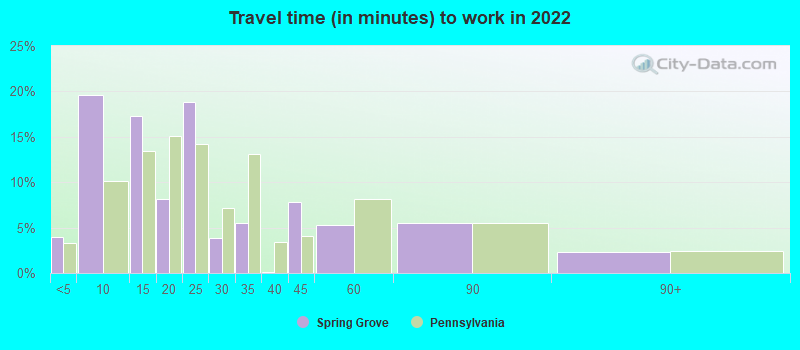
- Mean travel time to work (commute): 20.9 minutes
| Here: | 8.7 |
| Pennsylvania average: | 11.4 |
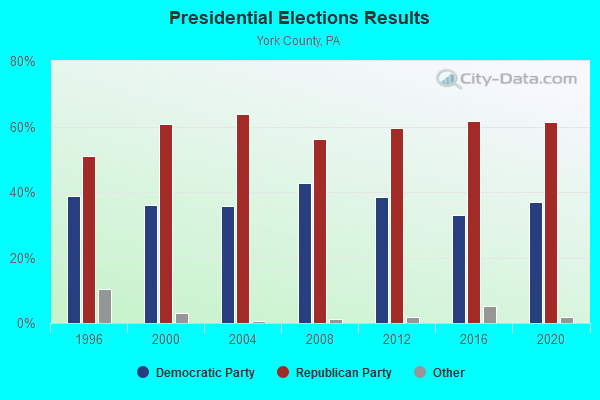
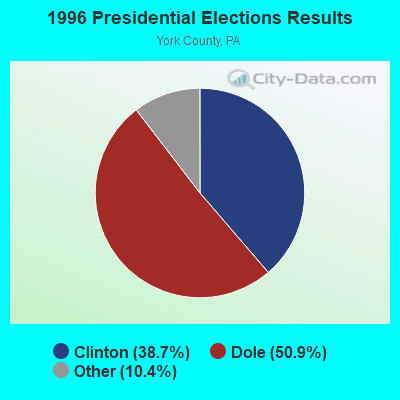
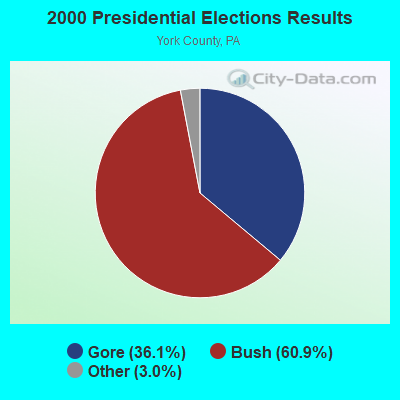

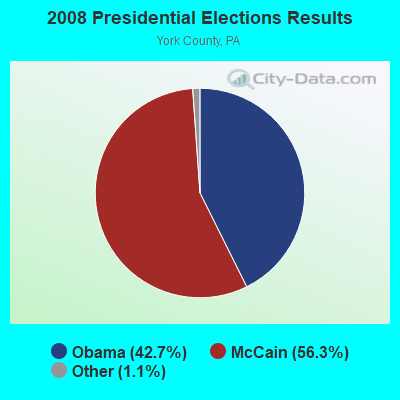
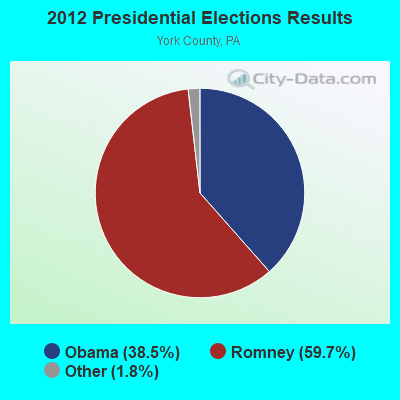


Graphs represent county-level data. Detailed 2008 Election Results
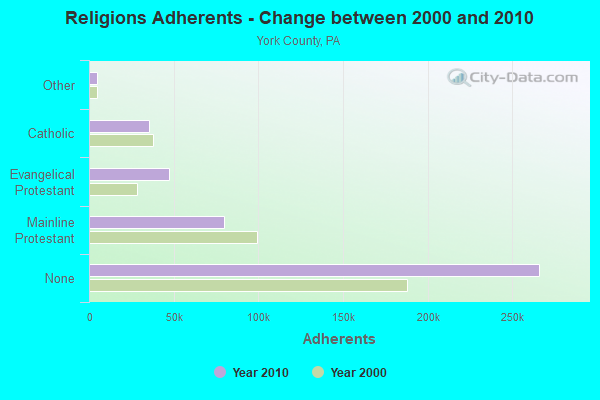
Religion statistics for Spring Grove, PA (based on York County data)
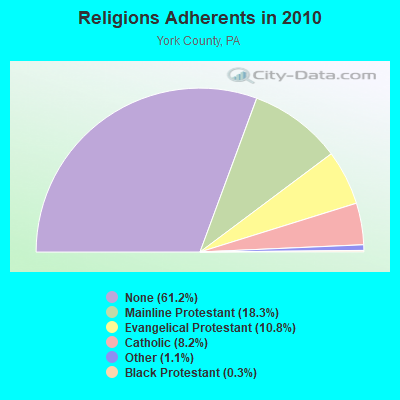
| Religion | Adherents | Congregations |
|---|---|---|
| Mainline Protestant | 79,653 | 217 |
| Evangelical Protestant | 47,150 | 222 |
| Catholic | 35,605 | 13 |
| Other | 4,815 | 24 |
| Black Protestant | 1,339 | 10 |
| Orthodox | 400 | 2 |
| None | 266,010 | - |
Food Environment Statistics:
| York County: | 1.47 / 10,000 pop. |
| State: | 2.04 / 10,000 pop. |
| York County: | 0.12 / 10,000 pop. |
| Pennsylvania: | 0.09 / 10,000 pop. |
| York County: | 0.40 / 10,000 pop. |
| Pennsylvania: | 0.88 / 10,000 pop. |
| York County: | 2.69 / 10,000 pop. |
| Pennsylvania: | 2.52 / 10,000 pop. |
| This county: | 5.49 / 10,000 pop. |
| Pennsylvania: | 7.12 / 10,000 pop. |
| York County: | 8.7% |
| State: | 9.1% |
| Here: | 28.7% |
| Pennsylvania: | 27.2% |
| Here: | 11.9% |
| Pennsylvania: | 11.5% |
Health and Nutrition:
| Here: | 55.6% |
| Pennsylvania: | 50.2% |
| Spring Grove: | 55.6% |
| State: | 47.1% |
| Spring Grove: | 28.1 |
| Pennsylvania: | 28.7 |
| Here: | 18.9% |
| Pennsylvania: | 20.8% |
| Spring Grove: | 9.2% |
| Pennsylvania: | 10.9% |
| This city: | 7.0 |
| Pennsylvania: | 6.8 |
| Spring Grove: | 32.4% |
| State: | 34.3% |
| Spring Grove: | 63.0% |
| State: | 56.2% |
| This city: | 81.0% |
| Pennsylvania: | 78.3% |
More about Health and Nutrition of Spring Grove, PA Residents
| Local government employment and payroll (March 2022) | |||||
| Function | Full-time employees | Monthly full-time payroll | Average yearly full-time wage | Part-time employees | Monthly part-time payroll |
|---|---|---|---|---|---|
| Other and Unallocable | 2 | $10,821 | $64,926 | 0 | $0 |
| Other Government Administration | 2 | $4,386 | $26,316 | 0 | $0 |
| Sewerage | 1 | $6,102 | $73,224 | 1 | $1,709 |
| Financial Administration | 1 | $5,263 | $63,156 | 0 | $0 |
| Totals for Government | 6 | $26,572 | $53,144 | 1 | $1,709 |
Spring Grove government finances - Expenditure in 2017 (per resident):
- Current Operations - Sewerage: $860,000 ($360.74)
Regular Highways: $765,000 ($320.89)
Central Staff Services: $485,000 ($203.44)
Police Protection: $352,000 ($147.65)
Solid Waste Management: $286,000 ($119.97)
General - Other: $192,000 ($80.54)
Parks and Recreation: $120,000 ($50.34)
Local Fire Protection: $56,000 ($23.49)
Housing and Community Development: $6,000 ($2.52)
Libraries: $2,000 ($0.84)
- General - Interest on Debt: $398,000 ($166.95)
Spring Grove government finances - Revenue in 2017 (per resident):
- Charges - Sewerage: $1,023,000 ($429.11)
Solid Waste Management: $286,000 ($119.97)
Other: $55,000 ($23.07)
Parks and Recreation: $46,000 ($19.30)
- Federal Intergovernmental - Other: $21,000 ($8.81)
- Local Intergovernmental - Other: $98,000 ($41.11)
- Miscellaneous - Interest Earnings: $54,000 ($22.65)
Fines and Forfeits: $13,000 ($5.45)
General Revenue - Other: $12,000 ($5.03)
- State Intergovernmental - Other: $133,000 ($55.79)
- Tax - Property: $554,000 ($232.38)
Individual Income: $261,000 ($109.48)
Occupation and Business License - Other: $65,000 ($27.27)
Documentary and Stock Transfer: $21,000 ($8.81)
Public Utility License: $11,000 ($4.61)
Spring Grove government finances - Debt in 2017 (per resident):
- Long Term Debt - Outstanding Unspecified Public Purpose: $9,985,000 ($4188.34)
Beginning Outstanding - Unspecified Public Purpose: $9,945,000 ($4171.56)
Issue, Unspecified Public Purpose: $551,000 ($231.12)
Retired Unspecified Public Purpose: $511,000 ($214.35)
Spring Grove government finances - Cash and Securities in 2017 (per resident):
- Bond Funds - Cash and Securities: $40,000 ($16.78)
- Other Funds - Cash and Securities: $3,943,000 ($1653.94)
5.22% of this county's 2021 resident taxpayers lived in other counties in 2020 ($59,504 average adjusted gross income)
| Here: | 5.22% |
| Pennsylvania average: | 5.27% |
0.03% of residents moved from foreign countries ($236 average AGI)
York County: 0.03% Pennsylvania average: 0.01%
Top counties from which taxpayers relocated into this county between 2020 and 2021:
| from Lancaster County, PA | |
| from Cumberland County, PA | |
| from Adams County, PA |
4.60% of this county's 2020 resident taxpayers moved to other counties in 2021 ($64,703 average adjusted gross income)
| Here: | 4.60% |
| Pennsylvania average: | 5.44% |
0.02% of residents moved to foreign countries ($241 average AGI)
York County: 0.02% Pennsylvania average: 0.01%
Top counties to which taxpayers relocated from this county between 2020 and 2021:
| to Cumberland County, PA | |
| to Adams County, PA | |
| to Lancaster County, PA |
| Businesses in Spring Grove, PA | ||||
| Name | Count | Name | Count | |
|---|---|---|---|---|
| Curves | 1 | Hardee's | 1 | |
| FedEx | 1 | MasterBrand Cabinets | 3 | |
| GNC | 1 | Rite Aid | 1 | |
| H&R Block | 1 | UPS | 1 | |
Strongest AM radio stations in Spring Grove:
- WOYK (1350 AM; 5 kW; YORK, PA; Owner: WOYK, INC.)
- WCBM (680 AM; 50 kW; BALTIMORE, MD; Owner: WCBM MARYLAND, INC.)
- WHVR (1280 AM; 5 kW; HANOVER, PA)
- WSBA (910 AM; 5 kW; YORK, PA; Owner: WSBA LICO, INC.)
- WBAL (1090 AM; 50 kW; BALTIMORE, MD; Owner: HEARST RADIO, INC.)
- WGOP (700 AM; daytime; 25 kW; WALKERSVILLE, MD; Owner: BIRACH BROADCASTING CORPORATION)
- WWLG (1370 AM; 50 kW; BALTIMORE, MD; Owner: M-10 BROADCASTING, INC.)
- WMET (1150 AM; 50 kW; GAITHERSBURG, MD; Owner: BELTWAY ACQUISITION CORPORATION)
- WTEM (980 AM; 50 kW; WASHINGTON, DC; Owner: AMFM RADIO LICENSES, L.L.C.)
- WVCH (740 AM; 50 kW; CHESTER, PA; Owner: WVCH COMMUNICATIONS, INC.)
- WTOP (1500 AM; 50 kW; WASHINGTON, DC; Owner: BONNEVILLE HOLDING COMPANY)
- WBIS (1190 AM; 50 kW; ANNAPOLIS, MD; Owner: NATIONS RADIO, LLC)
- WHP (580 AM; 5 kW; HARRISBURG, PA; Owner: CLEAR CHANNEL BROADCASTING LICENSES, INC.)
Strongest FM radio stations in Spring Grove:
- WYCR (98.5 FM; YORK-HANOVER, PA; Owner: RADIO HANOVER, INC.)
- WGTY (107.7 FM; GETTYSBURG, PA; Owner: TIMES AND NEWS PUBLISHING COMPANY)
- WROZ (101.3 FM; LANCASTER, PA; Owner: HALL COMMUNICATIONS, INC.)
- WARM-FM (103.3 FM; YORK, PA; Owner: WSBA LICO, INC.)
- WHBO (92.7 FM; STARVIEW, PA; Owner: HALL COMMUNICATIONS, INC.)
- WSOX (96.1 FM; RED LION, PA; Owner: LANCASTER-YORK BROADCASTING, LLC)
- WQXA-FM (105.7 FM; YORK, PA; Owner: CITADEL BROADCASTING COMPANY)
- W220BX (91.9 FM; MARIETTA, PA; Owner: CALVARY CHAPEL OF TWIN FALLS, INC.)
- WITF-FM (89.5 FM; HARRISBURG, PA; Owner: WITF, INC.)
- WTPA (93.5 FM; MECHANICSBURG, PA; Owner: CUMULUS LICENSING CORP.)
- WCAT-FM (106.7 FM; HERSHEY, PA; Owner: CITADEL BROADCASTING COMPANY)
- WAYZ-FM (104.7 FM; HAGERSTOWN, MD; Owner: HJV LIMITED PARTNERSHIP)
- WETH (89.1 FM; HAGERSTOWN, MD; Owner: GREATER WASHINGTON EDUCATIONAL TELECOMMUNICATIONS ASSN.)
- WZBA (100.7 FM; WESTMINSTER, MD; Owner: SHAMROCK COMMUNICATIONS, INC.)
- WWMX (106.5 FM; BALTIMORE, MD; Owner: INFINITY RADIO OPERATIONS INC.)
- WHKF (99.3 FM; HARRISBURG, PA; Owner: CLEAR CHANNEL BROADCASTING LICENSES, INC.)
- WRVV (97.3 FM; HARRISBURG, PA; Owner: CLEAR CHANNEL BROADCASTING LICENSES, INC.)
- WLIF (101.9 FM; BALTIMORE, MD; Owner: INFINITY WLIF, INC.)
- WFRE (99.9 FM; FREDERICK, MD; Owner: CAPSTAR TX LIMITED PARTNERSHIP)
- WDAC (94.5 FM; LANCASTER, PA; Owner: WDAC RADIO COMPANY)
TV broadcast stations around Spring Grove:
- WPMT (Channel 43; YORK, PA; Owner: TRIBUNE TELEVISION COMPANY)
- WGAL (Channel 8; LANCASTER, PA; Owner: WGAL HEARST-ARGYLE TELEVISION, INC.)
- WMPB (Channel 67; BALTIMORE, MD; Owner: MARYLAND PUBLIC BROADCASTING COMMISSION)
- W23AY (Channel 23; YORK, PA; Owner: WIRELESS CABLE TV OF PA, INC.)
- WBAL-TV (Channel 11; BALTIMORE, MD; Owner: WBAL HEARST-ARGYLE TV, INC. (CA CORP.))
- WMAR-TV (Channel 2; BALTIMORE, MD; Owner: SCRIPPS HOWARD BROADCASTING COMPANY)
- WBFF (Channel 45; BALTIMORE, MD; Owner: CHESAPEAKE TELEVISION LICENSEE, LLC)
- WGCB-TV (Channel 49; RED LION, PA; Owner: RED LION BROADCASTING CO., INC.)
- WLYH-TV (Channel 15; LANCASTER, PA; Owner: TELEVISION STATION GROUP LICENSE SUBSIDIARY, LLC)
- WNUV (Channel 54; BALTIMORE, MD; Owner: BALTIMORE (WNUV-TV) LICENSEE, INC.)
- WJZ-TV (Channel 13; BALTIMORE, MD; Owner: VIACOM INC.)
- WITF-TV (Channel 33; HARRISBURG, PA; Owner: WITF, INC.)
- WUTB (Channel 24; BALTIMORE, MD; Owner: FOX TELEVISION STATIONS, INC.)
- WHTM-TV (Channel 27; HARRISBURG, PA; Owner: HARRISBURG TELEVISION, INC.)
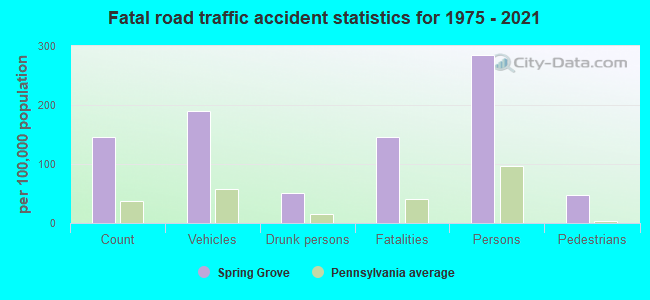
Spring Grove fatal accident list:
Oct 25, 1998 04:00 PM, Church, Vehicles: 1, Persons: 2, Pedestrians: 1, Fatalities: 1
Apr 9, 1989 03:23 AM, 116, Vehicles: 1, Persons: 1, Fatalities: 1, Drunk persons involved: 1
- National Bridge Inventory (NBI) Statistics
- 15Number of bridges
- 102ft / 31.2mTotal length
- $2,112,000Total costs
- 72,639Total average daily traffic
- 8,286Total average daily truck traffic
- 106,869Total future (year 2009) average daily traffic
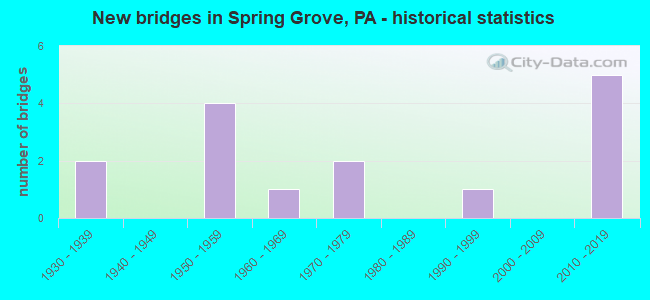
- New bridges - historical statistics
- 21930-1939
- 41950-1959
- 11960-1969
- 21970-1979
- 11990-1999
- 52010-2019
FCC Registered Antenna Towers:
46 (See the full list of FCC Registered Antenna Towers in Spring Grove)FCC Registered Broadcast Land Mobile Towers:
7- Friendship Hose Co 73 S Main St (Lat: 39.874000 Lon: -76.864417), Call Sign: KTG763, Licensee ID: L00079597,
Assigned Frequencies: 33.8800 MHz, 33.9000 MHz, Grant Date: 11/15/2001, Expiration Date: 10/15/2011, Cancellation Date: 10/12/2011, Registrant: Fire Chiefs & Fighters Asson York Co Inc, 330 Emig Rd, Emigsville, PA 17318, Phone: (717) 767-4097, Fax: (717) 764-3243, Email:
- E Railroad St (Lat: 39.873722 Lon: -76.859417), Structure height: 8 m, Call Sign: WPBC920,
Assigned Frequencies: 155.235 MHz, Grant Date: 09/07/2012, Expiration Date: 11/20/2022, Cancellation Date: 01/21/2023, Certifier: Michael Nolte, Registrant: Durham School Services, 4300 Weaver Pkwy, Warrenville, IL 60555, Phone: (630) 821-5400, Fax: (800) 207-3045, Email:
- Lat: 39.880722 Lon: -76.820944, Call Sign: WPLD968,
Assigned Frequencies: 456.512 MHz, 461.862 MHz, Grant Date: 02/11/2022, Expiration Date: 03/18/2032, Certifier: Ardon P Beahm, Registrant: Triangle Communications, Inc., 940 W. Main St., New Holland, PA 17557, Phone: (717) 656-2211, Fax: (717) 656-3458, Email:
- Maintenance Office S Main St (Lat: 39.876194 Lon: -79.866722), Call Sign: KGN883, Licensee ID: L00004542,
Assigned Frequencies: 153.140 MHz, Grant Date: 10/05/2000, Expiration Date: 12/21/2005, Cancellation Date: 02/25/2006, Registrant: P H Glatfelter Company, S Main St, Spring Grove, PA 17362, Phone: (717) 225-4711
- Lat: 39.874667 Lon: -76.866028, Call Sign: WQGY529,
Assigned Frequencies: 461.400 MHz, 466.400 MHz, 463.225 MHz, Grant Date: 03/23/2017, Expiration Date: 05/24/2027, Certifier: Ira Reed, Registrant: Business Radio Licensing, 30251 Golden Lantern, Suite E #501, Laguna Niguel, CA 92677, Phone: (949) 348-8510, Fax: (949) 348-8514, Email:
- Hanover & Jackson Street (Lat: 39.887500 Lon: -76.871111), Call Sign: WQIW293,
Assigned Frequencies: 451.187 MHz, 451.287 MHz, 451.362 MHz, 451.412 MHz, 451.762 MHz, 452.037 MHz, 452.137 MHz, 452.162 MHz, 452.287 MHz, 452.712 MHz, Grant Date: 03/24/2018, Expiration Date: 06/02/2028, Certifier: Jake Slagle, Registrant: Mills\' Communications, Inc., 210 Pennsylvania Ave, Westminster, MD 21157-4343, Phone: (410) 876-8600, Fax: (410) 857-1225, Email:
- Lat: 39.854222 Lon: -76.907194, Call Sign: WRFY849,
Assigned Frequencies: 466.725 MHz, 469.962 MHz, 452.700 MHz, 457.700 MHz, Grant Date: 06/02/2020, Expiration Date: 06/02/2030, Certifier: Chad Markle, Registrant: Triangle Communications, Inc., 940 W. Main St., New Holland, PA 17557, Phone: (717) 656-2211, Fax: (717) 656-3458, Email:
FCC Registered Microwave Towers:
9 (See the full list of FCC Registered Microwave Towers in this town)FCC Registered Amateur Radio Licenses:
74 (See the full list of FCC Registered Amateur Radio Licenses in Spring Grove)FAA Registered Aircraft:
5- Aircraft: CESSNA 182R (Category: Land, Seats: 4, Weight: Up to 12,499 Pounds), Engine: CONT MOTOR O-470 SERIES (230 HP) (Reciprocating)
N-Number: 181U, N181U, N-181U, Serial Number: 18268135, Year manufactured: 1981, Airworthiness Date: 12/22/1981, Certificate Issue Date: 03/15/2018
Registrant (Individual): Daniel C Kauffman, 62 Baltimore St, Spring Grove, PA 17362 - Aircraft: PIPER PA-28-181 (Category: Land, Seats: 4, Weight: Up to 12,499 Pounds, Speed: 105 mph), Engine: LYCOMING O&VO-360 SER (180 HP) (Reciprocating)
N-Number: 2154F, N2154F, N-2154F, Serial Number: 28-7990203, Year manufactured: 1978, Airworthiness Date: 11/27/1978, Certificate Issue Date: 08/25/2010
Registrant (Individual): Nicholas J Gentile, 870 Iron Ridge Rd, Spring Grove, PA 17362 - Aircraft: DJI INSPIRE 1 PRO (Category: Land, Engines: 4), Engine: Electric
N-Number: 225BB, N225BB, N-225BB, Serial Number: W21ADH29020555, Certificate Issue Date: 10/03/2017
Registrant (Individual): Allen D Miller, 3517 Hardwood Ter, Spring Grove, PA 17362 - Aircraft: PIPER PA-28-161 (Category: Land, Seats: 4, Weight: Up to 12,499 Pounds, Speed: 108 mph), Engine: LYCOMING 0-320 SERIES (180 HP) (Reciprocating)
N-Number: 6379C, N6379C, N-6379C, Serial Number: 28-7816417, Year manufactured: 1978, Airworthiness Date: 02/08/1978, Certificate Issue Date: 10/06/2003
Registrant (Individual): Philip M Sprenkle, 1214 Martin Rd, Spring Grove, PA 17362 - Aircraft: PIPER PA-22-160 (Category: Land, Seats: 4, Weight: Up to 12,499 Pounds, Speed: 94 mph), Engine: LYCOMING 0-320 SERIES (180 HP) (Reciprocating)
N-Number: 8766D, N8766D, N-8766D, Serial Number: 22-5952, Year manufactured: 1958, Airworthiness Date: 02/05/1958, Certificate Issue Date: 01/09/1987
Registrant (Co-Owned): Steven L Ratliff, 2818 Pine Tree Rd, Spring Grove, PA 17362, Other Owners: Stacy L Ratliff
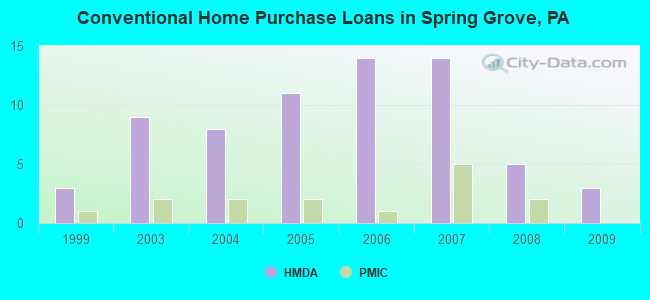
| Home Mortgage Disclosure Act Aggregated Statistics For Year 2009 (Based on 1 partial tract) | ||||||||||
| A) FHA, FSA/RHS & VA Home Purchase Loans | B) Conventional Home Purchase Loans | C) Refinancings | D) Home Improvement Loans | G) Loans On Manufactured Home Dwelling (A B C & D) | ||||||
|---|---|---|---|---|---|---|---|---|---|---|
| Number | Average Value | Number | Average Value | Number | Average Value | Number | Average Value | Number | Average Value | |
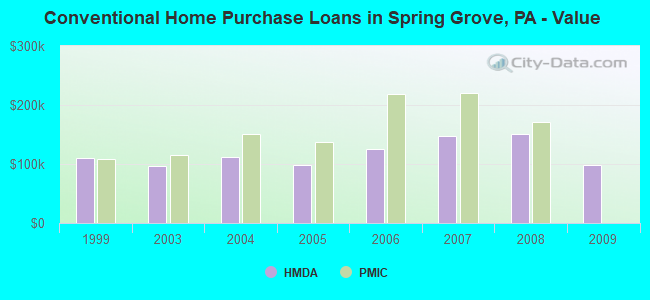
| LOANS ORIGINATED | 5 | $153,598 | 3 | $99,083 | 11 | $148,023 | 2 | $54,235 | 1 | $32,980 |
| APPLICATIONS APPROVED, NOT ACCEPTED | 0 | $0 | 1 | $44,470 | 1 | $215,440 | 0 | $0 | 0 | $0 |
| APPLICATIONS DENIED | 0 | $0 | 1 | $21,370 | 4 | $194,698 | 1 | $15,170 | 1 | $21,950 |
| APPLICATIONS WITHDRAWN | 0 | $0 | 0 | $0 | 3 | $155,957 | 0 | $0 | 0 | $0 |
| FILES CLOSED FOR INCOMPLETENESS | 0 | $0 | 0 | $0 | 1 | $119,150 | 0 | $0 | 0 | $0 |
Detailed HMDA statistics for the following Tracts: 0205.21
| Private Mortgage Insurance Companies Aggregated Statistics For Year 2008 (Based on 1 partial tract) | ||||
| A) Conventional Home Purchase Loans | B) Refinancings | |||
|---|---|---|---|---|
| Number | Average Value | Number | Average Value | |
| LOANS ORIGINATED | 2 | $170,970 | 1 | $282,880 |
| APPLICATIONS APPROVED, NOT ACCEPTED | 0 | $0 | 0 | $0 |
| APPLICATIONS DENIED | 0 | $0 | 0 | $0 |
| APPLICATIONS WITHDRAWN | 0 | $0 | 0 | $0 |
| FILES CLOSED FOR INCOMPLETENESS | 0 | $0 | 0 | $0 |
Detailed PMIC statistics for the following Tracts: 0205.21
2002 - 2018 National Fire Incident Reporting System (NFIRS) incidents
- Fire incident types reported to NFIRS in Spring Grove, PA
- 66049.9%Structure Fires
- 51539.0%Outside Fires
- 896.7%Mobile Property/Vehicle Fires
- 584.4%Other
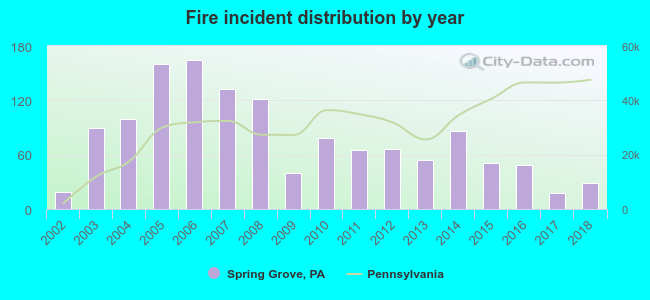 According to the data from the years 2002 - 2018 the average number of fire incidents per year is 78. The highest number of fires - 165 took place in 2006, and the least - 18 in 2017. The data has a growing trend.
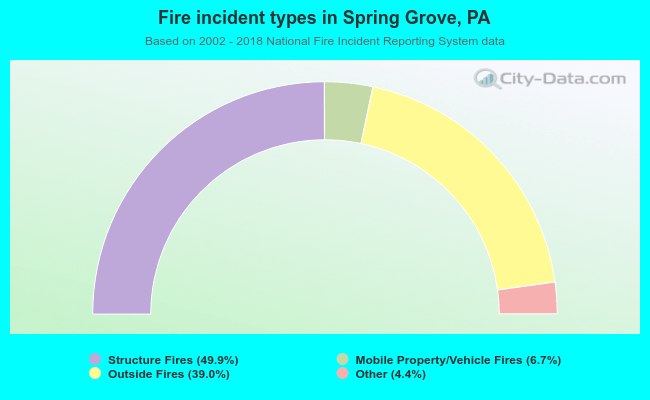 When looking into fire subcategories, the most incidents belonged to: Structure Fires (49.9%), and Outside Fires (39.0%).
| Most common first names in Spring Grove, PA among deceased individuals | ||
| Name | Count | Lived (average) |
|---|---|---|
| John | 69 | 76.0 years |
| Mary | 63 | 81.6 years |
| George | 55 | 74.9 years |
| William | 52 | 74.5 years |
| Charles | 51 | 77.3 years |
| Robert | 46 | 70.6 years |
| Paul | 41 | 77.0 years |
| Richard | 30 | 72.3 years |
| Harry | 28 | 76.8 years |
| Anna | 26 | 82.2 years |
| Most common last names in Spring Grove, PA among deceased individuals | ||
| Last name | Count | Lived (average) |
|---|---|---|
| Myers | 54 | 76.1 years |
| Miller | 44 | 76.2 years |
| Stambaugh | 44 | 76.5 years |
| Senft | 40 | 77.2 years |
| Smith | 35 | 79.8 years |
| Mummert | 31 | 76.1 years |
| Becker | 30 | 75.8 years |
| Altland | 24 | 75.0 years |
| Rohrbaugh | 22 | 80.3 years |
| Kessler | 19 | 78.2 years |
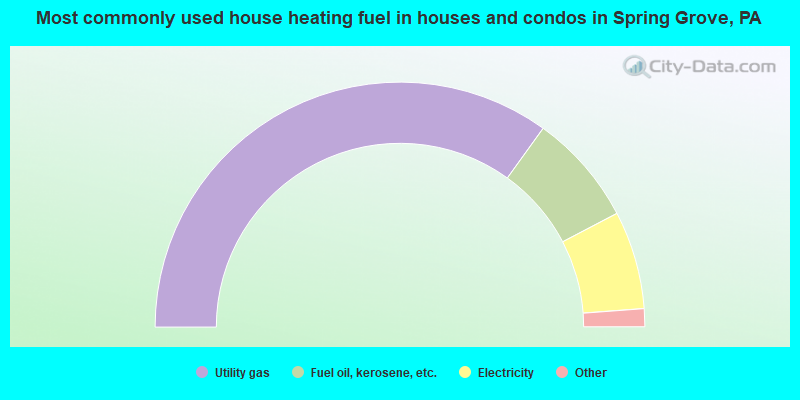
- 70.1%Utility gas
- 14.8%Fuel oil, kerosene, etc.
- 13.0%Electricity
- 1.6%Wood
- 0.5%Other fuel
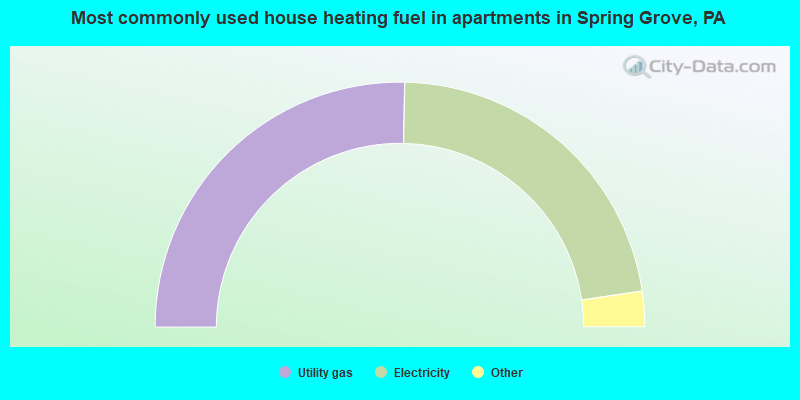
- 51.0%Utility gas
- 45.0%Electricity
- 2.4%Fuel oil, kerosene, etc.
- 1.6%Other fuel
Spring Grove compared to Pennsylvania state average:
- Unemployed percentage significantly below state average.
- Black race population percentage significantly below state average.
- Foreign-born population percentage significantly below state average.
- Number of college students significantly below state average.

|
|
Total of 68 patent applications in 2008-2024.