St. Joseph, Missouri Submit your own pictures of this city and show them to the world
OSM Map
General Map
Google Map
MSN Map
OSM Map
General Map
Google Map
MSN Map
OSM Map
General Map
Google Map
MSN Map
OSM Map
General Map
Google Map
MSN Map
Please wait while loading the map...
Population in 2022: 70,656 (99% urban, 1% rural). Population change since 2000: -4.5%Males: 35,026 Females: 35,630
March 2022 cost of living index in St. Joseph: 79.4 (low, U.S. average is 100) Percentage of residents living in poverty in 2022: 21.2%for White Non-Hispanic residents , 46.3% for Black residents , 21.3% for Hispanic or Latino residents , 33.8% for American Indian residents , 79.4% for Native Hawaiian and other Pacific Islander residents , 18.1% for other race residents , 25.3% for two or more races residents )
Profiles of local businesses
Business Search - 14 Million verified businesses
Data:
Median household income ($)
Median household income (% change since 2000)
Household income diversity
Ratio of average income to average house value (%)
Ratio of average income to average rent
Median household income ($) - White
Median household income ($) - Black or African American
Median household income ($) - Asian
Median household income ($) - Hispanic or Latino
Median household income ($) - American Indian and Alaska Native
Median household income ($) - Multirace
Median household income ($) - Other Race
Median household income for houses/condos with a mortgage ($)
Median household income for apartments without a mortgage ($)
Races - White alone (%)
Races - White alone (% change since 2000)
Races - Black alone (%)
Races - Black alone (% change since 2000)
Races - American Indian alone (%)
Races - American Indian alone (% change since 2000)
Races - Asian alone (%)
Races - Asian alone (% change since 2000)
Races - Hispanic (%)
Races - Hispanic (% change since 2000)
Races - Native Hawaiian and Other Pacific Islander alone (%)
Races - Native Hawaiian and Other Pacific Islander alone (% change since 2000)
Races - Two or more races (%)
Races - Two or more races (% change since 2000)
Races - Other race alone (%)
Races - Other race alone (% change since 2000)
Racial diversity
Unemployment (%)
Unemployment (% change since 2000)
Unemployment (%) - White
Unemployment (%) - Black or African American
Unemployment (%) - Asian
Unemployment (%) - Hispanic or Latino
Unemployment (%) - American Indian and Alaska Native
Unemployment (%) - Multirace
Unemployment (%) - Other Race
Population density (people per square mile)
Population - Males (%)
Population - Females (%)
Population - Males (%) - White
Population - Males (%) - Black or African American
Population - Males (%) - Asian
Population - Males (%) - Hispanic or Latino
Population - Males (%) - American Indian and Alaska Native
Population - Males (%) - Multirace
Population - Males (%) - Other Race
Population - Females (%) - White
Population - Females (%) - Black or African American
Population - Females (%) - Asian
Population - Females (%) - Hispanic or Latino
Population - Females (%) - American Indian and Alaska Native
Population - Females (%) - Multirace
Population - Females (%) - Other Race
Coronavirus confirmed cases (Apr 27, 2024)
Deaths caused by coronavirus (Apr 27, 2024)
Coronavirus confirmed cases (per 100k population) (Apr 27, 2024)
Deaths caused by coronavirus (per 100k population) (Apr 27, 2024)
Daily increase in number of cases (Apr 27, 2024)
Weekly increase in number of cases (Apr 27, 2024)
Cases doubled (in days) (Apr 27, 2024)
Hospitalized patients (Apr 18, 2022)
Negative test results (Apr 18, 2022)
Total test results (Apr 18, 2022)
COVID Vaccine doses distributed (per 100k population) (Sep 19, 2023)
COVID Vaccine doses administered (per 100k population) (Sep 19, 2023)
COVID Vaccine doses distributed (Sep 19, 2023)
COVID Vaccine doses administered (Sep 19, 2023)
Likely homosexual households (%)
Likely homosexual households (% change since 2000)
Likely homosexual households - Lesbian couples (%)
Likely homosexual households - Lesbian couples (% change since 2000)
Likely homosexual households - Gay men (%)
Likely homosexual households - Gay men (% change since 2000)
Cost of living index
Median gross rent ($)
Median contract rent ($)
Median monthly housing costs ($)
Median house or condo value ($)
Median house or condo value ($ change since 2000)
Mean house or condo value by units in structure - 1, detached ($)
Mean house or condo value by units in structure - 1, attached ($)
Mean house or condo value by units in structure - 2 ($)
Mean house or condo value by units in structure by units in structure - 3 or 4 ($)
Mean house or condo value by units in structure - 5 or more ($)
Mean house or condo value by units in structure - Boat, RV, van, etc. ($)
Mean house or condo value by units in structure - Mobile home ($)
Median house or condo value ($) - White
Median house or condo value ($) - Black or African American
Median house or condo value ($) - Asian
Median house or condo value ($) - Hispanic or Latino
Median house or condo value ($) - American Indian and Alaska Native
Median house or condo value ($) - Multirace
Median house or condo value ($) - Other Race
Median resident age
Resident age diversity
Median resident age - Males
Median resident age - Females
Median resident age - White
Median resident age - Black or African American
Median resident age - Asian
Median resident age - Hispanic or Latino
Median resident age - American Indian and Alaska Native
Median resident age - Multirace
Median resident age - Other Race
Median resident age - Males - White
Median resident age - Males - Black or African American
Median resident age - Males - Asian
Median resident age - Males - Hispanic or Latino
Median resident age - Males - American Indian and Alaska Native
Median resident age - Males - Multirace
Median resident age - Males - Other Race
Median resident age - Females - White
Median resident age - Females - Black or African American
Median resident age - Females - Asian
Median resident age - Females - Hispanic or Latino
Median resident age - Females - American Indian and Alaska Native
Median resident age - Females - Multirace
Median resident age - Females - Other Race
Commute - mean travel time to work (minutes)
Travel time to work - Less than 5 minutes (%)
Travel time to work - Less than 5 minutes (% change since 2000)
Travel time to work - 5 to 9 minutes (%)
Travel time to work - 5 to 9 minutes (% change since 2000)
Travel time to work - 10 to 19 minutes (%)
Travel time to work - 10 to 19 minutes (% change since 2000)
Travel time to work - 20 to 29 minutes (%)
Travel time to work - 20 to 29 minutes (% change since 2000)
Travel time to work - 30 to 39 minutes (%)
Travel time to work - 30 to 39 minutes (% change since 2000)
Travel time to work - 40 to 59 minutes (%)
Travel time to work - 40 to 59 minutes (% change since 2000)
Travel time to work - 60 to 89 minutes (%)
Travel time to work - 60 to 89 minutes (% change since 2000)
Travel time to work - 90 or more minutes (%)
Travel time to work - 90 or more minutes (% change since 2000)
Marital status - Never married (%)
Marital status - Now married (%)
Marital status - Separated (%)
Marital status - Widowed (%)
Marital status - Divorced (%)
Median family income ($)
Median family income (% change since 2000)
Median non-family income ($)
Median non-family income (% change since 2000)
Median per capita income ($)
Median per capita income (% change since 2000)
Median family income ($) - White
Median family income ($) - Black or African American
Median family income ($) - Asian
Median family income ($) - Hispanic or Latino
Median family income ($) - American Indian and Alaska Native
Median family income ($) - Multirace
Median family income ($) - Other Race
Median year house/condo built
Median year apartment built
Year house built - Built 2005 or later (%)
Year house built - Built 2000 to 2004 (%)
Year house built - Built 1990 to 1999 (%)
Year house built - Built 1980 to 1989 (%)
Year house built - Built 1970 to 1979 (%)
Year house built - Built 1960 to 1969 (%)
Year house built - Built 1950 to 1959 (%)
Year house built - Built 1940 to 1949 (%)
Year house built - Built 1939 or earlier (%)
Average household size
Household density (households per square mile)
Average household size - White
Average household size - Black or African American
Average household size - Asian
Average household size - Hispanic or Latino
Average household size - American Indian and Alaska Native
Average household size - Multirace
Average household size - Other Race
Occupied housing units (%)
Vacant housing units (%)
Owner occupied housing units (%)
Renter occupied housing units (%)
Vacancy status - For rent (%)
Vacancy status - For sale only (%)
Vacancy status - Rented or sold, not occupied (%)
Vacancy status - For seasonal, recreational, or occasional use (%)
Vacancy status - For migrant workers (%)
Vacancy status - Other vacant (%)
Residents with income below the poverty level (%)
Residents with income below 50% of the poverty level (%)
Children below poverty level (%)
Poor families by family type - Married-couple family (%)
Poor families by family type - Male, no wife present (%)
Poor families by family type - Female, no husband present (%)
Poverty status for native-born residents (%)
Poverty status for foreign-born residents (%)
Poverty among high school graduates not in families (%)
Poverty among people who did not graduate high school not in families (%)
Residents with income below the poverty level (%) - White
Residents with income below the poverty level (%) - Black or African American
Residents with income below the poverty level (%) - Asian
Residents with income below the poverty level (%) - Hispanic or Latino
Residents with income below the poverty level (%) - American Indian and Alaska Native
Residents with income below the poverty level (%) - Multirace
Residents with income below the poverty level (%) - Other Race
Air pollution - Air Quality Index (AQI)
Air pollution - CO
Air pollution - NO2
Air pollution - SO2
Air pollution - Ozone
Air pollution - PM10
Air pollution - PM25
Air pollution - Pb
Crime - Murders per 100,000 population
Crime - Rapes per 100,000 population
Crime - Robberies per 100,000 population
Crime - Assaults per 100,000 population
Crime - Burglaries per 100,000 population
Crime - Thefts per 100,000 population
Crime - Auto thefts per 100,000 population
Crime - Arson per 100,000 population
Crime - City-data.com crime index
Crime - Violent crime index
Crime - Property crime index
Crime - Murders per 100,000 population (5 year average)
Crime - Rapes per 100,000 population (5 year average)
Crime - Robberies per 100,000 population (5 year average)
Crime - Assaults per 100,000 population (5 year average)
Crime - Burglaries per 100,000 population (5 year average)
Crime - Thefts per 100,000 population (5 year average)
Crime - Auto thefts per 100,000 population (5 year average)
Crime - Arson per 100,000 population (5 year average)
Crime - City-data.com crime index (5 year average)
Crime - Violent crime index (5 year average)
Crime - Property crime index (5 year average)
1996 Presidential Elections Results (%) - Democratic Party (Clinton)
1996 Presidential Elections Results (%) - Republican Party (Dole)
1996 Presidential Elections Results (%) - Other
2000 Presidential Elections Results (%) - Democratic Party (Gore)
2000 Presidential Elections Results (%) - Republican Party (Bush)
2000 Presidential Elections Results (%) - Other
2004 Presidential Elections Results (%) - Democratic Party (Kerry)
2004 Presidential Elections Results (%) - Republican Party (Bush)
2004 Presidential Elections Results (%) - Other
2008 Presidential Elections Results (%) - Democratic Party (Obama)
2008 Presidential Elections Results (%) - Republican Party (McCain)
2008 Presidential Elections Results (%) - Other
2012 Presidential Elections Results (%) - Democratic Party (Obama)
2012 Presidential Elections Results (%) - Republican Party (Romney)
2012 Presidential Elections Results (%) - Other
2016 Presidential Elections Results (%) - Democratic Party (Clinton)
2016 Presidential Elections Results (%) - Republican Party (Trump)
2016 Presidential Elections Results (%) - Other
2020 Presidential Elections Results (%) - Democratic Party (Biden)
2020 Presidential Elections Results (%) - Republican Party (Trump)
2020 Presidential Elections Results (%) - Other
Ancestries Reported - Arab (%)
Ancestries Reported - Czech (%)
Ancestries Reported - Danish (%)
Ancestries Reported - Dutch (%)
Ancestries Reported - English (%)
Ancestries Reported - French (%)
Ancestries Reported - French Canadian (%)
Ancestries Reported - German (%)
Ancestries Reported - Greek (%)
Ancestries Reported - Hungarian (%)
Ancestries Reported - Irish (%)
Ancestries Reported - Italian (%)
Ancestries Reported - Lithuanian (%)
Ancestries Reported - Norwegian (%)
Ancestries Reported - Polish (%)
Ancestries Reported - Portuguese (%)
Ancestries Reported - Russian (%)
Ancestries Reported - Scotch-Irish (%)
Ancestries Reported - Scottish (%)
Ancestries Reported - Slovak (%)
Ancestries Reported - Subsaharan African (%)
Ancestries Reported - Swedish (%)
Ancestries Reported - Swiss (%)
Ancestries Reported - Ukrainian (%)
Ancestries Reported - United States (%)
Ancestries Reported - Welsh (%)
Ancestries Reported - West Indian (%)
Ancestries Reported - Other (%)
Educational Attainment - No schooling completed (%)
Educational Attainment - Less than high school (%)
Educational Attainment - High school or equivalent (%)
Educational Attainment - Less than 1 year of college (%)
Educational Attainment - 1 or more years of college (%)
Educational Attainment - Associate degree (%)
Educational Attainment - Bachelor's degree (%)
Educational Attainment - Master's degree (%)
Educational Attainment - Professional school degree (%)
Educational Attainment - Doctorate degree (%)
School Enrollment - Nursery, preschool (%)
School Enrollment - Kindergarten (%)
School Enrollment - Grade 1 to 4 (%)
School Enrollment - Grade 5 to 8 (%)
School Enrollment - Grade 9 to 12 (%)
School Enrollment - College undergrad (%)
School Enrollment - Graduate or professional (%)
School Enrollment - Not enrolled in school (%)
School enrollment - Public schools (%)
School enrollment - Private schools (%)
School enrollment - Not enrolled (%)
Median number of rooms in houses and condos
Median number of rooms in apartments
Housing units lacking complete plumbing facilities (%)
Housing units lacking complete kitchen facilities (%)
Density of houses
Urban houses (%)
Rural houses (%)
Households with people 60 years and over (%)
Households with people 65 years and over (%)
Households with people 75 years and over (%)
Households with one or more nonrelatives (%)
Households with no nonrelatives (%)
Population in households (%)
Family households (%)
Nonfamily households (%)
Population in families (%)
Family households with own children (%)
Median number of bedrooms in owner occupied houses
Mean number of bedrooms in owner occupied houses
Median number of bedrooms in renter occupied houses
Mean number of bedrooms in renter occupied houses
Median number of vehichles in owner occupied houses
Mean number of vehichles in owner occupied houses
Median number of vehichles in renter occupied houses
Mean number of vehichles in renter occupied houses
Mortgage status - with mortgage (%)
Mortgage status - with second mortgage (%)
Mortgage status - with home equity loan (%)
Mortgage status - with both second mortgage and home equity loan (%)
Mortgage status - without a mortgage (%)
Average family size
Average family size - White
Average family size - Black or African American
Average family size - Asian
Average family size - Hispanic or Latino
Average family size - American Indian and Alaska Native
Average family size - Multirace
Average family size - Other Race
Geographical mobility - Same house 1 year ago (%)
Geographical mobility - Moved within same county (%)
Geographical mobility - Moved from different county within same state (%)
Geographical mobility - Moved from different state (%)
Geographical mobility - Moved from abroad (%)
Place of birth - Born in state of residence (%)
Place of birth - Born in other state (%)
Place of birth - Native, outside of US (%)
Place of birth - Foreign born (%)
Housing units in structures - 1, detached (%)
Housing units in structures - 1, attached (%)
Housing units in structures - 2 (%)
Housing units in structures - 3 or 4 (%)
Housing units in structures - 5 to 9 (%)
Housing units in structures - 10 to 19 (%)
Housing units in structures - 20 to 49 (%)
Housing units in structures - 50 or more (%)
Housing units in structures - Mobile home (%)
Housing units in structures - Boat, RV, van, etc. (%)
House/condo owner moved in on average (years ago)
Renter moved in on average (years ago)
Year householder moved into unit - Moved in 1999 to March 2000 (%)
Year householder moved into unit - Moved in 1995 to 1998 (%)
Year householder moved into unit - Moved in 1990 to 1994 (%)
Year householder moved into unit - Moved in 1980 to 1989 (%)
Year householder moved into unit - Moved in 1970 to 1979 (%)
Year householder moved into unit - Moved in 1969 or earlier (%)
Means of transportation to work - Drove car alone (%)
Means of transportation to work - Carpooled (%)
Means of transportation to work - Public transportation (%)
Means of transportation to work - Bus or trolley bus (%)
Means of transportation to work - Streetcar or trolley car (%)
Means of transportation to work - Subway or elevated (%)
Means of transportation to work - Railroad (%)
Means of transportation to work - Ferryboat (%)
Means of transportation to work - Taxicab (%)
Means of transportation to work - Motorcycle (%)
Means of transportation to work - Bicycle (%)
Means of transportation to work - Walked (%)
Means of transportation to work - Other means (%)
Working at home (%)
Industry diversity
Most Common Industries - Agriculture, forestry, fishing and hunting, and mining (%)
Most Common Industries - Agriculture, forestry, fishing and hunting (%)
Most Common Industries - Mining, quarrying, and oil and gas extraction (%)
Most Common Industries - Construction (%)
Most Common Industries - Manufacturing (%)
Most Common Industries - Wholesale trade (%)
Most Common Industries - Retail trade (%)
Most Common Industries - Transportation and warehousing, and utilities (%)
Most Common Industries - Transportation and warehousing (%)
Most Common Industries - Utilities (%)
Most Common Industries - Information (%)
Most Common Industries - Finance and insurance, and real estate and rental and leasing (%)
Most Common Industries - Finance and insurance (%)
Most Common Industries - Real estate and rental and leasing (%)
Most Common Industries - Professional, scientific, and management, and administrative and waste management services (%)
Most Common Industries - Professional, scientific, and technical services (%)
Most Common Industries - Management of companies and enterprises (%)
Most Common Industries - Administrative and support and waste management services (%)
Most Common Industries - Educational services, and health care and social assistance (%)
Most Common Industries - Educational services (%)
Most Common Industries - Health care and social assistance (%)
Most Common Industries - Arts, entertainment, and recreation, and accommodation and food services (%)
Most Common Industries - Arts, entertainment, and recreation (%)
Most Common Industries - Accommodation and food services (%)
Most Common Industries - Other services, except public administration (%)
Most Common Industries - Public administration (%)
Occupation diversity
Most Common Occupations - Management, business, science, and arts occupations (%)
Most Common Occupations - Management, business, and financial occupations (%)
Most Common Occupations - Management occupations (%)
Most Common Occupations - Business and financial operations occupations (%)
Most Common Occupations - Computer, engineering, and science occupations (%)
Most Common Occupations - Computer and mathematical occupations (%)
Most Common Occupations - Architecture and engineering occupations (%)
Most Common Occupations - Life, physical, and social science occupations (%)
Most Common Occupations - Education, legal, community service, arts, and media occupations (%)
Most Common Occupations - Community and social service occupations (%)
Most Common Occupations - Legal occupations (%)
Most Common Occupations - Education, training, and library occupations (%)
Most Common Occupations - Arts, design, entertainment, sports, and media occupations (%)
Most Common Occupations - Healthcare practitioners and technical occupations (%)
Most Common Occupations - Health diagnosing and treating practitioners and other technical occupations (%)
Most Common Occupations - Health technologists and technicians (%)
Most Common Occupations - Service occupations (%)
Most Common Occupations - Healthcare support occupations (%)
Most Common Occupations - Protective service occupations (%)
Most Common Occupations - Fire fighting and prevention, and other protective service workers including supervisors (%)
Most Common Occupations - Law enforcement workers including supervisors (%)
Most Common Occupations - Food preparation and serving related occupations (%)
Most Common Occupations - Building and grounds cleaning and maintenance occupations (%)
Most Common Occupations - Personal care and service occupations (%)
Most Common Occupations - Sales and office occupations (%)
Most Common Occupations - Sales and related occupations (%)
Most Common Occupations - Office and administrative support occupations (%)
Most Common Occupations - Natural resources, construction, and maintenance occupations (%)
Most Common Occupations - Farming, fishing, and forestry occupations (%)
Most Common Occupations - Construction and extraction occupations (%)
Most Common Occupations - Installation, maintenance, and repair occupations (%)
Most Common Occupations - Production, transportation, and material moving occupations (%)
Most Common Occupations - Production occupations (%)
Most Common Occupations - Transportation occupations (%)
Most Common Occupations - Material moving occupations (%)
People in Group quarters - Institutionalized population (%)
People in Group quarters - Correctional institutions (%)
People in Group quarters - Federal prisons and detention centers (%)
People in Group quarters - Halfway houses (%)
People in Group quarters - Local jails and other confinement facilities (including police lockups) (%)
People in Group quarters - Military disciplinary barracks (%)
People in Group quarters - State prisons (%)
People in Group quarters - Other types of correctional institutions (%)
People in Group quarters - Nursing homes (%)
People in Group quarters - Hospitals/wards, hospices, and schools for the handicapped (%)
People in Group quarters - Hospitals/wards and hospices for chronically ill (%)
People in Group quarters - Hospices or homes for chronically ill (%)
People in Group quarters - Military hospitals or wards for chronically ill (%)
People in Group quarters - Other hospitals or wards for chronically ill (%)
People in Group quarters - Hospitals or wards for drug/alcohol abuse (%)
People in Group quarters - Mental (Psychiatric) hospitals or wards (%)
People in Group quarters - Schools, hospitals, or wards for the mentally retarded (%)
People in Group quarters - Schools, hospitals, or wards for the physically handicapped (%)
People in Group quarters - Institutions for the deaf (%)
People in Group quarters - Institutions for the blind (%)
People in Group quarters - Orthopedic wards and institutions for the physically handicapped (%)
People in Group quarters - Wards in general hospitals for patients who have no usual home elsewhere (%)
People in Group quarters - Wards in military hospitals for patients who have no usual home elsewhere (%)
People in Group quarters - Juvenile institutions (%)
People in Group quarters - Long-term care (%)
People in Group quarters - Homes for abused, dependent, and neglected children (%)
People in Group quarters - Residential treatment centers for emotionally disturbed children (%)
People in Group quarters - Training schools for juvenile delinquents (%)
People in Group quarters - Short-term care, detention or diagnostic centers for delinquent children (%)
People in Group quarters - Type of juvenile institution unknown (%)
People in Group quarters - Noninstitutionalized population (%)
People in Group quarters - College dormitories (includes college quarters off campus) (%)
People in Group quarters - Military quarters (%)
People in Group quarters - On base (%)
People in Group quarters - Barracks, unaccompanied personnel housing (UPH), (Enlisted/Officer), ;and similar group living quarters for military personnel (%)
People in Group quarters - Transient quarters for temporary residents (%)
People in Group quarters - Military ships (%)
People in Group quarters - Group homes (%)
People in Group quarters - Homes or halfway houses for drug/alcohol abuse (%)
People in Group quarters - Homes for the mentally ill (%)
People in Group quarters - Homes for the mentally retarded (%)
People in Group quarters - Homes for the physically handicapped (%)
People in Group quarters - Other group homes (%)
People in Group quarters - Religious group quarters (%)
People in Group quarters - Dormitories (%)
People in Group quarters - Agriculture workers' dormitories on farms (%)
People in Group quarters - Job Corps and vocational training facilities (%)
People in Group quarters - Other workers' dormitories (%)
People in Group quarters - Crews of maritime vessels (%)
People in Group quarters - Other nonhousehold living situations (%)
People in Group quarters - Other noninstitutional group quarters (%)
Residents speaking English at home (%)
Residents speaking English at home - Born in the United States (%)
Residents speaking English at home - Native, born elsewhere (%)
Residents speaking English at home - Foreign born (%)
Residents speaking Spanish at home (%)
Residents speaking Spanish at home - Born in the United States (%)
Residents speaking Spanish at home - Native, born elsewhere (%)
Residents speaking Spanish at home - Foreign born (%)
Residents speaking other language at home (%)
Residents speaking other language at home - Born in the United States (%)
Residents speaking other language at home - Native, born elsewhere (%)
Residents speaking other language at home - Foreign born (%)
Class of Workers - Employee of private company (%)
Class of Workers - Self-employed in own incorporated business (%)
Class of Workers - Private not-for-profit wage and salary workers (%)
Class of Workers - Local government workers (%)
Class of Workers - State government workers (%)
Class of Workers - Federal government workers (%)
Class of Workers - Self-employed workers in own not incorporated business and Unpaid family workers (%)
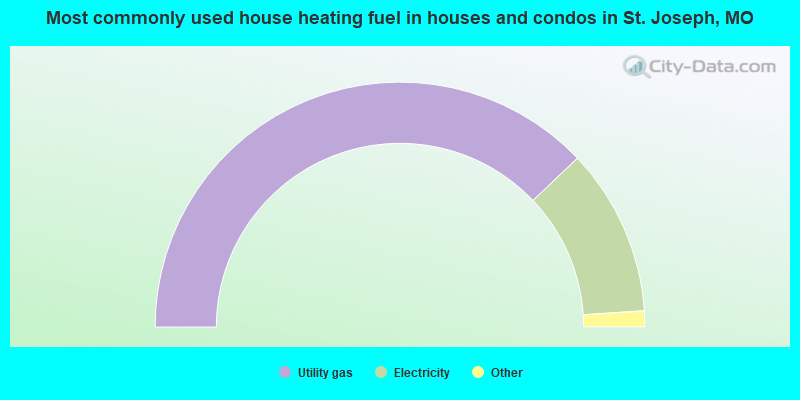
House heating fuel used in houses and condos - Utility gas (%)
House heating fuel used in houses and condos - Bottled, tank, or LP gas (%)
House heating fuel used in houses and condos - Electricity (%)
House heating fuel used in houses and condos - Fuel oil, kerosene, etc. (%)
House heating fuel used in houses and condos - Coal or coke (%)
House heating fuel used in houses and condos - Wood (%)
House heating fuel used in houses and condos - Solar energy (%)
House heating fuel used in houses and condos - Other fuel (%)
House heating fuel used in houses and condos - No fuel used (%)
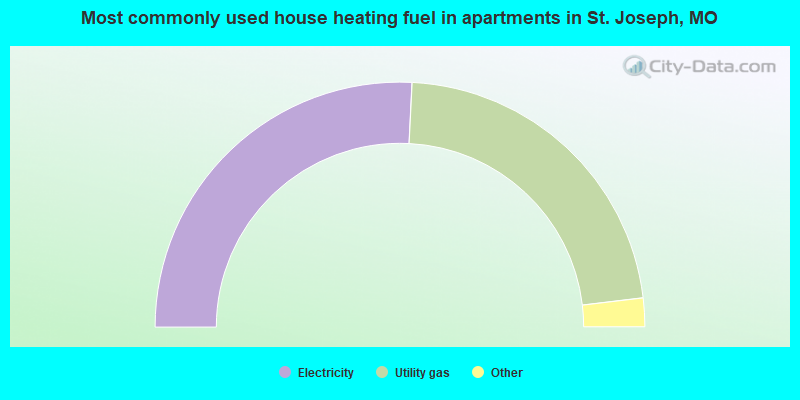
House heating fuel used in apartments - Utility gas (%)
House heating fuel used in apartments - Bottled, tank, or LP gas (%)
House heating fuel used in apartments - Electricity (%)
House heating fuel used in apartments - Fuel oil, kerosene, etc. (%)
House heating fuel used in apartments - Coal or coke (%)
House heating fuel used in apartments - Wood (%)
House heating fuel used in apartments - Solar energy (%)
House heating fuel used in apartments - Other fuel (%)
House heating fuel used in apartments - No fuel used (%)
Armed forces status - In Armed Forces (%)
Armed forces status - Civilian (%)
Armed forces status - Civilian - Veteran (%)
Armed forces status - Civilian - Nonveteran (%)
Fatal accidents locations in years 2005-2021
Fatal accidents locations in 2005
Fatal accidents locations in 2006
Fatal accidents locations in 2007
Fatal accidents locations in 2008
Fatal accidents locations in 2009
Fatal accidents locations in 2010
Fatal accidents locations in 2011
Fatal accidents locations in 2012
Fatal accidents locations in 2013
Fatal accidents locations in 2014
Fatal accidents locations in 2015
Fatal accidents locations in 2016
Fatal accidents locations in 2017
Fatal accidents locations in 2018
Fatal accidents locations in 2019
Fatal accidents locations in 2020
Fatal accidents locations in 2021
Alcohol use - People drinking some alcohol every month (%)
Alcohol use - People not drinking at all (%)
Alcohol use - Average days/month drinking alcohol
Alcohol use - Average drinks/week
Alcohol use - Average days/year people drink much
Audiometry - Average condition of hearing (%)
Audiometry - People that can hear a whisper from across a quiet room (%)
Audiometry - People that can hear normal voice from across a quiet room (%)
Audiometry - Ears ringing, roaring, buzzing (%)
Audiometry - Had a job exposure to loud noise (%)
Audiometry - Had off-work exposure to loud noise (%)
Blood Pressure & Cholesterol - Has high blood pressure (%)
Blood Pressure & Cholesterol - Checking blood pressure at home (%)
Blood Pressure & Cholesterol - Frequently checking blood cholesterol (%)
Blood Pressure & Cholesterol - Has high cholesterol level (%)
Consumer Behavior - Money monthly spent on food at supermarket/grocery store
Consumer Behavior - Money monthly spent on food at other stores
Consumer Behavior - Money monthly spent on eating out
Consumer Behavior - Money monthly spent on carryout/delivered foods
Consumer Behavior - Income spent on food at supermarket/grocery store (%)
Consumer Behavior - Income spent on food at other stores (%)
Consumer Behavior - Income spent on eating out (%)
Consumer Behavior - Income spent on carryout/delivered foods (%)
Current Health Status - General health condition (%)
Current Health Status - Blood donors (%)
Current Health Status - Has blood ever tested for HIV virus (%)
Current Health Status - Left-handed people (%)
Dermatology - People using sunscreen (%)
Diabetes - Diabetics (%)
Diabetes - Had a blood test for high blood sugar (%)
Diabetes - People taking insulin (%)
Diet Behavior & Nutrition - Diet health (%)
Diet Behavior & Nutrition - Milk product consumption (# of products/month)
Diet Behavior & Nutrition - Meals not home prepared (#/week)
Diet Behavior & Nutrition - Meals from fast food or pizza place (#/week)
Diet Behavior & Nutrition - Ready-to-eat foods (#/month)
Diet Behavior & Nutrition - Frozen meals/pizza (#/month)
Drug Use - People that ever used marijuana or hashish (%)
Drug Use - Ever used hard drugs (%)
Drug Use - Ever used any form of cocaine (%)
Drug Use - Ever used heroin (%)
Drug Use - Ever used methamphetamine (%)
Health Insurance - People covered by health insurance (%)
Kidney Conditions-Urology - Avg. # of times urinating at night
Medical Conditions - People with asthma (%)
Medical Conditions - People with anemia (%)
Medical Conditions - People with psoriasis (%)
Medical Conditions - People with overweight (%)
Medical Conditions - Elderly people having difficulties in thinking or remembering (%)
Medical Conditions - People who ever received blood transfusion (%)
Medical Conditions - People having trouble seeing even with glass/contacts (%)
Medical Conditions - People with arthritis (%)
Medical Conditions - People with gout (%)
Medical Conditions - People with congestive heart failure (%)
Medical Conditions - People with coronary heart disease (%)
Medical Conditions - People with angina pectoris (%)
Medical Conditions - People who ever had heart attack (%)
Medical Conditions - People who ever had stroke (%)
Medical Conditions - People with emphysema (%)
Medical Conditions - People with thyroid problem (%)
Medical Conditions - People with chronic bronchitis (%)
Medical Conditions - People with any liver condition (%)
Medical Conditions - People who ever had cancer or malignancy (%)
Mental Health - People who have little interest in doing things (%)
Mental Health - People feeling down, depressed, or hopeless (%)
Mental Health - People who have trouble sleeping or sleeping too much (%)
Mental Health - People feeling tired or having little energy (%)
Mental Health - People with poor appetite or overeating (%)
Mental Health - People feeling bad about themself (%)
Mental Health - People who have trouble concentrating on things (%)
Mental Health - People moving or speaking slowly or too fast (%)
Mental Health - People having thoughts they would be better off dead (%)
Oral Health - Average years since last visit a dentist
Oral Health - People embarrassed because of mouth (%)
Oral Health - People with gum disease (%)
Oral Health - General health of teeth and gums (%)
Oral Health - Average days a week using dental floss/device
Oral Health - Average days a week using mouthwash for dental problem
Oral Health - Average number of teeth
Pesticide Use - Households using pesticides to control insects (%)
Pesticide Use - Households using pesticides to kill weeds (%)
Physical Activity - People doing vigorous-intensity work activities (%)
Physical Activity - People doing moderate-intensity work activities (%)
Physical Activity - People walking or bicycling (%)
Physical Activity - People doing vigorous-intensity recreational activities (%)
Physical Activity - People doing moderate-intensity recreational activities (%)
Physical Activity - Average hours a day doing sedentary activities
Physical Activity - Average hours a day watching TV or videos
Physical Activity - Average hours a day using computer
Physical Functioning - People having limitations keeping them from working (%)
Physical Functioning - People limited in amount of work they can do (%)
Physical Functioning - People that need special equipment to walk (%)
Physical Functioning - People experiencing confusion/memory problems (%)
Physical Functioning - People requiring special healthcare equipment (%)
Prescription Medications - Average number of prescription medicines taking
Preventive Aspirin Use - Adults 40+ taking low-dose aspirin (%)
Reproductive Health - Vaginal deliveries (%)
Reproductive Health - Cesarean deliveries (%)
Reproductive Health - Deliveries resulted in a live birth (%)
Reproductive Health - Pregnancies resulted in a delivery (%)
Reproductive Health - Women breastfeeding newborns (%)
Reproductive Health - Women that had a hysterectomy (%)
Reproductive Health - Women that had both ovaries removed (%)
Reproductive Health - Women that have ever taken birth control pills (%)
Reproductive Health - Women taking birth control pills (%)
Reproductive Health - Women that have ever used Depo-Provera or injectables (%)
Reproductive Health - Women that have ever used female hormones (%)
Sexual Behavior - People 18+ that ever had sex (vaginal, anal, or oral) (%)
Sexual Behavior - Males 18+ that ever had vaginal sex with a woman (%)
Sexual Behavior - Males 18+ that ever performed oral sex on a woman (%)
Sexual Behavior - Males 18+ that ever had anal sex with a woman (%)
Sexual Behavior - Males 18+ that ever had any sex with a man (%)
Sexual Behavior - Females 18+ that ever had vaginal sex with a man (%)
Sexual Behavior - Females 18+ that ever performed oral sex on a man (%)
Sexual Behavior - Females 18+ that ever had anal sex with a man (%)
Sexual Behavior - Females 18+ that ever had any kind of sex with a woman (%)
Sexual Behavior - Average age people first had sex
Sexual Behavior - Average number of female sex partners in lifetime (males 18+)
Sexual Behavior - Average number of female vaginal sex partners in lifetime (males 18+)
Sexual Behavior - Average age people first performed oral sex on a woman (18+)
Sexual Behavior - Average number of woman performed oral sex on in lifetime (18+)
Sexual Behavior - Average number of male sex partners in lifetime (males 18+)
Sexual Behavior - Average number of male anal sex partners in lifetime (males 18+)
Sexual Behavior - Average age people first performed oral sex on a man (18+)
Sexual Behavior - Average number of male oral sex partners in lifetime (18+)
Sexual Behavior - People using protection when performing oral sex (%)
Sexual Behavior - Average number of times people have vaginal or anal sex a year
Sexual Behavior - People having sex without condom (%)
Sexual Behavior - Average number of male sex partners in lifetime (females 18+)
Sexual Behavior - Average number of male vaginal sex partners in lifetime (females 18+)
Sexual Behavior - Average number of female sex partners in lifetime (females 18+)
Sexual Behavior - Circumcised males 18+ (%)
Sleep Disorders - Average hours sleeping at night
Sleep Disorders - People that has trouble sleeping (%)
Smoking-Cigarette Use - People smoking cigarettes (%)
Taste & Smell - People 40+ having problems with smell (%)
Taste & Smell - People 40+ having problems with taste (%)
Taste & Smell - People 40+ that ever had wisdom teeth removed (%)
Taste & Smell - People 40+ that ever had tonsils teeth removed (%)
Taste & Smell - People 40+ that ever had a loss of consciousness because of a head injury (%)
Taste & Smell - People 40+ that ever had a broken nose or other serious injury to face or skull (%)
Taste & Smell - People 40+ that ever had two or more sinus infections (%)
Weight - Average height (inches)
Weight - Average weight (pounds)
Weight - Average BMI
Weight - People that are obese (%)
Weight - People that ever were obese (%)
Weight - People trying to lose weight (%)
The City-Data.com crime index weighs serious crimes and violent crimes more heavily. Higher means more crime, U.S. average is 246.1. It adjusts for the number of visitors and daily workers commuting into cities.
- means the value is smaller than the state average.
- means the value is about the same as the state average.
- means the value is bigger than the state average.
- means the value is much bigger than the state average.
Crime rate in St. Joseph detailed stats: murders, rapes, robberies, assaults, burglaries, thefts, arson Officers per 1,000 residents here:
1.71Missouri average:
2.53
Latest news from St. Joseph, MO collected exclusively by city-data.com from local newspapers, TV, and radio stations
Ancestries: German (20.6%), American (11.4%), Irish (10.0%), English (8.8%), Polish (2.5%), Scottish (1.7%).
Current Local Time:
Land area: 43.8 square miles.
Population density: 1,612 people per square mile (low).
3,089 residents are foreign born (2.4% Latin America , 1.3% Asia , 0.5% Africa ).
This city:
4.4%Missouri:
4.2%
Median real estate property taxes paid for housing units with mortgages in 2022: $1,191 (0.8%)Median real estate property taxes paid for housing units with no mortgage in 2022: $1,145 (0.8%)
Nearest city with pop. 200,000+: Kansas City, MO
Nearest city with pop. 1,000,000+: Chicago, IL
Nearest cities:
Cosby, MO (3.3 miles),
Latitude: 39.76 N, Longitude: 94.84 W
Daytime population change due to commuting: +13,763 (+19.5%)Workers who live and work in this city: 26,506 (85.4%)
St. Joseph tourist attractions:
Single-family new house construction building permits:
2022: 32 buildings , average cost: $237,5002021: 43 buildings , average cost: $244,4002020: 45 buildings , average cost: $226,4002019: 47 buildings , average cost: $260,1002018: 42 buildings , average cost: $180,5002017: 64 buildings , average cost: $185,4002016: 52 buildings , average cost: $195,5002015: 54 buildings , average cost: $177,5002014: 54 buildings , average cost: $199,8002013: 70 buildings , average cost: $169,6002012: 63 buildings , average cost: $195,8002011: 53 buildings , average cost: $184,2002010: 58 buildings , average cost: $152,0002009: 76 buildings , average cost: $179,7002008: 55 buildings , average cost: $194,4002007: 99 buildings , average cost: $174,7002006: 108 buildings , average cost: $161,0002005: 136 buildings , average cost: $162,7002004: 121 buildings , average cost: $170,5002003: 156 buildings , average cost: $137,9002002: 122 buildings , average cost: $143,2002001: 104 buildings , average cost: $151,9002000: 146 buildings , average cost: $121,4001999: 143 buildings , average cost: $133,0001998: 130 buildings , average cost: $128,5001997: 78 buildings , average cost: $133,000Unemployment in December 2023:
Population change in the 1990s: +1,902 (+2.6%).
Most common occupations in St. Joseph, MO (%)
Both Males Females
Cooks and food preparation workers (7.2%)
Other production occupations, including supervisors (5.4%)
Food processing workers (4.1%)
Building and grounds cleaning and maintenance occupations (3.7%)
Nursing, psychiatric, and home health aides (3.6%)
Cashiers (3.4%)
Material recording, scheduling, dispatching, and distributing workers (3.3%)
Other production occupations, including supervisors (8.4%)
Cooks and food preparation workers (6.2%)
Food processing workers (5.4%)
Driver/sales workers and truck drivers (4.4%)
Material recording, scheduling, dispatching, and distributing workers (4.1%)
Building and grounds cleaning and maintenance occupations (4.0%)
Electrical equipment mechanics and other installation, maintenance, and repair workers, including supervisors (3.9%)
Cooks and food preparation workers (8.4%)
Nursing, psychiatric, and home health aides (6.7%)
Secretaries and administrative assistants (4.8%)
Health technologists and technicians (4.7%)
Other office and administrative support workers, including supervisors (4.4%)
Cashiers (4.2%)
Registered nurses (3.8%)
Tornado activity:
St. Joseph-area historical tornado activity is slightly above Missouri state average. It is 102% greater than the overall U.S. average.
On 4/10/1965, a category F3 (max. wind speeds 158-206 mph) tornado 7.6 miles away from the St. Joseph city center injured 11 people and caused between $50,000 and $500,000 in damages.
On 5/29/2004, a category F4 (max. wind speeds 207-260 mph) tornado 32.3 miles away from the city center killed 3 people and injured 6 people and caused $300,000 in damages.
Earthquake activity:
St. Joseph-area historical earthquake activity is significantly above Missouri state average. It is 446% greater than the overall U.S. average. On 9/3/2016 at 12:02:44, a magnitude 5.8 (5.8 MW, Depth: 3.5 mi, Class: Moderate, Intensity: VI - VII) earthquake occurred 257.1 miles away from St. Joseph center On 11/6/2011 at 03:53:10, a magnitude 5.7 (5.7 MW, Depth: 3.2 mi) earthquake occurred 310.8 miles away from St. Joseph center On 11/12/2014 at 21:40:00, a magnitude 4.9 (4.9 MW, Depth: 2.5 mi, Class: Light, Intensity: IV - V) earthquake occurred 228.6 miles away from St. Joseph center On 11/7/2016 at 01:44:24, a magnitude 5.0 (5.0 MW, Depth: 2.8 mi) earthquake occurred 281.8 miles away from St. Joseph center On 2/13/2016 at 17:07:06, a magnitude 5.1 (5.1 MW, Depth: 5.2 mi) earthquake occurred 309.0 miles away from the city center On 1/19/2020 at 19:08:42, a magnitude 4.5 (4.5 MW, Depth: 3.1 mi) earthquake occurred 207.1 miles away from St. Joseph center Magnitude types: moment magnitude (MW) Natural disasters: The number of natural disasters in Buchanan County (25) is a lot greater than the US average (15).Major Disasters (Presidential) Declared: 16Emergencies Declared: 6Floods: 16, Storms: 13, Tornadoes: 6, Winter Storms: 5, Winds: 2, Drought: 1, Heavy Rain: 1, Hurricane: 1, Ice Storm: 1, Snowstorm: 1, Other: 1 (Note: some incidents may be assigned to more than one category). Hospitals and medical centers near St. Joseph: WOODLAND HILLS 2 B (Hospital, about 1 miles away; SAINT JOSEPH, MO)
CHOICES OF ST JOSEPH (Hospital, about 1 miles away; ST JOSEPH, MO)
HEARTLAND REGIONAL MEDICAL CENTER - WEST (Nursing Home, about 2 miles away; ST JOSEPH, MO)
HEARTLAND HOME HEALTH (Home Health Center, about 2 miles away; SAINT JOSEPH, MO)
HANDS OF HOPE HOSPICE (Hospital, about 2 miles away; SAINT JOSEPH, MO)
ARBOR VIEW HEALTHCARE AND REHABILITATION CENTER (Nursing Home, about 3 miles away; SAINT JOSEPH, MO)
SILVER LININGS HEALTHCARE INC (Home Health Center, about 3 miles away; SAINT JOSEPH, MO)
Amtrak station: ST. JOSEPH (4225 FREDERICK AVE.) - Bus Station
.
Services: full-service food facilities, call for taxi service.
Colleges/universities with over 2000 students nearest to St. Joseph:
Missouri Western State University (about 3 miles; Saint Joseph, MO ; Full-time enrollment: 4,557)
Highland Community College (about 25 miles; Highland, KS ; FT enrollment: 2,148)
Grantham University (about 37 miles; Kansas City, MO ; FT enrollment: 8,385)
Park University (about 41 miles; Parkville, MO ; FT enrollment: 9,131)
Northwest Missouri State University (about 42 miles; Maryville, MO ; FT enrollment: 5,946)
Kansas City Kansas Community College (about 45 miles; Kansas City, KS ; FT enrollment: 4,718)
Metropolitan Community College-Kansas City (about 50 miles; Kansas City, MO ; FT enrollment: 12,834)
Public high schools in St. Joseph: CENTRAL HIGH Students: 1,548, Location: 2602 EDMOND, Grades: 9-12)BENTON HIGH Students: 879, Location: 5655 S FOURTH, Grades: 9-12)LAFAYETTE HIGH Students: 763, Location: 412 HIGHLAND AVE, Grades: 9-12)COLGAN ALT. RESOURCE CTR. Students: 306, Location: 3510 FREDERICK AVE, Grades: KG-12)BUCHANAN CO. ACADEMY Students: 12, Location: 4720 GREEN ACRES, Grades: KG-12)RIVERBEND TREATMENT CTR. Location: 5910 MITCHELL AVE, Grades: 6-12)
HELEN M DAVIS SCHOOL Location: 2900 SCOTT ST, Grades: KG-12)
HILLYARD TECHNICAL CTR. Location: 3434 FARAON, Grades: 9-12)Biggest public elementary/middle schools in St. Joseph: BODE MIDDLE Students: 531, Location: 720 N NOYES BLVD, Grades: 7-8)COLEMAN ELEM. Students: 502, Location: 3312 BECK RD, Grades: PK-6)SKAITH ELEM. Students: 461, Location: 4701 SCHOOLSIDE LN, Grades: PK-6)LINDBERGH ELEM. Students: 457, Location: 2812 ST JOSEPH AVE, Grades: PK-6)SPRING GARDEN MIDDLE Students: 417, Location: 5802 S 22ND, Grades: 7-8)ROBIDOUX MIDDLE Students: 385, Location: 4212 ST JOSEPH AVE, Grades: 7-8)PARKWAY ELEM. Students: 347, Location: 2900 DUNCAN, Grades: PK-6)FIELD ELEM. Students: 338, Location: 2602 GENE FIELD, Grades: KG-6)HUMBOLDT ELEM. Students: 335, Location: 1520 N SECOND ST, Grades: PK-6)EDISON ELEM. Students: 311, Location: 515 N 22ND, Grades: PK-6)See full list of schools located in St. Joseph Libraries in St. Joseph: ST JOSEPH PUBLIC LIBRARY Operating income: $2,916,873; Location: 927 FELIX STREET; 285,461 books ; 1,898 e-books ; 13,990 audio materials ; 15,816 video materials ; 5 local licensed databases ; 14 state licensed databases ; 470 print serial subscriptions ; 12 electronic serial subscriptions )
ROLLING HILLS CONSOLIDATED Operating income: $2,367,455; Location: 1912 N. BELT HWY.; 144,826 books ; 10,095 audio materials ; 10,780 video materials ; 9 local licensed databases ; 14 state licensed databases ; 1 other licensed databases ; 316 print serial subscriptions ; 11 electronic serial subscriptions )
User-submitted facts and corrections:
Missouri Western State College is now Missouri Western State University
Under "churches in Saint Joseph", please add: Riverside Church 5401 Mitchell Avenue Saint Joseph, MO 64507
Home of the "Dirty Sanchez" Bar and Grill, the first mexican Bar and Cantina opened before the turn of the century.
Saint Joseph, MO High Schools Central High School 9-12 1,721 students Benton High School 9-12 939 students Lafayette High School 9-12 905 studnets
I believe St. Joe has added a new area code....816. My mother lives there and that is the area code that I have to dial.
Please add to list of FM radio stations: KSRD (91.9 FM; ST. JOSEPH, MO; Owner: HORIZON CHRISTIAN FELLOWSHIP) Also, please note & change: K220FX has moved to 92.3 FM
hi i just wanted to let u know there are more zip codes for st. joseph.... 64501 64502 64503 64504 64505 64506 64507 64508 i'm just letting u all know because if someone wants to look for a house by zip code it might be more helpful to them. thanks!
Elementary School: Bessie Ellison Elementery
Saint Joseph, MO High Schools Central High School 9-12 1,721 students Benton High School 9-12 939 students Lafayette High School 9-12 905 studnets
Notable locations in St. Joseph: (A) , Water Works (B) , Terminal Junction (C) , Jesse James Home (D) , Patee Home (E) , County Boys Home (F) , Saint Joseph Fire Department Station 5 (G) , Saint Joseph Fire Department Station 6 (H) , Saint Joseph Fire Department Station 9 (I) , Saint Joseph Fire Department Station 10 (J) , Saint Joseph Fire Department Station 11 (K) , Missouri Department of Conservation Forestry Northwest Regional Field Fire Office Saint Joseph (L) , Saint Joseph Fire Department Station 1 Headquarters (M) , Saint Joseph Fire Department Station 4 (N) , Saint Joseph Fire Department Station 12 (O) , Saint Joseph Fire Department Station 8 (P) . Display/hide their locations on the map
Churches in St. Joseph include: (A) , Oak Grove Church (B) , Faith Church (C) , Saint Paul Church (D) , Saint Peter Church (E) , Woodbine Church (F) . Display/hide their locations on the map
Cemeteries: (1) , Mount Auburn Cemetery (2) , Mount Mora Cemetery (3) , Mount Olivet Cemetery (4) , Nelson Cemetery (5) , New King Hill Cemetery (6) , Ashland Cemetery (7) . Display/hide their locations on the map
Streams, rivers, and creeks: (A) , Roys Branch (B) . Display/hide their locations on the map
Parks in St. Joseph include: (1) , Lewis Park (2) , Patee Park (3) , River Bluffs Park (4) , Mitchell Park (5) , Hyde Park (6) , Huston Wyeth Park (7) , France Park (8) , Bartlett Park (9) . Display/hide their locations on the map
Birthplace of: Jim Webb - Politician, Betty Garrett - Actress, Bill Snyder - College football coach, Walter Cronkite - Television journalist, Brian Keith McDonald - Screenwriter, Eminem - Hip Hop rapper, Ryan Bradley - Figure skater, Jody Hamilton - Professional wrestler, Jane Wyman - Actress, Larry Hamilton - Professional wrestler.
Buchanan County has a predicted average indoor radon screening level greater than 4 pCi/L (pico curies per liter) - Highest Potential Average household size: This city:
2.4 peopleMissouri:
2.5 people
Percentage of family households: This city:
62.2%Whole state:
65.3%
Percentage of households with unmarried partners: This city:
8.5%Whole state:
6.7%
Likely homosexual households (counted as self-reported same-sex unmarried-partner households)
Lesbian couples: 0.4% of all households Gay men: 0.2% of all households
People in group quarters in St. Joseph in 2010:
2,049 people in state prisons
968 people in college/university student housing
673 people in nursing facilities/skilled-nursing facilities
161 people in local jails and other municipal confinement facilities
157 people in other noninstitutional facilities
145 people in group homes intended for adults
130 people in mental (psychiatric) hospitals and psychiatric units in other hospitals
103 people in emergency and transitional shelters (with sleeping facilities) for people experiencing homelessness
45 people in correctional residential facilities
25 people in residential treatment centers for juveniles (non-correctional)
21 people in correctional facilities intended for juveniles
16 people in residential treatment centers for adults
People in group quarters in St. Joseph in 2000:
1,946 people in state prisons
956 people in college dormitories (includes college quarters off campus)
740 people in nursing homes
241 people in other noninstitutional group quarters
167 people in local jails and other confinement facilities (including police lockups)
128 people in homes for the mentally ill
118 people in mental (psychiatric) hospitals or wards
57 people in wards in general hospitals for patients who have no usual home elsewhere
55 people in institutions for the deaf
51 people in homes for the mentally retarded
46 people in homes for abused, dependent, and neglected children
40 people in homes or halfway houses for drug/alcohol abuse
27 people in training schools for juvenile delinquents
17 people in other nonhousehold living situations
15 people in other group homes
11 people in religious group quarters
3 people in short-term care, detention or diagnostic centers for delinquent children
Banks with branches in St. Joseph (2011 data):
The Nodaway Valley Bank: Belt And Faraon Branch, King Hill Branch, Cook Road Branch. Info updated 2007/05/31: Bank assets: $759.7 mil, Deposits: $639.9 mil, headquarters in Maryville, MO, positive income , Agricultural Specialization, 9 total offices , Holding Company: Nodaway Valley Bancshares, Inc.
Commerce Bank: 4th And Felix Streets Branch at 4th And Felix Streets, branch established on 1914/01/01; 36th & Frederick Branch at East 36th And Frederick, branch established on 1976/10/11. Info updated 2011/07/07: Bank assets: $20,493.6 mil, Deposits: $16,805.3 mil, headquarters in Kansas City, MO, positive income , 206 total offices , Holding Company: Commerce Bancshares, Inc.
Pony Express Community Bank: at 624 Felix Street, branch established on 1975/12/23; St. Joseph Branch at 3702 Faraon Street, branch established on 1998/12/14. Info updated 2010/05/18: Bank assets: $65.0 mil, Deposits: $57.9 mil, local headquarters , positive income , Agricultural Specialization, 5 total offices , Holding Company: Pony Express Bancorp, Inc.
Bank Midwest, National Association: St. Joseph Branch #49 at 801 N. 36th Street, branch established on 1934/08/01. Info updated 2012/03/19: Bank assets: $6,237.6 mil, Deposits: $5,064.6 mil, headquarters in Kansas City, MO, positive income , 138 total offices , Holding Company: Nbh Holdings Corp.
North American Savings Bank, F.S.B.: 920 Belt Highway Branch at 920 Belt Highway, branch established on 1923/01/01. Info updated 2011/07/21: Bank assets: $1,184.7 mil, Deposits: $889.0 mil, headquarters in Grandview, MO, negative income in the last year , Commercial Lending Specialization, 9 total offices
Citizens Bank and Trust Company: St. Joseph Branch at 3727 Frederick Boulevard, branch established on 1994/02/10. Info updated 2008/08/25: Bank assets: $867.0 mil, Deposits: $709.5 mil, headquarters in Chillicothe, MO, negative income in the last year , Commercial Lending Specialization, 19 total offices , Holding Company: Young Partners, L.P.
First Bank of Missouri: Sixth And Edmond Streets Branch at Sixth And Edmond Streets, branch established on 1904/07/26. Info updated 2010/08/12: Bank assets: $518.5 mil, Deposits: $413.8 mil, headquarters in Gladstone, MO, positive income , Commercial Lending Specialization, 10 total offices , Holding Company: Valley View Bancshares, Inc.
For population 15 years and over in St. Joseph:
Never married: 34.8%Now married: 41.0%Separated: 1.6%Widowed: 7.9%Divorced: 14.8% For population 25 years and over in St. Joseph:
High school or higher: 86.9%Bachelor's degree or higher: 22.1%Graduate or professional degree: 6.8%Unemployed: 6.4%Mean travel time to work (commute): 13.7 minutes
Education Gini index (Inequality in education) Here:
10.9Missouri average:
11.1
Religion statistics for St. Joseph, MO (based on Buchanan County data)
Religion Adherents Congregations Evangelical Protestant 24,772 64 Catholic 8,934 9 Mainline Protestant 7,475 28 Other 2,298 11 Black Protestant 416 3 None 45,306 -
Source: Clifford Grammich, Kirk Hadaway, Richard Houseal, Dale E.Jones, Alexei Krindatch, Richie Stanley and Richard H.Taylor. 2012. 2010 U.S.Religion Census: Religious Congregations & Membership Study. Association of Statisticians of American Religious Bodies. Jones, Dale E., et al. 2002. Congregations and Membership in the United States 2000. Nashville, TN: Glenmary Research Center. Graphs represent county-level data
Food Environment Statistics: Number of grocery stores : 13This county :
1.46 / 10,000 pop.Missouri :
1.88 / 10,000 pop.
Number of supercenters and club stores : 3Buchanan County :
0.34 / 10,000 pop.Missouri :
0.18 / 10,000 pop.
Number of convenience stores (no gas) : 4Here :
0.45 / 10,000 pop.Missouri :
0.60 / 10,000 pop.
Number of convenience stores (with gas) : 39Here :
4.38 / 10,000 pop.Missouri :
4.34 / 10,000 pop.
Number of full-service restaurants : 60Here :
6.74 / 10,000 pop.Missouri :
7.37 / 10,000 pop.
Adult obesity rate : Buchanan County :
32.0%State :
29.6%
Low-income preschool obesity rate : Buchanan County :
16.0%State :
13.5%
Health and Nutrition:
Average overall health of teeth and gums : Average BMI : This city:
28.5Missouri:
28.7
People feeling badly about themselves : This city:
21.7%Missouri:
20.6%
People not drinking alcohol at all : Average hours sleeping at night : Overweight people : St. Joseph:
33.5%Missouri:
34.3%
General health condition : Average condition of hearing : St. Joseph:
78.8%Missouri:
79.3%
More about Health and Nutrition of St. Joseph, MO Residents
St. Joseph government finances - Expenditure in 2021 (per resident):
Construction - Sewerage: $11,529,000 ($163.17)
Regular Highways: $8,183,000 ($115.81)General - Other: $7,799,000 ($110.38)Current Operations - Police Protection: $17,945,000 ($253.98)
Sewerage: $14,270,000 ($201.96)Local Fire Protection: $13,741,000 ($194.48)Regular Highways: $6,795,000 ($96.17)Parks and Recreation: $6,689,000 ($94.67)General - Other: $5,540,000 ($78.41)Transit Utilities: $5,253,000 ($74.35)Health - Other: $4,062,000 ($57.49)Financial Administration: $3,271,000 ($46.29)Solid Waste Management: $2,782,000 ($39.37)Central Staff Services: $2,220,000 ($31.42)Housing and Community Development: $1,928,000 ($27.29)Judicial and Legal Services: $1,352,000 ($19.13)Air Transportation: $649,000 ($9.19)Parking Facilities: $384,000 ($5.43)General - Interest on Debt: $26,897,000 ($380.68)
Other Capital Outlay - Transit Utilities: $4,060,000 ($57.46)
General - Other: $1,572,000 ($22.25)Parks and Recreation: $972,000 ($13.76)Solid Waste Management: $940,000 ($13.30)Air Transportation: $579,000 ($8.19)Police Protection: $548,000 ($7.76)Public Welfare - Other: $17,000 ($0.24)
St. Joseph government finances - Revenue in 2021 (per resident):
Charges - Sewerage: $31,654,000 ($448.00)
Solid Waste Management: $5,409,000 ($76.55)Other: $4,074,000 ($57.66)Parks and Recreation: $1,942,000 ($27.49)Air Transportation: $400,000 ($5.66)Parking Facilities: $310,000 ($4.39)Regular Highways: $186,000 ($2.63)Federal Intergovernmental - Housing and Community Development: $1,845,000 ($26.11)
Miscellaneous - Interest Earnings: $3,251,000 ($46.01)
General Revenue - Other: $1,298,000 ($18.37)Fines and Forfeits: $537,000 ($7.60)Donations From Private Sources: $213,000 ($3.01)Sale of Property: $106,000 ($1.50)Special Assessments: $20,000 ($0.28)Revenue - Transit Utilities: $295,000 ($4.18)
State Intergovernmental - Highways: $3,675,000 ($52.01)
General Local Government Support: $2,281,000 ($32.28)Transit Utilities: $1,923,000 ($27.22)Other: $143,000 ($2.02)Tax - General Sales and Gross Receipts: $39,160,000 ($554.23)
Property: $15,399,000 ($217.94)Occupation and Business License - Other: $7,170,000 ($101.48)Other License: $1,686,000 ($23.86)Other Selective Sales: $1,294,000 ($18.31)Tobacco Products Sales: $337,000 ($4.77)
St. Joseph government finances - Debt in 2021 (per resident):
Long Term Debt - Beginning Outstanding - Public Debt for Private Purpose: $384,912,000 ($5447.69)
Outstanding Nonguaranteed - Industrial Revenue: $288,097,000 ($4077.46)Beginning Outstanding - Unspecified Public Purpose: $189,283,000 ($2678.94)Outstanding Unspecified Public Purpose: $148,151,000 ($2096.79)Retired Nonguaranteed - Public Debt for Private Purpose: $96,815,000 ($1370.23)Retired Unspecified Public Purpose: $41,132,000 ($582.14)
St. Joseph government finances - Cash and Securities in 2021 (per resident):
Bond Funds - Cash and Securities: $9,172,000 ($129.81)
Other Funds - Cash and Securities: $129,369,000 ($1830.97)
Sinking Funds - Cash and Securities: $522,050,000 ($7388.62)
Businesses in St. Joseph, MO
Name Count Name Count
AT&T 3 Maurices 1 American Eagle Outfitters 1 McDonald's 5 Arby's 2 Men's Wearhouse 1 Bath & Body Works 1 Menards 1 Bed Bath & Beyond 1 Motherhood Maternity 1 Caribou Coffee 1 Nike 5 Church's Chicken 1 OfficeMax 1 Cold Stone Creamery 1 Panera Bread 1 Comfort Suites 1 Ramada 1 Cracker Barrel 1 Rue21 1 DressBarn 1 Sephora 1 Dressbarn 1 Shoe Carnival 1 Foot Locker 1 Starbucks 1 GNC 1 Target 1 Hobby Lobby 1 Toyota 1 IHOP 1 U.S. Cellular 1 Jimmy John's 1 YMCA 2 Kohl's 1
Strongest AM radio stations in St. Joseph:
KFEQ (680 AM; 5 kW; ST. JOSEPH, MO; Owner: EAGLE RADIO, INC.)
KGNM (1270 AM; 1 kW; ST. JOSEPH, MO)
KSFT (1550 AM; 5 kW; ST. JOSEPH, MO; Owner: EAGLE RADIO, INC)
WHB (810 AM; 50 kW; KANSAS CITY, MO; Owner: UNION BROADCASTING, INC.)
KCMO (710 AM; 10 kW; KANSAS CITY, MO; Owner: SUSQUEHANNA KANSAS CITY PARTNERSHIP)
KKHK (1250 AM; 25 kW; KANSAS CITY, KS)
KOIL (1020 AM; 50 kW; PLATTSMOUTH, NE; Owner: WAITT RADIO, INC.)
KAIR (1470 AM; 1 kW; ATCHISON, KS; Owner: KNZA INC.)
KFAB (1110 AM; 50 kW; OMAHA, NE; Owner: CAPSTAR TX LIMITED PARTNERSHIP)
KKLO (1410 AM; 5 kW; LEAVENWORTH, KS; Owner: CHARA COMMUNICATIONS, INC.)
KKAR (1290 AM; 50 kW; OMAHA, NE; Owner: WAITT RADIO, INC.)
KCCV (760 AM; daytime; 6 kW; OVERLAND PARK, KS; Owner: BOTT BROADCASTING COMPANY)
KCSP (610 AM; 5 kW; KANSAS CITY, MO; Owner: ENTERCOM KANSAS CITY LICENSE, LLC)
Strongest FM radio stations in St. Joseph:
K220FX (91.9 FM; ST. JOSEPH, MO; Owner: CALVARY CHAPEL OF TWIN FALLS, INC.)
KKJO-FM (105.5 FM; ST. JOSEPH, MO; Owner: EAGLE RADIO, INC)
KSJQ (92.7 FM; SAVANNAH, MO; Owner: EAGLE RADIO, INC.)
K209CT (89.7 FM; ST. JOSEPH, MO; Owner: COMMUNITY BROADCASTING, INC.)
TV broadcast stations around St. Joseph:
KQTV (Channel 2; ST. JOSEPH, MO; Owner: NEXSTAR BROADCASTING OF THE MIDWEST, INC.)
KTAJ (Channel 16; ST. JOSEPH, MO; Owner: TRINITY BROADCASTING NETWORK)
Medal of Honor Recipients
Medal of Honor Recipients born in St. Joseph: Forrest E. Peden, Herbert H. Burr, Orson L. Crandall.
National Bridge Inventory (NBI) Statistics 251 Number of bridges5,059ft / 1,542m Total length $101,086,000 Total costs1,461,760 Total average daily traffic229,337 Total average daily truck traffic
New bridges - historical statistics
4 1910-1919 3 1920-1929 1 1930-1939 1 1940-1949 26 1950-1959 49 1960-1969 87 1970-1979 33 1980-1989 28 1990-1999 13 2000-2009 6 2010-2019
See full National Bridge Inventory statistics for St. Joseph, MO
Home Mortgage Disclosure Act Aggregated Statistics For Year 2009(Based on 18 full and 5 partial tracts) A) FHA, FSA/RHS & VA B) Conventional C) Refinancings D) Home Improvement Loans E) Loans on Dwellings For 5+ Families F) Non-occupant Loans on G) Loans On Manufactured Number Average Value Number Average Value Number Average Value Number Average Value Number Average Value Number Average Value Number Average Value
LOANS ORIGINATED 363 $105,762 356 $92,402 1,204 $114,115 115 $35,041 10 $296,800 306 $71,014 5 $33,680 APPLICATIONS APPROVED, NOT ACCEPTED 19 $111,802 24 $98,795 106 $110,647 18 $34,589 0 $0 5 $82,544 1 $31,000 APPLICATIONS DENIED 36 $85,431 52 $73,750 472 $107,077 100 $25,742 0 $0 41 $71,733 11 $66,338 APPLICATIONS WITHDRAWN 35 $112,555 19 $106,761 312 $114,419 11 $44,933 0 $0 18 $62,037 1 $63,200 FILES CLOSED FOR INCOMPLETENESS 8 $90,244 3 $59,097 84 $122,661 8 $53,096 0 $0 2 $63,500 0 $0
Aggregated Statistics For Year 2008(Based on 18 full and 5 partial tracts) A) FHA, FSA/RHS & VA B) Conventional C) Refinancings D) Home Improvement Loans E) Loans on Dwellings For 5+ Families F) Non-occupant Loans on G) Loans On Manufactured Number Average Value Number Average Value Number Average Value Number Average Value Number Average Value Number Average Value Number Average Value
LOANS ORIGINATED 270 $104,129 478 $97,808 828 $97,169 155 $42,889 23 $397,914 368 $67,538 11 $53,306 APPLICATIONS APPROVED, NOT ACCEPTED 17 $96,459 32 $108,143 124 $107,724 20 $21,515 0 $0 24 $74,380 1 $20,000 APPLICATIONS DENIED 53 $92,297 98 $77,122 639 $99,440 177 $27,675 3 $678,000 61 $69,555 8 $35,162 APPLICATIONS WITHDRAWN 29 $101,352 32 $101,893 217 $107,477 18 $40,657 0 $0 15 $68,957 0 $0 FILES CLOSED FOR INCOMPLETENESS 8 $103,026 21 $104,297 63 $106,723 12 $43,185 0 $0 8 $57,216 0 $0
Aggregated Statistics For Year 2007(Based on 18 full and 5 partial tracts) A) FHA, FSA/RHS & VA B) Conventional C) Refinancings D) Home Improvement Loans E) Loans on Dwellings For 5+ Families F) Non-occupant Loans on G) Loans On Manufactured Number Average Value Number Average Value Number Average Value Number Average Value Number Average Value Number Average Value Number Average Value
LOANS ORIGINATED 113 $96,952 980 $86,748 1,109 $88,862 241 $35,449 12 $448,083 458 $63,999 21 $44,867 APPLICATIONS APPROVED, NOT ACCEPTED 4 $115,602 97 $100,190 227 $98,945 40 $44,752 0 $0 17 $71,275 6 $60,213 APPLICATIONS DENIED 24 $92,112 208 $80,945 1,067 $96,423 234 $43,548 0 $0 109 $74,983 21 $56,934 APPLICATIONS WITHDRAWN 5 $114,542 59 $89,115 345 $96,843 38 $75,023 0 $0 22 $64,644 3 $51,890 FILES CLOSED FOR INCOMPLETENESS 2 $86,000 42 $82,809 127 $97,856 8 $57,051 0 $0 12 $66,830 0 $0
Aggregated Statistics For Year 2006(Based on 18 full and 5 partial tracts) A) FHA, FSA/RHS & VA B) Conventional C) Refinancings D) Home Improvement Loans E) Loans on Dwellings For 5+ Families F) Non-occupant Loans on G) Loans On Manufactured Number Average Value Number Average Value Number Average Value Number Average Value Number Average Value Number Average Value Number Average Value
LOANS ORIGINATED 100 $101,995 1,327 $81,670 1,173 $84,745 236 $27,528 15 $771,552 461 $60,129 10 $51,050 APPLICATIONS APPROVED, NOT ACCEPTED 6 $97,667 147 $78,121 246 $89,474 38 $44,075 1 $713,000 27 $89,603 9 $83,163 APPLICATIONS DENIED 14 $74,926 284 $76,752 1,103 $81,523 261 $26,426 2 $46,500 84 $65,182 16 $55,436 APPLICATIONS WITHDRAWN 8 $110,688 134 $80,698 633 $88,279 53 $57,180 0 $0 37 $80,006 2 $62,010 FILES CLOSED FOR INCOMPLETENESS 3 $57,800 53 $79,432 141 $94,001 11 $64,909 1 $353,000 5 $49,466 0 $0
Aggregated Statistics For Year 2005(Based on 18 full and 5 partial tracts) A) FHA, FSA/RHS & VA B) Conventional C) Refinancings D) Home Improvement Loans E) Loans on Dwellings For 5+ Families F) Non-occupant Loans on G) Loans On Manufactured Number Average Value Number Average Value Number Average Value Number Average Value Number Average Value Number Average Value Number Average Value
LOANS ORIGINATED 129 $86,815 1,262 $79,225 1,495 $84,124 213 $35,096 6 $163,228 468 $58,919 13 $61,512 APPLICATIONS APPROVED, NOT ACCEPTED 6 $70,677 180 $72,242 271 $77,090 34 $31,089 0 $0 19 $66,153 6 $35,167 APPLICATIONS DENIED 20 $89,818 380 $69,397 1,309 $80,140 278 $26,049 2 $591,500 94 $63,586 29 $55,463 APPLICATIONS WITHDRAWN 6 $70,602 195 $77,843 857 $87,387 101 $93,295 0 $0 96 $68,003 14 $84,400 FILES CLOSED FOR INCOMPLETENESS 4 $76,735 47 $80,334 141 $92,615 4 $48,192 0 $0 15 $60,941 0 $0
Aggregated Statistics For Year 2004(Based on 18 full and 5 partial tracts) A) FHA, FSA/RHS & VA B) Conventional C) Refinancings D) Home Improvement Loans E) Loans on Dwellings For 5+ Families F) Non-occupant Loans on G) Loans On Manufactured Number Average Value Number Average Value Number Average Value Number Average Value Number Average Value Number Average Value Number Average Value
LOANS ORIGINATED 182 $85,985 1,116 $83,996 1,648 $83,725 202 $28,705 12 $182,638 467 $61,367 21 $45,687 APPLICATIONS APPROVED, NOT ACCEPTED 8 $88,049 129 $81,840 284 $75,651 27 $33,867 0 $0 37 $54,185 7 $44,690 APPLICATIONS DENIED 29 $79,382 284 $64,575 1,064 $77,230 258 $25,376 1 $80,000 75 $56,655 32 $38,390 APPLICATIONS WITHDRAWN 10 $77,114 88 $87,869 709 $78,486 56 $36,659 0 $0 46 $64,640 3 $42,840 FILES CLOSED FOR INCOMPLETENESS 4 $77,118 45 $83,259 108 $91,862 8 $21,958 0 $0 11 $68,435 1 $52,190
Aggregated Statistics For Year 2003(Based on 18 full and 5 partial tracts) A) FHA, FSA/RHS & VA B) Conventional C) Refinancings D) Home Improvement Loans E) Loans on Dwellings For 5+ Families F) Non-occupant Loans on Number Average Value Number Average Value Number Average Value Number Average Value Number Average Value Number Average Value
LOANS ORIGINATED 247 $80,180 935 $80,106 3,001 $82,687 175 $20,467 10 $185,400 513 $57,588 APPLICATIONS APPROVED, NOT ACCEPTED 3 $110,000 72 $85,398 351 $78,129 16 $23,392 0 $0 23 $54,393 APPLICATIONS DENIED 34 $73,733 229 $65,292 1,188 $73,644 146 $16,588 0 $0 80 $48,982 APPLICATIONS WITHDRAWN 13 $70,855 97 $76,480 713 $80,813 14 $29,380 0 $0 35 $59,653 FILES CLOSED FOR INCOMPLETENESS 2 $70,000 15 $65,818 110 $80,283 6 $30,828 0 $0 4 $43,750
Aggregated Statistics For Year 2002(Based on 18 full and 5 partial tracts) A) FHA, FSA/RHS & VA B) Conventional C) Refinancings D) Home Improvement Loans E) Loans on Dwellings For 5+ Families F) Non-occupant Loans on Number Average Value Number Average Value Number Average Value Number Average Value Number Average Value Number Average Value
LOANS ORIGINATED 271 $76,893 795 $77,007 2,114 $84,564 224 $18,535 13 $266,231 462 $61,772 APPLICATIONS APPROVED, NOT ACCEPTED 11 $78,152 90 $69,264 328 $76,702 22 $13,565 0 $0 14 $39,414 APPLICATIONS DENIED 25 $71,230 186 $53,484 841 $71,431 165 $13,335 3 $580,000 48 $44,834 APPLICATIONS WITHDRAWN 13 $73,677 71 $86,818 586 $77,994 28 $25,775 0 $0 26 $53,471 FILES CLOSED FOR INCOMPLETENESS 4 $62,000 32 $82,948 141 $80,531 2 $15,500 0 $0 6 $60,933
Aggregated Statistics For Year 2001(Based on 18 full and 5 partial tracts) A) FHA, FSA/RHS & VA B) Conventional C) Refinancings D) Home Improvement Loans E) Loans on Dwellings For 5+ Families F) Non-occupant Loans on Number Average Value Number Average Value Number Average Value Number Average Value Number Average Value Number Average Value
LOANS ORIGINATED 303 $71,985 762 $77,818 1,873 $79,267 304 $41,220 8 $174,775 400 $57,888 APPLICATIONS APPROVED, NOT ACCEPTED 8 $70,128 65 $81,561 269 $73,307 35 $27,506 0 $0 13 $44,382 APPLICATIONS DENIED 23 $69,551 262 $79,559 949 $64,143 210 $17,001 2 $602,500 70 $73,619 APPLICATIONS WITHDRAWN 10 $78,279 68 $76,644 745 $64,362 36 $20,019 0 $0 28 $47,363 FILES CLOSED FOR INCOMPLETENESS 7 $91,586 18 $73,385 123 $74,814 2 $22,335 0 $0 5 $57,200
Aggregated Statistics For Year 2000(Based on 18 full and 5 partial tracts) A) FHA, FSA/RHS & VA B) Conventional C) Refinancings D) Home Improvement Loans E) Loans on Dwellings For 5+ Families F) Non-occupant Loans on Number Average Value Number Average Value Number Average Value Number Average Value Number Average Value Number Average Value
LOANS ORIGINATED 256 $68,731 772 $71,666 909 $66,470 258 $16,326 10 $259,969 331 $55,436 APPLICATIONS APPROVED, NOT ACCEPTED 11 $70,263 93 $73,332 170 $60,119 66 $20,132 1 $23,000 16 $47,756 APPLICATIONS DENIED 11 $63,298 385 $61,292 561 $50,591 194 $16,915 0 $0 47 $48,692 APPLICATIONS WITHDRAWN 3 $64,333 90 $66,967 377 $50,009 31 $38,270 1 $338,000 15 $72,828 FILES CLOSED FOR INCOMPLETENESS 17 $60,838 23 $56,471 82 $67,953 3 $19,457 0 $0 7 $54,846
Aggregated Statistics For Year 1999(Based on 20 full and 7 partial tracts) A) FHA, FSA/RHS & VA B) Conventional C) Refinancings D) Home Improvement Loans E) Loans on Dwellings For 5+ Families F) Non-occupant Loans on Number Average Value Number Average Value Number Average Value Number Average Value Number Average Value Number Average Value
LOANS ORIGINATED 247 $65,172 851 $68,978 1,212 $61,123 417 $15,547 9 $285,667 377 $45,893 APPLICATIONS APPROVED, NOT ACCEPTED 5 $66,478 102 $65,963 300 $56,552 66 $16,240 0 $0 28 $39,884 APPLICATIONS DENIED 18 $65,633 378 $45,311 636 $51,296 209 $14,588 2 $75,000 43 $40,600 APPLICATIONS WITHDRAWN 12 $52,445 105 $60,547 423 $52,225 52 $23,943 1 $89,000 34 $54,345 FILES CLOSED FOR INCOMPLETENESS 6 $57,468 50 $56,279 100 $67,255 2 $19,385 0 $0 12 $40,102
Detailed mortgage data for all 23 tracts in St. Joseph, MO
Private Mortgage Insurance Companies Aggregated Statistics For Year 2009(Based on 17 full and 4 partial tracts) A) Conventional B) Refinancings C) Non-occupant Loans on Number Average Value Number Average Value Number Average Value
LOANS ORIGINATED 50 $110,434 60 $132,637 0 $0 APPLICATIONS APPROVED, NOT ACCEPTED 9 $123,111 16 $139,948 1 $136,000 APPLICATIONS DENIED 12 $160,752 7 $124,826 0 $0 APPLICATIONS WITHDRAWN 2 $224,185 3 $168,023 0 $0 FILES CLOSED FOR INCOMPLETENESS 0 $0 1 $159,000 0 $0
Aggregated Statistics For Year 2008(Based on 16 full and 5 partial tracts) A) Conventional B) Refinancings C) Non-occupant Loans on Number Average Value Number Average Value Number Average Value
LOANS ORIGINATED 172 $110,443 90 $119,504 20 $66,450 APPLICATIONS APPROVED, NOT ACCEPTED 49 $91,272 44 $117,557 12 $71,882 APPLICATIONS DENIED 17 $87,980 6 $117,730 10 $86,620 APPLICATIONS WITHDRAWN 5 $71,800 2 $100,515 0 $0 FILES CLOSED FOR INCOMPLETENESS 6 $84,135 3 $130,417 2 $164,000
Aggregated Statistics For Year 2007(Based on 18 full and 5 partial tracts) A) Conventional B) Refinancings C) Non-occupant Loans on Number Average Value Number Average Value Number Average Value
LOANS ORIGINATED 458 $91,888 134 $115,995 37 $75,753 APPLICATIONS APPROVED, NOT ACCEPTED 55 $87,171 32 $110,140 6 $55,465 APPLICATIONS DENIED 4 $53,960 4 $62,750 3 $61,280 APPLICATIONS WITHDRAWN 21 $81,929 8 $105,062 3 $57,000 FILES CLOSED FOR INCOMPLETENESS 2 $71,000 2 $71,500 0 $0
Aggregated Statistics For Year 2006(Based on 18 full and 5 partial tracts) A) Conventional B) Refinancings C) Non-occupant Loans on D) Loans On Manufactured Number Average Value Number Average Value Number Average Value Number Average Value
LOANS ORIGINATED 348 $86,312 106 $103,519 40 $63,612 1 $93,000 APPLICATIONS APPROVED, NOT ACCEPTED 36 $83,139 27 $112,172 5 $64,272 0 $0 APPLICATIONS DENIED 2 $59,500 2 $104,000 0 $0 0 $0 APPLICATIONS WITHDRAWN 12 $72,882 15 $113,393 2 $40,745 0 $0 FILES CLOSED FOR INCOMPLETENESS 3 $64,667 1 $77,000 1 $50,000 0 $0
Aggregated Statistics For Year 2005(Based on 18 full and 5 partial tracts) A) Conventional B) Refinancings C) Non-occupant Loans on D) Loans On Manufactured Number Average Value Number Average Value Number Average Value Number Average Value
LOANS ORIGINATED 307 $86,896 133 $102,117 42 $64,458 2 $107,500 APPLICATIONS APPROVED, NOT ACCEPTED 36 $95,012 32 $96,693 5 $58,156 0 $0 APPLICATIONS DENIED 1 $47,000 2 $76,500 0 $0 0 $0 APPLICATIONS WITHDRAWN 19 $107,654 15 $93,372 4 $54,458 0 $0 FILES CLOSED FOR INCOMPLETENESS 3 $52,667 1 $138,850 0 $0 0 $0
Aggregated Statistics For Year 2004(Based on 18 full and 5 partial tracts) A) Conventional B) Refinancings C) Non-occupant Loans on D) Loans On Manufactured Number Average Value Number Average Value Number Average Value Number Average Value
LOANS ORIGINATED 286 $94,270 149 $105,292 25 $59,027 2 $77,415 APPLICATIONS APPROVED, NOT ACCEPTED 44 $97,505 52 $95,233 4 $68,682 2 $69,270 APPLICATIONS DENIED 0 $0 2 $138,505 0 $0 0 $0 APPLICATIONS WITHDRAWN 15 $88,100 14 $81,553 5 $52,400 0 $0 FILES CLOSED FOR INCOMPLETENESS 1 $76,000 6 $119,330 1 $79,000 0 $0
Aggregated Statistics For Year 2003(Based on 18 full and 5 partial tracts) A) Conventional B) Refinancings C) Non-occupant Loans on Number Average Value Number Average Value Number Average Value
LOANS ORIGINATED 331 $86,770 407 $100,553 32 $46,547 APPLICATIONS APPROVED, NOT ACCEPTED 52 $76,877 86 $100,503 21 $50,287 APPLICATIONS DENIED 4 $59,390 4 $108,005 1 $39,140 APPLICATIONS WITHDRAWN 13 $90,978 29 $117,022 5 $48,400 FILES CLOSED FOR INCOMPLETENESS 0 $0 2 $86,000 0 $0
Aggregated Statistics For Year 2002(Based on 18 full and 5 partial tracts) A) Conventional B) Refinancings C) Non-occupant Loans on Number Average Value Number Average Value Number Average Value
LOANS ORIGINATED 270 $84,219 261 $91,490 25 $40,371 APPLICATIONS APPROVED, NOT ACCEPTED 39 $92,847 66 $99,172 5 $62,462 APPLICATIONS DENIED 1 $60,760 3 $80,987 1 $46,960 APPLICATIONS WITHDRAWN 13 $72,023 32 $93,886 6 $86,992 FILES CLOSED FOR INCOMPLETENESS 1 $124,990 4 $67,750 1 $51,000
Aggregated Statistics For Year 2001(Based on 18 full and 5 partial tracts) A) Conventional B) Refinancings C) Non-occupant Loans on Number Average Value Number Average Value Number Average Value
LOANS ORIGINATED 265 $84,228 244 $95,006 30 $48,387 APPLICATIONS APPROVED, NOT ACCEPTED 40 $85,759 56 $92,199 5 $54,800 APPLICATIONS DENIED 8 $114,750 10 $56,352 1 $63,000 APPLICATIONS WITHDRAWN 6 $80,597 9 $84,822 1 $16,290 FILES CLOSED FOR INCOMPLETENESS 3 $84,263 1 $79,000 0 $0
Aggregated Statistics For Year 2000(Based on 18 full and 5 partial tracts) A) Conventional B) Refinancings C) Non-occupant Loans on Number Average Value Number Average Value Number Average Value
LOANS ORIGINATED 221 $76,663 69 $77,563 18 $45,207 APPLICATIONS APPROVED, NOT ACCEPTED 28 $76,716 7 $104,710 2 $34,155 APPLICATIONS DENIED 12 $62,208 9 $77,777 1 $44,500 APPLICATIONS WITHDRAWN 8 $68,469 4 $85,945 2 $50,500 FILES CLOSED FOR INCOMPLETENESS 5 $81,200 1 $165,000 1 $42,000
Aggregated Statistics For Year 1999(Based on 18 full and 6 partial tracts) A) Conventional B) Refinancings C) Non-occupant Loans on Number Average Value Number Average Value Number Average Value
LOANS ORIGINATED 241 $78,466 80 $83,824 13 $44,866 APPLICATIONS APPROVED, NOT ACCEPTED 22 $72,523 13 $96,087 7 $40,954 APPLICATIONS DENIED 28 $74,685 10 $81,616 5 $39,198 APPLICATIONS WITHDRAWN 10 $109,016 13 $75,075 1 $131,000 FILES CLOSED FOR INCOMPLETENESS 4 $54,280 2 $38,270 1 $29,890
St. Joseph compared to Missouri state average:
Unemployed percentage below state average. Hispanic race population percentage above state average. Length of stay since moving in below state average. Institutionalized population percentage above state average. St. Joseph on our top lists :
#3 on the list of "Top 101 cities with largest percentage of males in occupations: production occupations (population 50,000+)"
#6 on the list of "Top 101 cities with largest percentage of males in industries: manufacturing (population 50,000+)"
#20 on the list of "Top 101 cities with the largest percentage of people in institutions for the deaf (population 1,000+)"
#27 on the list of "Top 101 cities with the largest city-data.com crime index increase from 2002 to 2012 (population 50,000+)"
#29 on the list of "Top 101 cities with the highest number of thefts per 100,000 residents, excludes tourist destinations and others with a lot of outsiders visiting based on city industries data (population 50,000+)"
#44 on the list of "Top 101 cities with largest percentage of males in occupations: installation, maintenance, and repair occupations (population 50,000+)"
#52 on the list of "Top 101 cities with largest percentage of females in industries: administrative and support and waste management services (population 50,000+)"
#57 on the list of "Top 101 cities with the largest temperature differences during a year (population 50,000+)"
#62 on the list of "Top 101 cities with the largest city-data.com crime index increase from 2011 to 2012 (population 50,000+)"
#66 on the list of "Top 101 cities with largest percentage of females in occupations: law enforcement workers including supervisors (population 50,000+)"
#70 on the list of "Top 101 cities with largest percentage of females in occupations: production occupations (population 50,000+)"
#70 on the list of "Top 101 cities with the smallest differences between morning and afternoon humidity (population 50,000+)"
#70 on the list of "Top 101 cities with the smallest humidity differences during a year (population 50,000+)"
#71 on the list of "Top 100 cities with shortest commuting times (pop. 50,000+)"
#73 on the list of "Top 101 cities with the highest percentage of English-only speaking households, population 50,000+"
#78 on the list of "Top 101 cities with the most people born in the same U.S. state as the city (population 50,000+)"
#79 on the list of "Top 101 cities with largest percentage of females in industries: manufacturing (population 50,000+)"
#87 on the list of "Top 101 cities with largest percentage of females in occupations: farming, fishing, and forestry occupations (population 50,000+)"
#93 on the list of "Top 100 cities with lowest ratio of median house value to median household income (pop. 50,000+)"
#96 on the list of "Top 101 cities with largest percentage of females in occupations: material moving occupations (population 50,000+)"
#10 on the list of "Top 101 counties with the highest Particulate Matter (PM10 ) Annual air pollution readings in 2012 (µg/m3 )"
#63 on the list of "Top 101 counties with the lowest percentage of residents relocating from foreign countries between 2010 and 2011"
#67 on the list of "Top 101 counties with the highest Particulate Matter (PM2.5 ) Annual air pollution readings in 2012 (µg/m3 )"
Top Patent Applicants
Ivan E. Bounds (16)
Merrill Schaeffer (9)
Jean Luz Rayner (8)
Stanley M. Herzog (7)
Michael G. Rayner (6)
John W. George (5)
Jeffrey B. Wigh (5)
Jeremy Edward Javers (4)
Troy L. Elbert (4)
Nathan A. Landes (4)
Total of 139 patent applications in 2008-2024.
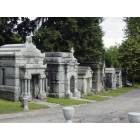
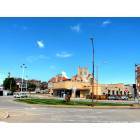
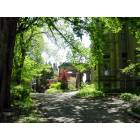
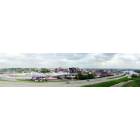
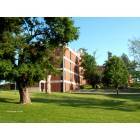
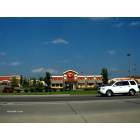
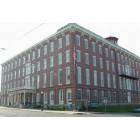
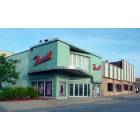
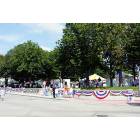
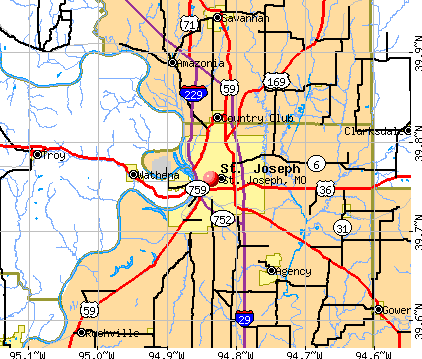


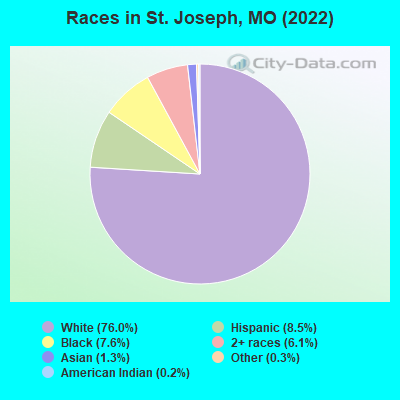
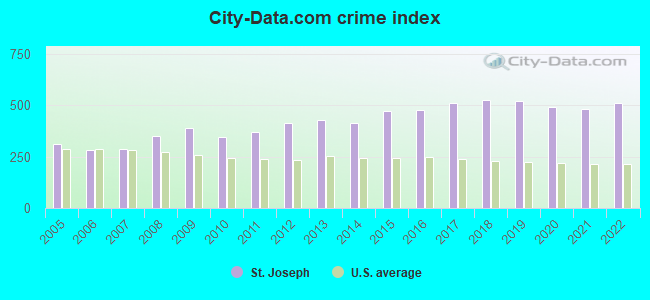
 Recent articles from our blog. Our writers, many of them Ph.D. graduates or candidates, create easy-to-read articles on a wide variety of topics.

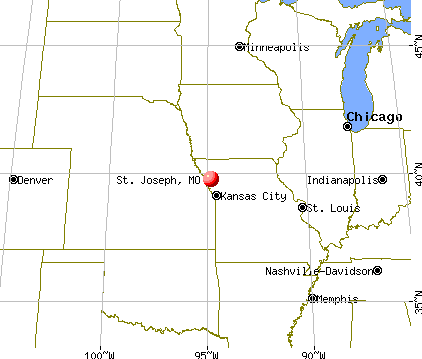
 (49.5 miles
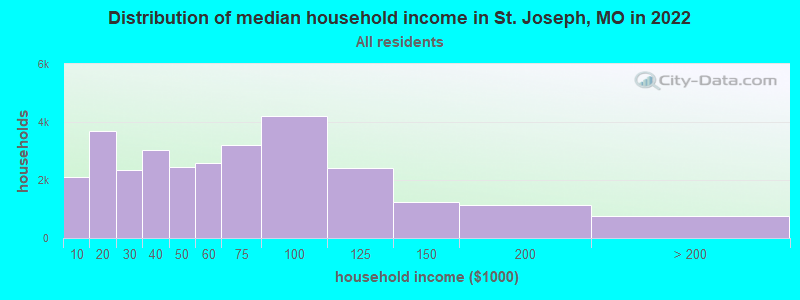
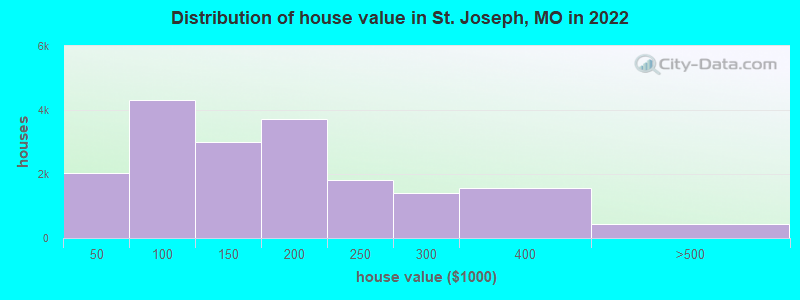

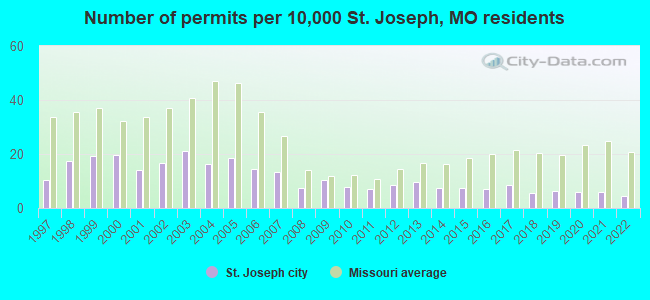
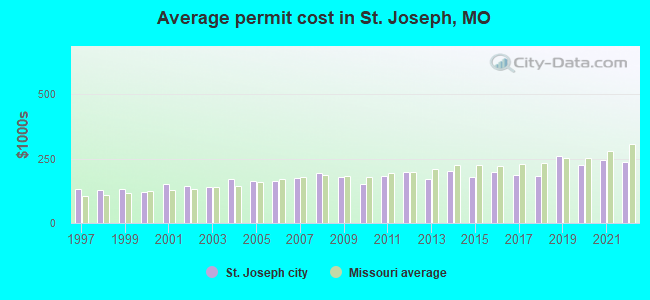
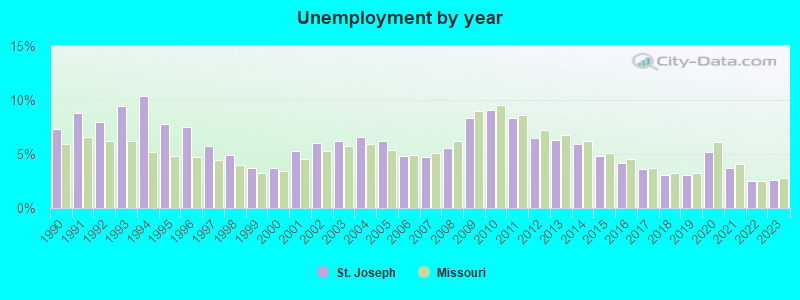
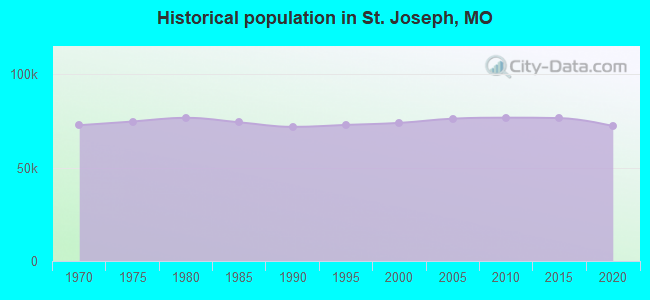
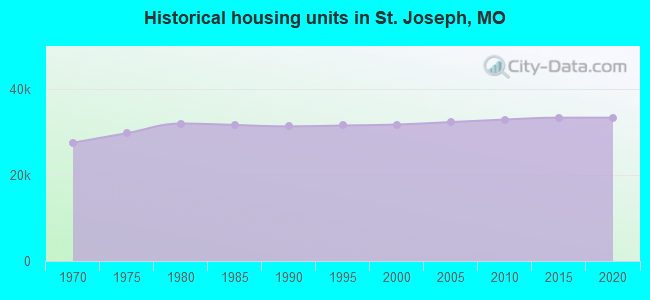
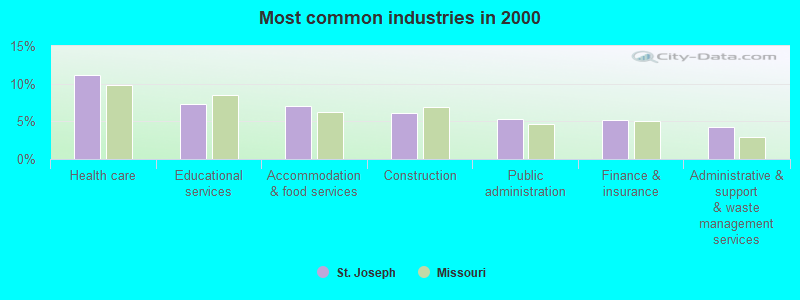
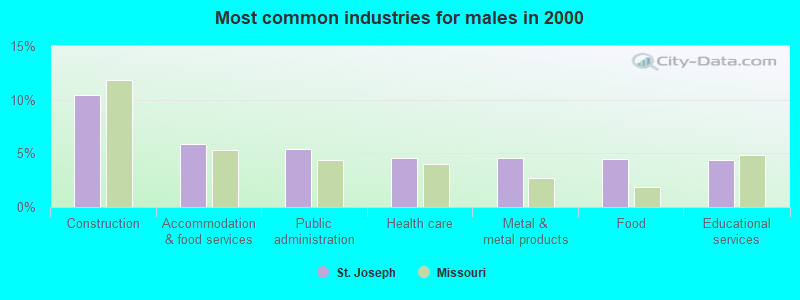
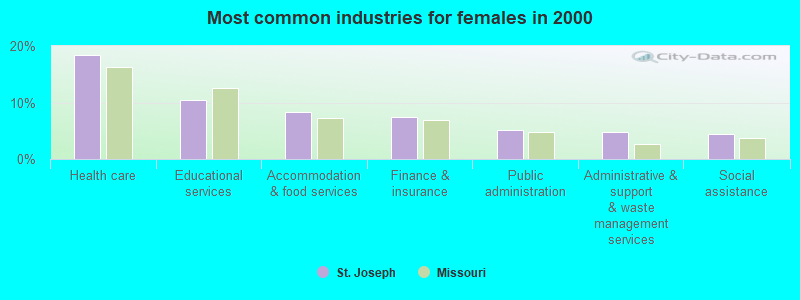
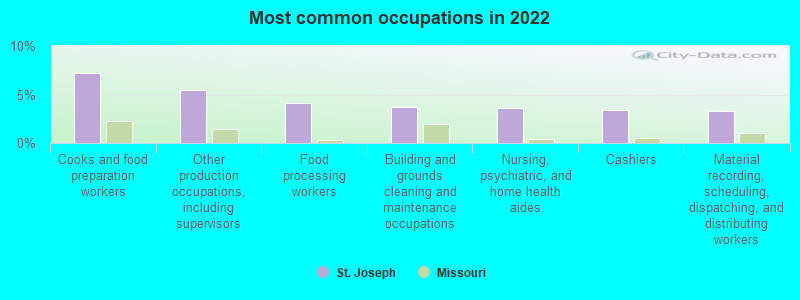
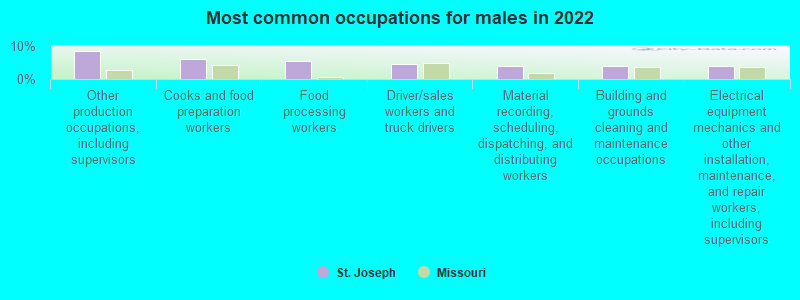
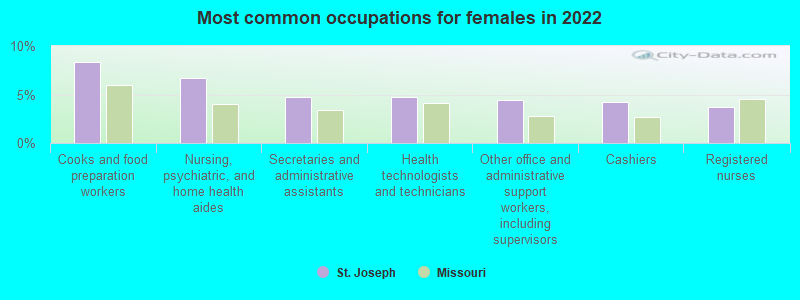
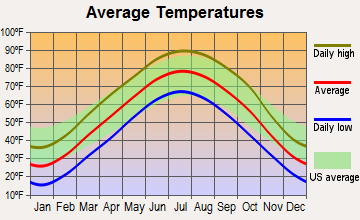
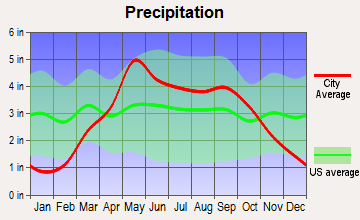
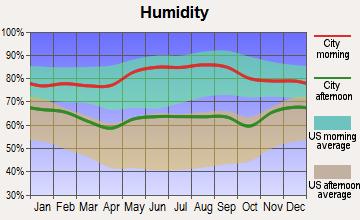
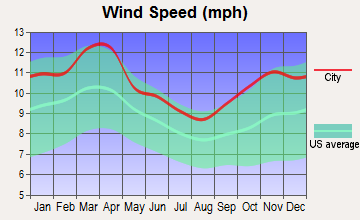
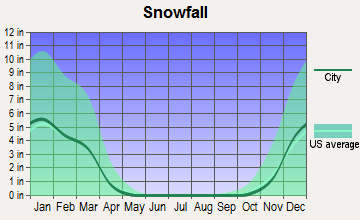
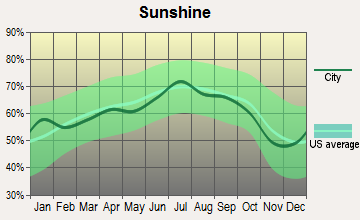
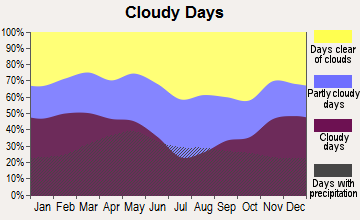
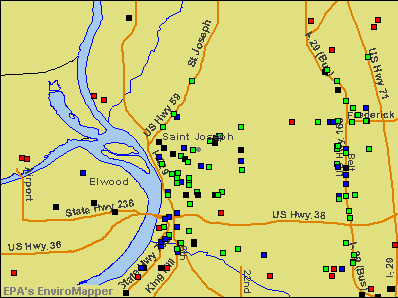

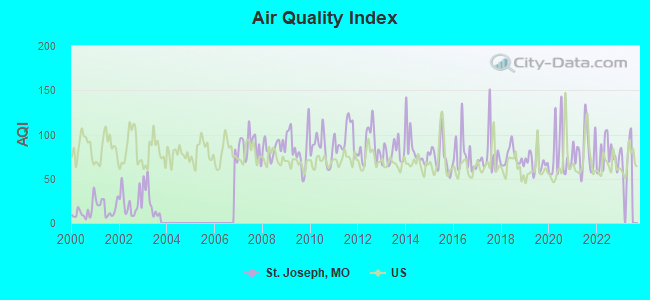
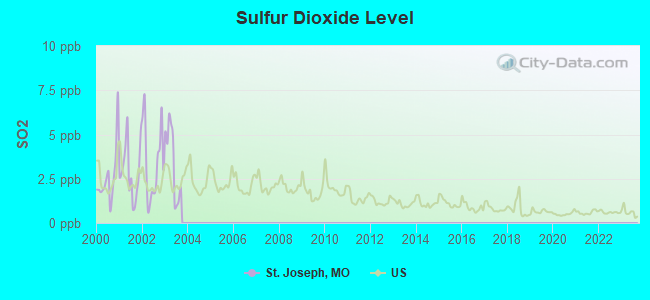
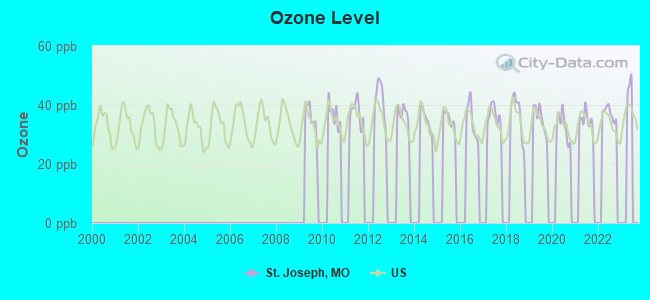
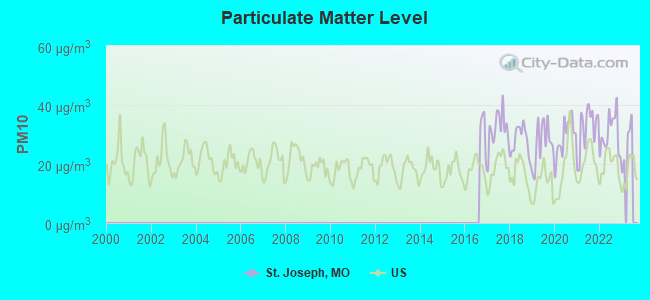
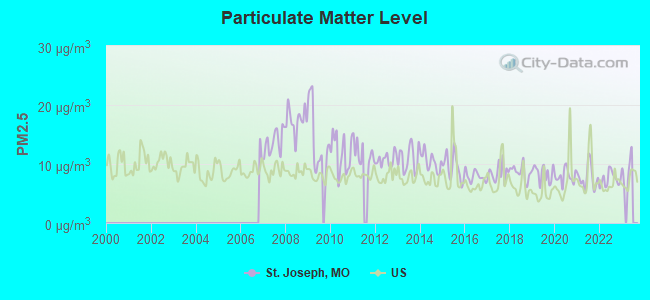
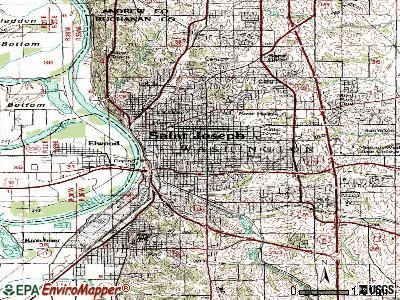
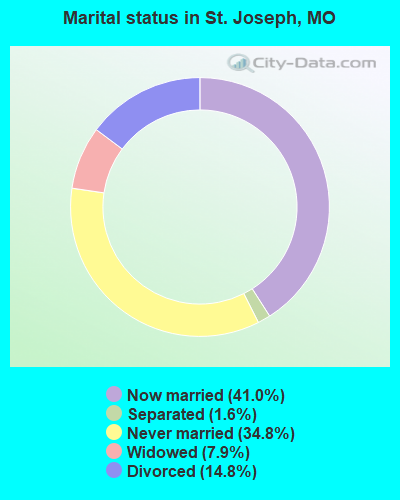
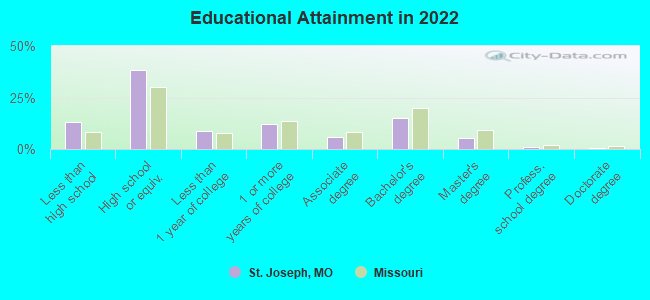
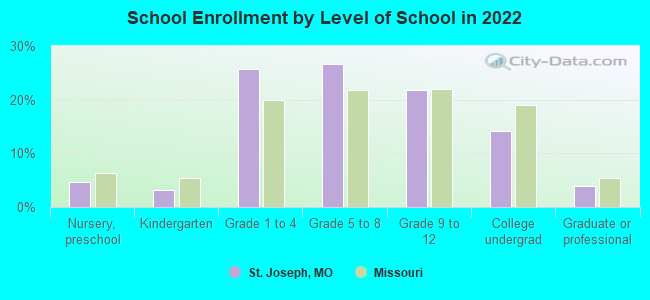
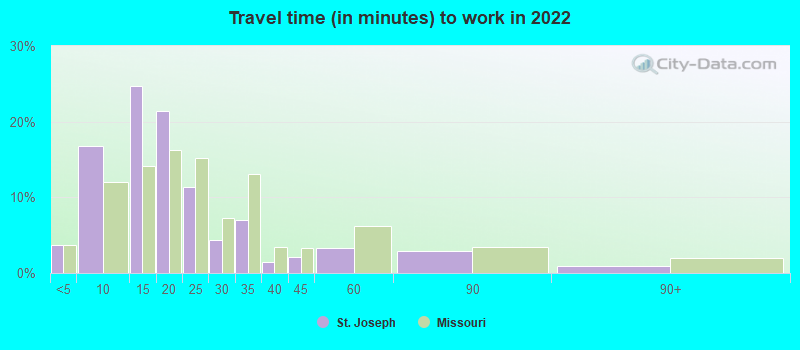
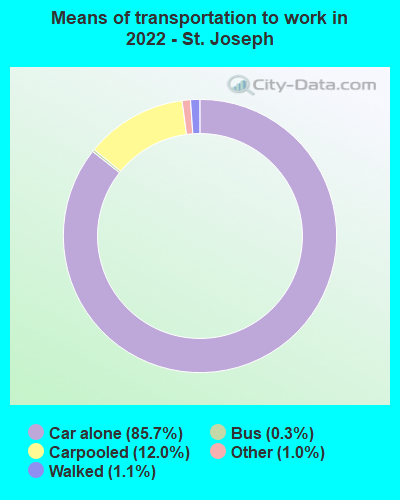
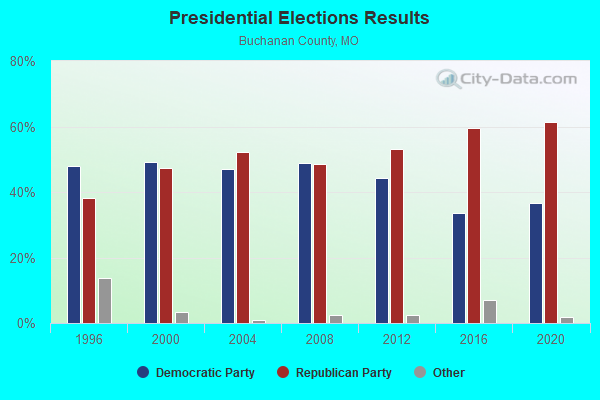
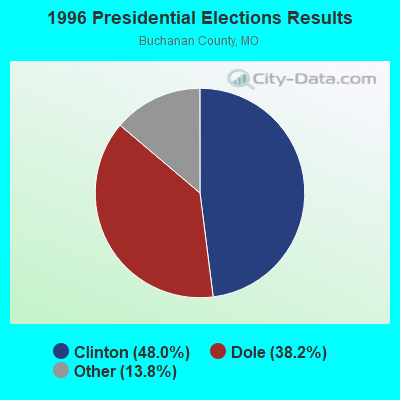
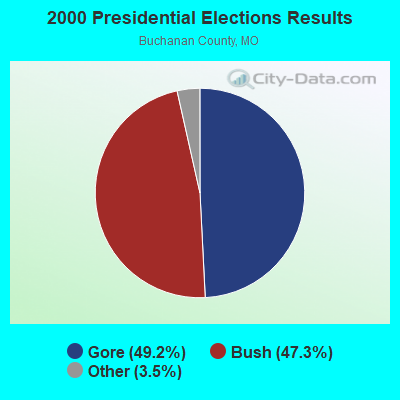
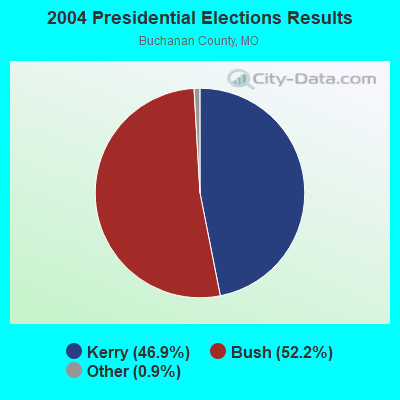
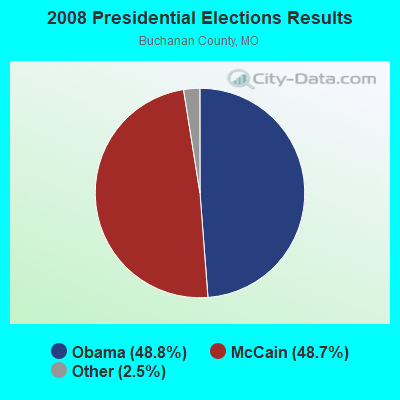
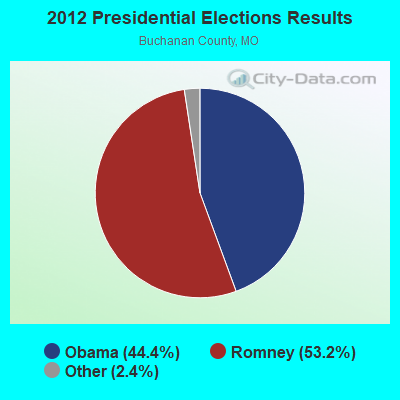
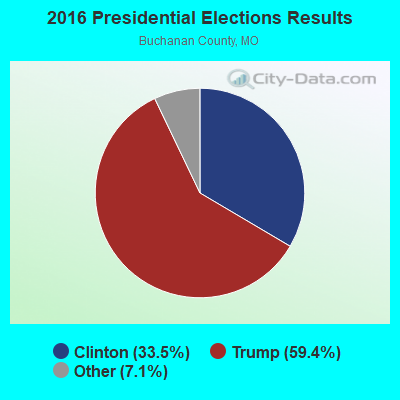
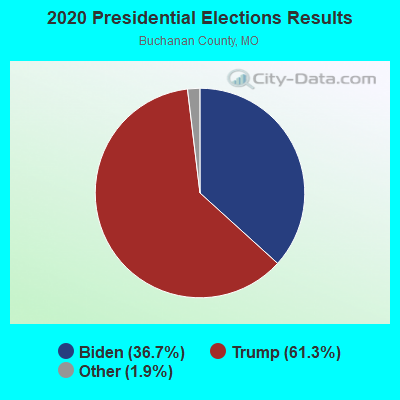
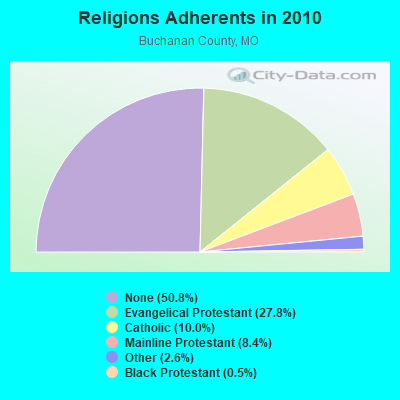
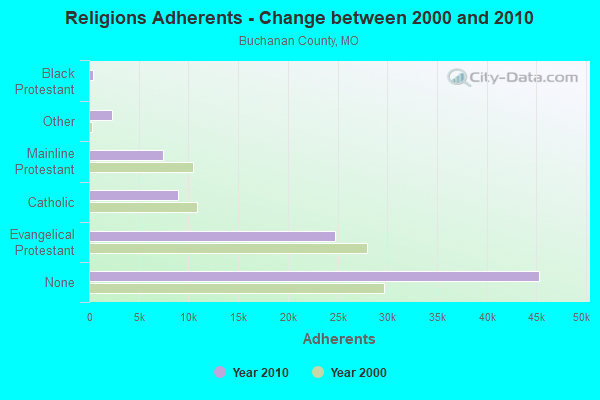
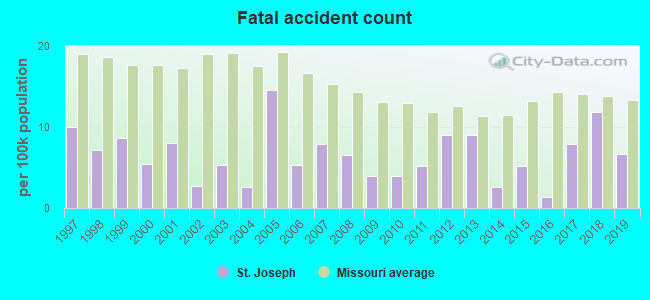
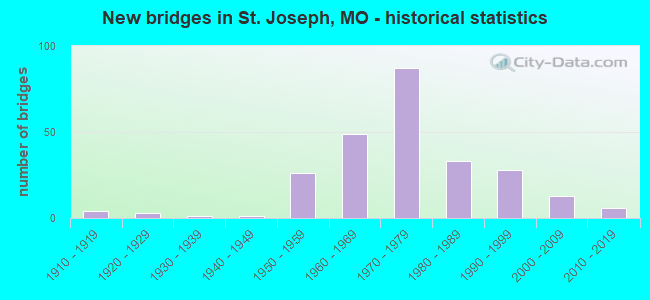
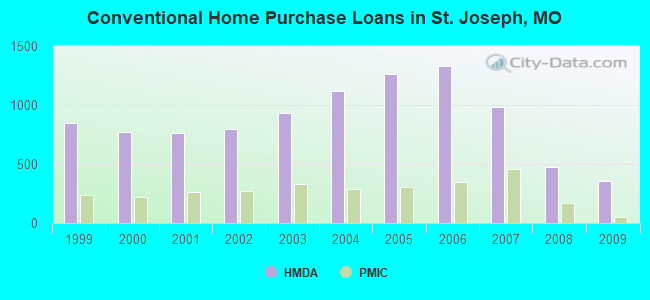
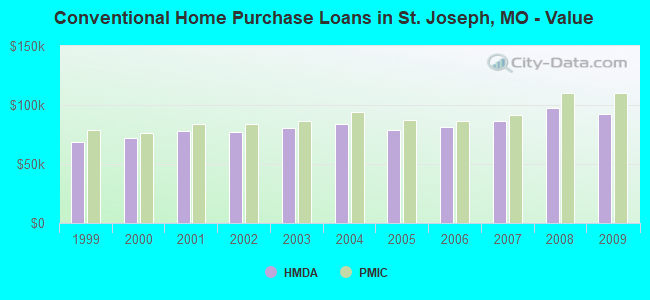
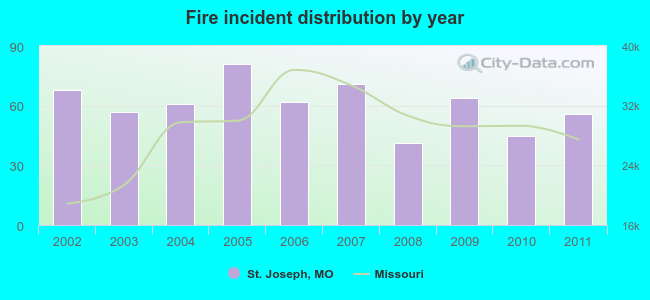 According to the data from the years 2002 - 2011 the average number of fire incidents per year is 61. The highest number of fires - 81 took place in 2005, and the least - 41 in 2008. The data has a dropping trend.
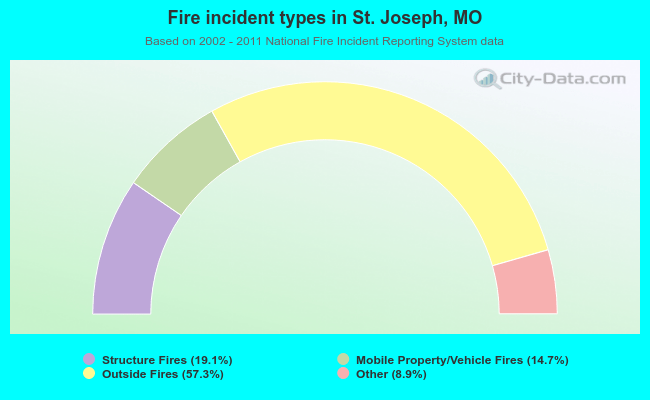 When looking into fire subcategories, the most incidents belonged to: Outside Fires (57.3%), and Structure Fires (19.1%).