Sulphur, Louisiana Submit your own pictures of this city and show them to the world
OSM Map
General Map
Google Map
MSN Map
OSM Map
General Map
Google Map
MSN Map
OSM Map
General Map
Google Map
MSN Map
OSM Map
General Map
Google Map
MSN Map
Please wait while loading the map...
Population in 2022: 20,342 (99% urban, 1% rural). Population change since 2000: -0.8%Males: 9,691 Females: 10,651
March 2022 cost of living index in Sulphur: 85.0 (less than average, U.S. average is 100) Percentage of residents living in poverty in 2022: 14.1%for White Non-Hispanic residents , 9.7% for Black residents , 46.0% for Hispanic or Latino residents , 9.4% for other race residents , 7.9% for two or more races residents )
Profiles of local businesses
Business Search - 14 Million verified businesses
Data:
Median household income ($)
Median household income (% change since 2000)
Household income diversity
Ratio of average income to average house value (%)
Ratio of average income to average rent
Median household income ($) - White
Median household income ($) - Black or African American
Median household income ($) - Asian
Median household income ($) - Hispanic or Latino
Median household income ($) - American Indian and Alaska Native
Median household income ($) - Multirace
Median household income ($) - Other Race
Median household income for houses/condos with a mortgage ($)
Median household income for apartments without a mortgage ($)
Races - White alone (%)
Races - White alone (% change since 2000)
Races - Black alone (%)
Races - Black alone (% change since 2000)
Races - American Indian alone (%)
Races - American Indian alone (% change since 2000)
Races - Asian alone (%)
Races - Asian alone (% change since 2000)
Races - Hispanic (%)
Races - Hispanic (% change since 2000)
Races - Native Hawaiian and Other Pacific Islander alone (%)
Races - Native Hawaiian and Other Pacific Islander alone (% change since 2000)
Races - Two or more races (%)
Races - Two or more races (% change since 2000)
Races - Other race alone (%)
Races - Other race alone (% change since 2000)
Racial diversity
Unemployment (%)
Unemployment (% change since 2000)
Unemployment (%) - White
Unemployment (%) - Black or African American
Unemployment (%) - Asian
Unemployment (%) - Hispanic or Latino
Unemployment (%) - American Indian and Alaska Native
Unemployment (%) - Multirace
Unemployment (%) - Other Race
Population density (people per square mile)
Population - Males (%)
Population - Females (%)
Population - Males (%) - White
Population - Males (%) - Black or African American
Population - Males (%) - Asian
Population - Males (%) - Hispanic or Latino
Population - Males (%) - American Indian and Alaska Native
Population - Males (%) - Multirace
Population - Males (%) - Other Race
Population - Females (%) - White
Population - Females (%) - Black or African American
Population - Females (%) - Asian
Population - Females (%) - Hispanic or Latino
Population - Females (%) - American Indian and Alaska Native
Population - Females (%) - Multirace
Population - Females (%) - Other Race
Coronavirus confirmed cases (Apr 27, 2024)
Deaths caused by coronavirus (Apr 27, 2024)
Coronavirus confirmed cases (per 100k population) (Apr 27, 2024)
Deaths caused by coronavirus (per 100k population) (Apr 27, 2024)
Daily increase in number of cases (Apr 27, 2024)
Weekly increase in number of cases (Apr 27, 2024)
Cases doubled (in days) (Apr 27, 2024)
Hospitalized patients (Apr 18, 2022)
Negative test results (Apr 18, 2022)
Total test results (Apr 18, 2022)
COVID Vaccine doses distributed (per 100k population) (Sep 19, 2023)
COVID Vaccine doses administered (per 100k population) (Sep 19, 2023)
COVID Vaccine doses distributed (Sep 19, 2023)
COVID Vaccine doses administered (Sep 19, 2023)
Likely homosexual households (%)
Likely homosexual households (% change since 2000)
Likely homosexual households - Lesbian couples (%)
Likely homosexual households - Lesbian couples (% change since 2000)
Likely homosexual households - Gay men (%)
Likely homosexual households - Gay men (% change since 2000)
Cost of living index
Median gross rent ($)
Median contract rent ($)
Median monthly housing costs ($)
Median house or condo value ($)
Median house or condo value ($ change since 2000)
Mean house or condo value by units in structure - 1, detached ($)
Mean house or condo value by units in structure - 1, attached ($)
Mean house or condo value by units in structure - 2 ($)
Mean house or condo value by units in structure by units in structure - 3 or 4 ($)
Mean house or condo value by units in structure - 5 or more ($)
Mean house or condo value by units in structure - Boat, RV, van, etc. ($)
Mean house or condo value by units in structure - Mobile home ($)
Median house or condo value ($) - White
Median house or condo value ($) - Black or African American
Median house or condo value ($) - Asian
Median house or condo value ($) - Hispanic or Latino
Median house or condo value ($) - American Indian and Alaska Native
Median house or condo value ($) - Multirace
Median house or condo value ($) - Other Race
Median resident age
Resident age diversity
Median resident age - Males
Median resident age - Females
Median resident age - White
Median resident age - Black or African American
Median resident age - Asian
Median resident age - Hispanic or Latino
Median resident age - American Indian and Alaska Native
Median resident age - Multirace
Median resident age - Other Race
Median resident age - Males - White
Median resident age - Males - Black or African American
Median resident age - Males - Asian
Median resident age - Males - Hispanic or Latino
Median resident age - Males - American Indian and Alaska Native
Median resident age - Males - Multirace
Median resident age - Males - Other Race
Median resident age - Females - White
Median resident age - Females - Black or African American
Median resident age - Females - Asian
Median resident age - Females - Hispanic or Latino
Median resident age - Females - American Indian and Alaska Native
Median resident age - Females - Multirace
Median resident age - Females - Other Race
Commute - mean travel time to work (minutes)
Travel time to work - Less than 5 minutes (%)
Travel time to work - Less than 5 minutes (% change since 2000)
Travel time to work - 5 to 9 minutes (%)
Travel time to work - 5 to 9 minutes (% change since 2000)
Travel time to work - 10 to 19 minutes (%)
Travel time to work - 10 to 19 minutes (% change since 2000)
Travel time to work - 20 to 29 minutes (%)
Travel time to work - 20 to 29 minutes (% change since 2000)
Travel time to work - 30 to 39 minutes (%)
Travel time to work - 30 to 39 minutes (% change since 2000)
Travel time to work - 40 to 59 minutes (%)
Travel time to work - 40 to 59 minutes (% change since 2000)
Travel time to work - 60 to 89 minutes (%)
Travel time to work - 60 to 89 minutes (% change since 2000)
Travel time to work - 90 or more minutes (%)
Travel time to work - 90 or more minutes (% change since 2000)
Marital status - Never married (%)
Marital status - Now married (%)
Marital status - Separated (%)
Marital status - Widowed (%)
Marital status - Divorced (%)
Median family income ($)
Median family income (% change since 2000)
Median non-family income ($)
Median non-family income (% change since 2000)
Median per capita income ($)
Median per capita income (% change since 2000)
Median family income ($) - White
Median family income ($) - Black or African American
Median family income ($) - Asian
Median family income ($) - Hispanic or Latino
Median family income ($) - American Indian and Alaska Native
Median family income ($) - Multirace
Median family income ($) - Other Race
Median year house/condo built
Median year apartment built
Year house built - Built 2005 or later (%)
Year house built - Built 2000 to 2004 (%)
Year house built - Built 1990 to 1999 (%)
Year house built - Built 1980 to 1989 (%)
Year house built - Built 1970 to 1979 (%)
Year house built - Built 1960 to 1969 (%)
Year house built - Built 1950 to 1959 (%)
Year house built - Built 1940 to 1949 (%)
Year house built - Built 1939 or earlier (%)
Average household size
Household density (households per square mile)
Average household size - White
Average household size - Black or African American
Average household size - Asian
Average household size - Hispanic or Latino
Average household size - American Indian and Alaska Native
Average household size - Multirace
Average household size - Other Race
Occupied housing units (%)
Vacant housing units (%)
Owner occupied housing units (%)
Renter occupied housing units (%)
Vacancy status - For rent (%)
Vacancy status - For sale only (%)
Vacancy status - Rented or sold, not occupied (%)
Vacancy status - For seasonal, recreational, or occasional use (%)
Vacancy status - For migrant workers (%)
Vacancy status - Other vacant (%)
Residents with income below the poverty level (%)
Residents with income below 50% of the poverty level (%)
Children below poverty level (%)
Poor families by family type - Married-couple family (%)
Poor families by family type - Male, no wife present (%)
Poor families by family type - Female, no husband present (%)
Poverty status for native-born residents (%)
Poverty status for foreign-born residents (%)
Poverty among high school graduates not in families (%)
Poverty among people who did not graduate high school not in families (%)
Residents with income below the poverty level (%) - White
Residents with income below the poverty level (%) - Black or African American
Residents with income below the poverty level (%) - Asian
Residents with income below the poverty level (%) - Hispanic or Latino
Residents with income below the poverty level (%) - American Indian and Alaska Native
Residents with income below the poverty level (%) - Multirace
Residents with income below the poverty level (%) - Other Race
Air pollution - Air Quality Index (AQI)
Air pollution - CO
Air pollution - NO2
Air pollution - SO2
Air pollution - Ozone
Air pollution - PM10
Air pollution - PM25
Air pollution - Pb
Crime - Murders per 100,000 population
Crime - Rapes per 100,000 population
Crime - Robberies per 100,000 population
Crime - Assaults per 100,000 population
Crime - Burglaries per 100,000 population
Crime - Thefts per 100,000 population
Crime - Auto thefts per 100,000 population
Crime - Arson per 100,000 population
Crime - City-data.com crime index
Crime - Violent crime index
Crime - Property crime index
Crime - Murders per 100,000 population (5 year average)
Crime - Rapes per 100,000 population (5 year average)
Crime - Robberies per 100,000 population (5 year average)
Crime - Assaults per 100,000 population (5 year average)
Crime - Burglaries per 100,000 population (5 year average)
Crime - Thefts per 100,000 population (5 year average)
Crime - Auto thefts per 100,000 population (5 year average)
Crime - Arson per 100,000 population (5 year average)
Crime - City-data.com crime index (5 year average)
Crime - Violent crime index (5 year average)
Crime - Property crime index (5 year average)
1996 Presidential Elections Results (%) - Democratic Party (Clinton)
1996 Presidential Elections Results (%) - Republican Party (Dole)
1996 Presidential Elections Results (%) - Other
2000 Presidential Elections Results (%) - Democratic Party (Gore)
2000 Presidential Elections Results (%) - Republican Party (Bush)
2000 Presidential Elections Results (%) - Other
2004 Presidential Elections Results (%) - Democratic Party (Kerry)
2004 Presidential Elections Results (%) - Republican Party (Bush)
2004 Presidential Elections Results (%) - Other
2008 Presidential Elections Results (%) - Democratic Party (Obama)
2008 Presidential Elections Results (%) - Republican Party (McCain)
2008 Presidential Elections Results (%) - Other
2012 Presidential Elections Results (%) - Democratic Party (Obama)
2012 Presidential Elections Results (%) - Republican Party (Romney)
2012 Presidential Elections Results (%) - Other
2016 Presidential Elections Results (%) - Democratic Party (Clinton)
2016 Presidential Elections Results (%) - Republican Party (Trump)
2016 Presidential Elections Results (%) - Other
2020 Presidential Elections Results (%) - Democratic Party (Biden)
2020 Presidential Elections Results (%) - Republican Party (Trump)
2020 Presidential Elections Results (%) - Other
Ancestries Reported - Arab (%)
Ancestries Reported - Czech (%)
Ancestries Reported - Danish (%)
Ancestries Reported - Dutch (%)
Ancestries Reported - English (%)
Ancestries Reported - French (%)
Ancestries Reported - French Canadian (%)
Ancestries Reported - German (%)
Ancestries Reported - Greek (%)
Ancestries Reported - Hungarian (%)
Ancestries Reported - Irish (%)
Ancestries Reported - Italian (%)
Ancestries Reported - Lithuanian (%)
Ancestries Reported - Norwegian (%)
Ancestries Reported - Polish (%)
Ancestries Reported - Portuguese (%)
Ancestries Reported - Russian (%)
Ancestries Reported - Scotch-Irish (%)
Ancestries Reported - Scottish (%)
Ancestries Reported - Slovak (%)
Ancestries Reported - Subsaharan African (%)
Ancestries Reported - Swedish (%)
Ancestries Reported - Swiss (%)
Ancestries Reported - Ukrainian (%)
Ancestries Reported - United States (%)
Ancestries Reported - Welsh (%)
Ancestries Reported - West Indian (%)
Ancestries Reported - Other (%)
Educational Attainment - No schooling completed (%)
Educational Attainment - Less than high school (%)
Educational Attainment - High school or equivalent (%)
Educational Attainment - Less than 1 year of college (%)
Educational Attainment - 1 or more years of college (%)
Educational Attainment - Associate degree (%)
Educational Attainment - Bachelor's degree (%)
Educational Attainment - Master's degree (%)
Educational Attainment - Professional school degree (%)
Educational Attainment - Doctorate degree (%)
School Enrollment - Nursery, preschool (%)
School Enrollment - Kindergarten (%)
School Enrollment - Grade 1 to 4 (%)
School Enrollment - Grade 5 to 8 (%)
School Enrollment - Grade 9 to 12 (%)
School Enrollment - College undergrad (%)
School Enrollment - Graduate or professional (%)
School Enrollment - Not enrolled in school (%)
School enrollment - Public schools (%)
School enrollment - Private schools (%)
School enrollment - Not enrolled (%)
Median number of rooms in houses and condos
Median number of rooms in apartments
Housing units lacking complete plumbing facilities (%)
Housing units lacking complete kitchen facilities (%)
Density of houses
Urban houses (%)
Rural houses (%)
Households with people 60 years and over (%)
Households with people 65 years and over (%)
Households with people 75 years and over (%)
Households with one or more nonrelatives (%)
Households with no nonrelatives (%)
Population in households (%)
Family households (%)
Nonfamily households (%)
Population in families (%)
Family households with own children (%)
Median number of bedrooms in owner occupied houses
Mean number of bedrooms in owner occupied houses
Median number of bedrooms in renter occupied houses
Mean number of bedrooms in renter occupied houses
Median number of vehichles in owner occupied houses
Mean number of vehichles in owner occupied houses
Median number of vehichles in renter occupied houses
Mean number of vehichles in renter occupied houses
Mortgage status - with mortgage (%)
Mortgage status - with second mortgage (%)
Mortgage status - with home equity loan (%)
Mortgage status - with both second mortgage and home equity loan (%)
Mortgage status - without a mortgage (%)
Average family size
Average family size - White
Average family size - Black or African American
Average family size - Asian
Average family size - Hispanic or Latino
Average family size - American Indian and Alaska Native
Average family size - Multirace
Average family size - Other Race
Geographical mobility - Same house 1 year ago (%)
Geographical mobility - Moved within same county (%)
Geographical mobility - Moved from different county within same state (%)
Geographical mobility - Moved from different state (%)
Geographical mobility - Moved from abroad (%)
Place of birth - Born in state of residence (%)
Place of birth - Born in other state (%)
Place of birth - Native, outside of US (%)
Place of birth - Foreign born (%)
Housing units in structures - 1, detached (%)
Housing units in structures - 1, attached (%)
Housing units in structures - 2 (%)
Housing units in structures - 3 or 4 (%)
Housing units in structures - 5 to 9 (%)
Housing units in structures - 10 to 19 (%)
Housing units in structures - 20 to 49 (%)
Housing units in structures - 50 or more (%)
Housing units in structures - Mobile home (%)
Housing units in structures - Boat, RV, van, etc. (%)
House/condo owner moved in on average (years ago)
Renter moved in on average (years ago)
Year householder moved into unit - Moved in 1999 to March 2000 (%)
Year householder moved into unit - Moved in 1995 to 1998 (%)
Year householder moved into unit - Moved in 1990 to 1994 (%)
Year householder moved into unit - Moved in 1980 to 1989 (%)
Year householder moved into unit - Moved in 1970 to 1979 (%)
Year householder moved into unit - Moved in 1969 or earlier (%)
Means of transportation to work - Drove car alone (%)
Means of transportation to work - Carpooled (%)
Means of transportation to work - Public transportation (%)
Means of transportation to work - Bus or trolley bus (%)
Means of transportation to work - Streetcar or trolley car (%)
Means of transportation to work - Subway or elevated (%)
Means of transportation to work - Railroad (%)
Means of transportation to work - Ferryboat (%)
Means of transportation to work - Taxicab (%)
Means of transportation to work - Motorcycle (%)
Means of transportation to work - Bicycle (%)
Means of transportation to work - Walked (%)
Means of transportation to work - Other means (%)
Working at home (%)
Industry diversity
Most Common Industries - Agriculture, forestry, fishing and hunting, and mining (%)
Most Common Industries - Agriculture, forestry, fishing and hunting (%)
Most Common Industries - Mining, quarrying, and oil and gas extraction (%)
Most Common Industries - Construction (%)
Most Common Industries - Manufacturing (%)
Most Common Industries - Wholesale trade (%)
Most Common Industries - Retail trade (%)
Most Common Industries - Transportation and warehousing, and utilities (%)
Most Common Industries - Transportation and warehousing (%)
Most Common Industries - Utilities (%)
Most Common Industries - Information (%)
Most Common Industries - Finance and insurance, and real estate and rental and leasing (%)
Most Common Industries - Finance and insurance (%)
Most Common Industries - Real estate and rental and leasing (%)
Most Common Industries - Professional, scientific, and management, and administrative and waste management services (%)
Most Common Industries - Professional, scientific, and technical services (%)
Most Common Industries - Management of companies and enterprises (%)
Most Common Industries - Administrative and support and waste management services (%)
Most Common Industries - Educational services, and health care and social assistance (%)
Most Common Industries - Educational services (%)
Most Common Industries - Health care and social assistance (%)
Most Common Industries - Arts, entertainment, and recreation, and accommodation and food services (%)
Most Common Industries - Arts, entertainment, and recreation (%)
Most Common Industries - Accommodation and food services (%)
Most Common Industries - Other services, except public administration (%)
Most Common Industries - Public administration (%)
Occupation diversity
Most Common Occupations - Management, business, science, and arts occupations (%)
Most Common Occupations - Management, business, and financial occupations (%)
Most Common Occupations - Management occupations (%)
Most Common Occupations - Business and financial operations occupations (%)
Most Common Occupations - Computer, engineering, and science occupations (%)
Most Common Occupations - Computer and mathematical occupations (%)
Most Common Occupations - Architecture and engineering occupations (%)
Most Common Occupations - Life, physical, and social science occupations (%)
Most Common Occupations - Education, legal, community service, arts, and media occupations (%)
Most Common Occupations - Community and social service occupations (%)
Most Common Occupations - Legal occupations (%)
Most Common Occupations - Education, training, and library occupations (%)
Most Common Occupations - Arts, design, entertainment, sports, and media occupations (%)
Most Common Occupations - Healthcare practitioners and technical occupations (%)
Most Common Occupations - Health diagnosing and treating practitioners and other technical occupations (%)
Most Common Occupations - Health technologists and technicians (%)
Most Common Occupations - Service occupations (%)
Most Common Occupations - Healthcare support occupations (%)
Most Common Occupations - Protective service occupations (%)
Most Common Occupations - Fire fighting and prevention, and other protective service workers including supervisors (%)
Most Common Occupations - Law enforcement workers including supervisors (%)
Most Common Occupations - Food preparation and serving related occupations (%)
Most Common Occupations - Building and grounds cleaning and maintenance occupations (%)
Most Common Occupations - Personal care and service occupations (%)
Most Common Occupations - Sales and office occupations (%)
Most Common Occupations - Sales and related occupations (%)
Most Common Occupations - Office and administrative support occupations (%)
Most Common Occupations - Natural resources, construction, and maintenance occupations (%)
Most Common Occupations - Farming, fishing, and forestry occupations (%)
Most Common Occupations - Construction and extraction occupations (%)
Most Common Occupations - Installation, maintenance, and repair occupations (%)
Most Common Occupations - Production, transportation, and material moving occupations (%)
Most Common Occupations - Production occupations (%)
Most Common Occupations - Transportation occupations (%)
Most Common Occupations - Material moving occupations (%)
People in Group quarters - Institutionalized population (%)
People in Group quarters - Correctional institutions (%)
People in Group quarters - Federal prisons and detention centers (%)
People in Group quarters - Halfway houses (%)
People in Group quarters - Local jails and other confinement facilities (including police lockups) (%)
People in Group quarters - Military disciplinary barracks (%)
People in Group quarters - State prisons (%)
People in Group quarters - Other types of correctional institutions (%)
People in Group quarters - Nursing homes (%)
People in Group quarters - Hospitals/wards, hospices, and schools for the handicapped (%)
People in Group quarters - Hospitals/wards and hospices for chronically ill (%)
People in Group quarters - Hospices or homes for chronically ill (%)
People in Group quarters - Military hospitals or wards for chronically ill (%)
People in Group quarters - Other hospitals or wards for chronically ill (%)
People in Group quarters - Hospitals or wards for drug/alcohol abuse (%)
People in Group quarters - Mental (Psychiatric) hospitals or wards (%)
People in Group quarters - Schools, hospitals, or wards for the mentally retarded (%)
People in Group quarters - Schools, hospitals, or wards for the physically handicapped (%)
People in Group quarters - Institutions for the deaf (%)
People in Group quarters - Institutions for the blind (%)
People in Group quarters - Orthopedic wards and institutions for the physically handicapped (%)
People in Group quarters - Wards in general hospitals for patients who have no usual home elsewhere (%)
People in Group quarters - Wards in military hospitals for patients who have no usual home elsewhere (%)
People in Group quarters - Juvenile institutions (%)
People in Group quarters - Long-term care (%)
People in Group quarters - Homes for abused, dependent, and neglected children (%)
People in Group quarters - Residential treatment centers for emotionally disturbed children (%)
People in Group quarters - Training schools for juvenile delinquents (%)
People in Group quarters - Short-term care, detention or diagnostic centers for delinquent children (%)
People in Group quarters - Type of juvenile institution unknown (%)
People in Group quarters - Noninstitutionalized population (%)
People in Group quarters - College dormitories (includes college quarters off campus) (%)
People in Group quarters - Military quarters (%)
People in Group quarters - On base (%)
People in Group quarters - Barracks, unaccompanied personnel housing (UPH), (Enlisted/Officer), ;and similar group living quarters for military personnel (%)
People in Group quarters - Transient quarters for temporary residents (%)
People in Group quarters - Military ships (%)
People in Group quarters - Group homes (%)
People in Group quarters - Homes or halfway houses for drug/alcohol abuse (%)
People in Group quarters - Homes for the mentally ill (%)
People in Group quarters - Homes for the mentally retarded (%)
People in Group quarters - Homes for the physically handicapped (%)
People in Group quarters - Other group homes (%)
People in Group quarters - Religious group quarters (%)
People in Group quarters - Dormitories (%)
People in Group quarters - Agriculture workers' dormitories on farms (%)
People in Group quarters - Job Corps and vocational training facilities (%)
People in Group quarters - Other workers' dormitories (%)
People in Group quarters - Crews of maritime vessels (%)
People in Group quarters - Other nonhousehold living situations (%)
People in Group quarters - Other noninstitutional group quarters (%)
Residents speaking English at home (%)
Residents speaking English at home - Born in the United States (%)
Residents speaking English at home - Native, born elsewhere (%)
Residents speaking English at home - Foreign born (%)
Residents speaking Spanish at home (%)
Residents speaking Spanish at home - Born in the United States (%)
Residents speaking Spanish at home - Native, born elsewhere (%)
Residents speaking Spanish at home - Foreign born (%)
Residents speaking other language at home (%)
Residents speaking other language at home - Born in the United States (%)
Residents speaking other language at home - Native, born elsewhere (%)
Residents speaking other language at home - Foreign born (%)
Class of Workers - Employee of private company (%)
Class of Workers - Self-employed in own incorporated business (%)
Class of Workers - Private not-for-profit wage and salary workers (%)
Class of Workers - Local government workers (%)
Class of Workers - State government workers (%)
Class of Workers - Federal government workers (%)
Class of Workers - Self-employed workers in own not incorporated business and Unpaid family workers (%)
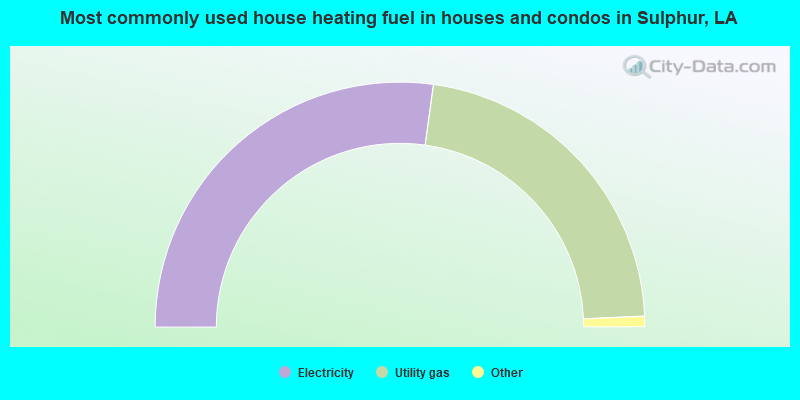
House heating fuel used in houses and condos - Utility gas (%)
House heating fuel used in houses and condos - Bottled, tank, or LP gas (%)
House heating fuel used in houses and condos - Electricity (%)
House heating fuel used in houses and condos - Fuel oil, kerosene, etc. (%)
House heating fuel used in houses and condos - Coal or coke (%)
House heating fuel used in houses and condos - Wood (%)
House heating fuel used in houses and condos - Solar energy (%)
House heating fuel used in houses and condos - Other fuel (%)
House heating fuel used in houses and condos - No fuel used (%)
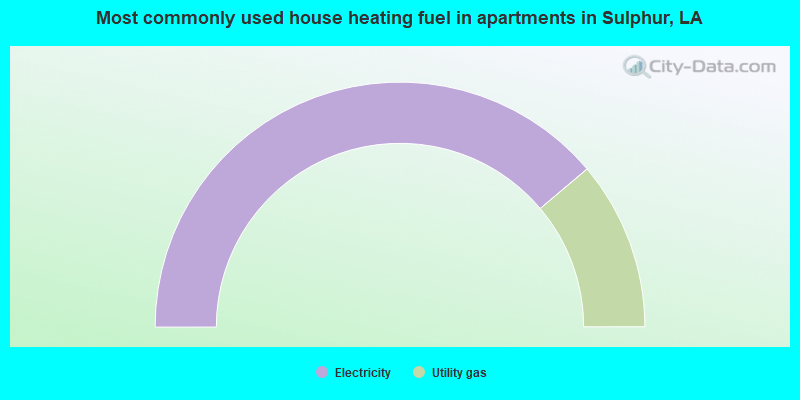
House heating fuel used in apartments - Utility gas (%)
House heating fuel used in apartments - Bottled, tank, or LP gas (%)
House heating fuel used in apartments - Electricity (%)
House heating fuel used in apartments - Fuel oil, kerosene, etc. (%)
House heating fuel used in apartments - Coal or coke (%)
House heating fuel used in apartments - Wood (%)
House heating fuel used in apartments - Solar energy (%)
House heating fuel used in apartments - Other fuel (%)
House heating fuel used in apartments - No fuel used (%)
Armed forces status - In Armed Forces (%)
Armed forces status - Civilian (%)
Armed forces status - Civilian - Veteran (%)
Armed forces status - Civilian - Nonveteran (%)
Fatal accidents locations in years 2005-2021
Fatal accidents locations in 2005
Fatal accidents locations in 2006
Fatal accidents locations in 2007
Fatal accidents locations in 2008
Fatal accidents locations in 2009
Fatal accidents locations in 2010
Fatal accidents locations in 2011
Fatal accidents locations in 2012
Fatal accidents locations in 2013
Fatal accidents locations in 2014
Fatal accidents locations in 2015
Fatal accidents locations in 2016
Fatal accidents locations in 2017
Fatal accidents locations in 2018
Fatal accidents locations in 2019
Fatal accidents locations in 2020
Fatal accidents locations in 2021
Alcohol use - People drinking some alcohol every month (%)
Alcohol use - People not drinking at all (%)
Alcohol use - Average days/month drinking alcohol
Alcohol use - Average drinks/week
Alcohol use - Average days/year people drink much
Audiometry - Average condition of hearing (%)
Audiometry - People that can hear a whisper from across a quiet room (%)
Audiometry - People that can hear normal voice from across a quiet room (%)
Audiometry - Ears ringing, roaring, buzzing (%)
Audiometry - Had a job exposure to loud noise (%)
Audiometry - Had off-work exposure to loud noise (%)
Blood Pressure & Cholesterol - Has high blood pressure (%)
Blood Pressure & Cholesterol - Checking blood pressure at home (%)
Blood Pressure & Cholesterol - Frequently checking blood cholesterol (%)
Blood Pressure & Cholesterol - Has high cholesterol level (%)
Consumer Behavior - Money monthly spent on food at supermarket/grocery store
Consumer Behavior - Money monthly spent on food at other stores
Consumer Behavior - Money monthly spent on eating out
Consumer Behavior - Money monthly spent on carryout/delivered foods
Consumer Behavior - Income spent on food at supermarket/grocery store (%)
Consumer Behavior - Income spent on food at other stores (%)
Consumer Behavior - Income spent on eating out (%)
Consumer Behavior - Income spent on carryout/delivered foods (%)
Current Health Status - General health condition (%)
Current Health Status - Blood donors (%)
Current Health Status - Has blood ever tested for HIV virus (%)
Current Health Status - Left-handed people (%)
Dermatology - People using sunscreen (%)
Diabetes - Diabetics (%)
Diabetes - Had a blood test for high blood sugar (%)
Diabetes - People taking insulin (%)
Diet Behavior & Nutrition - Diet health (%)
Diet Behavior & Nutrition - Milk product consumption (# of products/month)
Diet Behavior & Nutrition - Meals not home prepared (#/week)
Diet Behavior & Nutrition - Meals from fast food or pizza place (#/week)
Diet Behavior & Nutrition - Ready-to-eat foods (#/month)
Diet Behavior & Nutrition - Frozen meals/pizza (#/month)
Drug Use - People that ever used marijuana or hashish (%)
Drug Use - Ever used hard drugs (%)
Drug Use - Ever used any form of cocaine (%)
Drug Use - Ever used heroin (%)
Drug Use - Ever used methamphetamine (%)
Health Insurance - People covered by health insurance (%)
Kidney Conditions-Urology - Avg. # of times urinating at night
Medical Conditions - People with asthma (%)
Medical Conditions - People with anemia (%)
Medical Conditions - People with psoriasis (%)
Medical Conditions - People with overweight (%)
Medical Conditions - Elderly people having difficulties in thinking or remembering (%)
Medical Conditions - People who ever received blood transfusion (%)
Medical Conditions - People having trouble seeing even with glass/contacts (%)
Medical Conditions - People with arthritis (%)
Medical Conditions - People with gout (%)
Medical Conditions - People with congestive heart failure (%)
Medical Conditions - People with coronary heart disease (%)
Medical Conditions - People with angina pectoris (%)
Medical Conditions - People who ever had heart attack (%)
Medical Conditions - People who ever had stroke (%)
Medical Conditions - People with emphysema (%)
Medical Conditions - People with thyroid problem (%)
Medical Conditions - People with chronic bronchitis (%)
Medical Conditions - People with any liver condition (%)
Medical Conditions - People who ever had cancer or malignancy (%)
Mental Health - People who have little interest in doing things (%)
Mental Health - People feeling down, depressed, or hopeless (%)
Mental Health - People who have trouble sleeping or sleeping too much (%)
Mental Health - People feeling tired or having little energy (%)
Mental Health - People with poor appetite or overeating (%)
Mental Health - People feeling bad about themself (%)
Mental Health - People who have trouble concentrating on things (%)
Mental Health - People moving or speaking slowly or too fast (%)
Mental Health - People having thoughts they would be better off dead (%)
Oral Health - Average years since last visit a dentist
Oral Health - People embarrassed because of mouth (%)
Oral Health - People with gum disease (%)
Oral Health - General health of teeth and gums (%)
Oral Health - Average days a week using dental floss/device
Oral Health - Average days a week using mouthwash for dental problem
Oral Health - Average number of teeth
Pesticide Use - Households using pesticides to control insects (%)
Pesticide Use - Households using pesticides to kill weeds (%)
Physical Activity - People doing vigorous-intensity work activities (%)
Physical Activity - People doing moderate-intensity work activities (%)
Physical Activity - People walking or bicycling (%)
Physical Activity - People doing vigorous-intensity recreational activities (%)
Physical Activity - People doing moderate-intensity recreational activities (%)
Physical Activity - Average hours a day doing sedentary activities
Physical Activity - Average hours a day watching TV or videos
Physical Activity - Average hours a day using computer
Physical Functioning - People having limitations keeping them from working (%)
Physical Functioning - People limited in amount of work they can do (%)
Physical Functioning - People that need special equipment to walk (%)
Physical Functioning - People experiencing confusion/memory problems (%)
Physical Functioning - People requiring special healthcare equipment (%)
Prescription Medications - Average number of prescription medicines taking
Preventive Aspirin Use - Adults 40+ taking low-dose aspirin (%)
Reproductive Health - Vaginal deliveries (%)
Reproductive Health - Cesarean deliveries (%)
Reproductive Health - Deliveries resulted in a live birth (%)
Reproductive Health - Pregnancies resulted in a delivery (%)
Reproductive Health - Women breastfeeding newborns (%)
Reproductive Health - Women that had a hysterectomy (%)
Reproductive Health - Women that had both ovaries removed (%)
Reproductive Health - Women that have ever taken birth control pills (%)
Reproductive Health - Women taking birth control pills (%)
Reproductive Health - Women that have ever used Depo-Provera or injectables (%)
Reproductive Health - Women that have ever used female hormones (%)
Sexual Behavior - People 18+ that ever had sex (vaginal, anal, or oral) (%)
Sexual Behavior - Males 18+ that ever had vaginal sex with a woman (%)
Sexual Behavior - Males 18+ that ever performed oral sex on a woman (%)
Sexual Behavior - Males 18+ that ever had anal sex with a woman (%)
Sexual Behavior - Males 18+ that ever had any sex with a man (%)
Sexual Behavior - Females 18+ that ever had vaginal sex with a man (%)
Sexual Behavior - Females 18+ that ever performed oral sex on a man (%)
Sexual Behavior - Females 18+ that ever had anal sex with a man (%)
Sexual Behavior - Females 18+ that ever had any kind of sex with a woman (%)
Sexual Behavior - Average age people first had sex
Sexual Behavior - Average number of female sex partners in lifetime (males 18+)
Sexual Behavior - Average number of female vaginal sex partners in lifetime (males 18+)
Sexual Behavior - Average age people first performed oral sex on a woman (18+)
Sexual Behavior - Average number of woman performed oral sex on in lifetime (18+)
Sexual Behavior - Average number of male sex partners in lifetime (males 18+)
Sexual Behavior - Average number of male anal sex partners in lifetime (males 18+)
Sexual Behavior - Average age people first performed oral sex on a man (18+)
Sexual Behavior - Average number of male oral sex partners in lifetime (18+)
Sexual Behavior - People using protection when performing oral sex (%)
Sexual Behavior - Average number of times people have vaginal or anal sex a year
Sexual Behavior - People having sex without condom (%)
Sexual Behavior - Average number of male sex partners in lifetime (females 18+)
Sexual Behavior - Average number of male vaginal sex partners in lifetime (females 18+)
Sexual Behavior - Average number of female sex partners in lifetime (females 18+)
Sexual Behavior - Circumcised males 18+ (%)
Sleep Disorders - Average hours sleeping at night
Sleep Disorders - People that has trouble sleeping (%)
Smoking-Cigarette Use - People smoking cigarettes (%)
Taste & Smell - People 40+ having problems with smell (%)
Taste & Smell - People 40+ having problems with taste (%)
Taste & Smell - People 40+ that ever had wisdom teeth removed (%)
Taste & Smell - People 40+ that ever had tonsils teeth removed (%)
Taste & Smell - People 40+ that ever had a loss of consciousness because of a head injury (%)
Taste & Smell - People 40+ that ever had a broken nose or other serious injury to face or skull (%)
Taste & Smell - People 40+ that ever had two or more sinus infections (%)
Weight - Average height (inches)
Weight - Average weight (pounds)
Weight - Average BMI
Weight - People that are obese (%)
Weight - People that ever were obese (%)
Weight - People trying to lose weight (%)
Officers per 1,000 residents here:
2.60Louisiana average:
3.56
Latest news from Sulphur, LA collected exclusively by city-data.com from local newspapers, TV, and radio stations
Ancestries: French Canadian (18.1%), French (15.7%), American (10.0%), English (5.7%), Cajun (4.6%), Swedish (3.6%).
Current Local Time:
Land area: 10.0 square miles.
Population density: 2,026 people per square mile (low).
792 residents are foreign born (1.6% Latin America , 1.0% Europe , 0.6% Asia , 0.5% Africa ).
This city:
3.9%Louisiana:
4.2%
Median real estate property taxes paid for housing units with mortgages in 2022: $845 (0.5%)Median real estate property taxes paid for housing units with no mortgage in 2022: $349 (0.2%)
Nearest city with pop. 50,000+: Lake Charles, LA
Nearest city with pop. 200,000+: Southeast Montgomery, TX (120.4 miles
Nearest city with pop. 1,000,000+: Houston, TX
Nearest cities:
Latitude: 30.23 N, Longitude: 93.36 W
Daytime population change due to commuting: +4,779 (+23.4%)Workers who live and work in this city: 3,815 (45.2%)
Single-family new house construction building permits:
2022: 82 buildings , average cost: $125,9002021: 81 buildings , average cost: $126,7002020: 110 buildings , average cost: $127,2002019: 136 buildings , average cost: $124,1002018: 102 buildings , average cost: $115,8002017: 117 buildings , average cost: $118,2002016: 61 buildings , average cost: $120,0002015: 55 buildings , average cost: $120,0002014: 46 buildings , average cost: $120,0002013: 51 buildings , average cost: $122,0002012: 19 buildings , average cost: $134,0002011: 14 buildings , average cost: $170,3002010: 21 buildings , average cost: $152,7002009: 80 buildings , average cost: $177,8002008: 87 buildings , average cost: $112,1002007: 25 buildings , average cost: $160,0002006: 36 buildings , average cost: $160,0002005: 44 buildings , average cost: $160,0002004: 42 buildings , average cost: $160,1002003: 39 buildings , average cost: $159,5002002: 37 buildings , average cost: $159,5002001: 33 buildings , average cost: $159,3002000: 29 buildings , average cost: $160,4001999: 33 buildings , average cost: $155,6001998: 24 buildings , average cost: $178,8001997: 36 buildings , average cost: $108,500Unemployment in December 2023:
Most common industries in Sulphur, LA (%)
Both Males Females
Construction (11.0%)
Health care (8.7%)
Educational services (8.4%)
Chemicals (7.1%)
Accommodation & food services (6.2%)
Professional, scientific, technical services (4.5%)
Arts, entertainment, recreation (4.1%)
Construction (16.9%)
Chemicals (10.5%)
Petroleum & coal products (5.9%)
Professional, scientific, technical services (4.1%)
Accommodation & food services (3.7%)
Arts, entertainment, recreation (3.6%)
Educational services (3.6%)
Health care (15.6%)
Educational services (14.3%)
Accommodation & food services (9.3%)
Professional, scientific, technical services (5.1%)
Arts, entertainment, recreation (4.7%)
Food & beverage stores (4.1%)
Finance & insurance (4.1%)
Most common occupations in Sulphur, LA (%)
Both Males Females
Other production occupations, including supervisors (5.3%)
Electrical equipment mechanics and other installation, maintenance, and repair workers, including supervisors (3.8%)
Building and grounds cleaning and maintenance occupations (3.6%)
Secretaries and administrative assistants (3.6%)
Other office and administrative support workers, including supervisors (3.5%)
Preschool, kindergarten, elementary, and middle school teachers (3.5%)
Other management occupations, except farmers and farm managers (3.3%)
Other production occupations, including supervisors (8.1%)
Electrical equipment mechanics and other installation, maintenance, and repair workers, including supervisors (6.4%)
Driver/sales workers and truck drivers (4.8%)
Other management occupations, except farmers and farm managers (4.2%)
Engineers (4.0%)
Building and grounds cleaning and maintenance occupations (3.9%)
Construction traders workers except carpenters, electricians, painters, plumbers, and construction laborers (3.6%)
Secretaries and administrative assistants (8.0%)
Preschool, kindergarten, elementary, and middle school teachers (6.4%)
Cashiers (6.1%)
Other office and administrative support workers, including supervisors (4.7%)
Registered nurses (3.9%)
Other sales and related occupations, including supervisors (3.7%)
Health technologists and technicians (3.7%)
Tornado activity:
Sulphur-area historical tornado activity is near Louisiana state average. It is 50% greater than the overall U.S. average.
On 11/7/1957, a category F4 (max. wind speeds 207-260 mph) tornado 23.8 miles away from the Sulphur city center killed one person and injured 81 people and caused between $500,000 and $5,000,000 in damages.
On 2/12/1971, a category F3 (max. wind speeds 158-206 mph) tornado 9.6 miles away from the city center injured one person and caused between $500,000 and $5,000,000 in damages.
Earthquake activity:
Sulphur-area historical earthquake activity is significantly above Louisiana state average. It is 39% smaller than the overall U.S. average. On 5/17/2012 at 08:12:00, a magnitude 4.8 (4.8 MW, Depth: 3.1 mi, Class: Light, Intensity: IV - V) earthquake occurred 131.6 miles away from the city center On 9/2/2013 at 23:51:15, a magnitude 4.3 (4.3 MW, Depth: 2.9 mi) earthquake occurred 132.2 miles away from Sulphur center On 9/2/2013 at 21:52:38, a magnitude 4.2 (4.2 MW, Depth: 3.0 mi) earthquake occurred 138.4 miles away from Sulphur center On 1/25/2013 at 07:01:19, a magnitude 4.1 (4.1 MB, Depth: 3.1 mi) earthquake occurred 124.7 miles away from the city center On 10/20/2011 at 12:24:41, a magnitude 4.8 (4.8 MW, Depth: 3.1 mi) earthquake occurred 299.2 miles away from the city center On 5/10/2012 at 15:15:38, a magnitude 3.9 (3.9 MW, Depth: 4.3 mi, Class: Light, Intensity: II - III) earthquake occurred 136.6 miles away from the city center Magnitude types: body-wave magnitude (MB), moment magnitude (MW) Natural disasters: The number of natural disasters in Calcasieu Parish (23) is greater than the US average (15).Major Disasters (Presidential) Declared: 16Emergencies Declared: 3Hurricanes: 11, Floods: 6, Storms: 6, Tropical Storms: 2, Fire: 1, Ice Storm: 1, Other: 2 (Note: some incidents may be assigned to more than one category). Main business address for: GLOBAL INDUSTRIES LTD OIL, GAS FIELD SERVICES, NBC ).
Hospitals in Sulphur: BEECH STREET COMMUNITY HOME (89 BEECH STREET) CALCASIEU GROUP HOME #2 (1402 W KENT DRIVE) CORNERSTONE HOSPITAL OF SOUTHWEST LA (703 E CYPRESS STREET) HAZEL STREET GROUP HOME (1100 NORTH HAZEL STREET) NORTH MITCHELL STREET HOME (130 NORTH MITCHELL STREET) POPLAR STREET COMMUNITY HOME (1410 POPLAR STREET) SUMMITT INSTITUTE OF SW LOUISIANA (703 CYPRESS ST) WEST CALCASIEU CAMERON HOSPITAL (Government - Hospital District or Authority, 701 EAST CYPRESS STREET) Nursing Homes in Sulphur: HIGH HOPE CARE CENTER (475 HIGH HOPE ROAD) HOLLY HILL HOUSE (100 KINGSTON ROAD) Dialysis Facilities in Sulphur: DVA RENAL HEALTHCARE - SULPHUR (944 S BEGLIS PKWAY) Amtrak station near Sulphur: 9 miles: LAKE CHARLES (433 RAILROAD AVE.) Services: fully wheelchair accessible, free short-term parking, free long-term parking, call for taxi service.
Colleges/universities with over 2000 students nearest to Sulphur:
McNeese State University (about 10 miles; Lake Charles, LA ; Full-time enrollment: 7,444)
SOWELA Technical Community College (about 12 miles; Lake Charles, LA ; FT enrollment: 2,160)
Lamar University (about 45 miles; Beaumont, TX ; FT enrollment: 13,658)
Lamar Institute of Technology (about 45 miles; Beaumont, TX ; FT enrollment: 2,023)
South Louisiana Community College (about 79 miles; Lafayette, LA ; FT enrollment: 2,519)
Acadiana Technical College-Lafayette Campus (about 79 miles; Lafayette, LA ; FT enrollment: 2,378)
University of Louisiana at Lafayette (about 81 miles; Lafayette, LA ; FT enrollment: 14,493)
Public high schools in Sulphur: SULPHUR HIGH SCHOOL Students: 1,920, Location: 100 SYCAMORE STREET, Grades: 8-12)JAKE DROST SCHOOL FOR EXCEPTIONAL CHILDREN Location: 1100 N CROCKER ST, Grades: PK-12)
Private high school in Sulphur: HOPE CHRISTIAN SCHOOL Students: 38, Location: 4501 MAPLEWOOD DR, Grades: UG-9)
Biggest public elementary/middle schools in Sulphur: MAPLEWOOD MIDDLE SCHOOL Students: 1,173, Location: 4401 MAPLEWOOD DR, Grades: PK-8)W. W. LEWIS MIDDLE SCHOOL Students: 892, Location: 1752 CYPRESS, Grades: 6-8)CYPRESS COVE ELEMENTARY SCHOOL Students: 709, Location: 700 CURRIE DRIVE, Grades: PK-5)VINCENT SETTLEMENT ELEMENTARY SCHOOL Students: 574, Location: 1072 VINCENT SETTLEMENT ROAD, Grades: PK-5)E. K. KEY ELEMENTARY SCHOOL Students: 516, Location: 1201 E BURTON STREET, Grades: PK-5)RICHARD W. VINCENT ELEMENTARY SCHOOL Students: 452, Location: 1634 BEGLIS PARKWAY, Grades: PK-5)W. T. HENNING ELEMENTARY SCHOOL Students: 405, Location: 774 HENNING DRIVE, Grades: PK-5)LEBLANC MIDDLE SCHOOL Students: 387, Location: 1100 N CROCKER, Grades: 6-8)FRASCH ELEMENTARY SCHOOL Location: 540 S HUNTINGTON, Grades: PK-5)
MAPLEWOOD ELEMENTARY Location: 4401 MAPLEWOOD DR., Grades: PK-5)
Private elementary/middle school in Sulphur: OUR LADY'S SCHOOL Students: 210, Location: 1111 CYPRESS ST, Grades: PK-8)
See full list of schools located in Sulphur
Notable locations in Sulphur: (A) , Frasch Park Golf Course (B) , Brimstone Historical Society (C) , Sulphur Industrial Park (D) , Cal-Cam Fairgrounds (E) , Sulphur Police Department Sub Station (F) , Sulphur City Marshal's Office (G) , Calcasieu Parish Sheriff's Office Sulphur Law Enforcement Center (H) , Brimstone Museum (I) , Calcasieu Parish Health Unit Sulphur Branch (J) , Calcasieu Parish Library Sulphur Regional Branch (K) , Sulphur Police Department (L) , Sulphur Fire Department Station 1 (M) , Holly Hill House (N) , Maplewood Branch Library (O) , Sulphur City Hall (P) , Sulphur Fire Department Station 3 (Q) , Sulphur Fire Department Station 2 (R) . Display/hide their locations on the map
Shopping Centers: (1) , Town and Country Shopping Center (2) , Plaza Shopping Center (3) , Parish Village Shopping Center (4) , Maplewood Plaza Shopping Center (5) , Kenwood Shopping Center (6) . Display/hide their locations on the map
Churches in Sulphur include: (A) , First Christian Church (B) , Covenant Presbyterian Church (C) , Cornerstone Christian Church (D) , Calvary Baptist Church (E) , Adonai Christian Fellowship Church (F) , Holy Trinity Episcopal Church (G) , Victory Worship Center (H) , Truth Apostolic Church (I) . Display/hide their locations on the map
Cemetery: (1) . Display/hide its location on the map
Parks in Sulphur include: (1) , Center Circle Recreation Center (2) . Display/hide their locations on the map
Tourist attraction:
Hotels:
Birthplace of: Michael Sarver - Idol participant, Bennie Ellender - Football player and coach, Grady A. Dugas - Inventor, Johnny Grunge - Professional wrestler, Marcus R. Clark - Judge, Martin Zeno - College basketball player (Texas Tech Red Raiders), Matt Stevens (quarterback) - Football player.
Calcasieu Parish has a predicted average indoor radon screening level less than 2 pCi/L (pico curies per liter) - Low Potential Drinking water stations with addresses in Sulphur and their reported violations in the past:
CALCASIEU PARISH WW DIST 9 CARLYSS (Population served: 11,691, Groundwater):
Past health violations:
MCL, Monthly (TCR) - In OCT-2009, Contaminant: Coliform. Follow-up actions: St Public Notif requested (NOV-12-2009), St Violation/Reminder Notice (NOV-12-2009), St Compliance achieved (DEC-28-2009), St Public Notif received (DEC-28-2009)
MCL, Monthly (TCR) - In JUN-2009, Contaminant: Coliform. Follow-up actions: St Public Notif requested (JUL-10-2009), St Violation/Reminder Notice (JUL-10-2009), St Compliance achieved (JUL-16-2009), St Public Notif received (JUL-16-2009)
Past monitoring violations:
Monitoring and Reporting (DBP) - Between OCT-2013 and DEC-2013, Contaminant: Chlorine. Follow-up actions: St AO (w/o penalty) issued (DEC-16-2009), St Public Notif requested (NOV-08-2013), St Violation/Reminder Notice (NOV-08-2013), St Public Notif received (JAN-13-2014), St Compliance achieved (JAN-13-2014)
Failure To Address Deficiency - In JAN-15-2013, Contaminant: GROUNDWATER RULE. Follow-up actions: Fed FAO issued (MAR-05-2014)
Monitoring and Reporting (DBP) - Between OCT-2009 and DEC-2009, Contaminant: TTHM. Follow-up actions: St AO (w/o penalty) issued (DEC-16-2009), St Public Notif requested (JAN-15-2010), St Violation/Reminder Notice (JAN-15-2010)
Monitoring and Reporting (DBP) - Between OCT-2009 and DEC-2009, Contaminant: Total Haloacetic Acids (HAA5). Follow-up actions: St AO (w/o penalty) issued (DEC-16-2009), St Public Notif requested (JAN-15-2010), St Violation/Reminder Notice (JAN-15-2010)
Monitoring and Reporting (DBP) - Between APR-2009 and JUN-2009, Contaminant: Total Haloacetic Acids (HAA5). Follow-up actions: St AO (w/o penalty) issued (DEC-16-2009), St Public Notif requested (JAN-15-2010), St Violation/Reminder Notice (JAN-15-2010)
3 other older monitoring violations
Population served: 5,880, Groundwater):
Past health violations:
MCL, Average - Between APR-2005 and JUN-2005, Contaminant: Total Haloacetic Acids (HAA5). Follow-up actions: St Violation/Reminder Notice (AUG-15-2005), St Public Notif requested (AUG-15-2005), St Public Notif received (FEB-02-2006), St Compliance achieved (MAR-03-2006)
MCL, Average - Between APR-2005 and JUN-2005, Contaminant: TTHM. Follow-up actions: St Violation/Reminder Notice (AUG-15-2005), St Public Notif requested (AUG-15-2005), St Public Notif received (FEB-02-2006), St Compliance achieved (MAR-03-2006)
Average household size: This city:
2.5 peopleLouisiana:
2.5 people
Percentage of family households: This city:
67.7%Whole state:
67.1%
Percentage of households with unmarried partners: This city:
7.0%Whole state:
6.8%
Likely homosexual households (counted as self-reported same-sex unmarried-partner households)
Lesbian couples: 0.3% of all households Gay men: 0.2% of all households
People in group quarters in Sulphur in 2010:
95 people in nursing facilities/skilled-nursing facilities
35 people in group homes intended for adults
3 people in other noninstitutional facilities
People in group quarters in Sulphur in 2000:
177 people in nursing homes
31 people in homes for the mentally retarded
22 people in hospitals/wards and hospices for chronically ill
22 people in military hospitals or wards for chronically ill
18 people in religious group quarters
17 people in local jails and other confinement facilities (including police lockups)
6 people in schools, hospitals, or wards for the intellectually disabled
Banks with most branches in Sulphur (2011 data):
Iberiabank: Sulphur Branch, Carlyss Branch, Cities Service Highway Branch, Maplewood Branch. Info updated 2011/06/08: Bank assets: $11,676.7 mil, Deposits: $9,387.9 mil, headquarters in Lafayette, LA, positive income , Commercial Lending Specialization, 187 total offices , Holding Company: Iberiabank Corporation
Jeff Davis Bank & Trust Company: Carlyss Branch at 4507 South Highway 27, branch established on 2005/03/07; Sulphur Branch at 2905 Maplewood Drive, branch established on 1996/09/23. Info updated 2006/11/03: Bank assets: $547.5 mil, Deposits: $475.6 mil, headquarters in Jennings, LA, positive income , 14 total offices , Holding Company: Jeff Davis Bancshares, Inc.
Capital One, National Association: Sulphur Branch at 1300 South Ruth Street, branch established on 1975/03/10; Maplewood Drive Branch at 3621 Maplewood Drive, branch established on 1975/10/20. Info updated 2011/07/01: Bank assets: $133,477.8 mil, Deposits: $97,063.7 mil, headquarters in Mclean, VA, positive income , 984 total offices , Holding Company: Capital One Financial Corporation
MidSouth Bank, National Association: Sulphur Branch at 1500 North Beglis Parkway, branch established on 2000/01/13. Info updated 2012/01/09: Bank assets: $1,396.1 mil, Deposits: $1,192.9 mil, headquarters in Lafayette, LA, positive income , Commercial Lending Specialization, 44 total offices , Holding Company: Midsouth Bancorp, Inc.
JPMorgan Chase Bank, National Association: Beglis Parkway Branch at 915 Beglis Parkway, branch established on 1959/10/23. Info updated 2011/11/10: Bank assets: $1,811,678.0 mil, Deposits: $1,190,738.0 mil, headquarters in Columbus, OH, positive income , International Specialization, 5577 total offices , Holding Company: Jpmorgan Chase & Co.
Whitney Bank: Sulphur Branch at 1805 Ruth Street, branch established on 1968/11/12. Info updated 2011/06/14: Bank assets: $14,882.3 mil, Deposits: $11,630.0 mil, headquarters in New Orleans, LA, positive income , Commercial Lending Specialization, 189 total offices , Holding Company: Hancock Holding Company
First Federal Bank of Louisiana: Maplewood Drive Branch at 2250 Maplewood Drive, branch established on 1949/10/31. Info updated 2011/07/21: Bank assets: $749.5 mil, Deposits: $588.2 mil, headquarters in Lake Charles, LA, positive income , Mortgage Lending Specialization, 15 total offices
First National Bank of Louisiana: Sulphur Branch at 3201 Maplewood Dr, branch established on 2003/06/16. Info updated 2006/11/03: Bank assets: $271.0 mil, Deposits: $245.7 mil, headquarters in Crowley, LA, positive income , Commercial Lending Specialization, 5 total offices , Holding Company: Financial Corporation Of Louisiana
City Savings Bank & Trust Company: Sulphur Branch at 1520 Maplewood Drive, branch established on 2004/10/08. Info updated 2012/04/04: Bank assets: $217.3 mil, Deposits: $191.3 mil, headquarters in Deridder, LA, positive income , Commercial Lending Specialization, 7 total offices , Holding Company: Louisiana Community Bancorp, Inc.
For population 15 years and over in Sulphur:
Never married: 33.5%Now married: 42.5%Separated: 0.6%Widowed: 7.9%Divorced: 15.5% For population 25 years and over in Sulphur:
High school or higher: 85.8%Bachelor's degree or higher: 16.5%Graduate or professional degree: 5.5%Unemployed: 5.3%Mean travel time to work (commute): 14.7 minutes
Education Gini index (Inequality in education) Here:
9.6Louisiana average:
11.9
Religion statistics for Sulphur, LA (based on Calcasieu Parish data)
Religion Adherents Congregations Catholic 64,050 20 Evangelical Protestant 51,570 155 Mainline Protestant 9,563 26 Black Protestant 8,823 26 Other 1,527 11 Orthodox 33 1 None 57,202 -
Source: Clifford Grammich, Kirk Hadaway, Richard Houseal, Dale E.Jones, Alexei Krindatch, Richie Stanley and Richard H.Taylor. 2012. 2010 U.S.Religion Census: Religious Congregations & Membership Study. Association of Statisticians of American Religious Bodies. Jones, Dale E., et al. 2002. Congregations and Membership in the United States 2000. Nashville, TN: Glenmary Research Center. Graphs represent county-level data
Food Environment Statistics: Number of grocery stores : 39Here :
2.11 / 10,000 pop.Louisiana :
2.56 / 10,000 pop.
Number of supercenters and club stores : 5Calcasieu Parish :
0.27 / 10,000 pop.Louisiana :
0.18 / 10,000 pop.
Number of convenience stores (no gas) : 33This county :
1.79 / 10,000 pop.Louisiana :
1.29 / 10,000 pop.
Number of convenience stores (with gas) : 89This county :
4.82 / 10,000 pop.State :
4.49 / 10,000 pop.
Number of full-service restaurants : 78This county :
4.23 / 10,000 pop.State :
5.92 / 10,000 pop.
Adult diabetes rate : Calcasieu Parish :
10.7%State :
10.9%
Low-income preschool obesity rate : Calcasieu Parish :
11.0%State :
13.7%
Health and Nutrition:
Average overall health of teeth and gums : Here:
44.3%Louisiana:
46.5%
Average BMI : Sulphur:
28.8Louisiana:
29.1
People feeling badly about themselves : Sulphur:
22.6%Louisiana:
20.3%
People not drinking alcohol at all : This city:
10.8%State:
11.4%
Average hours sleeping at night : General health condition : Average condition of hearing : This city:
77.7%State:
80.2%
More about Health and Nutrition of Sulphur, LA Residents
Local government employment and payroll (March 2022)
Function
Full-time employees
Monthly full-time payroll
Average yearly full-time wage
Part-time employees
Monthly part-time payroll
Firefighters
55 $300,110 $65,479 0 $0 Police Protection - Officers
42 $173,104 $49,458 0 $0 Streets and Highways
28 $107,178 $45,933 3 $3,089 Police - Other
25 $113,504 $54,482 0 $0 Financial Administration
19 $82,247 $51,945 0 $0 Judicial and Legal
16 $43,244 $32,433 2 $2,305 Sewerage
16 $74,465 $55,849 1 $982 Water Supply
16 $63,237 $47,428 1 $2,346 Other Government Administration
9 $40,229 $53,639 6 $3,818 Housing and Community Development (Local)
9 $37,655 $50,207 0 $0 Correction
6 $29,487 $58,974 0 $0 Fire - Other
6 $37,574 $75,148 0 $0 Solid Waste Management
1 $4,427 $53,124 0 $0
Totals for Government
248 $1,106,461 $53,538 13 $12,539
Sulphur government finances - Expenditure in 2021 (per resident):
Construction - Regular Highways: $3,399,000 ($167.09)
Sewerage: $2,039,000 ($100.24)Water Utilities: $1,453,000 ($71.43)Local Fire Protection: $82,000 ($4.03)Current Operations - Financial Administration: $18,552,000 ($912.00)
Local Fire Protection: $7,276,000 ($357.68)Police Protection: $6,715,000 ($330.11)Sewerage: $4,255,000 ($209.17)Regular Highways: $3,755,000 ($184.59)Water Utilities: $3,278,000 ($161.14)General - Other: $3,061,000 ($150.48)Central Staff Services: $2,150,000 ($105.69)Housing and Community Development: $2,124,000 ($104.41)Solid Waste Management: $1,637,000 ($80.47)Judicial and Legal Services: $835,000 ($41.05)Protective Inspection and Regulation - Other: $588,000 ($28.91)Health - Other: $289,000 ($14.21)General - Interest on Debt: $632,000 ($31.07)
Other Capital Outlay - Water Utilities: $18,000 ($0.88)
Police Protection: $17,000 ($0.84)Sewerage: $1,000 ($0.05)Total Salaries and Wages: $14,458,000 ($710.75)
Sulphur government finances - Revenue in 2021 (per resident):
Charges - Solid Waste Management: $1,831,000 ($90.01)
Sewerage: $199,000 ($9.78)Other: $95,000 ($4.67)Federal Intergovernmental - Housing and Community Development: $1,361,000 ($66.91)
Local Intergovernmental - Sewerage: $832,000 ($40.90)
General Local Government Support: $603,000 ($29.64)Miscellaneous - General Revenue - Other: $5,188,000 ($255.04)
Interest Earnings: $1,158,000 ($56.93)Fines and Forfeits: $244,000 ($11.99)Special Assessments: $164,000 ($8.06)Sale of Property: $93,000 ($4.57)Rents: $27,000 ($1.33)Donations From Private Sources: $9,000 ($0.44)Revenue - Water Utilities: $7,654,000 ($376.27)
State Intergovernmental - Other: $17,582,000 ($864.32)
General Local Government Support: $942,000 ($46.31)Highways: $425,000 ($20.89)Water Utilities: $13,000 ($0.64)Tax - General Sales and Gross Receipts: $22,312,000 ($1096.84)
Property: $2,821,000 ($138.68)Public Utilities Sales: $1,271,000 ($62.48)Occupation and Business License - Other: $1,032,000 ($50.73)Other License: $102,000 ($5.01)Alcoholic Beverage License: $28,000 ($1.38)Public Utility License: $15,000 ($0.74)
Sulphur government finances - Debt in 2021 (per resident):
Long Term Debt - Outstanding Unspecified Public Purpose: $70,193,000 ($3450.64)
Beginning Outstanding - Unspecified Public Purpose: $64,106,000 ($3151.41)Outstanding Nonguaranteed - Industrial Revenue: $21,478,000 ($1055.85)Beginning Outstanding - Public Debt for Private Purpose: $20,411,000 ($1003.39)Issue, Unspecified Public Purpose: $6,317,000 ($310.54)Issue, Nonguaranteed - Public Debt for Private Purpose: $2,252,000 ($110.71)Retired Nonguaranteed - Public Debt for Private Purpose: $1,185,000 ($58.25)Retired Unspecified Public Purpose: $230,000 ($11.31)Short Term Debt Outstanding - Beginning: $3,056,000 ($150.23)
End of Fiscal Year: $2,341,000 ($115.08)
Sulphur government finances - Cash and Securities in 2021 (per resident):
Other Funds - Cash and Securities: $49,387,000 ($2427.83)
Sinking Funds - Cash and Securities: $21,478,000 ($1055.85)
Businesses in Sulphur, LA
Name Count Name Count
AT&T 2 MasterBrand Cabinets 1 Advance Auto Parts 1 McDonald's 2 AutoZone 1 Microtel 1 Baymont Inn 1 Nike 2 Best Western 1 Papa John's Pizza 1 Blockbuster 1 Payless 1 Burger King 2 Penske 1 CVS 1 Pizza Hut 2 Chevrolet 1 Popeyes 2 Circle K 5 Quality 1 Comfort Suites 1 RadioShack 1 Cracker Barrel 1 Rite Aid 1 Cricket Wireless 1 Rue21 1 Crossland Economy Studios 1 SONIC Drive-In 2 Curves 1 Sprint Nextel 1 Days Inn 1 Studio 6 1 Domino's Pizza 1 Super 8 1 Econo Lodge 1 T-Mobile 2 FedEx 5 Taco Bell 2 Ford 1 The Room Place 1 GNC 1 True Value 1 GameStop 1 U-Haul 2 H&R Block 2 UPS 3 Holiday Inn 3 Waffle House 2 Jack In The Box 1 Walgreens 2 Kroger 1 Walmart 1 La Quinta 1 Wendy's 2 Lowe's 1 Wingate 1
Strongest AM radio stations in Sulphur:
KEZM (1310 AM; 0 kW; SULPHUR, LA)
KLCL (1470 AM; 5 kW; LAKE CHARLES, LA; Owner: APEX BROADCASTING, INC.)
KAOK (1400 AM; 1 kW; LAKE CHARLES, LA; Owner: PITTMAN BROADCAST SERVICES,LLC.)
KLVI (560 AM; 5 kW; BEAUMONT, TX; Owner: CAPSTAR TX LIMITED PARTNERSHIP)
KTRH (740 AM; 50 kW; HOUSTON, TX; Owner: AMFM TEXAS LICENSES LIMITED PARTNERSHIP)
KXZZ (1580 AM; 1 kW; LAKE CHARLES, LA; Owner: CUMULUS LICENSING CORP.)
KGOL (1180 AM; 50 kW; HUMBLE, TX; Owner: ENTRAVISION HOLDINGS, LLC)
KDEI (1250 AM; 5 kW; PORT ARTHUR, TX; Owner: RADIO MARIA, INC.)
KEEL (710 AM; 50 kW; SHREVEPORT, LA; Owner: CITICASTERS LICENSES, L.P.)
KQHN (1510 AM; daytime; 5 kW; NEDERLAND, TX; Owner: CUMULUS LICENSING CORP.)
KILE (1560 AM; 50 kW; BELLAIRE, TX; Owner: THE RAFTT CORPORATION)
WWL (870 AM; 50 kW; NEW ORLEANS, LA; Owner: ENTERCOM NEW ORLEANS LICENSE, LLC)
KWKH (1130 AM; 50 kW; SHREVEPORT, LA; Owner: CITICASTERS LICENSES, L.P.)
Strongest FM radio stations in Sulphur:
KYKZ (96.1 FM; LAKE CHARLES, LA; Owner: CUMULUS LICENSING CORP.)
KBIU (103.7 FM; LAKE CHARLES, LA; Owner: CUMULUS LICENSING CORP.)
KKGB (101.3 FM; SULPHUR, LA; Owner: CUMULUS LICENSING CORP.)
K215AO (90.9 FM; LAKE CHARLES, LA; Owner: LAMAR UNIVERSITY)
KBXG (99.5 FM; LAKE CHARLES, LA; Owner: APEX BROADCASTING, INC.)
KZWA (104.9 FM; MOSS BLUFF, LA; Owner: B & C BROADCASTING, LTD.)
KRWP (97.5 FM; BEAUMONT, TX; Owner: CUMULUS LICENSING CORP.)
KKMY (104.5 FM; ORANGE, TX; Owner: CAPSTAR TX LIMITED PARTNERSHIP)
KIOC (106.1 FM; ORANGE, TX; Owner: CAPSTAR TX LIMITED PARTNERSHIP)
KHLA (92.9 FM; JENNINGS, LA; Owner: APEX BROADCASTING, INC.)
KQXY-FM (94.1 FM; BEAUMONT, TX; Owner: CUMULUS LICENSING CORP.)
KYKR (95.1 FM; BEAUMONT, TX; Owner: CAPSTAR TX LIMITED PARTNERSHIP)
KTXB (89.7 FM; BEAUMONT, TX; Owner: FAMILY STATIONS, INC.)
KVEE (107.5 FM; LAKE ARTHUR, LA; Owner: APEX BROADCASTING, INC.)
KQLK (97.9 FM; DE RIDDER, LA; Owner: PITTMAN BROADCASTING SERVICES, LLC)
KOJO (91.7 FM; LAKE CHARLES, LA; Owner: RADIO MARIA, INC.)
TV broadcast stations around Sulphur:
KVHP (Channel 29; LAKE CHARLES, LA; Owner: NATIONAL COMMUNICATIONS, INC.)
KFAM-LP (Channel 58; LAKE CHARLES, LA; Owner: RICE CAPITAL BROADCASTING, INC.)
KPLC (Channel 7; LAKE CHARLES, LA; Owner: LIBCO, INC.)
K51EC (Channel 51; LAKE CHARLES, LA; Owner: NATIONAL MINORITY T.V., INC.)
KLTL-TV (Channel 18; LAKE CHARLES, LA; Owner: LOUISIANA EDUCATIONAL TELEVISION AUTHORITY)
K09VO (Channel 9; BEAUMONT, TX; Owner: BEAUMONT BROADCASTING CORPORATION)
KITU (Channel 34; BEAUMONT, TX; Owner: COMMUNITY EDUCATIONAL TELEVISION INC)
KBTV-TV (Channel 4; PORT ARTHUR, TX; Owner: NEXSTAR BROADCASTING OF BEAUMONT/PORT ARTHUR, L.L.C.)
KFDM-TV (Channel 6; BEAUMONT, TX; Owner: FREEDOM BROADCASTING OF TEXAS, INC.)
National Bridge Inventory (NBI) Statistics 85 Number of bridges968ft / 295m Total length $11,200,000 Total costs1,873,758 Total average daily traffic129,074 Total average daily truck traffic
New bridges - historical statistics
1 1930-1939 2 1940-1949 2 1950-1959 24 1960-1969 2 1970-1979 6 1980-1989 4 1990-1999 6 2000-2009 8 2010-2019 3 2020-2022
See full National Bridge Inventory statistics for Sulphur, LA
Home Mortgage Disclosure Act Aggregated Statistics For Year 2009(Based on 4 full and 1 partial tracts) A) FHA, FSA/RHS & VA B) Conventional C) Refinancings D) Home Improvement Loans E) Loans on Dwellings For 5+ Families F) Non-occupant Loans on G) Loans On Manufactured Number Average Value Number Average Value Number Average Value Number Average Value Number Average Value Number Average Value Number Average Value
LOANS ORIGINATED 95 $112,140 75 $97,439 214 $120,474 49 $34,852 5 $437,256 35 $147,592 22 $51,720 APPLICATIONS APPROVED, NOT ACCEPTED 2 $80,905 7 $116,391 28 $123,560 3 $18,987 0 $0 1 $218,520 1 $26,200 APPLICATIONS DENIED 22 $103,496 31 $95,480 99 $114,556 24 $22,618 0 $0 4 $112,308 14 $44,470 APPLICATIONS WITHDRAWN 2 $104,000 11 $80,501 30 $114,241 0 $0 1 $115,000 1 $115,000 3 $32,200 FILES CLOSED FOR INCOMPLETENESS 4 $126,250 2 $104,910 17 $115,522 1 $20,000 0 $0 0 $0 1 $82,820
Aggregated Statistics For Year 2008(Based on 4 full and 1 partial tracts) A) FHA, FSA/RHS & VA B) Conventional C) Refinancings D) Home Improvement Loans E) Loans on Dwellings For 5+ Families F) Non-occupant Loans on G) Loans On Manufactured Number Average Value Number Average Value Number Average Value Number Average Value Number Average Value Number Average Value Number Average Value
LOANS ORIGINATED 100 $110,176 127 $100,276 163 $92,946 69 $32,995 7 $257,569 52 $66,963 28 $33,282 APPLICATIONS APPROVED, NOT ACCEPTED 6 $122,558 22 $57,191 19 $104,416 6 $27,053 0 $0 3 $61,967 22 $47,375 APPLICATIONS DENIED 23 $116,404 50 $76,908 103 $98,765 45 $29,891 0 $0 8 $42,242 35 $48,338 APPLICATIONS WITHDRAWN 5 $113,316 10 $112,464 33 $114,480 1 $106,000 0 $0 1 $80,000 2 $40,480 FILES CLOSED FOR INCOMPLETENESS 2 $118,370 4 $125,332 4 $89,560 2 $52,440 0 $0 1 $54,880 0 $0
Aggregated Statistics For Year 2007(Based on 4 full and 1 partial tracts) A) FHA, FSA/RHS & VA B) Conventional C) Refinancings D) Home Improvement Loans E) Loans on Dwellings For 5+ Families F) Non-occupant Loans on G) Loans On Manufactured Number Average Value Number Average Value Number Average Value Number Average Value Number Average Value Number Average Value Number Average Value
LOANS ORIGINATED 38 $104,738 250 $100,992 221 $82,300 84 $28,942 5 $416,850 39 $54,857 32 $37,427 APPLICATIONS APPROVED, NOT ACCEPTED 5 $33,524 47 $88,458 41 $90,310 8 $28,519 0 $0 2 $67,925 27 $66,747 APPLICATIONS DENIED 5 $84,158 79 $84,644 107 $96,549 48 $43,117 1 $169,000 3 $68,977 36 $46,224 APPLICATIONS WITHDRAWN 0 $0 20 $95,871 57 $109,701 3 $19,990 0 $0 5 $89,152 4 $41,410 FILES CLOSED FOR INCOMPLETENESS 2 $68,445 11 $95,805 16 $107,259 1 $67,000 0 $0 0 $0 0 $0
Aggregated Statistics For Year 2006(Based on 4 full and 1 partial tracts) A) FHA, FSA/RHS & VA B) Conventional C) Refinancings D) Home Improvement Loans E) Loans on Dwellings For 5+ Families F) Non-occupant Loans on G) Loans On Manufactured Number Average Value Number Average Value Number Average Value Number Average Value Number Average Value Number Average Value Number Average Value
LOANS ORIGINATED 28 $102,133 317 $84,897 160 $74,400 78 $26,595 2 $376,240 43 $60,905 38 $26,649 APPLICATIONS APPROVED, NOT ACCEPTED 7 $67,664 53 $72,170 42 $71,391 6 $29,298 0 $0 0 $0 25 $47,425 APPLICATIONS DENIED 16 $86,077 102 $70,530 107 $84,946 41 $26,793 1 $74,840 6 $76,538 36 $40,634 APPLICATIONS WITHDRAWN 1 $91,000 16 $76,806 91 $98,928 16 $62,361 0 $0 3 $81,210 1 $40,910 FILES CLOSED FOR INCOMPLETENESS 2 $83,925 14 $86,327 28 $96,988 0 $0 0 $0 1 $35,000 0 $0
Aggregated Statistics For Year 2005(Based on 4 full and 1 partial tracts) A) FHA, FSA/RHS & VA B) Conventional C) Refinancings D) Home Improvement Loans E) Loans on Dwellings For 5+ Families F) Non-occupant Loans on G) Loans On Manufactured Number Average Value Number Average Value Number Average Value Number Average Value Number Average Value Number Average Value Number Average Value
LOANS ORIGINATED 17 $82,474 278 $75,235 205 $75,995 67 $26,984 0 $0 55 $52,662 19 $24,141 APPLICATIONS APPROVED, NOT ACCEPTED 3 $76,667 55 $66,670 52 $68,393 6 $28,478 1 $310,560 6 $42,002 18 $41,299 APPLICATIONS DENIED 7 $56,526 116 $59,320 175 $80,511 51 $28,096 0 $0 13 $45,742 54 $35,824 APPLICATIONS WITHDRAWN 1 $112,000 28 $84,612 90 $88,201 19 $178,527 0 $0 2 $99,475 1 $30,000 FILES CLOSED FOR INCOMPLETENESS 0 $0 8 $69,878 41 $96,414 0 $0 0 $0 3 $66,333 0 $0
Aggregated Statistics For Year 2004(Based on 4 full and 1 partial tracts) A) FHA, FSA/RHS & VA B) Conventional C) Refinancings D) Home Improvement Loans E) Loans on Dwellings For 5+ Families F) Non-occupant Loans on G) Loans On Manufactured Number Average Value Number Average Value Number Average Value Number Average Value Number Average Value Number Average Value Number Average Value
LOANS ORIGINATED 29 $99,524 244 $83,560 308 $75,197 81 $23,252 4 $147,875 61 $70,347 22 $30,293 APPLICATIONS APPROVED, NOT ACCEPTED 5 $92,200 42 $64,838 59 $71,921 14 $25,529 0 $0 5 $48,564 19 $38,445 APPLICATIONS DENIED 3 $74,347 83 $59,530 201 $68,116 71 $31,586 0 $0 15 $54,869 57 $38,303 APPLICATIONS WITHDRAWN 2 $78,325 21 $96,068 91 $76,372 7 $35,327 1 $87,000 3 $93,937 1 $64,000 FILES CLOSED FOR INCOMPLETENESS 1 $58,310 4 $83,288 48 $90,676 4 $42,995 0 $0 2 $53,470 0 $0
Aggregated Statistics For Year 2003(Based on 4 full and 1 partial tracts) A) FHA, FSA/RHS & VA B) Conventional C) Refinancings D) Home Improvement Loans E) Loans on Dwellings For 5+ Families F) Non-occupant Loans on Number Average Value Number Average Value Number Average Value Number Average Value Number Average Value Number Average Value
LOANS ORIGINATED 34 $89,989 178 $80,455 504 $85,819 101 $20,322 2 $259,500 53 $66,344 APPLICATIONS APPROVED, NOT ACCEPTED 5 $65,144 16 $68,995 88 $68,968 12 $27,029 0 $0 3 $55,333 APPLICATIONS DENIED 3 $77,667 44 $50,820 188 $74,217 54 $16,168 1 $4,000 6 $134,810 APPLICATIONS WITHDRAWN 1 $86,000 12 $70,684 100 $86,347 2 $1,485 0 $0 1 $97,000 FILES CLOSED FOR INCOMPLETENESS 1 $120,000 2 $55,500 19 $84,462 0 $0 0 $0 0 $0
Aggregated Statistics For Year 2002(Based on 4 full and 1 partial tracts) A) FHA, FSA/RHS & VA B) Conventional C) Refinancings D) Home Improvement Loans E) Loans on Dwellings For 5+ Families F) Non-occupant Loans on Number Average Value Number Average Value Number Average Value Number Average Value Number Average Value Number Average Value
LOANS ORIGINATED 32 $74,395 181 $71,860 318 $68,758 132 $16,850 5 $123,906 47 $46,205 APPLICATIONS APPROVED, NOT ACCEPTED 6 $63,233 22 $48,814 70 $66,639 11 $22,165 0 $0 5 $31,810 APPLICATIONS DENIED 10 $67,166 70 $53,732 155 $59,547 47 $11,526 0 $0 11 $36,261 APPLICATIONS WITHDRAWN 4 $75,935 14 $82,616 51 $70,042 2 $4,225 0 $0 3 $51,533 FILES CLOSED FOR INCOMPLETENESS 1 $98,000 6 $67,103 25 $73,488 0 $0 0 $0 1 $63,080
Aggregated Statistics For Year 2001(Based on 4 full and 1 partial tracts) A) FHA, FSA/RHS & VA B) Conventional C) Refinancings D) Home Improvement Loans E) Loans on Dwellings For 5+ Families F) Non-occupant Loans on Number Average Value Number Average Value Number Average Value Number Average Value Number Average Value Number Average Value
LOANS ORIGINATED 53 $74,929 166 $71,238 321 $62,601 94 $13,195 1 $658,000 44 $48,344 APPLICATIONS APPROVED, NOT ACCEPTED 2 $75,000 41 $43,254 46 $59,662 16 $19,692 0 $0 5 $50,910 APPLICATIONS DENIED 9 $63,370 97 $37,549 168 $58,521 32 $16,960 1 $1,014,000 11 $33,105 APPLICATIONS WITHDRAWN 5 $75,190 11 $55,882 67 $60,330 4 $32,583 0 $0 1 $40,760 FILES CLOSED FOR INCOMPLETENESS 2 $67,920 3 $49,970 12 $70,536 0 $0 0 $0 2 $51,500
Aggregated Statistics For Year 2000(Based on 4 full and 1 partial tracts) A) FHA, FSA/RHS & VA B) Conventional C) Refinancings D) Home Improvement Loans E) Loans on Dwellings For 5+ Families F) Non-occupant Loans on Number Average Value Number Average Value Number Average Value Number Average Value Number Average Value Number Average Value
LOANS ORIGINATED 55 $68,011 169 $63,934 139 $52,732 123 $14,975 2 $132,960 36 $38,579 APPLICATIONS APPROVED, NOT ACCEPTED 18 $49,141 44 $37,422 54 $47,759 12 $24,059 1 $228,000 4 $48,205 APPLICATIONS DENIED 9 $59,570 164 $36,684 152 $46,586 35 $13,739 0 $0 20 $48,264 APPLICATIONS WITHDRAWN 1 $70,000 21 $46,347 79 $55,883 5 $5,334 0 $0 5 $29,228 FILES CLOSED FOR INCOMPLETENESS 1 $50,890 4 $28,462 16 $50,156 0 $0 1 $1,690,000 3 $47,947
Aggregated Statistics For Year 1999(Based on 4 full and 1 partial tracts) A) FHA, FSA/RHS & VA B) Conventional C) Refinancings D) Home Improvement Loans E) Loans on Dwellings For 5+ Families F) Non-occupant Loans on Number Average Value Number Average Value Number Average Value Number Average Value Number Average Value Number Average Value
LOANS ORIGINATED 47 $65,989 195 $65,245 220 $59,001 110 $12,190 2 $177,500 42 $34,337 APPLICATIONS APPROVED, NOT ACCEPTED 0 $0 52 $44,767 67 $58,232 14 $17,112 0 $0 6 $27,627 APPLICATIONS DENIED 13 $57,994 250 $42,182 124 $53,081 32 $20,412 1 $350,000 10 $48,600 APPLICATIONS WITHDRAWN 4 $61,640 29 $55,747 38 $67,703 8 $21,498 0 $0 0 $0 FILES CLOSED FOR INCOMPLETENESS 1 $59,000 3 $72,667 13 $75,021 1 $24,190 0 $0 2 $35,000
Detailed HMDA statistics for the following Tracts:
0028.00
, 0029.00 , 0030.00 , 0031.01 , 0031.02
Private Mortgage Insurance Companies Aggregated Statistics For Year 2009(Based on 3 full and 1 partial tracts) A) Conventional B) Refinancings C) Non-occupant Loans on Number Average Value Number Average Value Number Average Value
LOANS ORIGINATED 14 $140,219 5 $131,266 1 $162,000 APPLICATIONS APPROVED, NOT ACCEPTED 0 $0 2 $101,190 0 $0 APPLICATIONS DENIED 2 $110,635 1 $128,000 0 $0 APPLICATIONS WITHDRAWN 0 $0 0 $0 0 $0 FILES CLOSED FOR INCOMPLETENESS 0 $0 0 $0 0 $0
Aggregated Statistics For Year 2008(Based on 4 full and 1 partial tracts) A) Conventional B) Refinancings C) Non-occupant Loans on Number Average Value Number Average Value Number Average Value
LOANS ORIGINATED 45 $127,343 13 $109,917 3 $75,973 APPLICATIONS APPROVED, NOT ACCEPTED 14 $102,796 4 $123,908 0 $0 APPLICATIONS DENIED 4 $170,930 0 $0 0 $0 APPLICATIONS WITHDRAWN 0 $0 0 $0 0 $0 FILES CLOSED FOR INCOMPLETENESS 0 $0 0 $0 0 $0
Aggregated Statistics For Year 2007(Based on 4 full and 1 partial tracts) A) Conventional B) Refinancings C) Non-occupant Loans on Number Average Value Number Average Value Number Average Value
LOANS ORIGINATED 125 $111,328 25 $120,750 4 $55,705 APPLICATIONS APPROVED, NOT ACCEPTED 13 $104,128 8 $126,996 0 $0 APPLICATIONS DENIED 2 $89,930 4 $116,000 0 $0 APPLICATIONS WITHDRAWN 1 $116,000 3 $163,987 0 $0 FILES CLOSED FOR INCOMPLETENESS 0 $0 0 $0 0 $0
Aggregated Statistics For Year 2006(Based on 4 full and 1 partial tracts) A) Conventional B) Refinancings C) Non-occupant Loans on Number Average Value Number Average Value Number Average Value
LOANS ORIGINATED 102 $98,579 14 $123,041 6 $57,635 APPLICATIONS APPROVED, NOT ACCEPTED 11 $114,464 5 $97,800 0 $0 APPLICATIONS DENIED 0 $0 0 $0 0 $0 APPLICATIONS WITHDRAWN 6 $104,307 1 $198,950 0 $0 FILES CLOSED FOR INCOMPLETENESS 1 $92,200 0 $0 0 $0
Aggregated Statistics For Year 2005(Based on 4 full and 1 partial tracts) A) Conventional B) Refinancings C) Non-occupant Loans on Number Average Value Number Average Value Number Average Value
LOANS ORIGINATED 88 $91,863 17 $111,897 5 $47,148 APPLICATIONS APPROVED, NOT ACCEPTED 17 $94,237 6 $92,990 3 $65,747 APPLICATIONS DENIED 0 $0 1 $66,750 0 $0 APPLICATIONS WITHDRAWN 2 $170,265 0 $0 0 $0 FILES CLOSED FOR INCOMPLETENESS 2 $71,000 1 $93,000 0 $0
Aggregated Statistics For Year 2004(Based on 4 full and 1 partial tracts) A) Conventional B) Refinancings C) Non-occupant Loans on D) Loans On Manufactured Number Average Value Number Average Value Number Average Value Number Average Value
LOANS ORIGINATED 109 $89,143 31 $100,200 7 $92,849 1 $69,850 APPLICATIONS APPROVED, NOT ACCEPTED 6 $54,418 18 $95,256 0 $0 0 $0 APPLICATIONS DENIED 2 $70,470 2 $52,925 1 $49,850 0 $0 APPLICATIONS WITHDRAWN 4 $89,092 3 $115,667 1 $33,800 0 $0 FILES CLOSED FOR INCOMPLETENESS 1 $52,390 0 $0 0 $0 0 $0
Aggregated Statistics For Year 2003(Based on 4 full and 1 partial tracts) A) Conventional B) Refinancings C) Non-occupant Loans on Number Average Value Number Average Value Number Average Value
LOANS ORIGINATED 83 $79,865 87 $89,532 5 $75,260 APPLICATIONS APPROVED, NOT ACCEPTED 4 $96,815 7 $81,441 0 $0 APPLICATIONS DENIED 0 $0 1 $81,820 0 $0 APPLICATIONS WITHDRAWN 0 $0 2 $112,500 0 $0 FILES CLOSED FOR INCOMPLETENESS 0 $0 1 $98,020 0 $0
Aggregated Statistics For Year 2002(Based on 4 full and 1 partial tracts) A) Conventional B) Refinancings C) Non-occupant Loans on Number Average Value Number Average Value Number Average Value
LOANS ORIGINATED 90 $82,557 48 $88,744 4 $49,792 APPLICATIONS APPROVED, NOT ACCEPTED 5 $70,492 15 $91,027 1 $39,910 APPLICATIONS DENIED 1 $82,000 0 $0 0 $0 APPLICATIONS WITHDRAWN 1 $44,000 2 $69,765 0 $0 FILES CLOSED FOR INCOMPLETENESS 0 $0 0 $0 0 $0
Aggregated Statistics For Year 2001(Based on 4 full and 1 partial tracts) A) Conventional B) Refinancings C) Non-occupant Loans on Number Average Value Number Average Value Number Average Value
LOANS ORIGINATED 74 $79,890 37 $92,078 2 $39,965 APPLICATIONS APPROVED, NOT ACCEPTED 10 $76,793 14 $85,679 0 $0 APPLICATIONS DENIED 1 $24,000 4 $95,925 2 $92,500 APPLICATIONS WITHDRAWN 2 $86,000 1 $92,000 0 $0 FILES CLOSED FOR INCOMPLETENESS 0 $0 0 $0 0 $0
Aggregated Statistics For Year 2000(Based on 4 full and 1 partial tracts) A) Conventional B) Refinancings C) Non-occupant Loans on Number Average Value Number Average Value Number Average Value
LOANS ORIGINATED 68 $75,293 6 $59,995 4 $49,058 APPLICATIONS APPROVED, NOT ACCEPTED 4 $164,208 1 $46,900 0 $0 APPLICATIONS DENIED 0 $0 2 $102,500 0 $0 APPLICATIONS WITHDRAWN 5 $56,158 1 $63,860 1 $49,000 FILES CLOSED FOR INCOMPLETENESS 0 $0 2 $61,950 0 $0
Aggregated Statistics For Year 1999(Based on 4 full and 1 partial tracts) A) Conventional B) Refinancings C) Non-occupant Loans on Number Average Value Number Average Value Number Average Value
LOANS ORIGINATED 61 $70,409 29 $83,349 2 $24,590 APPLICATIONS APPROVED, NOT ACCEPTED 8 $90,102 7 $79,500 0 $0 APPLICATIONS DENIED 0 $0 2 $108,000 0 $0 APPLICATIONS WITHDRAWN 0 $0 0 $0 0 $0 FILES CLOSED FOR INCOMPLETENESS 1 $78,000 0 $0 0 $0
Detailed PMIC statistics for the following Tracts:
0028.00
, 0029.00 , 0030.00 , 0031.01 , 0031.02 Fire-safe hotels and motels in Sulphur, Louisiana:
La Quinta Inn #588, 2600 S Ruth, Sulphur, Louisiana 70663 Phone: (337) 527-8303, Fax: (337) 527-0132
Crossland Economy Studios - Lake Charles - Sulphur, 104 Mallard Rd, Sulphur, Louisiana 70665 Phone: (337) 625-5923, Fax: (337) 625-5875
Red Roof Inn, 2619 Ruth St, Sulphur, Louisiana 70665 Phone: (337) 527-1000, Fax: (337) 527-4400
Wingate By Wyndham, 300 Arena Rd, Sulphur, Louisiana 70665 Phone: (337) 527-5151, Fax: (337) 527-1414
Fairfield Inn & Suites Lake Charles, 2615 Ruth St, Sulphur, Louisiana 70664 Phone: (337) 528-2629
Holiday Inn, 2033 Ruth St, Sulphur, Louisiana 70663 Phone: (337) 528-2061, Fax: (337) 528-2061
Quality Inn & Suites, 320 S Cities Service Hwy, Sulphur, Louisiana 70663 Phone: (337) 626-7000, Fax: (337) 626-7013
Best Western, 1200 Pintail St, Sulphur, Louisiana 70665 Phone: (337) 625-9000, Fax: (337) 625-9700
7 other hotels and motels
All 15 fire-safe hotels and motels in Sulphur, Louisiana
Most common first names in Sulphur, LA among deceased individuals Name Count Lived (average)
Mary 164 75.6 years James 159 66.7 years John 153 72.7 years Joseph 117 72.8 years William 103 70.8 years Robert 95 68.8 years Charles 74 69.2 years George 70 76.0 years Dorothy 53 73.9 years Willie 53 76.6 years
Most common last names in Sulphur, LA among deceased individuals Last name Count Lived (average)
Vincent 126 72.4 years Broussard 83 75.3 years Guidry 82 76.0 years Smith 81 75.3 years Landry 78 72.2 years Hebert 68 77.9 years Miller 65 74.0 years Thibodeaux 63 70.0 years Trahan 63 77.4 years Fontenot 58 69.1 years
Sulphur compared to Louisiana state average:
Unemployed percentage significantly below state average. Black race population percentage significantly below state average. Length of stay since moving in significantly above state average.
#10 on the list of "Top 101 cities with the largest percentage of people in military hospitals or wards for chronically ill (population 1,000+)"
#50 (70663) on the list of "Top 101 zip codes with the largest percentage of French Canadian first ancestries (pop 5,000+)"
#69 (70663) on the list of "Top 101 zip codes with the most casinos in 2005"
#7 on the list of "Top 101 counties with the lowest percentage of residents that drank alcohol in the past 30 days"
#10 on the list of "Top 101 counties with the highest Sulfur Oxides Annual air pollution readings in 2012 (µg/m3 )"
#16 on the list of "Top 101 counties with the lowest percentage of residents that exercised in the past month"
#22 on the list of "Top 101 counties with the highest percentage of residents that keep firearms around their homes"
#30 on the list of "Top 101 counties with the highest Nitrogen Dioxide air pollution readings in 2012 (ppm)"
Top Patent Applicants
Lenny Lee Albin (5)
Robert K. Pertuit (4)
Paul A Filler (3)
Lenny L. Albin, Sr. (2)
Geoffrey Russell (1)
Ken M. Istre (1)
Toby Darbonne (1)
Christian Jones (1)
Teresa L. Marino (1)
Connie Genna (1)
Total of 26 patent applications in 2008-2024.
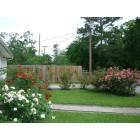
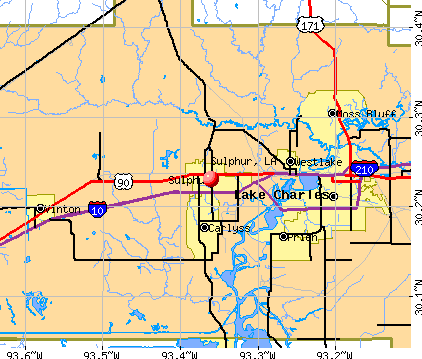


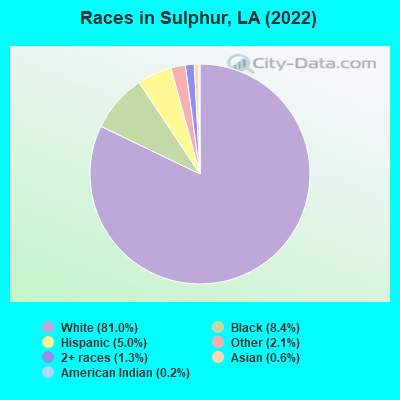
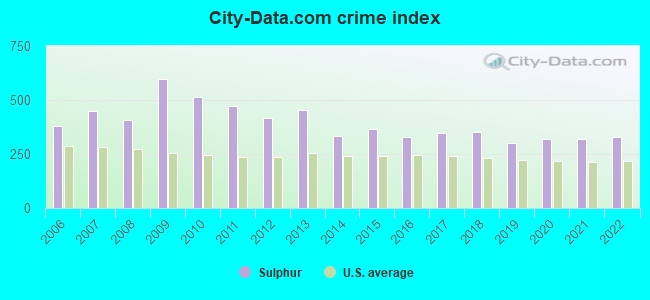
 Recent articles from our blog. Our writers, many of them Ph.D. graduates or candidates, create easy-to-read articles on a wide variety of topics.

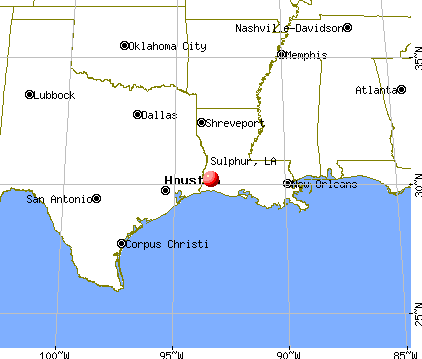
 (9.2 miles
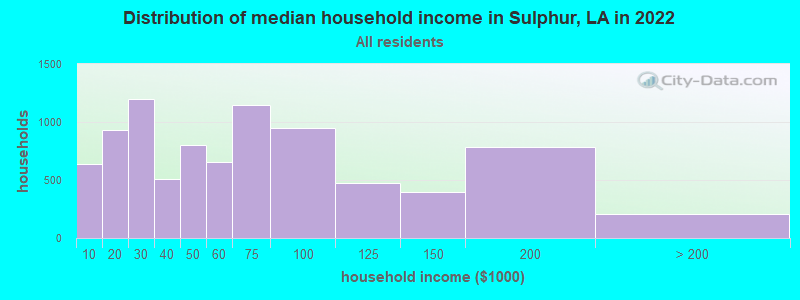
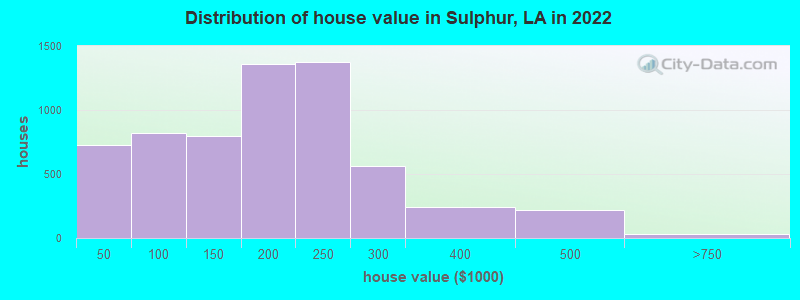
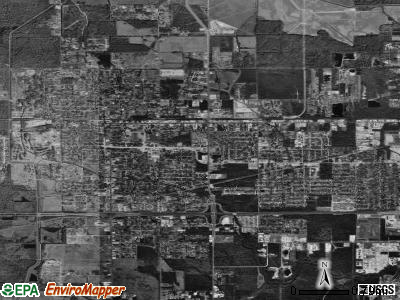
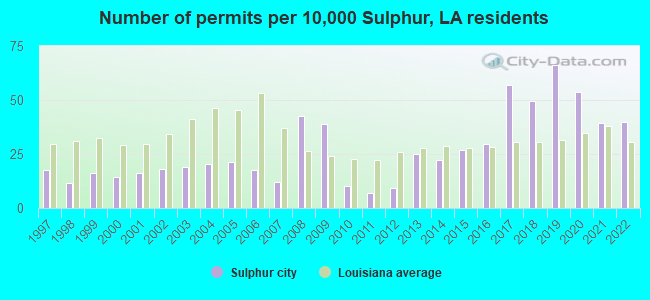
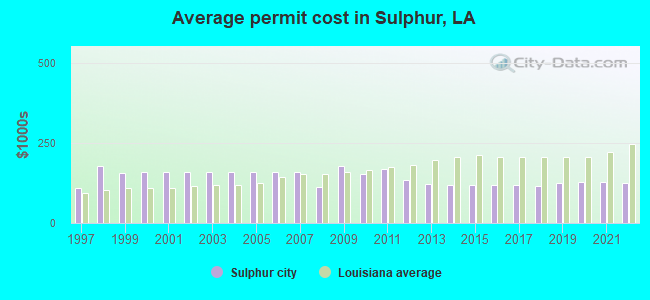
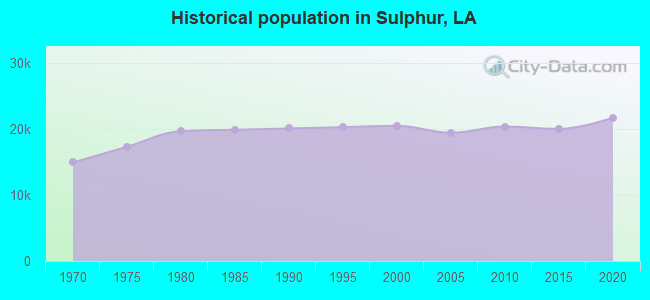
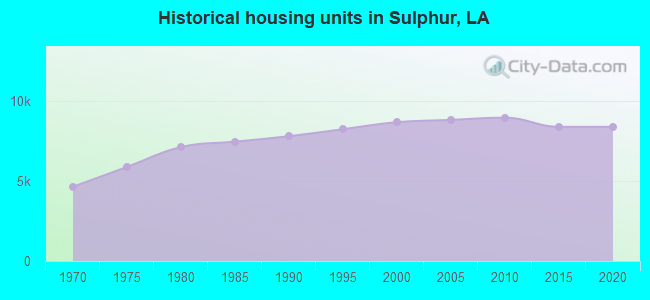
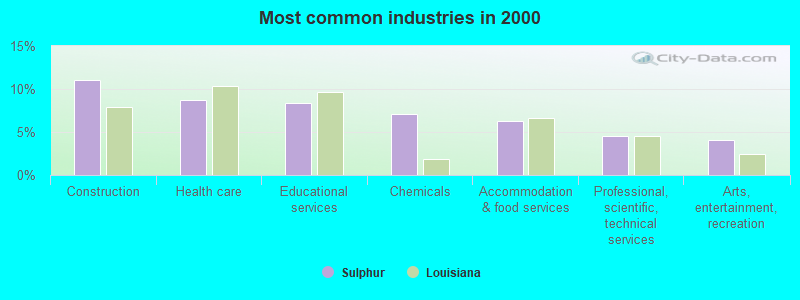
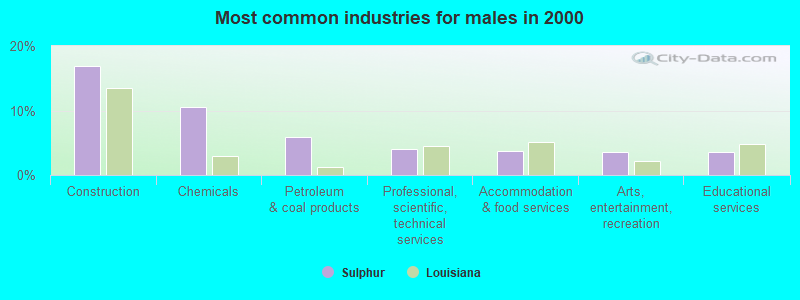
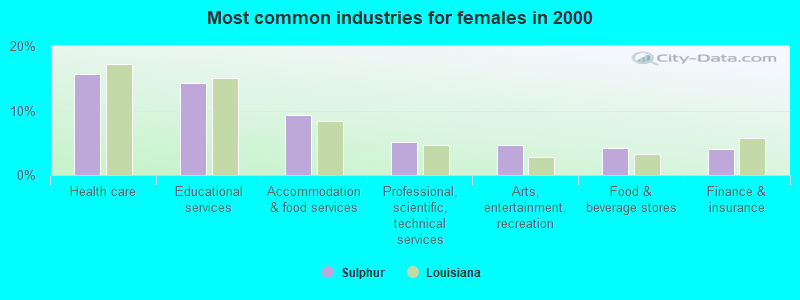

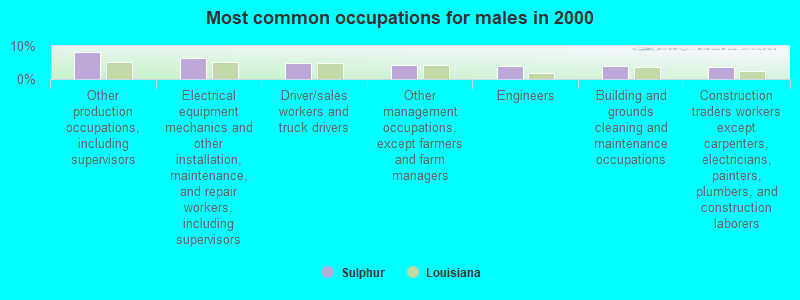
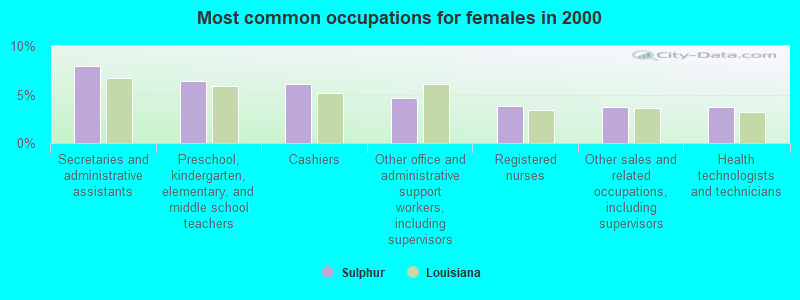


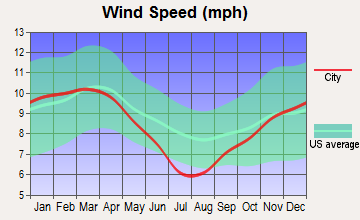

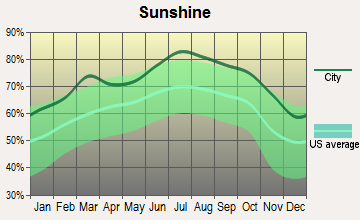
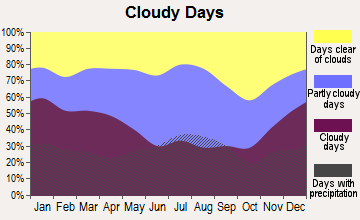
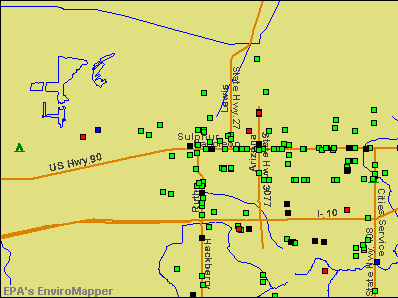

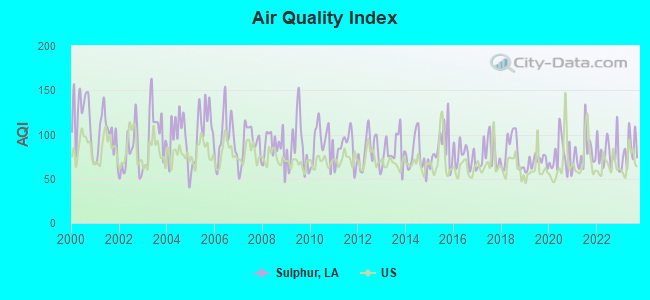
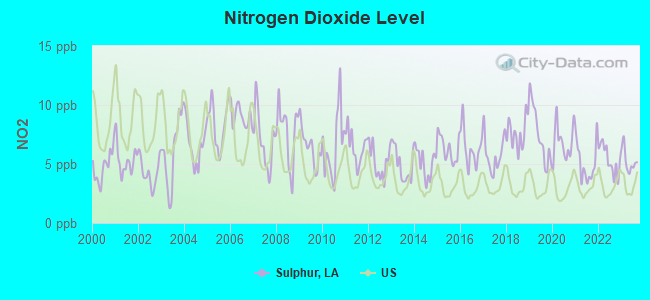
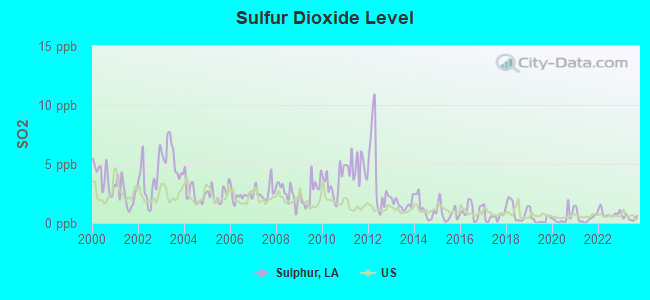
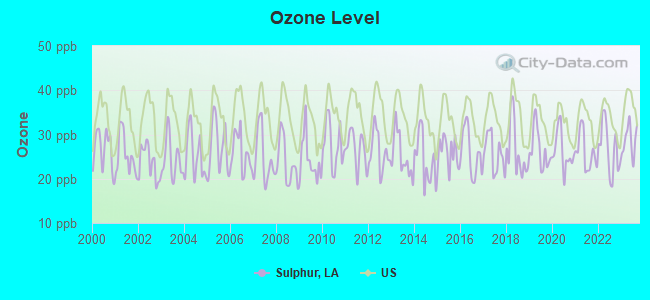
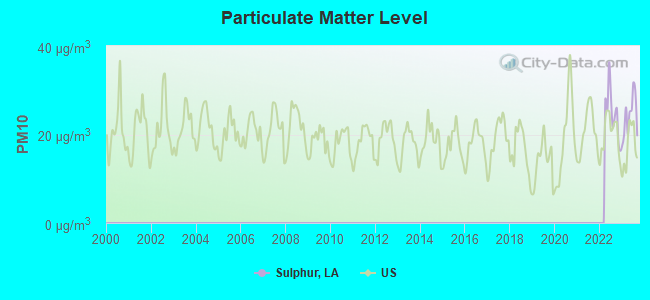

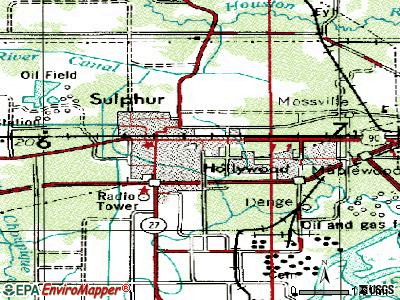
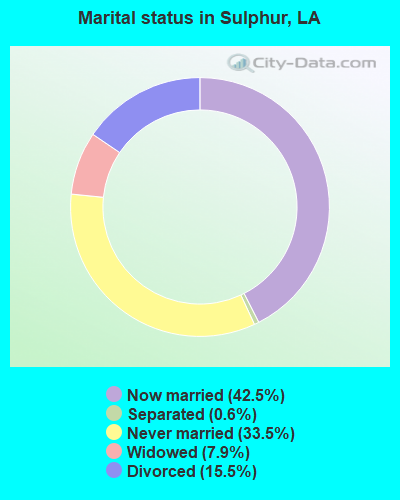
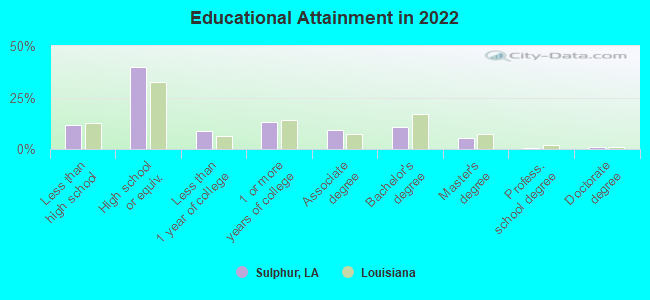
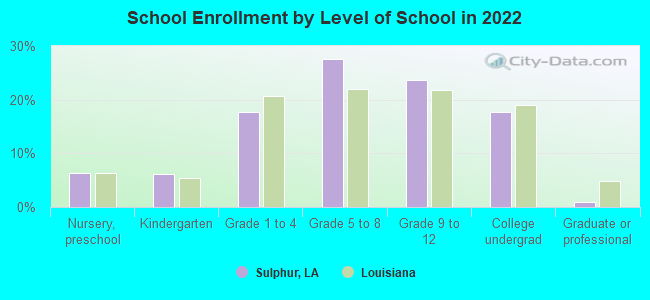
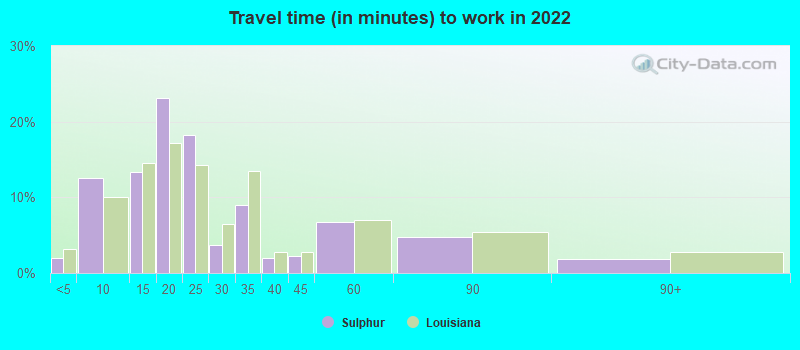
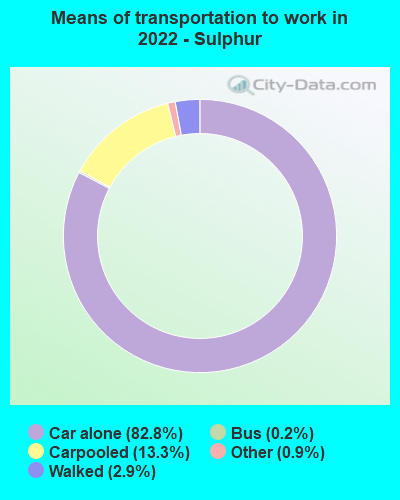
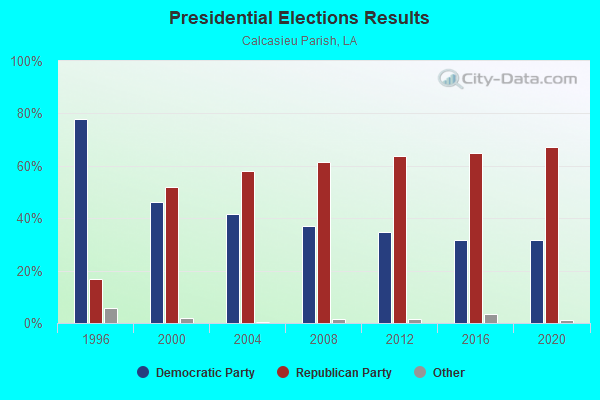
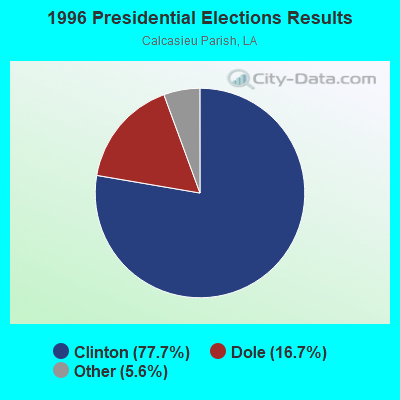
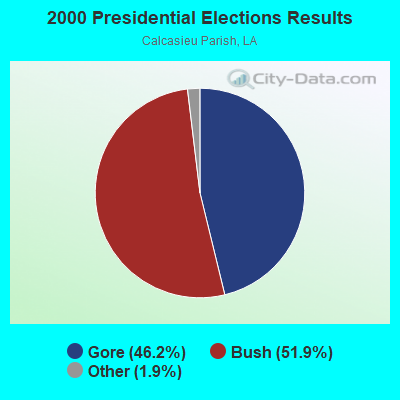
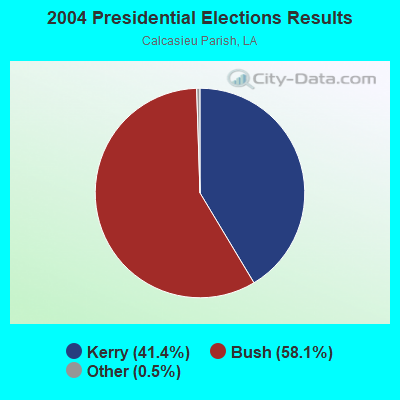
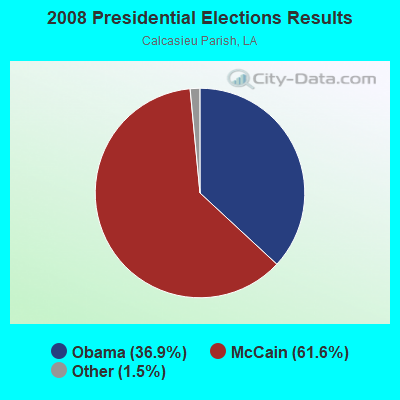
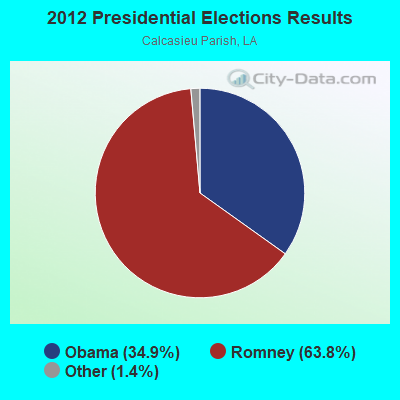
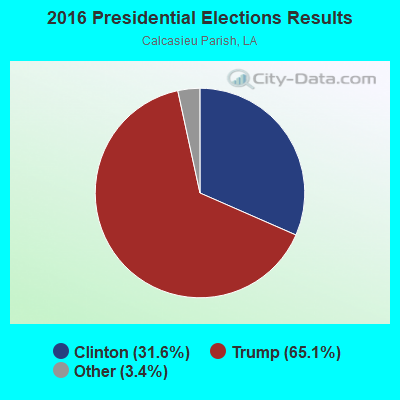
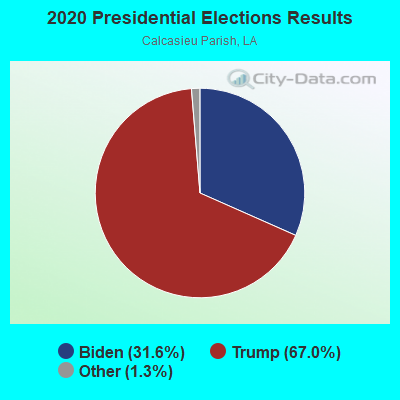
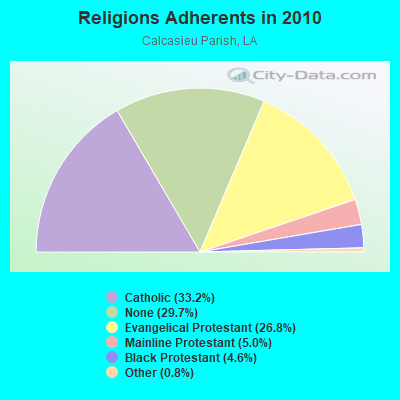
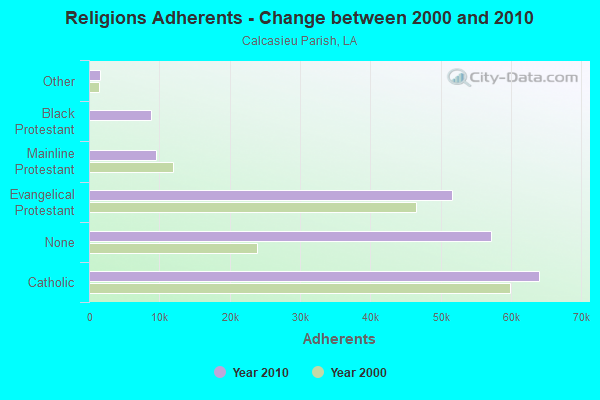
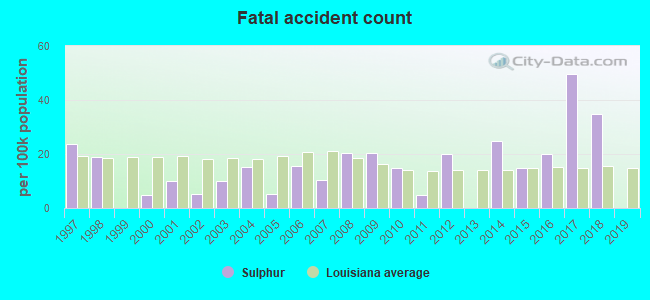
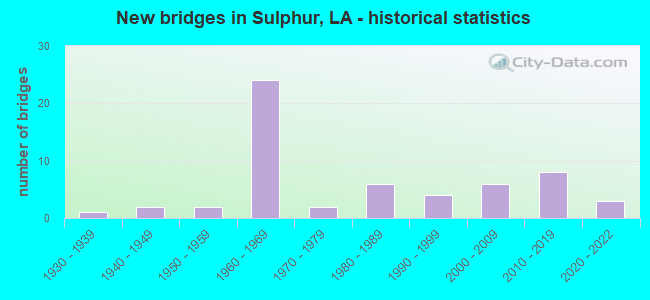
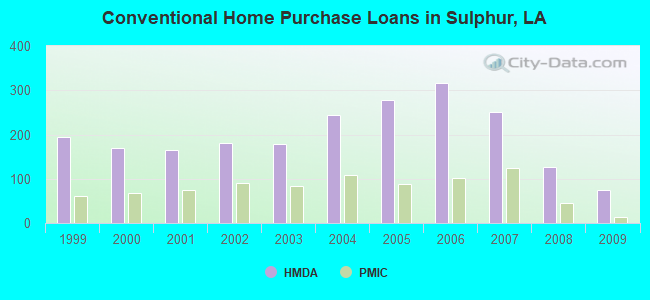
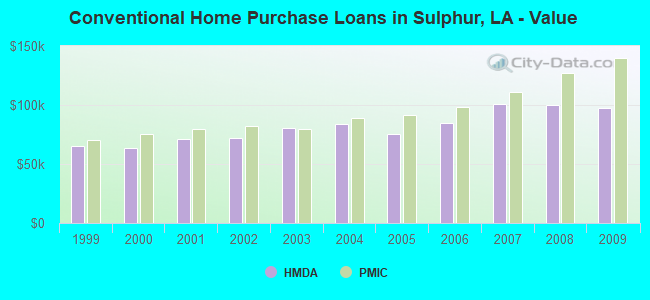
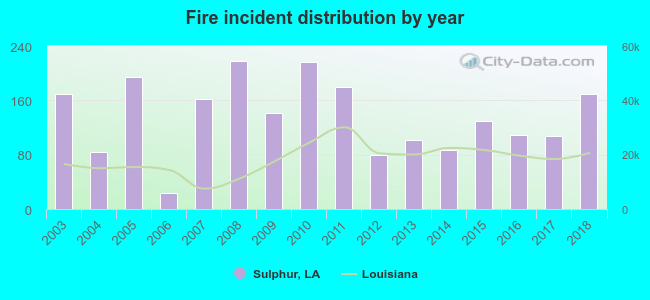 Based on the data from the years 2003 - 2018 the average number of fire incidents per year is 136. The highest number of fire incidents - 218 took place in 2008, and the least - 23 in 2006. The data has a rising trend.
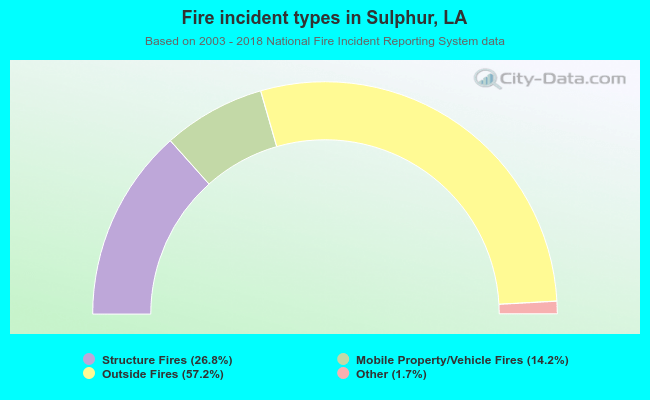 When looking into fire subcategories, the most reports belonged to: Outside Fires (57.2%), and Structure Fires (26.8%).