Taylors, South Carolina Submit your own pictures of this place and show them to the world
OSM Map
General Map
Google Map
MSN Map
OSM Map
General Map
Google Map
MSN Map
OSM Map
General Map
Google Map
MSN Map
OSM Map
General Map
Google Map
MSN Map
Please wait while loading the map...
Population in 2010: 21,617. Population change since 2000: +7.4%Males: 10,602 Females: 11,015
March 2022 cost of living index in Taylors: 86.3 (less than average, U.S. average is 100) Percentage of residents living in poverty in 2022: 8.2%for White Non-Hispanic residents , 21.6% for Black residents , 26.5% for Hispanic or Latino residents , 46.2% for American Indian residents , 27.6% for other race residents , 31.0% for two or more races residents )
Profiles of local businesses
Business Search - 14 Million verified businesses
Data:
Median household income ($)
Median household income (% change since 2000)
Household income diversity
Ratio of average income to average house value (%)
Ratio of average income to average rent
Median household income ($) - White
Median household income ($) - Black or African American
Median household income ($) - Asian
Median household income ($) - Hispanic or Latino
Median household income ($) - American Indian and Alaska Native
Median household income ($) - Multirace
Median household income ($) - Other Race
Median household income for houses/condos with a mortgage ($)
Median household income for apartments without a mortgage ($)
Races - White alone (%)
Races - White alone (% change since 2000)
Races - Black alone (%)
Races - Black alone (% change since 2000)
Races - American Indian alone (%)
Races - American Indian alone (% change since 2000)
Races - Asian alone (%)
Races - Asian alone (% change since 2000)
Races - Hispanic (%)
Races - Hispanic (% change since 2000)
Races - Native Hawaiian and Other Pacific Islander alone (%)
Races - Native Hawaiian and Other Pacific Islander alone (% change since 2000)
Races - Two or more races (%)
Races - Two or more races (% change since 2000)
Races - Other race alone (%)
Races - Other race alone (% change since 2000)
Racial diversity
Unemployment (%)
Unemployment (% change since 2000)
Unemployment (%) - White
Unemployment (%) - Black or African American
Unemployment (%) - Asian
Unemployment (%) - Hispanic or Latino
Unemployment (%) - American Indian and Alaska Native
Unemployment (%) - Multirace
Unemployment (%) - Other Race
Population density (people per square mile)
Population - Males (%)
Population - Females (%)
Population - Males (%) - White
Population - Males (%) - Black or African American
Population - Males (%) - Asian
Population - Males (%) - Hispanic or Latino
Population - Males (%) - American Indian and Alaska Native
Population - Males (%) - Multirace
Population - Males (%) - Other Race
Population - Females (%) - White
Population - Females (%) - Black or African American
Population - Females (%) - Asian
Population - Females (%) - Hispanic or Latino
Population - Females (%) - American Indian and Alaska Native
Population - Females (%) - Multirace
Population - Females (%) - Other Race
Coronavirus confirmed cases (Apr 27, 2024)
Deaths caused by coronavirus (Apr 27, 2024)
Coronavirus confirmed cases (per 100k population) (Apr 27, 2024)
Deaths caused by coronavirus (per 100k population) (Apr 27, 2024)
Daily increase in number of cases (Apr 27, 2024)
Weekly increase in number of cases (Apr 27, 2024)
Cases doubled (in days) (Apr 27, 2024)
Hospitalized patients (Apr 18, 2022)
Negative test results (Apr 18, 2022)
Total test results (Apr 18, 2022)
COVID Vaccine doses distributed (per 100k population) (Sep 19, 2023)
COVID Vaccine doses administered (per 100k population) (Sep 19, 2023)
COVID Vaccine doses distributed (Sep 19, 2023)
COVID Vaccine doses administered (Sep 19, 2023)
Likely homosexual households (%)
Likely homosexual households (% change since 2000)
Likely homosexual households - Lesbian couples (%)
Likely homosexual households - Lesbian couples (% change since 2000)
Likely homosexual households - Gay men (%)
Likely homosexual households - Gay men (% change since 2000)
Cost of living index
Median gross rent ($)
Median contract rent ($)
Median monthly housing costs ($)
Median house or condo value ($)
Median house or condo value ($ change since 2000)
Mean house or condo value by units in structure - 1, detached ($)
Mean house or condo value by units in structure - 1, attached ($)
Mean house or condo value by units in structure - 2 ($)
Mean house or condo value by units in structure by units in structure - 3 or 4 ($)
Mean house or condo value by units in structure - 5 or more ($)
Mean house or condo value by units in structure - Boat, RV, van, etc. ($)
Mean house or condo value by units in structure - Mobile home ($)
Median house or condo value ($) - White
Median house or condo value ($) - Black or African American
Median house or condo value ($) - Asian
Median house or condo value ($) - Hispanic or Latino
Median house or condo value ($) - American Indian and Alaska Native
Median house or condo value ($) - Multirace
Median house or condo value ($) - Other Race
Median resident age
Resident age diversity
Median resident age - Males
Median resident age - Females
Median resident age - White
Median resident age - Black or African American
Median resident age - Asian
Median resident age - Hispanic or Latino
Median resident age - American Indian and Alaska Native
Median resident age - Multirace
Median resident age - Other Race
Median resident age - Males - White
Median resident age - Males - Black or African American
Median resident age - Males - Asian
Median resident age - Males - Hispanic or Latino
Median resident age - Males - American Indian and Alaska Native
Median resident age - Males - Multirace
Median resident age - Males - Other Race
Median resident age - Females - White
Median resident age - Females - Black or African American
Median resident age - Females - Asian
Median resident age - Females - Hispanic or Latino
Median resident age - Females - American Indian and Alaska Native
Median resident age - Females - Multirace
Median resident age - Females - Other Race
Commute - mean travel time to work (minutes)
Travel time to work - Less than 5 minutes (%)
Travel time to work - Less than 5 minutes (% change since 2000)
Travel time to work - 5 to 9 minutes (%)
Travel time to work - 5 to 9 minutes (% change since 2000)
Travel time to work - 10 to 19 minutes (%)
Travel time to work - 10 to 19 minutes (% change since 2000)
Travel time to work - 20 to 29 minutes (%)
Travel time to work - 20 to 29 minutes (% change since 2000)
Travel time to work - 30 to 39 minutes (%)
Travel time to work - 30 to 39 minutes (% change since 2000)
Travel time to work - 40 to 59 minutes (%)
Travel time to work - 40 to 59 minutes (% change since 2000)
Travel time to work - 60 to 89 minutes (%)
Travel time to work - 60 to 89 minutes (% change since 2000)
Travel time to work - 90 or more minutes (%)
Travel time to work - 90 or more minutes (% change since 2000)
Marital status - Never married (%)
Marital status - Now married (%)
Marital status - Separated (%)
Marital status - Widowed (%)
Marital status - Divorced (%)
Median family income ($)
Median family income (% change since 2000)
Median non-family income ($)
Median non-family income (% change since 2000)
Median per capita income ($)
Median per capita income (% change since 2000)
Median family income ($) - White
Median family income ($) - Black or African American
Median family income ($) - Asian
Median family income ($) - Hispanic or Latino
Median family income ($) - American Indian and Alaska Native
Median family income ($) - Multirace
Median family income ($) - Other Race
Median year house/condo built
Median year apartment built
Year house built - Built 2005 or later (%)
Year house built - Built 2000 to 2004 (%)
Year house built - Built 1990 to 1999 (%)
Year house built - Built 1980 to 1989 (%)
Year house built - Built 1970 to 1979 (%)
Year house built - Built 1960 to 1969 (%)
Year house built - Built 1950 to 1959 (%)
Year house built - Built 1940 to 1949 (%)
Year house built - Built 1939 or earlier (%)
Average household size
Household density (households per square mile)
Average household size - White
Average household size - Black or African American
Average household size - Asian
Average household size - Hispanic or Latino
Average household size - American Indian and Alaska Native
Average household size - Multirace
Average household size - Other Race
Occupied housing units (%)
Vacant housing units (%)
Owner occupied housing units (%)
Renter occupied housing units (%)
Vacancy status - For rent (%)
Vacancy status - For sale only (%)
Vacancy status - Rented or sold, not occupied (%)
Vacancy status - For seasonal, recreational, or occasional use (%)
Vacancy status - For migrant workers (%)
Vacancy status - Other vacant (%)
Residents with income below the poverty level (%)
Residents with income below 50% of the poverty level (%)
Children below poverty level (%)
Poor families by family type - Married-couple family (%)
Poor families by family type - Male, no wife present (%)
Poor families by family type - Female, no husband present (%)
Poverty status for native-born residents (%)
Poverty status for foreign-born residents (%)
Poverty among high school graduates not in families (%)
Poverty among people who did not graduate high school not in families (%)
Residents with income below the poverty level (%) - White
Residents with income below the poverty level (%) - Black or African American
Residents with income below the poverty level (%) - Asian
Residents with income below the poverty level (%) - Hispanic or Latino
Residents with income below the poverty level (%) - American Indian and Alaska Native
Residents with income below the poverty level (%) - Multirace
Residents with income below the poverty level (%) - Other Race
Air pollution - Air Quality Index (AQI)
Air pollution - CO
Air pollution - NO2
Air pollution - SO2
Air pollution - Ozone
Air pollution - PM10
Air pollution - PM25
Air pollution - Pb
Crime - Murders per 100,000 population
Crime - Rapes per 100,000 population
Crime - Robberies per 100,000 population
Crime - Assaults per 100,000 population
Crime - Burglaries per 100,000 population
Crime - Thefts per 100,000 population
Crime - Auto thefts per 100,000 population
Crime - Arson per 100,000 population
Crime - City-data.com crime index
Crime - Violent crime index
Crime - Property crime index
Crime - Murders per 100,000 population (5 year average)
Crime - Rapes per 100,000 population (5 year average)
Crime - Robberies per 100,000 population (5 year average)
Crime - Assaults per 100,000 population (5 year average)
Crime - Burglaries per 100,000 population (5 year average)
Crime - Thefts per 100,000 population (5 year average)
Crime - Auto thefts per 100,000 population (5 year average)
Crime - Arson per 100,000 population (5 year average)
Crime - City-data.com crime index (5 year average)
Crime - Violent crime index (5 year average)
Crime - Property crime index (5 year average)
1996 Presidential Elections Results (%) - Democratic Party (Clinton)
1996 Presidential Elections Results (%) - Republican Party (Dole)
1996 Presidential Elections Results (%) - Other
2000 Presidential Elections Results (%) - Democratic Party (Gore)
2000 Presidential Elections Results (%) - Republican Party (Bush)
2000 Presidential Elections Results (%) - Other
2004 Presidential Elections Results (%) - Democratic Party (Kerry)
2004 Presidential Elections Results (%) - Republican Party (Bush)
2004 Presidential Elections Results (%) - Other
2008 Presidential Elections Results (%) - Democratic Party (Obama)
2008 Presidential Elections Results (%) - Republican Party (McCain)
2008 Presidential Elections Results (%) - Other
2012 Presidential Elections Results (%) - Democratic Party (Obama)
2012 Presidential Elections Results (%) - Republican Party (Romney)
2012 Presidential Elections Results (%) - Other
2016 Presidential Elections Results (%) - Democratic Party (Clinton)
2016 Presidential Elections Results (%) - Republican Party (Trump)
2016 Presidential Elections Results (%) - Other
2020 Presidential Elections Results (%) - Democratic Party (Biden)
2020 Presidential Elections Results (%) - Republican Party (Trump)
2020 Presidential Elections Results (%) - Other
Ancestries Reported - Arab (%)
Ancestries Reported - Czech (%)
Ancestries Reported - Danish (%)
Ancestries Reported - Dutch (%)
Ancestries Reported - English (%)
Ancestries Reported - French (%)
Ancestries Reported - French Canadian (%)
Ancestries Reported - German (%)
Ancestries Reported - Greek (%)
Ancestries Reported - Hungarian (%)
Ancestries Reported - Irish (%)
Ancestries Reported - Italian (%)
Ancestries Reported - Lithuanian (%)
Ancestries Reported - Norwegian (%)
Ancestries Reported - Polish (%)
Ancestries Reported - Portuguese (%)
Ancestries Reported - Russian (%)
Ancestries Reported - Scotch-Irish (%)
Ancestries Reported - Scottish (%)
Ancestries Reported - Slovak (%)
Ancestries Reported - Subsaharan African (%)
Ancestries Reported - Swedish (%)
Ancestries Reported - Swiss (%)
Ancestries Reported - Ukrainian (%)
Ancestries Reported - United States (%)
Ancestries Reported - Welsh (%)
Ancestries Reported - West Indian (%)
Ancestries Reported - Other (%)
Educational Attainment - No schooling completed (%)
Educational Attainment - Less than high school (%)
Educational Attainment - High school or equivalent (%)
Educational Attainment - Less than 1 year of college (%)
Educational Attainment - 1 or more years of college (%)
Educational Attainment - Associate degree (%)
Educational Attainment - Bachelor's degree (%)
Educational Attainment - Master's degree (%)
Educational Attainment - Professional school degree (%)
Educational Attainment - Doctorate degree (%)
School Enrollment - Nursery, preschool (%)
School Enrollment - Kindergarten (%)
School Enrollment - Grade 1 to 4 (%)
School Enrollment - Grade 5 to 8 (%)
School Enrollment - Grade 9 to 12 (%)
School Enrollment - College undergrad (%)
School Enrollment - Graduate or professional (%)
School Enrollment - Not enrolled in school (%)
School enrollment - Public schools (%)
School enrollment - Private schools (%)
School enrollment - Not enrolled (%)
Median number of rooms in houses and condos
Median number of rooms in apartments
Housing units lacking complete plumbing facilities (%)
Housing units lacking complete kitchen facilities (%)
Density of houses
Urban houses (%)
Rural houses (%)
Households with people 60 years and over (%)
Households with people 65 years and over (%)
Households with people 75 years and over (%)
Households with one or more nonrelatives (%)
Households with no nonrelatives (%)
Population in households (%)
Family households (%)
Nonfamily households (%)
Population in families (%)
Family households with own children (%)
Median number of bedrooms in owner occupied houses
Mean number of bedrooms in owner occupied houses
Median number of bedrooms in renter occupied houses
Mean number of bedrooms in renter occupied houses
Median number of vehichles in owner occupied houses
Mean number of vehichles in owner occupied houses
Median number of vehichles in renter occupied houses
Mean number of vehichles in renter occupied houses
Mortgage status - with mortgage (%)
Mortgage status - with second mortgage (%)
Mortgage status - with home equity loan (%)
Mortgage status - with both second mortgage and home equity loan (%)
Mortgage status - without a mortgage (%)
Average family size
Average family size - White
Average family size - Black or African American
Average family size - Asian
Average family size - Hispanic or Latino
Average family size - American Indian and Alaska Native
Average family size - Multirace
Average family size - Other Race
Geographical mobility - Same house 1 year ago (%)
Geographical mobility - Moved within same county (%)
Geographical mobility - Moved from different county within same state (%)
Geographical mobility - Moved from different state (%)
Geographical mobility - Moved from abroad (%)
Place of birth - Born in state of residence (%)
Place of birth - Born in other state (%)
Place of birth - Native, outside of US (%)
Place of birth - Foreign born (%)
Housing units in structures - 1, detached (%)
Housing units in structures - 1, attached (%)
Housing units in structures - 2 (%)
Housing units in structures - 3 or 4 (%)
Housing units in structures - 5 to 9 (%)
Housing units in structures - 10 to 19 (%)
Housing units in structures - 20 to 49 (%)
Housing units in structures - 50 or more (%)
Housing units in structures - Mobile home (%)
Housing units in structures - Boat, RV, van, etc. (%)
House/condo owner moved in on average (years ago)
Renter moved in on average (years ago)
Year householder moved into unit - Moved in 1999 to March 2000 (%)
Year householder moved into unit - Moved in 1995 to 1998 (%)
Year householder moved into unit - Moved in 1990 to 1994 (%)
Year householder moved into unit - Moved in 1980 to 1989 (%)
Year householder moved into unit - Moved in 1970 to 1979 (%)
Year householder moved into unit - Moved in 1969 or earlier (%)
Means of transportation to work - Drove car alone (%)
Means of transportation to work - Carpooled (%)
Means of transportation to work - Public transportation (%)
Means of transportation to work - Bus or trolley bus (%)
Means of transportation to work - Streetcar or trolley car (%)
Means of transportation to work - Subway or elevated (%)
Means of transportation to work - Railroad (%)
Means of transportation to work - Ferryboat (%)
Means of transportation to work - Taxicab (%)
Means of transportation to work - Motorcycle (%)
Means of transportation to work - Bicycle (%)
Means of transportation to work - Walked (%)
Means of transportation to work - Other means (%)
Working at home (%)
Industry diversity
Most Common Industries - Agriculture, forestry, fishing and hunting, and mining (%)
Most Common Industries - Agriculture, forestry, fishing and hunting (%)
Most Common Industries - Mining, quarrying, and oil and gas extraction (%)
Most Common Industries - Construction (%)
Most Common Industries - Manufacturing (%)
Most Common Industries - Wholesale trade (%)
Most Common Industries - Retail trade (%)
Most Common Industries - Transportation and warehousing, and utilities (%)
Most Common Industries - Transportation and warehousing (%)
Most Common Industries - Utilities (%)
Most Common Industries - Information (%)
Most Common Industries - Finance and insurance, and real estate and rental and leasing (%)
Most Common Industries - Finance and insurance (%)
Most Common Industries - Real estate and rental and leasing (%)
Most Common Industries - Professional, scientific, and management, and administrative and waste management services (%)
Most Common Industries - Professional, scientific, and technical services (%)
Most Common Industries - Management of companies and enterprises (%)
Most Common Industries - Administrative and support and waste management services (%)
Most Common Industries - Educational services, and health care and social assistance (%)
Most Common Industries - Educational services (%)
Most Common Industries - Health care and social assistance (%)
Most Common Industries - Arts, entertainment, and recreation, and accommodation and food services (%)
Most Common Industries - Arts, entertainment, and recreation (%)
Most Common Industries - Accommodation and food services (%)
Most Common Industries - Other services, except public administration (%)
Most Common Industries - Public administration (%)
Occupation diversity
Most Common Occupations - Management, business, science, and arts occupations (%)
Most Common Occupations - Management, business, and financial occupations (%)
Most Common Occupations - Management occupations (%)
Most Common Occupations - Business and financial operations occupations (%)
Most Common Occupations - Computer, engineering, and science occupations (%)
Most Common Occupations - Computer and mathematical occupations (%)
Most Common Occupations - Architecture and engineering occupations (%)
Most Common Occupations - Life, physical, and social science occupations (%)
Most Common Occupations - Education, legal, community service, arts, and media occupations (%)
Most Common Occupations - Community and social service occupations (%)
Most Common Occupations - Legal occupations (%)
Most Common Occupations - Education, training, and library occupations (%)
Most Common Occupations - Arts, design, entertainment, sports, and media occupations (%)
Most Common Occupations - Healthcare practitioners and technical occupations (%)
Most Common Occupations - Health diagnosing and treating practitioners and other technical occupations (%)
Most Common Occupations - Health technologists and technicians (%)
Most Common Occupations - Service occupations (%)
Most Common Occupations - Healthcare support occupations (%)
Most Common Occupations - Protective service occupations (%)
Most Common Occupations - Fire fighting and prevention, and other protective service workers including supervisors (%)
Most Common Occupations - Law enforcement workers including supervisors (%)
Most Common Occupations - Food preparation and serving related occupations (%)
Most Common Occupations - Building and grounds cleaning and maintenance occupations (%)
Most Common Occupations - Personal care and service occupations (%)
Most Common Occupations - Sales and office occupations (%)
Most Common Occupations - Sales and related occupations (%)
Most Common Occupations - Office and administrative support occupations (%)
Most Common Occupations - Natural resources, construction, and maintenance occupations (%)
Most Common Occupations - Farming, fishing, and forestry occupations (%)
Most Common Occupations - Construction and extraction occupations (%)
Most Common Occupations - Installation, maintenance, and repair occupations (%)
Most Common Occupations - Production, transportation, and material moving occupations (%)
Most Common Occupations - Production occupations (%)
Most Common Occupations - Transportation occupations (%)
Most Common Occupations - Material moving occupations (%)
People in Group quarters - Institutionalized population (%)
People in Group quarters - Correctional institutions (%)
People in Group quarters - Federal prisons and detention centers (%)
People in Group quarters - Halfway houses (%)
People in Group quarters - Local jails and other confinement facilities (including police lockups) (%)
People in Group quarters - Military disciplinary barracks (%)
People in Group quarters - State prisons (%)
People in Group quarters - Other types of correctional institutions (%)
People in Group quarters - Nursing homes (%)
People in Group quarters - Hospitals/wards, hospices, and schools for the handicapped (%)
People in Group quarters - Hospitals/wards and hospices for chronically ill (%)
People in Group quarters - Hospices or homes for chronically ill (%)
People in Group quarters - Military hospitals or wards for chronically ill (%)
People in Group quarters - Other hospitals or wards for chronically ill (%)
People in Group quarters - Hospitals or wards for drug/alcohol abuse (%)
People in Group quarters - Mental (Psychiatric) hospitals or wards (%)
People in Group quarters - Schools, hospitals, or wards for the mentally retarded (%)
People in Group quarters - Schools, hospitals, or wards for the physically handicapped (%)
People in Group quarters - Institutions for the deaf (%)
People in Group quarters - Institutions for the blind (%)
People in Group quarters - Orthopedic wards and institutions for the physically handicapped (%)
People in Group quarters - Wards in general hospitals for patients who have no usual home elsewhere (%)
People in Group quarters - Wards in military hospitals for patients who have no usual home elsewhere (%)
People in Group quarters - Juvenile institutions (%)
People in Group quarters - Long-term care (%)
People in Group quarters - Homes for abused, dependent, and neglected children (%)
People in Group quarters - Residential treatment centers for emotionally disturbed children (%)
People in Group quarters - Training schools for juvenile delinquents (%)
People in Group quarters - Short-term care, detention or diagnostic centers for delinquent children (%)
People in Group quarters - Type of juvenile institution unknown (%)
People in Group quarters - Noninstitutionalized population (%)
People in Group quarters - College dormitories (includes college quarters off campus) (%)
People in Group quarters - Military quarters (%)
People in Group quarters - On base (%)
People in Group quarters - Barracks, unaccompanied personnel housing (UPH), (Enlisted/Officer), ;and similar group living quarters for military personnel (%)
People in Group quarters - Transient quarters for temporary residents (%)
People in Group quarters - Military ships (%)
People in Group quarters - Group homes (%)
People in Group quarters - Homes or halfway houses for drug/alcohol abuse (%)
People in Group quarters - Homes for the mentally ill (%)
People in Group quarters - Homes for the mentally retarded (%)
People in Group quarters - Homes for the physically handicapped (%)
People in Group quarters - Other group homes (%)
People in Group quarters - Religious group quarters (%)
People in Group quarters - Dormitories (%)
People in Group quarters - Agriculture workers' dormitories on farms (%)
People in Group quarters - Job Corps and vocational training facilities (%)
People in Group quarters - Other workers' dormitories (%)
People in Group quarters - Crews of maritime vessels (%)
People in Group quarters - Other nonhousehold living situations (%)
People in Group quarters - Other noninstitutional group quarters (%)
Residents speaking English at home (%)
Residents speaking English at home - Born in the United States (%)
Residents speaking English at home - Native, born elsewhere (%)
Residents speaking English at home - Foreign born (%)
Residents speaking Spanish at home (%)
Residents speaking Spanish at home - Born in the United States (%)
Residents speaking Spanish at home - Native, born elsewhere (%)
Residents speaking Spanish at home - Foreign born (%)
Residents speaking other language at home (%)
Residents speaking other language at home - Born in the United States (%)
Residents speaking other language at home - Native, born elsewhere (%)
Residents speaking other language at home - Foreign born (%)
Class of Workers - Employee of private company (%)
Class of Workers - Self-employed in own incorporated business (%)
Class of Workers - Private not-for-profit wage and salary workers (%)
Class of Workers - Local government workers (%)
Class of Workers - State government workers (%)
Class of Workers - Federal government workers (%)
Class of Workers - Self-employed workers in own not incorporated business and Unpaid family workers (%)
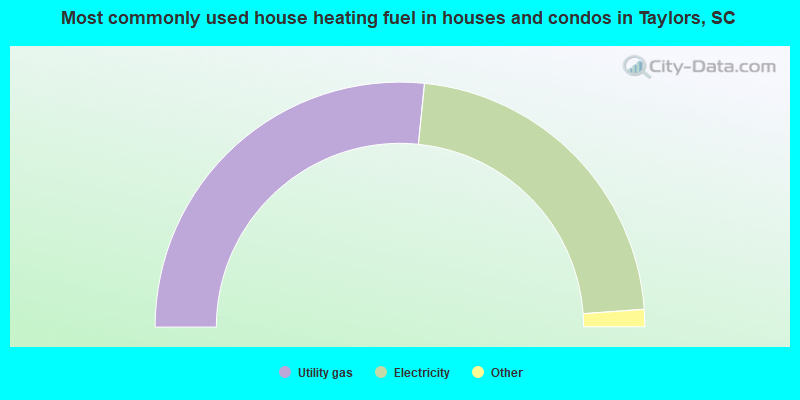
House heating fuel used in houses and condos - Utility gas (%)
House heating fuel used in houses and condos - Bottled, tank, or LP gas (%)
House heating fuel used in houses and condos - Electricity (%)
House heating fuel used in houses and condos - Fuel oil, kerosene, etc. (%)
House heating fuel used in houses and condos - Coal or coke (%)
House heating fuel used in houses and condos - Wood (%)
House heating fuel used in houses and condos - Solar energy (%)
House heating fuel used in houses and condos - Other fuel (%)
House heating fuel used in houses and condos - No fuel used (%)
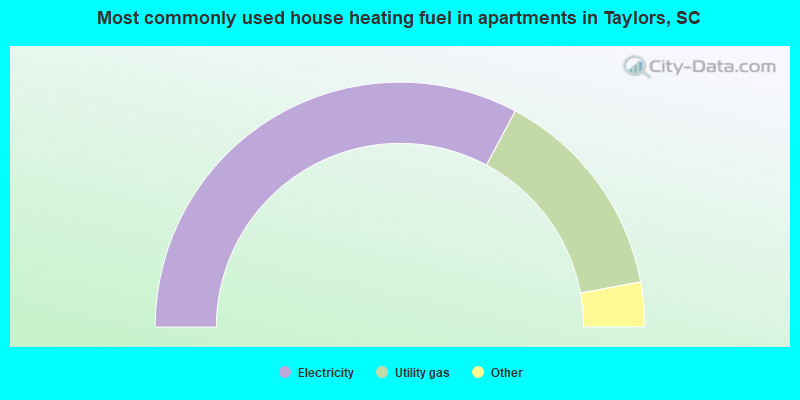
House heating fuel used in apartments - Utility gas (%)
House heating fuel used in apartments - Bottled, tank, or LP gas (%)
House heating fuel used in apartments - Electricity (%)
House heating fuel used in apartments - Fuel oil, kerosene, etc. (%)
House heating fuel used in apartments - Coal or coke (%)
House heating fuel used in apartments - Wood (%)
House heating fuel used in apartments - Solar energy (%)
House heating fuel used in apartments - Other fuel (%)
House heating fuel used in apartments - No fuel used (%)
Armed forces status - In Armed Forces (%)
Armed forces status - Civilian (%)
Armed forces status - Civilian - Veteran (%)
Armed forces status - Civilian - Nonveteran (%)
Fatal accidents locations in years 2005-2021
Fatal accidents locations in 2005
Fatal accidents locations in 2006
Fatal accidents locations in 2007
Fatal accidents locations in 2008
Fatal accidents locations in 2009
Fatal accidents locations in 2010
Fatal accidents locations in 2011
Fatal accidents locations in 2012
Fatal accidents locations in 2013
Fatal accidents locations in 2014
Fatal accidents locations in 2015
Fatal accidents locations in 2016
Fatal accidents locations in 2017
Fatal accidents locations in 2018
Fatal accidents locations in 2019
Fatal accidents locations in 2020
Fatal accidents locations in 2021
Alcohol use - People drinking some alcohol every month (%)
Alcohol use - People not drinking at all (%)
Alcohol use - Average days/month drinking alcohol
Alcohol use - Average drinks/week
Alcohol use - Average days/year people drink much
Audiometry - Average condition of hearing (%)
Audiometry - People that can hear a whisper from across a quiet room (%)
Audiometry - People that can hear normal voice from across a quiet room (%)
Audiometry - Ears ringing, roaring, buzzing (%)
Audiometry - Had a job exposure to loud noise (%)
Audiometry - Had off-work exposure to loud noise (%)
Blood Pressure & Cholesterol - Has high blood pressure (%)
Blood Pressure & Cholesterol - Checking blood pressure at home (%)
Blood Pressure & Cholesterol - Frequently checking blood cholesterol (%)
Blood Pressure & Cholesterol - Has high cholesterol level (%)
Consumer Behavior - Money monthly spent on food at supermarket/grocery store
Consumer Behavior - Money monthly spent on food at other stores
Consumer Behavior - Money monthly spent on eating out
Consumer Behavior - Money monthly spent on carryout/delivered foods
Consumer Behavior - Income spent on food at supermarket/grocery store (%)
Consumer Behavior - Income spent on food at other stores (%)
Consumer Behavior - Income spent on eating out (%)
Consumer Behavior - Income spent on carryout/delivered foods (%)
Current Health Status - General health condition (%)
Current Health Status - Blood donors (%)
Current Health Status - Has blood ever tested for HIV virus (%)
Current Health Status - Left-handed people (%)
Dermatology - People using sunscreen (%)
Diabetes - Diabetics (%)
Diabetes - Had a blood test for high blood sugar (%)
Diabetes - People taking insulin (%)
Diet Behavior & Nutrition - Diet health (%)
Diet Behavior & Nutrition - Milk product consumption (# of products/month)
Diet Behavior & Nutrition - Meals not home prepared (#/week)
Diet Behavior & Nutrition - Meals from fast food or pizza place (#/week)
Diet Behavior & Nutrition - Ready-to-eat foods (#/month)
Diet Behavior & Nutrition - Frozen meals/pizza (#/month)
Drug Use - People that ever used marijuana or hashish (%)
Drug Use - Ever used hard drugs (%)
Drug Use - Ever used any form of cocaine (%)
Drug Use - Ever used heroin (%)
Drug Use - Ever used methamphetamine (%)
Health Insurance - People covered by health insurance (%)
Kidney Conditions-Urology - Avg. # of times urinating at night
Medical Conditions - People with asthma (%)
Medical Conditions - People with anemia (%)
Medical Conditions - People with psoriasis (%)
Medical Conditions - People with overweight (%)
Medical Conditions - Elderly people having difficulties in thinking or remembering (%)
Medical Conditions - People who ever received blood transfusion (%)
Medical Conditions - People having trouble seeing even with glass/contacts (%)
Medical Conditions - People with arthritis (%)
Medical Conditions - People with gout (%)
Medical Conditions - People with congestive heart failure (%)
Medical Conditions - People with coronary heart disease (%)
Medical Conditions - People with angina pectoris (%)
Medical Conditions - People who ever had heart attack (%)
Medical Conditions - People who ever had stroke (%)
Medical Conditions - People with emphysema (%)
Medical Conditions - People with thyroid problem (%)
Medical Conditions - People with chronic bronchitis (%)
Medical Conditions - People with any liver condition (%)
Medical Conditions - People who ever had cancer or malignancy (%)
Mental Health - People who have little interest in doing things (%)
Mental Health - People feeling down, depressed, or hopeless (%)
Mental Health - People who have trouble sleeping or sleeping too much (%)
Mental Health - People feeling tired or having little energy (%)
Mental Health - People with poor appetite or overeating (%)
Mental Health - People feeling bad about themself (%)
Mental Health - People who have trouble concentrating on things (%)
Mental Health - People moving or speaking slowly or too fast (%)
Mental Health - People having thoughts they would be better off dead (%)
Oral Health - Average years since last visit a dentist
Oral Health - People embarrassed because of mouth (%)
Oral Health - People with gum disease (%)
Oral Health - General health of teeth and gums (%)
Oral Health - Average days a week using dental floss/device
Oral Health - Average days a week using mouthwash for dental problem
Oral Health - Average number of teeth
Pesticide Use - Households using pesticides to control insects (%)
Pesticide Use - Households using pesticides to kill weeds (%)
Physical Activity - People doing vigorous-intensity work activities (%)
Physical Activity - People doing moderate-intensity work activities (%)
Physical Activity - People walking or bicycling (%)
Physical Activity - People doing vigorous-intensity recreational activities (%)
Physical Activity - People doing moderate-intensity recreational activities (%)
Physical Activity - Average hours a day doing sedentary activities
Physical Activity - Average hours a day watching TV or videos
Physical Activity - Average hours a day using computer
Physical Functioning - People having limitations keeping them from working (%)
Physical Functioning - People limited in amount of work they can do (%)
Physical Functioning - People that need special equipment to walk (%)
Physical Functioning - People experiencing confusion/memory problems (%)
Physical Functioning - People requiring special healthcare equipment (%)
Prescription Medications - Average number of prescription medicines taking
Preventive Aspirin Use - Adults 40+ taking low-dose aspirin (%)
Reproductive Health - Vaginal deliveries (%)
Reproductive Health - Cesarean deliveries (%)
Reproductive Health - Deliveries resulted in a live birth (%)
Reproductive Health - Pregnancies resulted in a delivery (%)
Reproductive Health - Women breastfeeding newborns (%)
Reproductive Health - Women that had a hysterectomy (%)
Reproductive Health - Women that had both ovaries removed (%)
Reproductive Health - Women that have ever taken birth control pills (%)
Reproductive Health - Women taking birth control pills (%)
Reproductive Health - Women that have ever used Depo-Provera or injectables (%)
Reproductive Health - Women that have ever used female hormones (%)
Sexual Behavior - People 18+ that ever had sex (vaginal, anal, or oral) (%)
Sexual Behavior - Males 18+ that ever had vaginal sex with a woman (%)
Sexual Behavior - Males 18+ that ever performed oral sex on a woman (%)
Sexual Behavior - Males 18+ that ever had anal sex with a woman (%)
Sexual Behavior - Males 18+ that ever had any sex with a man (%)
Sexual Behavior - Females 18+ that ever had vaginal sex with a man (%)
Sexual Behavior - Females 18+ that ever performed oral sex on a man (%)
Sexual Behavior - Females 18+ that ever had anal sex with a man (%)
Sexual Behavior - Females 18+ that ever had any kind of sex with a woman (%)
Sexual Behavior - Average age people first had sex
Sexual Behavior - Average number of female sex partners in lifetime (males 18+)
Sexual Behavior - Average number of female vaginal sex partners in lifetime (males 18+)
Sexual Behavior - Average age people first performed oral sex on a woman (18+)
Sexual Behavior - Average number of woman performed oral sex on in lifetime (18+)
Sexual Behavior - Average number of male sex partners in lifetime (males 18+)
Sexual Behavior - Average number of male anal sex partners in lifetime (males 18+)
Sexual Behavior - Average age people first performed oral sex on a man (18+)
Sexual Behavior - Average number of male oral sex partners in lifetime (18+)
Sexual Behavior - People using protection when performing oral sex (%)
Sexual Behavior - Average number of times people have vaginal or anal sex a year
Sexual Behavior - People having sex without condom (%)
Sexual Behavior - Average number of male sex partners in lifetime (females 18+)
Sexual Behavior - Average number of male vaginal sex partners in lifetime (females 18+)
Sexual Behavior - Average number of female sex partners in lifetime (females 18+)
Sexual Behavior - Circumcised males 18+ (%)
Sleep Disorders - Average hours sleeping at night
Sleep Disorders - People that has trouble sleeping (%)
Smoking-Cigarette Use - People smoking cigarettes (%)
Taste & Smell - People 40+ having problems with smell (%)
Taste & Smell - People 40+ having problems with taste (%)
Taste & Smell - People 40+ that ever had wisdom teeth removed (%)
Taste & Smell - People 40+ that ever had tonsils teeth removed (%)
Taste & Smell - People 40+ that ever had a loss of consciousness because of a head injury (%)
Taste & Smell - People 40+ that ever had a broken nose or other serious injury to face or skull (%)
Taste & Smell - People 40+ that ever had two or more sinus infections (%)
Weight - Average height (inches)
Weight - Average weight (pounds)
Weight - Average BMI
Weight - People that are obese (%)
Weight - People that ever were obese (%)
Weight - People trying to lose weight (%)
According to our research of South Carolina and other state lists, there were 10 registered sex offenders living in Taylors, South Carolina as of April 27, 2024 . The ratio of all residents to sex offenders in Taylors is 2,350 to 1.The ratio of registered sex offenders to all residents in this city is lower than the state average.
Latest news from Taylors, SC collected exclusively by city-data.com from local newspapers, TV, and radio stations
Ancestries: English (12.5%), American (8.0%), Irish (7.4%), German (6.2%), Scotch-Irish (3.8%), Italian (2.5%).
Current Local Time:
Land area: 10.9 square miles.
Population density: 1,991 people per square mile (low).
2,709 residents are foreign born (7.7% Latin America , 3.2% Asia ).
This place:
11.4%South Carolina:
5.3%
Median real estate property taxes paid for housing units with mortgages in 2022: $1,312 (0.5%)Median real estate property taxes paid for housing units with no mortgage in 2022: $1,292 (0.5%)
Nearest city with pop. 50,000+: Greenville, SC
Nearest city with pop. 200,000+: Charlotte, NC
Nearest city with pop. 1,000,000+: Philadelphia, PA
Nearest cities:
Latitude: 34.91 N, Longitude: 82.31 W
Daytime population change due to commuting: -8,024 (-33.6%)Workers who live and work in this place: 2,211 (18.0%)
Area code commonly used in this area: 864
Property values in Taylors, SC
Unemployment in December 2023: Here:
2.8%South Carolina:
3.1%
Most common occupations in Taylors, SC (%)
Both Males Females
Sales representatives, services, wholesale and manufacturing (5.7%)
Other sales and related occupations, including supervisors (4.5%)
Other office and administrative support workers, including supervisors (4.3%)
Other management occupations, except farmers and farm managers (4.0%)
Retail sales workers, except cashiers (3.6%)
Preschool, kindergarten, elementary, and middle school teachers (3.5%)
Other production occupations, including supervisors (3.3%)
Sales representatives, services, wholesale and manufacturing (7.6%)
Electrical equipment mechanics and other installation, maintenance, and repair workers, including supervisors (4.9%)
Other production occupations, including supervisors (4.9%)
Other management occupations, except farmers and farm managers (4.1%)
Other sales and related occupations, including supervisors (3.9%)
Retail sales workers, except cashiers (3.9%)
Operations specialties managers, except financial managers (3.5%)
Preschool, kindergarten, elementary, and middle school teachers (6.9%)
Other office and administrative support workers, including supervisors (6.6%)
Secretaries and administrative assistants (5.7%)
Other sales and related occupations, including supervisors (5.2%)
Other management occupations, except farmers and farm managers (3.8%)
Registered nurses (3.8%)
Sales representatives, services, wholesale and manufacturing (3.6%)
Tornado activity:
Taylors-area historical tornado activity is near South Carolina state average. It is 5% greater than the overall U.S. average.
On 5/5/1989, a category F4 (max. wind speeds 207-260 mph) tornado 24.5 miles away from the Taylors place center killed 2 people and injured 35 people and caused between $500,000 and $5,000,000 in damages.
On 5/10/1952, a category F3 (max. wind speeds 158-206 mph) tornado 8.6 miles away from the place center killed 2 people and injured 4 people .
Earthquake activity:
Taylors-area historical earthquake activity is significantly above South Carolina state average. It is 13% greater than the overall U.S. average. On 8/2/1974 at 08:52:09, a magnitude 4.9 (4.3 MB, 4.9 LG, Class: Light, Intensity: IV - V) earthquake occurred 72.7 miles away from the city center On 8/9/2020 at 12:07:37, a magnitude 5.1 (5.1 MW, Depth: 4.7 mi, Class: Moderate, Intensity: VI - VII) earthquake occurred 127.9 miles away from the city center On 8/23/2011 at 17:51:04, a magnitude 5.8 (5.8 MW, Depth: 3.7 mi) earthquake occurred 319.7 miles away from Taylors center On 11/30/1973 at 07:48:41, a magnitude 4.7 (4.7 MB, 4.6 ML) earthquake occurred 111.5 miles away from Taylors center On 7/27/1980 at 18:52:21, a magnitude 5.2 (5.1 MB, 4.7 MS, 5.0 UK, 5.2 UK) earthquake occurred 245.1 miles away from the city center On 4/29/2003 at 08:59:39, a magnitude 4.9 (4.4 MB, 4.6 MW, 4.9 LG) earthquake occurred 190.9 miles away from Taylors center Magnitude types: regional Lg-wave magnitude (LG), body-wave magnitude (MB), local magnitude (ML), surface-wave magnitude (MS), moment magnitude (MW) Natural disasters: The number of natural disasters in Greenville County (12) is smaller than the US average (15).Major Disasters (Presidential) Declared: 4Emergencies Declared: 5Floods: 3, Hurricanes: 3, Storms: 3, Ice Storms: 2, Drought: 1, Tornado: 1, Tropical Storm: 1, Wind: 1, Winter Storm: 1, Other: 1 (Note: some incidents may be assigned to more than one category). Hospitals and medical centers near Taylors: GREER SOUTH DIALYSIS (Dialysis Facility, about 4 miles away; GREER, SC)
NHC HEALTHCARE - GREENVILLE (Nursing Home, about 4 miles away; GREER, SC)
GREER MEMORIAL HOSPITAL (about 4 miles away; GREER, SC)
EMERITUS AT GREENVILLE (Nursing Home, about 4 miles away; GREENVILLE, SC)
VISTACARE OF SOUTH CAROLINA (Hospital, about 5 miles away; GREENVILLE, SC)
GREENVILLE HOSPITAL SYSTEM HHA (Home Health Center, about 5 miles away; GREENVILLE, SC)
PATEWOOD MEMORIAL HOSPITAL (about 5 miles away; GREENVILLE, SC)
Amtrak station near Taylors: 8 miles: GREENVILLE (1120 W. WASHINGTON ST.) Services: ticket office, fully wheelchair accessible, enclosed waiting area, public restrooms, public payphones, vending machines, free short-term parking, free long-term parking, call for taxi service.
Colleges/universities with over 2000 students nearest to Taylors:
Bob Jones University (about 5 miles; Greenville, SC ; Full-time enrollment: 3,308)
Greenville Technical College (about 8 miles; Greenville, SC ; FT enrollment: 9,859)
Furman University (about 8 miles; Greenville, SC ; FT enrollment: 2,988)
North Greenville University (about 12 miles; Tigerville, SC ; FT enrollment: 2,341)
Spartanburg Community College (about 19 miles; Spartanburg, SC ; FT enrollment: 4,309)
University of South Carolina-Upstate (about 21 miles; Spartanburg, SC ; FT enrollment: 4,994)
Tri-County Technical College (about 34 miles; Pendleton, SC ; FT enrollment: 5,174)
Public high schools in Taylors:
Private high school in Taylors: PLEASANT VIEW CHRISTIAN ACADEMY Students: 29, Location: 110 OLD RUTHERFORD RD, Grades: KG-12)
Public elementary/middle schools in Taylors: NORTHWOOD MIDDLE Students: 867, Location: 710 IKE'S ROAD, Grades: 6-8)MOUNTAIN VIEW ELEMENTARY Students: 826, Location: 6350 HIGHWAY 253, Grades: PK-5)BRUSHY CREEK ELEMENTARY Students: 791, Location: 1344 BRUSHY CREEK ROAD, Grades: PK-5)TAYLORS ELEMENTARY Students: 716, Location: 809 REID SCHOOL ROAD, Grades: KG-5)PARIS ELEMENTARY Students: 609, Location: 32 EAST BELVUE ROAD, Grades: PK-5)BROOK GLENN ELEMENTARY Students: 444, Location: 2003 EAST LEE ROAD, Grades: PK-5)TIGERVILLE ELEMENTARY Students: 316, Location: 25 TIGERVILLE ELEMENTARY ROAD, Grades: PK-5)Private elementary/middle school in Taylors: PRINCE OF PEACE CATHOLIC SCHOOL Students: 251, Location: 1209 BRUSHY CREEK RD, Grades: PK-8)
See full list of schools located in Taylors
Notable locations in Taylors: (A) , Taylors Fire Department Station 2 (B) , Taylors Fire Department Station 1 (C) . Display/hide their locations on the map
Churches in Taylors include: (A) , Bethel Church (B) , Eastside Church (C) , Fellowship Church (D) , Lee Road Church (E) , Pebble Creek Church (F) , Saint Luke Church (G) , Southern Bleachery Church (H) , Stephenson Memorial Church (I) . Display/hide their locations on the map
Creeks: (A) , Cane Creek (B) . Display/hide their locations on the map
Hotel:
Court:
Birthplace of: Rasmi Gamble - College basketball player (Elon University Phoenix).
Greenville County has a predicted average indoor radon screening level greater than 4 pCi/L (pico curies per liter) - Highest Potential Drinking water stations with addresses in Taylors and their reported violations in the past:
TIFFANY LANES (Serves LA, Population served: 200, Groundwater):
Past health violations:
MCL, Monthly (TCR) - In OCT-2009, Contaminant: Coliform. Follow-up actions: St Violation/Reminder Notice (NOV-13-2009), St Public Notif requested (NOV-13-2009)
MCL, Monthly (TCR) - In JUN-2006, Contaminant: Coliform. Follow-up actions: St Violation/Reminder Notice (AUG-23-2006), St Public Notif requested (AUG-23-2006)
Average household size: This place:
2.5 peopleSouth Carolina:
2.5 people
Percentage of family households: This place:
69.4%Whole state:
67.5%
Percentage of households with unmarried partners: This place:
5.4%Whole state:
6.0%
Likely homosexual households (counted as self-reported same-sex unmarried-partner households)
Lesbian couples: 0.3% of all households Gay men: 0.3% of all households
44 people in nursing facilities/skilled-nursing facilities in 2010people in group homes intended for adults in 2010people in nursing homes in 2000people in other noninstitutional group quarters in 2000
Banks with most branches in Taylors (2011 data):
Bank of Travelers Rest: Taylors Branch at 6000 Wade Hampton Boulevard, branch established on 2007/11/21. Info updated 2006/11/03: Bank assets: $481.2 mil, Deposits: $419.9 mil, headquarters in Travelers Rest, SC, positive income , Commercial Lending Specialization, 9 total offices , Holding Company: Travelers Rest Bancshares, Inc.
Branch Banking and Trust Company: Taylors Branch at 3255 Wade Hampton Boulevard, branch established on 1933/01/01. Info updated 2010/03/29: Bank assets: $168,867.6 mil, Deposits: $127,549.5 mil, headquarters in Winston Salem, NC, positive income , Commercial Lending Specialization, 1793 total offices , Holding Company: Bb&T Corporation
Woodforest National Bank: Taylors Branch at 3027 Wade Hampton Blvd., branch established on 2008/03/15. Info updated 2011/05/10: Bank assets: $3,488.9 mil, Deposits: $3,097.6 mil, headquarters in Houston, TX, positive income , Commercial Lending Specialization, 766 total offices , Holding Company: Woodforest Financial Group Employee Stock Ownership Plan (With 401(K) Provisions)
Wells Fargo Bank, National Association: Greer Branch at 6011 Wade Hampton Boulevard, branch established on 2004/10/18. Info updated 2011/04/05: Bank assets: $1,161,490.0 mil, Deposits: $905,653.0 mil, headquarters in Sioux Falls, SD, positive income , 6395 total offices , Holding Company: Wells Fargo & Company
Independence National Bank: Wade Hampton Branch at 2801b Wade Hampton Boulevard, branch established on 2007/10/11. Info updated 2006/11/03: Bank assets: $112.3 mil, Deposits: $96.6 mil, headquarters in Greenville, SC, negative income in the last year , Commercial Lending Specialization, 4 total offices , Holding Company: Independence Bancshares, Inc.
Synovus Bank: Wade Hampton Branch at 2800 Wade Hampton Boulevard, branch established on 1993/07/14. Info updated 2011/01/25: Bank assets: $26,863.3 mil, Deposits: $22,415.0 mil, headquarters in Columbus, GA, positive income , Commercial Lending Specialization, 296 total offices , Holding Company: Synovus Financial Corp.
TD Bank, National Association: Tigerville Branch at 7800 North Tigerville Road, branch established on 2009/01/05. Info updated 2010/10/04: Bank assets: $188,912.6 mil, Deposits: $153,149.8 mil, headquarters in Wilmington, DE, positive income , 1314 total offices , Holding Company: Toronto-Dominion Bank, The
Greer State Bank: Taylors Branch at 3317 Wade Hampton Boulelvard, branch established on 2005/01/10. Info updated 2006/11/03: Bank assets: $382.5 mil, Deposits: $281.8 mil, headquarters in Greer, SC, negative income in the last year , Commercial Lending Specialization, 5 total offices , Holding Company: Greer Bancshares Incorporated
SunTrust Bank: Eastgate Village Shopping Branch 709 at 5008 Old Spartanburg Road, branch established on 1921/01/01. Info updated 2010/05/27: Bank assets: $171,291.7 mil, Deposits: $129,833.2 mil, headquarters in Atlanta, GA, positive income , Commercial Lending Specialization, 1716 total offices , Holding Company: Suntrust Banks, Inc.
For population 15 years and over in Taylors:
Never married: 28.9%Now married: 53.9%Separated: 1.4%Widowed: 6.2%Divorced: 9.7% For population 25 years and over in Taylors:
High school or higher: 93.6%Bachelor's degree or higher: 41.9%Graduate or professional degree: 15.4%Unemployed: 2.8%Mean travel time to work (commute): 18.1 minutes
Education Gini index (Inequality in education) Here:
10.1South Carolina average:
11.1
Religion statistics for Taylors, SC (based on Greenville County data)
Religion Adherents Congregations Evangelical Protestant 186,955 473 Mainline Protestant 44,200 96 Catholic 25,417 8 Black Protestant 7,753 24 Other 5,656 25 Orthodox 1,930 3 None 179,314 -
Source: Clifford Grammich, Kirk Hadaway, Richard Houseal, Dale E.Jones, Alexei Krindatch, Richie Stanley and Richard H.Taylor. 2012. 2010 U.S.Religion Census: Religious Congregations & Membership Study. Association of Statisticians of American Religious Bodies. Jones, Dale E., et al. 2002. Congregations and Membership in the United States 2000. Nashville, TN: Glenmary Research Center. Graphs represent county-level data
Food Environment Statistics: Number of grocery stores : 86Greenville County :
2.01 / 10,000 pop.South Carolina :
1.99 / 10,000 pop.
Number of supercenters and club stores : 6Greenville County :
0.14 / 10,000 pop.South Carolina :
0.15 / 10,000 pop.
Number of convenience stores (no gas) : 23Greenville County :
0.54 / 10,000 pop.South Carolina :
0.85 / 10,000 pop.
Number of convenience stores (with gas) : 198This county :
4.63 / 10,000 pop.South Carolina :
5.38 / 10,000 pop.
Number of full-service restaurants : 383Greenville County :
8.96 / 10,000 pop.State :
7.75 / 10,000 pop.
Adult diabetes rate : Greenville County :
8.3%South Carolina :
10.6%
Adult obesity rate : Greenville County :
24.4%State :
29.4%
Low-income preschool obesity rate : Here :
13.7%South Carolina :
13.4%
Health and Nutrition: Healthy diet rate : Here:
50.3%South Carolina:
49.2%
Average overall health of teeth and gums : Taylors:
48.1%South Carolina:
46.2%
Average BMI : Taylors:
28.8South Carolina:
29.0
People feeling badly about themselves : Taylors:
21.7%South Carolina:
20.4%
People not drinking alcohol at all : Taylors:
9.9%South Carolina:
11.0%
Average hours sleeping at night : Overweight people : Taylors:
34.4%South Carolina:
34.4%
General health condition : Average condition of hearing : This city:
79.9%South Carolina:
79.9%
More about Health and Nutrition of Taylors, SC Residents
8.41% of this county's 2021 resident taxpayers lived in other counties in 2020 ($69,436 average adjusted gross income )
Here:
8.41%South Carolina average:
8.89%
0.01% of residents moved from foreign countries ($100 average AGI )Greenville County:
0.01%South Carolina average:
0.04%
Top counties from which taxpayers relocated into this county between 2020 and 2021:
6.82% of this county's 2020 resident taxpayers moved to other counties in 2021 ($63,413 average adjusted gross income )
Here:
6.82%South Carolina average:
7.46%
0.01% of residents moved to foreign countries ($106 average AGI )Greenville County:
0.01%South Carolina average:
0.03%
Top counties to which taxpayers relocated from this county between 2020 and 2021:
Businesses in Taylors, SC
Name Count Name Count
AT&T 1 Office Depot 1 Advance Auto Parts 1 Panera Bread 1 AutoZone 1 PetSmart 1 Blockbuster 1 Publix Super Markets 1 Burger King 2 RadioShack 1 CVS 2 Ruby Tuesday 1 Chick-Fil-A 1 Sprint Nextel 1 Curves 1 Starbucks 1 Discount Tire 1 Subway 1 FedEx 2 T-Mobile 3 Firestone Complete Auto Care 2 Target 1 GNC 1 U-Haul 1 GameStop 1 UPS 4 H&R Block 1 Verizon Wireless 1 Hardee's 1 Waffle House 1 Hobby Lobby 1 Walmart 1 KFC 1 YMCA 1 Little Caesars Pizza 2
Strongest AM radio stations in Taylors:
WMUU (1260 AM; 5 kW; GREENVILLE, SC; Owner: WMUU, INC.)
WLFJ (660 AM; daytime; 50 kW; GREENVILLE, SC; Owner: CLEAR CHANNEL BROADCASTING LICENSES, INC.)
WCSZ (1070 AM; 50 kW; SANS SOUCI, SC; Owner: WHYZ RADIO, L.P.)
WCKI (1300 AM; 1 kW; GREER, SC; Owner: SIRA-PACK RADIO, INC.)
WYRD (1330 AM; 5 kW; GREENVILLE, SC; Owner: ENTERCOM GREENVILLE LICENSE, LLC)
WPJM (800 AM; 1 kW; GREER, SC; Owner: FULL GOSPEL WPJM 800 AM RADIO, INC.)
WDAB (1580 AM; 5 kW; TRAVELERS REST, SC; Owner: DABNEY-ADAMSON BROADCASTING, INC.)
WGVL (1440 AM; 5 kW; GREENVILLE, SC; Owner: CAPSTAR TX LIMITED PARTNERSHIP)
WBCU (1460 AM; 50 kW; UNION, SC)
WFGW (1010 AM; 50 kW; BLACK MOUNTAIN, NC; Owner: BLUE RIDGE BROADCASTING CORP.)
WJFJ (1160 AM; 10 kW; TRYON, NC; Owner: COLUMBUS BROADCAST CORPORATION, INC.)
WORD (950 AM; 5 kW; SPARTANBURG, SC; Owner: ENTERCOM GREENVILLE LICENSE, LLC)
WGCR (720 AM; daytime; 10 kW; PISGAH FOREST, NC; Owner: ANCHOR BAPTIST BROADCASTING ASSOCIATION)
Strongest FM radio stations in Taylors:
WEPR (90.1 FM; GREENVILLE, SC; Owner: SOUTH CAROLINA EDUCATIONAL TV COMMISSION)
WMUU-FM (94.5 FM; GREENVILLE, SC; Owner: WMUU, INC.)
WBZT-FM (96.7 FM; MAULDIN, SC; Owner: CLEAR CHANNEL BROADCASTING LICENSES, INC.)
WLFJ-FM (89.3 FM; GREENVILLE, SC; Owner: RADIO TRAINING NETWORK, INC.)
WSPA-FM (98.9 FM; SPARTANBURG, SC; Owner: ENTERCOM GREENVILLE LICENSE, LLC)
WFBC-FM (93.7 FM; GREENVILLE, SC; Owner: ENTERCOM GREENVILLE LICENSE, LLC)
WESC-FM (92.5 FM; GREENVILLE, SC; Owner: CLEAR CHANNEL BROADCASTING LICENSES, INC.)
WROQ (101.1 FM; ANDERSON, SC; Owner: OBC BROADCASTING, INC.)
WSSL-FM (100.5 FM; GRAY COURT, SC; Owner: CAPSTAR TX LIMITED PARTNERSHIP)
WTPT (93.3 FM; FOREST CITY, NC; Owner: UPSTATE BROADCASTING, LLC)
WMYI (102.5 FM; HENDERSONVILLE, NC; Owner: CAPSTAR TX LIMITED PARTNERSHIP)
W247AB (97.3 FM; GREENVILLE, SC; Owner: ISOTHERMAL COMMUNITY COLLEGE)
WTBI-FM (91.7 FM; GREENVILLE, SC; Owner: TABERNACLE BAPTIST BIBLE COLLEGE)
WOLT (103.3 FM; GREER, SC; Owner: ENTERCOM GREENVILLE LICENSE, LLC)
WKSF (99.9 FM; ASHEVILLE, NC; Owner: CAPSTAR TX LIMITED PARTNERSHIP)
WJMZ-FM (107.3 FM; ANDERSON, SC; Owner: CXR HOLDINGS, INC.)
W218AD (91.5 FM; BREVARD, NC; Owner: WESTERN NORTH CAROLINA PUBLIC RADIO)
WMIT (106.9 FM; BLACK MOUNTAIN, NC; Owner: BLUE RIDGE BROADCASTING CORPORATION)
WNCW (88.7 FM; SPINDALE, NC; Owner: ISOTHERMAL COMMUNITY COLLEGE)
W220CD (91.9 FM; ENKA, NC; Owner: CALVARY CHAPEL OF TWIN FALLS, INC.)
TV broadcast stations around Taylors:
WNTV (Channel 29; GREENVILLE, SC; Owner: SOUTH CAROLINA EDUCATIONAL TV COMMISSION)
WBSC-TV (Channel 40; ANDERSON, SC; Owner: ANDERSON (WFBC-TV) LICENSEE, INC.)
WHNS (Channel 21; ASHEVILLE, NC; Owner: MEREDITH CORPORATION)
WGGS-TV (Channel 16; GREENVILLE, SC; Owner: CAROLINA CHRISTIAN BROADCASTING, INC)
WYFF (Channel 4; GREENVILLE, SC; Owner: WYFF HEARST-ARGYLE TELEVISION, INC.)
WSPA-TV (Channel 7; SPARTANBURG, SC; Owner: MEDIA GENERAL BROADCASTING OF SO. CAROLINA HOLDINGS, INC.)
WASV-TV (Channel 62; ASHEVILLE, NC; Owner: MEDIA GENERAL BROADCASTING OF SOUTH CAROLINA HOLDINGS, INC.)
WSQY-LP (Channel 66; SPARTANBURG, SC; Owner: ASHEVILLE MEDIA GROUP, LLC)
W50AB (Channel 50; HIAWASSEE, GA; Owner: GEORGIA PUBLIC TELECOMMUNICATIONS COMMISSION)
WRET-TV (Channel 49; SPARTANBURG, SC; Owner: SOUTH CAROLINA EDUCATIONAL TV COMMISSION)
W10AJ (Channel 10; GREENVILLE, SC; Owner: MEDIA GENERAL BROADCASTING OF SO. CAROLINA HOLDINGS, INC.)
National Bridge Inventory (NBI) Statistics 30 Number of bridges312ft / 94.9m Total length $6,739,000 Total costs245,625 Total average daily traffic8,882 Total average daily truck traffic346,921 Total future (year 2040) average daily traffic
New bridges - historical statistics
5 1930-1939 4 1960-1969 5 1970-1979 4 1980-1989 2 1990-1999 9 2000-2009 1 2010-2019
See full National Bridge Inventory statistics for Taylors, SC
FCC Registered Antenna Towers: 111 (
See the full list of FCC Registered Antenna Towers in Taylors )
FCC Registered Broadcast Land Mobile Towers: 11 (
See the full list of FCC Registered Broadcast Land Mobile Towers in Taylors, SC )
FCC Registered Microwave Towers: 7
Taylors, 408 Buncombe Rd (Lat: 34.947056 Lon: -82.267833), Type: Mast, Structure height: 48.1 m, Overall height: 53.1 m, Call Sign: WQHP942, Assigned Frequencies: 11445.0 MHz, 6063.80 MHz, 11365.0 MHz, 11405.0 MHz, 5945.20 MHz, Grant Date: 10/24/2017, Expiration Date: 10/02/2027, Cancellation Date: 10/25/2023, Certifier: Jennifer S Skasko, Registrant: Conterra Ultra Broadband, LLC, 5301 77 Center Drive, Charlotte, NC 28217, Phone: (704) 936-1777, Fax: (704) 936-1801, Email:
TAYLORS, 4 Landmark Drive (Taylors - Greenville, Sc Msa) (Lat: 34.912861 Lon: -82.317778), Type: Tower, Structure height: 76.2 m, Overall height: 80.7 m, Call Sign: WQIT354, Assigned Frequencies: 11285.0 MHz, 6226.89 MHz, 6197.24 MHz, Grant Date: 05/07/2008, Expiration Date: 05/07/2018, Cancellation Date: 11/07/2009, Certifier: William Chastain, Registrant: Radio Dynamics Corporation, Silver Spring, MD 20914, Phone: (301) 493-5171, Fax: (301) 576-4553, Email:
Taylors, Lat: 34.912861 Lon: -82.317778, Type: Tower, Structure height: 76.2 m, Overall height: 80.7 m, Call Sign: WQLV604, Assigned Frequencies: 3650.00 MHz, Grant Date: 05/04/2010, Expiration Date: 10/17/2020, Cancellation Date: 12/19/2020, Certifier: Glenn W Ishihara, Registrant: Fletcher, Heald & Hildreth, P.L.C., 1300 N. 17th Street, Suite 1100, Arlington, VA 22209, Phone: (703) 812-0430, Fax: (703) 812-0486, Email:
Taylors, Lat: 34.912861 Lon: -82.317778, Type: Tower, Structure height: 76.2 m, Overall height: 80.7 m, Call Sign: WQLV604, Assigned Frequencies: 3650.00 MHz, Grant Date: 05/04/2010, Expiration Date: 10/17/2020, Cancellation Date: 12/19/2020, Certifier: Glenn W Ishihara, Registrant: Fletcher, Heald & Hildreth, P.L.C., 1300 N. 17th Street, Suite 1100, Arlington, VA 22209, Phone: (703) 812-0430, Fax: (703) 812-0486, Email:
Taylors, Lat: 34.912861 Lon: -82.317778, Type: Tower, Structure height: 76.2 m, Overall height: 80.7 m, Call Sign: WQLV604, Assigned Frequencies: 3650.00 MHz, Grant Date: 05/04/2010, Expiration Date: 10/17/2020, Cancellation Date: 12/19/2020, Certifier: Glenn W Ishihara, Registrant: Fletcher, Heald & Hildreth, P.L.C., 1300 N. 17th Street, Suite 1100, Arlington, VA 22209, Phone: (703) 812-0430, Fax: (703) 812-0486, Email:
Taylors, Lat: 34.912861 Lon: -82.317778, Type: Tower, Structure height: 76.2 m, Overall height: 80.7 m, Call Sign: WQLV604, Assigned Frequencies: 3650.00 MHz, Grant Date: 05/04/2010, Expiration Date: 10/17/2020, Cancellation Date: 12/19/2020, Certifier: Glenn W Ishihara, Registrant: Fletcher, Heald & Hildreth, P.L.C., 1300 N. 17th Street, Suite 1100, Arlington, VA 22209, Phone: (703) 812-0430, Fax: (703) 812-0486, Email:
3409 Rutherford Rd (Lat: 34.914833 Lon: -82.322333), Structure height: 8.5 m, Call Sign: WBS325, Assigned Frequencies: 6975.00 MHz, Grant Date: 08/30/1976, Expiration Date: 12/01/2028, Registrant: Carolina Christian Broadcasting, Inc., Greenville, SC 29602 FCC Registered Amateur Radio Licenses: 258 (
See the full list of FCC Registered Amateur Radio Licenses in Taylors )
FAA Registered Aircraft Manufacturers and Dealers: 3 (
See the full list of FAA Registered Manufacturers and Dealers in Taylors )
FAA Registered Aircraft: 25 (
See the full list of FAA Registered Aircraft )
Home Mortgage Disclosure Act Aggregated Statistics For Year 2009(Based on 1 full and 5 partial tracts) A) FHA, FSA/RHS & VA B) Conventional C) Refinancings D) Home Improvement Loans F) Non-occupant Loans on G) Loans On Manufactured Number Average Value Number Average Value Number Average Value Number Average Value Number Average Value Number Average Value
LOANS ORIGINATED 104 $127,479 67 $122,748 330 $127,430 12 $41,322 19 $84,290 1 $16,960 APPLICATIONS APPROVED, NOT ACCEPTED 4 $119,085 3 $123,313 27 $119,319 0 $0 1 $122,060 0 $0 APPLICATIONS DENIED 14 $105,741 13 $71,703 88 $128,956 9 $13,456 11 $78,358 2 $31,820 APPLICATIONS WITHDRAWN 7 $117,183 9 $111,163 91 $124,912 3 $93,853 8 $89,402 0 $0 FILES CLOSED FOR INCOMPLETENESS 2 $83,105 2 $141,230 14 $115,590 0 $0 0 $0 0 $0
Aggregated Statistics For Year 2008(Based on 1 full and 5 partial tracts) A) FHA, FSA/RHS & VA B) Conventional C) Refinancings D) Home Improvement Loans E) Loans on Dwellings For 5+ Families F) Non-occupant Loans on G) Loans On Manufactured Number Average Value Number Average Value Number Average Value Number Average Value Number Average Value Number Average Value Number Average Value
LOANS ORIGINATED 79 $138,719 159 $135,329 218 $122,997 18 $40,841 2 $2,210,010 30 $105,169 3 $175,037 APPLICATIONS APPROVED, NOT ACCEPTED 2 $169,775 14 $128,569 33 $108,638 6 $19,367 0 $0 4 $114,212 1 $41,570 APPLICATIONS DENIED 11 $143,259 27 $142,853 135 $120,726 33 $42,668 0 $0 12 $93,018 2 $49,890 APPLICATIONS WITHDRAWN 4 $193,115 16 $157,183 61 $131,117 3 $103,180 0 $0 5 $132,006 0 $0 FILES CLOSED FOR INCOMPLETENESS 2 $124,560 4 $142,060 12 $147,843 1 $14,870 0 $0 1 $29,010 0 $0
Aggregated Statistics For Year 2007(Based on 1 full and 5 partial tracts) A) FHA, FSA/RHS & VA B) Conventional C) Refinancings D) Home Improvement Loans F) Non-occupant Loans on G) Loans On Manufactured Number Average Value Number Average Value Number Average Value Number Average Value Number Average Value Number Average Value
LOANS ORIGINATED 23 $135,967 294 $121,042 231 $103,057 26 $50,948 67 $94,061 4 $54,720 APPLICATIONS APPROVED, NOT ACCEPTED 1 $67,200 31 $105,866 53 $103,410 3 $54,030 14 $87,463 1 $89,030 APPLICATIONS DENIED 2 $134,135 41 $116,025 159 $117,117 33 $41,895 10 $67,344 2 $38,505 APPLICATIONS WITHDRAWN 1 $130,480 38 $130,581 86 $114,846 7 $85,653 7 $124,649 0 $0 FILES CLOSED FOR INCOMPLETENESS 0 $0 9 $125,270 20 $142,596 0 $0 2 $98,385 0 $0
Aggregated Statistics For Year 2006(Based on 1 full and 5 partial tracts) A) FHA, FSA/RHS & VA B) Conventional C) Refinancings D) Home Improvement Loans E) Loans on Dwellings For 5+ Families F) Non-occupant Loans on G) Loans On Manufactured Number Average Value Number Average Value Number Average Value Number Average Value Number Average Value Number Average Value Number Average Value
LOANS ORIGINATED 26 $140,230 360 $108,233 264 $90,899 40 $31,483 1 $3,991,500 79 $90,757 5 $62,418 APPLICATIONS APPROVED, NOT ACCEPTED 2 $133,645 36 $91,616 63 $77,845 4 $34,362 0 $0 16 $83,300 5 $65,768 APPLICATIONS DENIED 1 $156,180 63 $91,710 169 $101,939 33 $36,263 0 $0 23 $68,293 6 $61,380 APPLICATIONS WITHDRAWN 3 $79,010 37 $116,959 124 $106,165 5 $49,678 0 $0 7 $89,409 0 $0 FILES CLOSED FOR INCOMPLETENESS 0 $0 11 $79,036 46 $111,730 1 $17,040 0 $0 2 $98,100 0 $0
Aggregated Statistics For Year 2005(Based on 1 full and 5 partial tracts) A) FHA, FSA/RHS & VA B) Conventional C) Refinancings D) Home Improvement Loans E) Loans on Dwellings For 5+ Families F) Non-occupant Loans on G) Loans On Manufactured Number Average Value Number Average Value Number Average Value Number Average Value Number Average Value Number Average Value Number Average Value
LOANS ORIGINATED 29 $122,209 343 $102,535 304 $99,450 31 $37,024 1 $2,914,050 63 $91,352 7 $55,476 APPLICATIONS APPROVED, NOT ACCEPTED 1 $107,630 32 $90,528 58 $100,068 9 $14,713 0 $0 6 $92,502 2 $58,390 APPLICATIONS DENIED 6 $111,435 49 $98,802 177 $103,045 35 $37,907 0 $0 18 $94,614 11 $60,515 APPLICATIONS WITHDRAWN 0 $0 32 $101,088 133 $108,772 12 $122,310 0 $0 7 $86,709 1 $105,460 FILES CLOSED FOR INCOMPLETENESS 0 $0 16 $95,159 55 $110,597 4 $57,558 0 $0 6 $97,545 0 $0
Aggregated Statistics For Year 2004(Based on 1 full and 5 partial tracts) A) FHA, FSA/RHS & VA B) Conventional C) Refinancings D) Home Improvement Loans F) Non-occupant Loans on G) Loans On Manufactured Number Average Value Number Average Value Number Average Value Number Average Value Number Average Value Number Average Value
LOANS ORIGINATED 28 $125,733 263 $101,473 331 $100,895 30 $38,161 57 $77,032 4 $47,750 APPLICATIONS APPROVED, NOT ACCEPTED 3 $82,483 20 $88,002 54 $92,159 4 $32,445 2 $42,090 6 $39,205 APPLICATIONS DENIED 9 $101,862 48 $95,255 223 $96,014 28 $39,643 10 $74,496 13 $68,297 APPLICATIONS WITHDRAWN 1 $90,480 18 $114,847 116 $106,630 6 $41,763 6 $59,303 1 $50,560 FILES CLOSED FOR INCOMPLETENESS 1 $171,640 7 $121,203 45 $106,152 3 $24,103 2 $46,015 0 $0
Aggregated Statistics For Year 2003(Based on 1 full and 5 partial tracts) A) FHA, FSA/RHS & VA B) Conventional C) Refinancings D) Home Improvement Loans E) Loans on Dwellings For 5+ Families F) Non-occupant Loans on Number Average Value Number Average Value Number Average Value Number Average Value Number Average Value Number Average Value
LOANS ORIGINATED 33 $116,945 242 $103,973 786 $102,084 25 $28,824 1 $3,615,250 55 $74,266 APPLICATIONS APPROVED, NOT ACCEPTED 2 $77,640 24 $97,017 79 $100,810 5 $32,364 0 $0 6 $61,915 APPLICATIONS DENIED 5 $139,870 40 $80,130 190 $99,704 20 $20,806 0 $0 12 $70,042 APPLICATIONS WITHDRAWN 3 $129,517 23 $91,605 116 $105,354 2 $10,105 0 $0 13 $70,201 FILES CLOSED FOR INCOMPLETENESS 2 $99,250 5 $94,126 31 $102,993 0 $0 0 $0 3 $60,393
Aggregated Statistics For Year 2002(Based on 1 full and 3 partial tracts) A) FHA, FSA/RHS & VA B) Conventional C) Refinancings D) Home Improvement Loans F) Non-occupant Loans on Number Average Value Number Average Value Number Average Value Number Average Value Number Average Value
LOANS ORIGINATED 28 $104,081 143 $96,005 401 $93,425 12 $25,058 35 $87,184 APPLICATIONS APPROVED, NOT ACCEPTED 0 $0 12 $80,025 58 $87,586 2 $10,215 4 $61,650 APPLICATIONS DENIED 2 $83,720 21 $83,445 145 $91,633 14 $12,097 4 $75,788 APPLICATIONS WITHDRAWN 4 $100,202 16 $95,662 85 $95,818 4 $35,458 6 $61,682 FILES CLOSED FOR INCOMPLETENESS 0 $0 1 $114,350 14 $104,508 0 $0 1 $45,060
Aggregated Statistics For Year 2001(Based on 1 full and 3 partial tracts) A) FHA, FSA/RHS & VA B) Conventional C) Refinancings D) Home Improvement Loans E) Loans on Dwellings For 5+ Families F) Non-occupant Loans on Number Average Value Number Average Value Number Average Value Number Average Value Number Average Value Number Average Value
LOANS ORIGINATED 40 $102,460 190 $98,655 378 $91,715 22 $16,659 1 $232,090 34 $59,656 APPLICATIONS APPROVED, NOT ACCEPTED 2 $122,510 16 $70,916 38 $94,767 1 $13,330 0 $0 3 $82,200 APPLICATIONS DENIED 6 $85,393 31 $71,706 137 $71,975 21 $11,617 0 $0 5 $42,160 APPLICATIONS WITHDRAWN 5 $104,592 14 $87,574 89 $84,538 2 $9,215 0 $0 3 $71,267 FILES CLOSED FOR INCOMPLETENESS 0 $0 4 $115,750 17 $93,775 0 $0 0 $0 2 $65,990
Aggregated Statistics For Year 2000(Based on 1 full and 3 partial tracts) A) FHA, FSA/RHS & VA B) Conventional C) Refinancings D) Home Improvement Loans F) Non-occupant Loans on Number Average Value Number Average Value Number Average Value Number Average Value Number Average Value
LOANS ORIGINATED 33 $104,299 160 $85,514 105 $73,457 22 $16,420 19 $71,418 APPLICATIONS APPROVED, NOT ACCEPTED 3 $68,063 13 $73,088 37 $70,882 9 $14,472 3 $73,410 APPLICATIONS DENIED 5 $73,274 41 $58,298 102 $61,143 24 $11,131 1 $10,000 APPLICATIONS WITHDRAWN 3 $82,197 14 $78,194 51 $67,939 1 $6,300 6 $45,023 FILES CLOSED FOR INCOMPLETENESS 0 $0 3 $92,303 11 $82,197 0 $0 1 $72,940
Aggregated Statistics For Year 1999(Based on 5 partial tracts) A) FHA, FSA/RHS & VA B) Conventional C) Refinancings D) Home Improvement Loans F) Non-occupant Loans on Number Average Value Number Average Value Number Average Value Number Average Value Number Average Value
LOANS ORIGINATED 27 $93,686 233 $94,082 243 $79,101 23 $15,894 35 $75,422 APPLICATIONS APPROVED, NOT ACCEPTED 2 $90,795 32 $62,717 62 $72,485 7 $26,609 2 $33,980 APPLICATIONS DENIED 3 $106,240 68 $63,859 129 $66,037 23 $14,253 9 $52,492 APPLICATIONS WITHDRAWN 4 $91,742 18 $74,242 74 $78,674 0 $0 1 $108,990 FILES CLOSED FOR INCOMPLETENESS 0 $0 9 $98,011 17 $79,587 1 $24,900 0 $0
Detailed HMDA statistics for the following Tracts:
0018.03
, 0018.04 , 0026.02 , 0026.04 , 0026.07 , 0027.02
Private Mortgage Insurance Companies Aggregated Statistics For Year 2009(Based on 1 full and 5 partial tracts) A) Conventional B) Refinancings Number Average Value Number Average Value
LOANS ORIGINATED 17 $153,384 23 $148,785 APPLICATIONS APPROVED, NOT ACCEPTED 3 $219,880 6 $114,805 APPLICATIONS DENIED 1 $172,950 0 $0 APPLICATIONS WITHDRAWN 1 $139,460 2 $111,495 FILES CLOSED FOR INCOMPLETENESS 1 $143,680 0 $0
Aggregated Statistics For Year 2008(Based on 1 full and 5 partial tracts) A) Conventional B) Refinancings C) Non-occupant Loans on Number Average Value Number Average Value Number Average Value
LOANS ORIGINATED 79 $136,591 24 $151,043 6 $105,047 APPLICATIONS APPROVED, NOT ACCEPTED 23 $152,693 9 $147,224 2 $97,175 APPLICATIONS DENIED 7 $100,954 2 $186,120 3 $74,687 APPLICATIONS WITHDRAWN 3 $123,453 1 $157,080 0 $0 FILES CLOSED FOR INCOMPLETENESS 2 $111,405 0 $0 2 $109,695
Aggregated Statistics For Year 2007(Based on 1 full and 5 partial tracts) A) Conventional B) Refinancings C) Non-occupant Loans on Number Average Value Number Average Value Number Average Value
LOANS ORIGINATED 147 $131,033 29 $132,633 13 $104,445 APPLICATIONS APPROVED, NOT ACCEPTED 13 $119,956 7 $167,629 2 $87,110 APPLICATIONS DENIED 1 $150,260 1 $91,470 1 $96,420 APPLICATIONS WITHDRAWN 6 $156,610 5 $113,118 1 $103,900 FILES CLOSED FOR INCOMPLETENESS 1 $168,640 0 $0 0 $0
Aggregated Statistics For Year 2006(Based on 1 full and 5 partial tracts) A) Conventional B) Refinancings C) Non-occupant Loans on Number Average Value Number Average Value Number Average Value
LOANS ORIGINATED 105 $126,463 31 $125,421 6 $109,778 APPLICATIONS APPROVED, NOT ACCEPTED 6 $161,918 6 $137,825 0 $0 APPLICATIONS DENIED 2 $127,300 1 $137,590 1 $38,470 APPLICATIONS WITHDRAWN 5 $126,628 7 $121,307 1 $78,910 FILES CLOSED FOR INCOMPLETENESS 0 $0 1 $127,090 0 $0
Aggregated Statistics For Year 2005(Based on 1 full and 5 partial tracts) A) Conventional B) Refinancings C) Non-occupant Loans on Number Average Value Number Average Value Number Average Value
LOANS ORIGINATED 93 $118,804 42 $123,225 8 $129,349 APPLICATIONS APPROVED, NOT ACCEPTED 12 $146,148 7 $129,569 3 $91,130 APPLICATIONS DENIED 3 $94,007 1 $135,580 0 $0 APPLICATIONS WITHDRAWN 6 $145,637 2 $110,005 0 $0 FILES CLOSED FOR INCOMPLETENESS 0 $0 1 $119,690 1 $87,860
Aggregated Statistics For Year 2004(Based on 1 full and 5 partial tracts) A) Conventional B) Refinancings C) Non-occupant Loans on Number Average Value Number Average Value Number Average Value
LOANS ORIGINATED 89 $110,203 50 $114,850 4 $95,632 APPLICATIONS APPROVED, NOT ACCEPTED 10 $130,069 16 $119,824 2 $59,450 APPLICATIONS DENIED 5 $122,444 1 $232,700 0 $0 APPLICATIONS WITHDRAWN 2 $116,275 6 $129,620 0 $0 FILES CLOSED FOR INCOMPLETENESS 0 $0 4 $154,345 0 $0
Aggregated Statistics For Year 2003(Based on 1 full and 5 partial tracts) A) Conventional B) Refinancings C) Non-occupant Loans on Number Average Value Number Average Value Number Average Value
LOANS ORIGINATED 107 $109,275 184 $118,547 8 $65,940 APPLICATIONS APPROVED, NOT ACCEPTED 26 $122,933 53 $126,232 1 $78,800 APPLICATIONS DENIED 4 $116,492 1 $124,080 0 $0 APPLICATIONS WITHDRAWN 7 $102,021 9 $119,760 2 $64,165 FILES CLOSED FOR INCOMPLETENESS 0 $0 2 $93,850 0 $0
Aggregated Statistics For Year 2002(Based on 1 full and 3 partial tracts) A) Conventional B) Refinancings C) Non-occupant Loans on Number Average Value Number Average Value Number Average Value
LOANS ORIGINATED 66 $107,731 97 $111,859 2 $77,720 APPLICATIONS APPROVED, NOT ACCEPTED 15 $104,823 26 $111,834 1 $56,560 APPLICATIONS DENIED 6 $100,798 4 $105,475 2 $97,245 APPLICATIONS WITHDRAWN 1 $74,280 7 $96,101 0 $0 FILES CLOSED FOR INCOMPLETENESS 2 $93,500 1 $66,000 0 $0
Aggregated Statistics For Year 2001(Based on 1 full and 3 partial tracts) A) Conventional B) Refinancings C) Non-occupant Loans on Number Average Value Number Average Value Number Average Value
LOANS ORIGINATED 98 $108,836 95 $109,377 4 $86,682 APPLICATIONS APPROVED, NOT ACCEPTED 7 $108,031 17 $104,166 0 $0 APPLICATIONS DENIED 5 $98,076 8 $113,899 0 $0 APPLICATIONS WITHDRAWN 2 $116,310 3 $94,813 0 $0 FILES CLOSED FOR INCOMPLETENESS 0 $0 3 $90,280 0 $0
Aggregated Statistics For Year 2000(Based on 1 full and 3 partial tracts) A) Conventional B) Refinancings C) Non-occupant Loans on Number Average Value Number Average Value Number Average Value
LOANS ORIGINATED 72 $102,658 11 $97,636 2 $57,665 APPLICATIONS APPROVED, NOT ACCEPTED 9 $95,249 1 $125,060 0 $0 APPLICATIONS DENIED 3 $82,937 1 $151,950 0 $0 APPLICATIONS WITHDRAWN 7 $84,656 1 $133,800 1 $56,800 FILES CLOSED FOR INCOMPLETENESS 1 $81,230 2 $95,740 1 $81,230
Aggregated Statistics For Year 1999(Based on 5 partial tracts) A) Conventional B) Refinancings C) Non-occupant Loans on Number Average Value Number Average Value Number Average Value
LOANS ORIGINATED 114 $110,290 29 $99,858 1 $96,310 APPLICATIONS APPROVED, NOT ACCEPTED 10 $115,073 8 $106,430 1 $75,140 APPLICATIONS DENIED 4 $95,965 5 $110,780 0 $0 APPLICATIONS WITHDRAWN 8 $97,150 3 $73,640 1 $76,360 FILES CLOSED FOR INCOMPLETENESS 0 $0 0 $0 0 $0
Detailed PMIC statistics for the following Tracts:
0018.03
, 0018.04 , 0026.02 , 0026.04 , 0026.07 , 0027.02
Most common first names in Taylors, SC among deceased individuals Name Count Lived (average)
James 216 72.2 years William 167 73.1 years John 159 72.9 years Mary 128 75.3 years Robert 107 69.8 years Charles 77 72.2 years Thomas 72 73.0 years George 57 73.3 years Margaret 55 76.0 years Ruth 53 79.9 years
Most common last names in Taylors, SC among deceased individuals Last name Count Lived (average)
Smith 93 71.6 years Jones 71 73.2 years Davis 53 72.3 years Brown 52 75.1 years Miller 39 71.5 years Williams 39 69.9 years Johnson 37 70.4 years Bishop 34 78.6 years Thompson 32 68.2 years Edwards 30 77.5 years
Taylors compared to South Carolina state average:
Unemployed percentage significantly below state average. Black race population percentage below state average. Hispanic race population percentage above state average. Foreign-born population percentage significantly above state average. Length of stay since moving in significantly above state average. Percentage of population with a bachelor's degree or higher above state average.
#64 on the list of "Top 101 cities with the most residents born in Jordan (population 500+)"
#88 on the list of "Top 101 cities with the most residents born in Other Eastern Africa (population 500+)"
#8 on the list of "Top 101 counties with the highest lead air pollution readings in 2012 (µg/m3 )"
#22 on the list of "Top 101 counties with the lowest lead air pollution readings in 2012 (µg/m3 )"
#27 on the list of "Top 101 counties with the most Evangelical Protestant adherents"
#32 on the list of "Top 101 counties with the lowest percentage of residents that drank alcohol in the past 30 days"
#34 on the list of "Top 101 counties with the largest increase in the number of infant deaths per 1000 residents 2000-2006 to 2007-2013 (pop. 50,000+)"
Top Patent Applicants
Lucas John Stoia (81)
John Wesley Harris, Jr. (25)
Solomon Bekele (15)
George Reiter (14)
Mark Steven Honkomp (12)
William Forrester Seely (9)
John Drake Vanselow (9)
Jacob Charles Perry, Ii (8)
Marc Lionel Benjamin (7)
William Gregory Hewitt (7)
Total of 340 patent applications in 2008-2024.
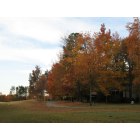

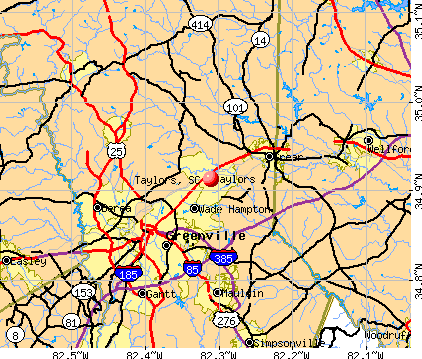


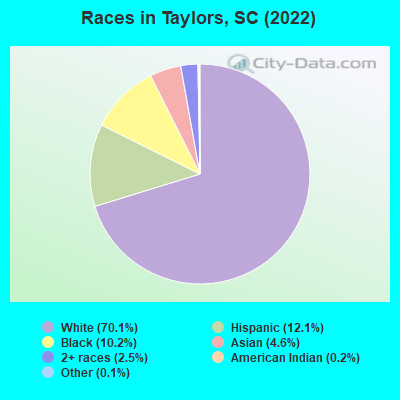
 Recent articles from our blog. Our writers, many of them Ph.D. graduates or candidates, create easy-to-read articles on a wide variety of topics.

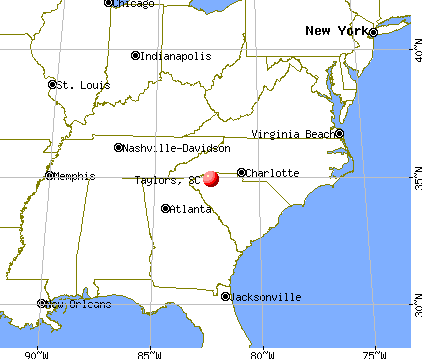
 (6.4 miles
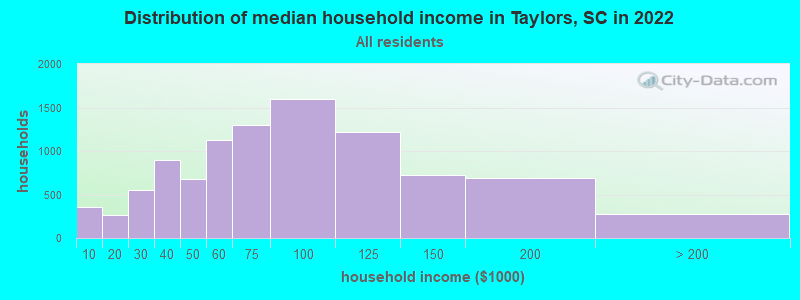
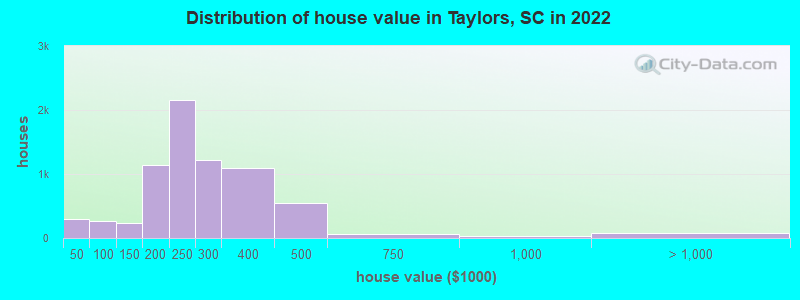
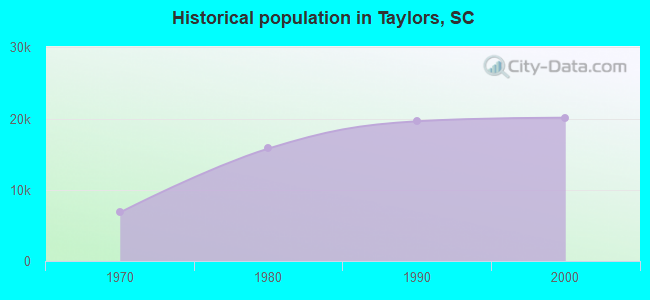
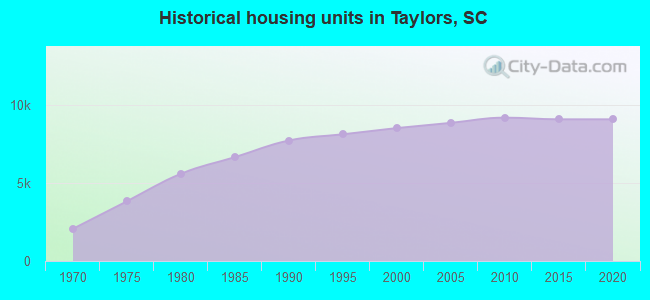
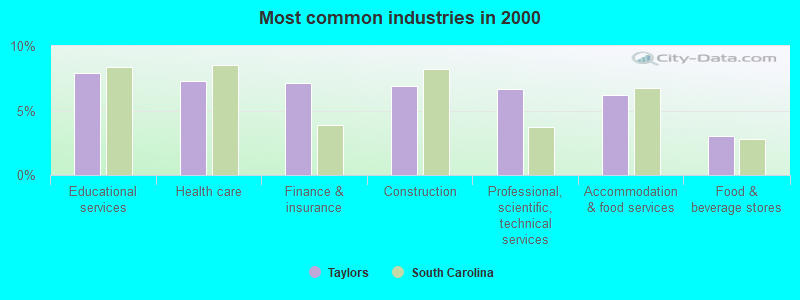
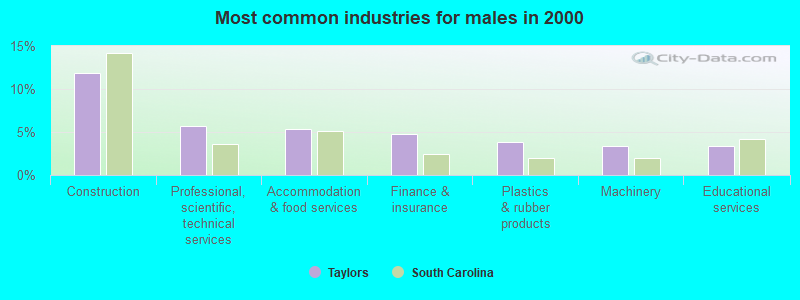
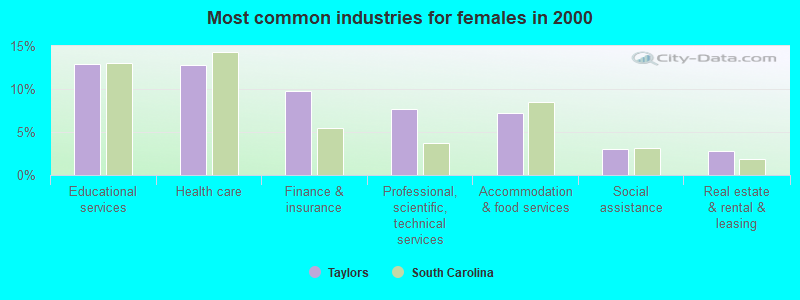
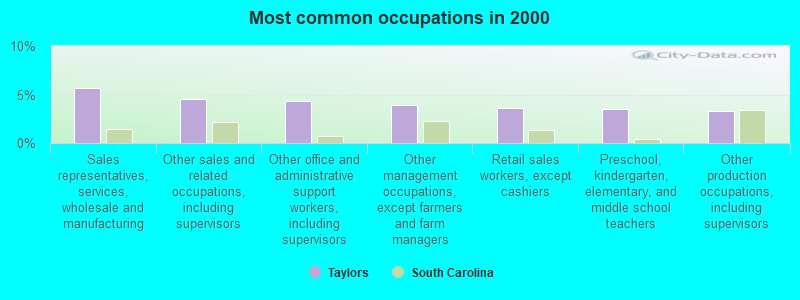
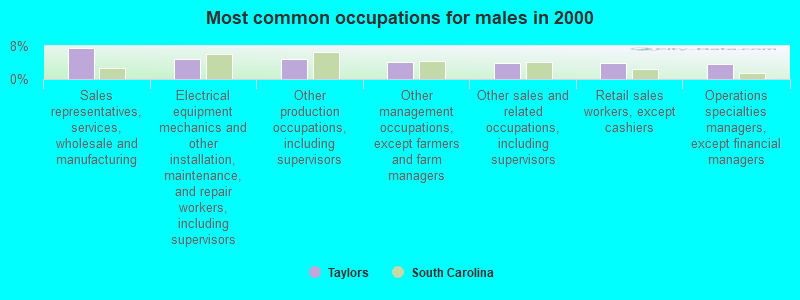
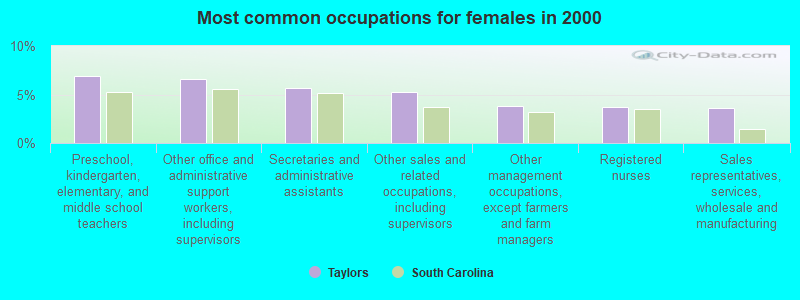


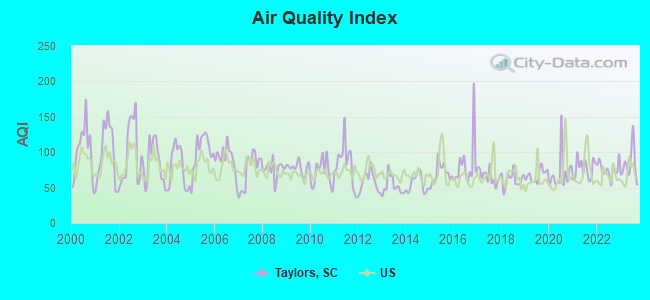
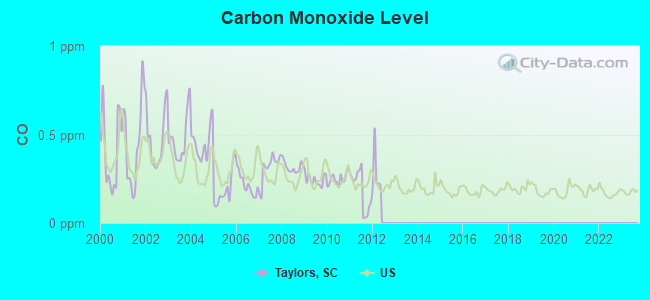
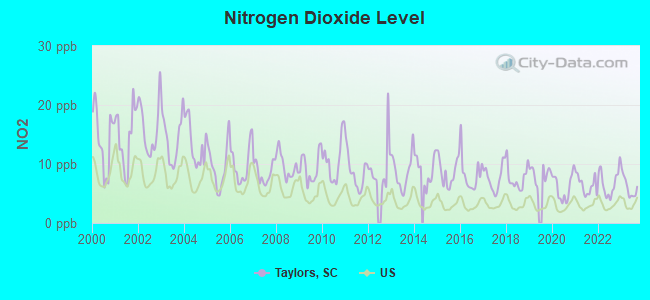
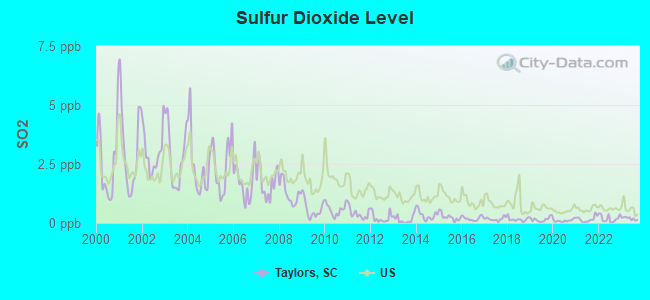
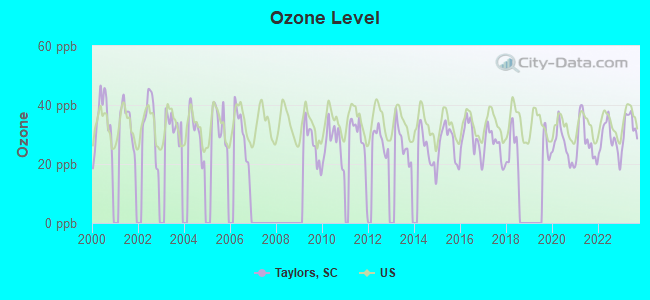
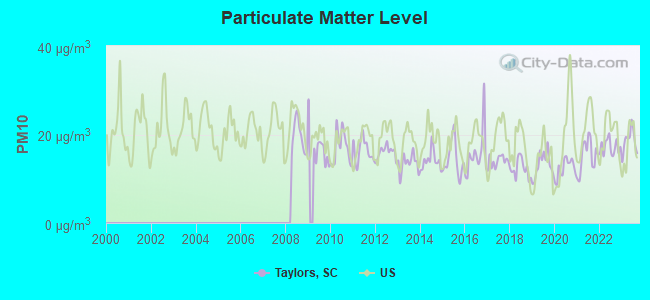
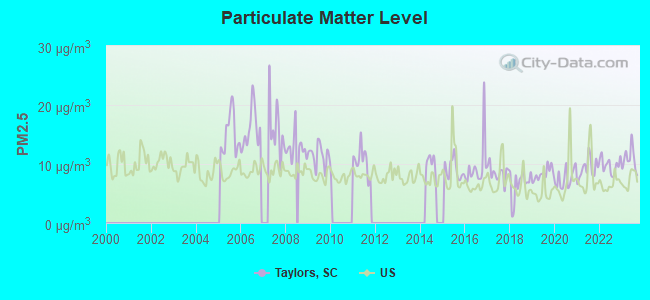
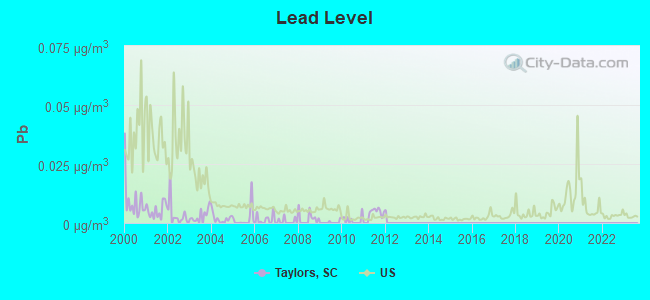
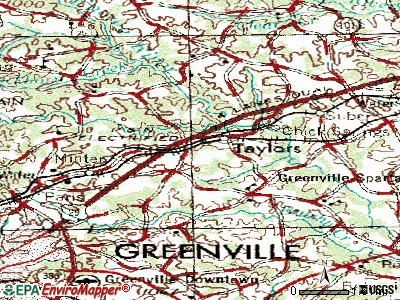
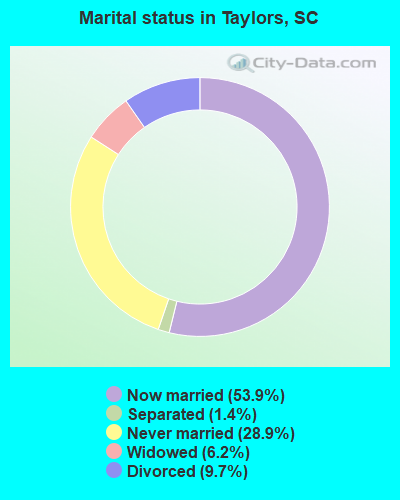
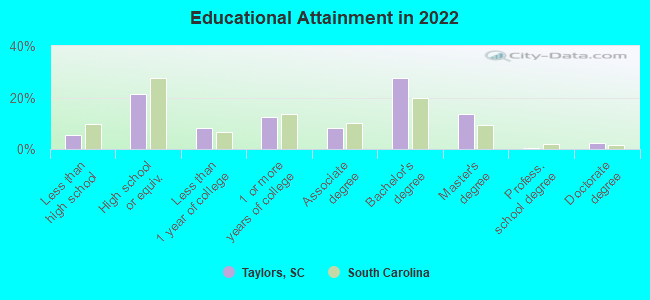
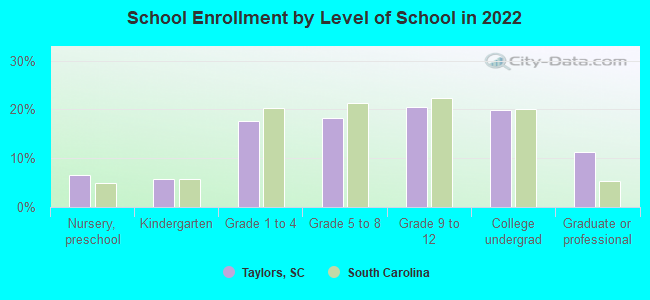
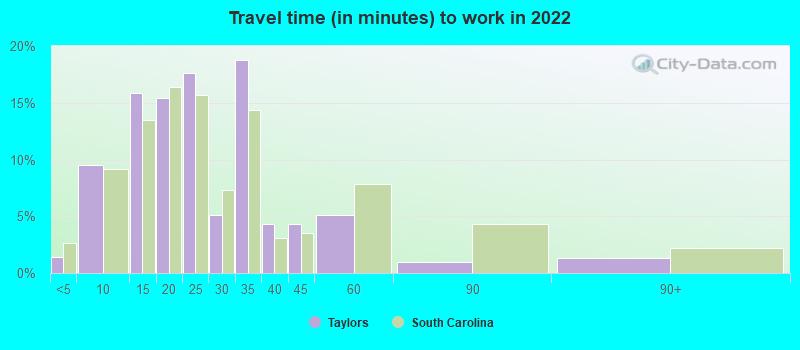
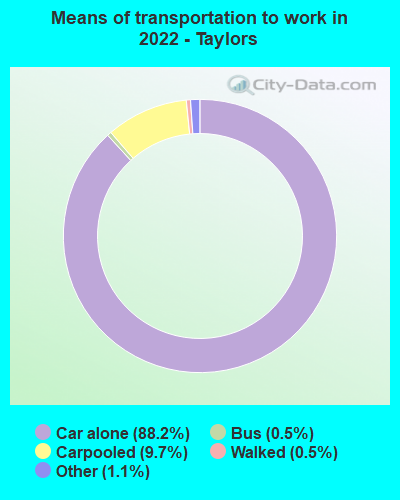
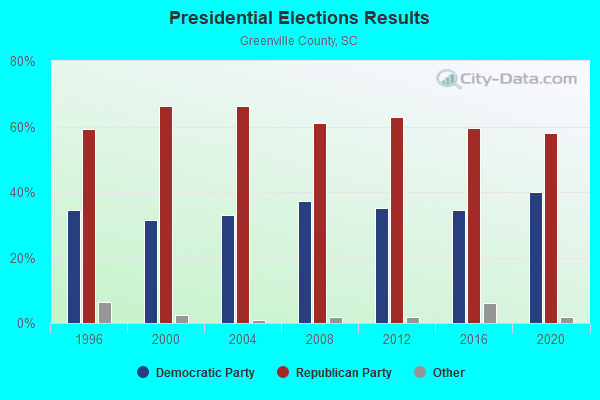

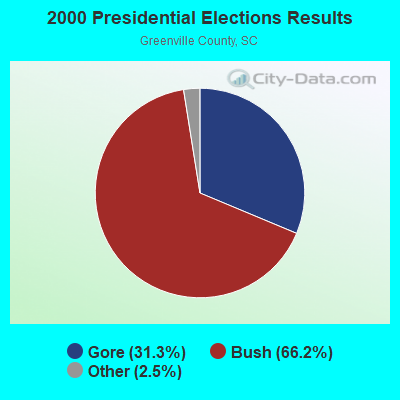
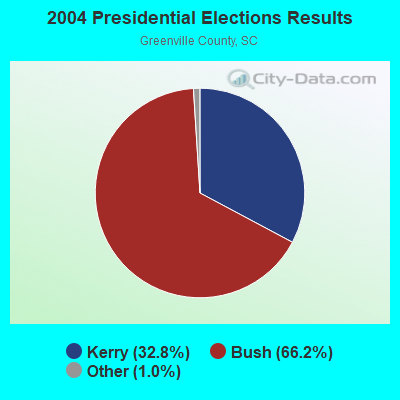
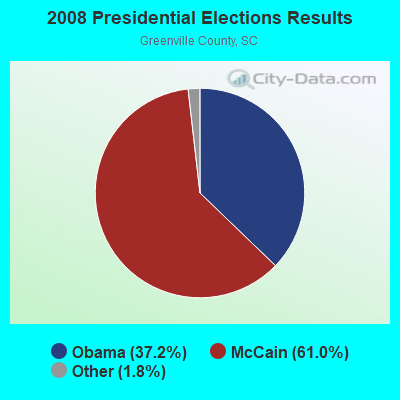
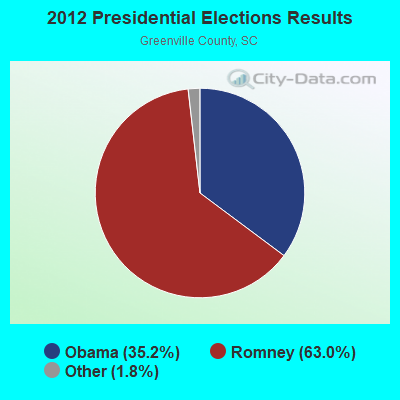
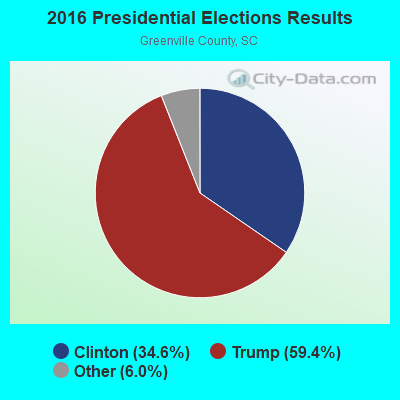
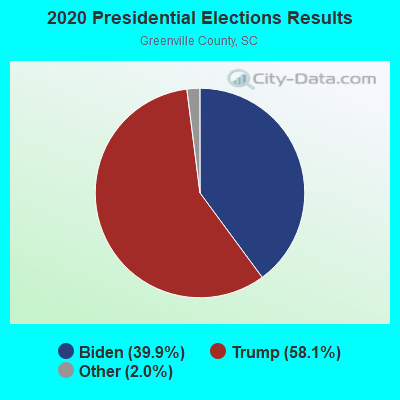
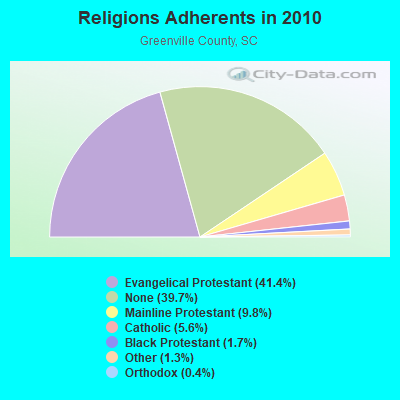
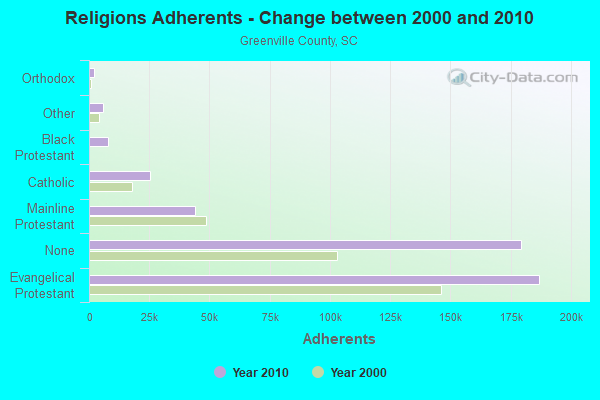
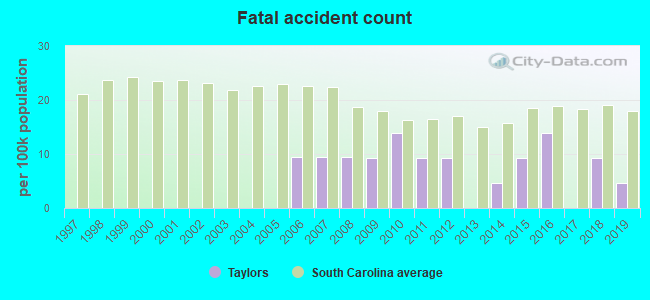
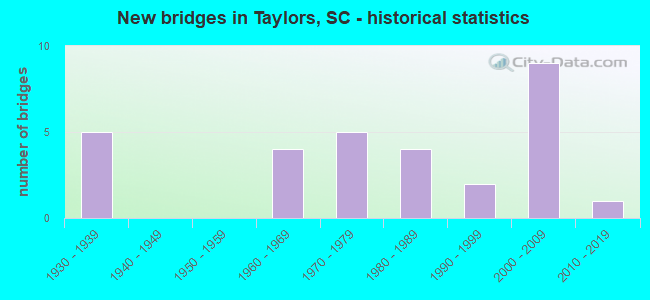
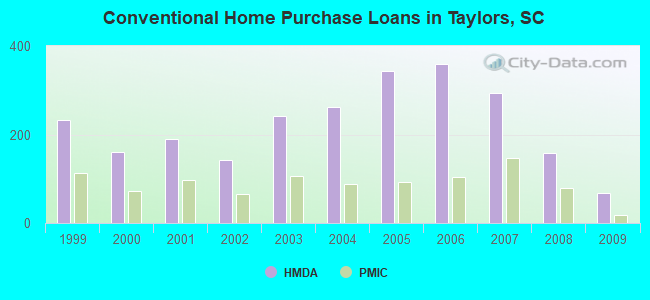
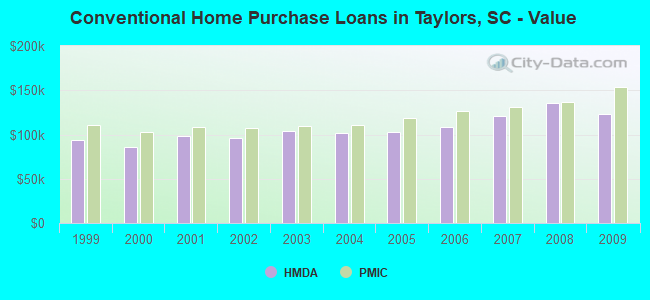
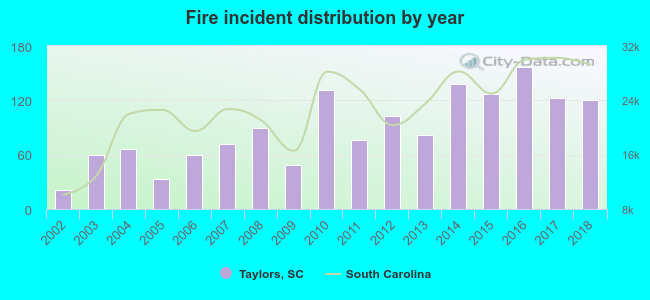 Based on the data from the years 2002 - 2018 the average number of fire incidents per year is 89. The highest number of reported fire incidents - 157 took place in 2016, and the least - 21 in 2002. The data has a growing trend.
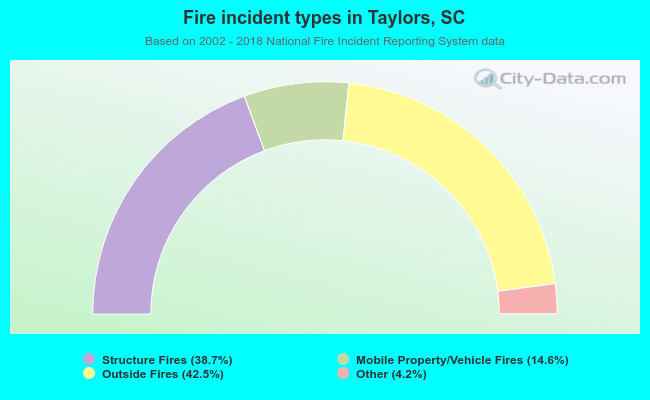 When looking into fire subcategories, the most incidents belonged to: Outside Fires (42.5%), and Structure Fires (38.7%).