Morehead City, North Carolina Submit your own pictures of this town and show them to the world
OSM Map
General Map
Google Map
MSN Map
OSM Map
General Map
Google Map
MSN Map
OSM Map
General Map
Google Map
MSN Map
OSM Map
General Map
Google Map
MSN Map
Please wait while loading the map...
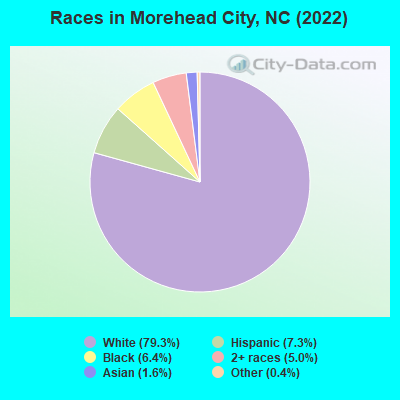
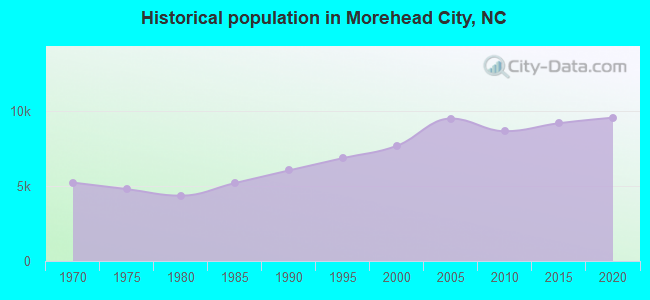
Population in 2022: 9,857 (100% urban, 0% rural). Population change since 2000: +28.2%Males: 4,402 Females: 5,455
March 2022 cost of living index in Morehead City: 86.8 (less than average, U.S. average is 100) Percentage of residents living in poverty in 2022: 15.4%for White Non-Hispanic residents , 34.1% for Black residents , 13.3% for Hispanic or Latino residents , 83.3% for American Indian residents , 8.4% for other race residents , 38.9% for two or more races residents )
Profiles of local businesses
Business Search - 14 Million verified businesses
Data:
Median household income ($)
Median household income (% change since 2000)
Household income diversity
Ratio of average income to average house value (%)
Ratio of average income to average rent
Median household income ($) - White
Median household income ($) - Black or African American
Median household income ($) - Asian
Median household income ($) - Hispanic or Latino
Median household income ($) - American Indian and Alaska Native
Median household income ($) - Multirace
Median household income ($) - Other Race
Median household income for houses/condos with a mortgage ($)
Median household income for apartments without a mortgage ($)
Races - White alone (%)
Races - White alone (% change since 2000)
Races - Black alone (%)
Races - Black alone (% change since 2000)
Races - American Indian alone (%)
Races - American Indian alone (% change since 2000)
Races - Asian alone (%)
Races - Asian alone (% change since 2000)
Races - Hispanic (%)
Races - Hispanic (% change since 2000)
Races - Native Hawaiian and Other Pacific Islander alone (%)
Races - Native Hawaiian and Other Pacific Islander alone (% change since 2000)
Races - Two or more races (%)
Races - Two or more races (% change since 2000)
Races - Other race alone (%)
Races - Other race alone (% change since 2000)
Racial diversity
Unemployment (%)
Unemployment (% change since 2000)
Unemployment (%) - White
Unemployment (%) - Black or African American
Unemployment (%) - Asian
Unemployment (%) - Hispanic or Latino
Unemployment (%) - American Indian and Alaska Native
Unemployment (%) - Multirace
Unemployment (%) - Other Race
Population density (people per square mile)
Population - Males (%)
Population - Females (%)
Population - Males (%) - White
Population - Males (%) - Black or African American
Population - Males (%) - Asian
Population - Males (%) - Hispanic or Latino
Population - Males (%) - American Indian and Alaska Native
Population - Males (%) - Multirace
Population - Males (%) - Other Race
Population - Females (%) - White
Population - Females (%) - Black or African American
Population - Females (%) - Asian
Population - Females (%) - Hispanic or Latino
Population - Females (%) - American Indian and Alaska Native
Population - Females (%) - Multirace
Population - Females (%) - Other Race
Coronavirus confirmed cases (Apr 26, 2024)
Deaths caused by coronavirus (Apr 26, 2024)
Coronavirus confirmed cases (per 100k population) (Apr 26, 2024)
Deaths caused by coronavirus (per 100k population) (Apr 26, 2024)
Daily increase in number of cases (Apr 26, 2024)
Weekly increase in number of cases (Apr 26, 2024)
Cases doubled (in days) (Apr 26, 2024)
Hospitalized patients (Apr 18, 2022)
Negative test results (Apr 18, 2022)
Total test results (Apr 18, 2022)
COVID Vaccine doses distributed (per 100k population) (Sep 19, 2023)
COVID Vaccine doses administered (per 100k population) (Sep 19, 2023)
COVID Vaccine doses distributed (Sep 19, 2023)
COVID Vaccine doses administered (Sep 19, 2023)
Likely homosexual households (%)
Likely homosexual households (% change since 2000)
Likely homosexual households - Lesbian couples (%)
Likely homosexual households - Lesbian couples (% change since 2000)
Likely homosexual households - Gay men (%)
Likely homosexual households - Gay men (% change since 2000)
Cost of living index
Median gross rent ($)
Median contract rent ($)
Median monthly housing costs ($)
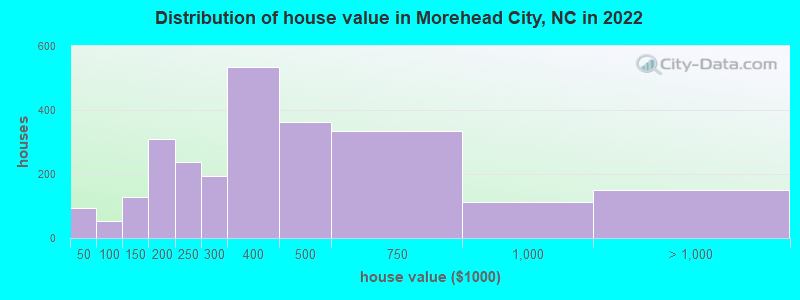
Median house or condo value ($)
Median house or condo value ($ change since 2000)
Mean house or condo value by units in structure - 1, detached ($)
Mean house or condo value by units in structure - 1, attached ($)
Mean house or condo value by units in structure - 2 ($)
Mean house or condo value by units in structure by units in structure - 3 or 4 ($)
Mean house or condo value by units in structure - 5 or more ($)
Mean house or condo value by units in structure - Boat, RV, van, etc. ($)
Mean house or condo value by units in structure - Mobile home ($)
Median house or condo value ($) - White
Median house or condo value ($) - Black or African American
Median house or condo value ($) - Asian
Median house or condo value ($) - Hispanic or Latino
Median house or condo value ($) - American Indian and Alaska Native
Median house or condo value ($) - Multirace
Median house or condo value ($) - Other Race
Median resident age
Resident age diversity
Median resident age - Males
Median resident age - Females
Median resident age - White
Median resident age - Black or African American
Median resident age - Asian
Median resident age - Hispanic or Latino
Median resident age - American Indian and Alaska Native
Median resident age - Multirace
Median resident age - Other Race
Median resident age - Males - White
Median resident age - Males - Black or African American
Median resident age - Males - Asian
Median resident age - Males - Hispanic or Latino
Median resident age - Males - American Indian and Alaska Native
Median resident age - Males - Multirace
Median resident age - Males - Other Race
Median resident age - Females - White
Median resident age - Females - Black or African American
Median resident age - Females - Asian
Median resident age - Females - Hispanic or Latino
Median resident age - Females - American Indian and Alaska Native
Median resident age - Females - Multirace
Median resident age - Females - Other Race
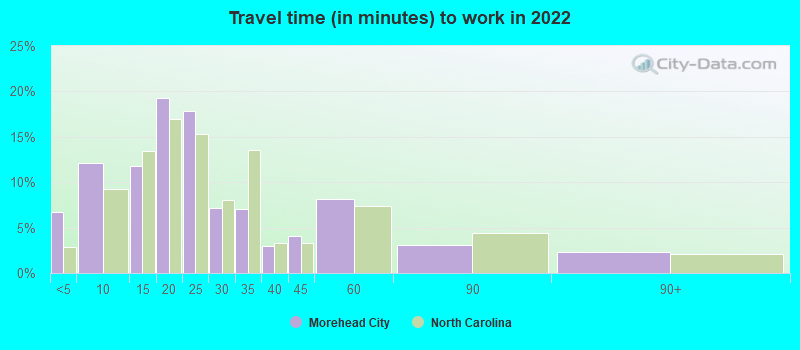
Commute - mean travel time to work (minutes)
Travel time to work - Less than 5 minutes (%)
Travel time to work - Less than 5 minutes (% change since 2000)
Travel time to work - 5 to 9 minutes (%)
Travel time to work - 5 to 9 minutes (% change since 2000)
Travel time to work - 10 to 19 minutes (%)
Travel time to work - 10 to 19 minutes (% change since 2000)
Travel time to work - 20 to 29 minutes (%)
Travel time to work - 20 to 29 minutes (% change since 2000)
Travel time to work - 30 to 39 minutes (%)
Travel time to work - 30 to 39 minutes (% change since 2000)
Travel time to work - 40 to 59 minutes (%)
Travel time to work - 40 to 59 minutes (% change since 2000)
Travel time to work - 60 to 89 minutes (%)
Travel time to work - 60 to 89 minutes (% change since 2000)
Travel time to work - 90 or more minutes (%)
Travel time to work - 90 or more minutes (% change since 2000)
Marital status - Never married (%)
Marital status - Now married (%)
Marital status - Separated (%)
Marital status - Widowed (%)
Marital status - Divorced (%)
Median family income ($)
Median family income (% change since 2000)
Median non-family income ($)
Median non-family income (% change since 2000)
Median per capita income ($)
Median per capita income (% change since 2000)
Median family income ($) - White
Median family income ($) - Black or African American
Median family income ($) - Asian
Median family income ($) - Hispanic or Latino
Median family income ($) - American Indian and Alaska Native
Median family income ($) - Multirace
Median family income ($) - Other Race
Median year house/condo built
Median year apartment built
Year house built - Built 2005 or later (%)
Year house built - Built 2000 to 2004 (%)
Year house built - Built 1990 to 1999 (%)
Year house built - Built 1980 to 1989 (%)
Year house built - Built 1970 to 1979 (%)
Year house built - Built 1960 to 1969 (%)
Year house built - Built 1950 to 1959 (%)
Year house built - Built 1940 to 1949 (%)
Year house built - Built 1939 or earlier (%)
Average household size
Household density (households per square mile)
Average household size - White
Average household size - Black or African American
Average household size - Asian
Average household size - Hispanic or Latino
Average household size - American Indian and Alaska Native
Average household size - Multirace
Average household size - Other Race
Occupied housing units (%)
Vacant housing units (%)
Owner occupied housing units (%)
Renter occupied housing units (%)
Vacancy status - For rent (%)
Vacancy status - For sale only (%)
Vacancy status - Rented or sold, not occupied (%)
Vacancy status - For seasonal, recreational, or occasional use (%)
Vacancy status - For migrant workers (%)
Vacancy status - Other vacant (%)
Residents with income below the poverty level (%)
Residents with income below 50% of the poverty level (%)
Children below poverty level (%)
Poor families by family type - Married-couple family (%)
Poor families by family type - Male, no wife present (%)
Poor families by family type - Female, no husband present (%)
Poverty status for native-born residents (%)
Poverty status for foreign-born residents (%)
Poverty among high school graduates not in families (%)
Poverty among people who did not graduate high school not in families (%)
Residents with income below the poverty level (%) - White
Residents with income below the poverty level (%) - Black or African American
Residents with income below the poverty level (%) - Asian
Residents with income below the poverty level (%) - Hispanic or Latino
Residents with income below the poverty level (%) - American Indian and Alaska Native
Residents with income below the poverty level (%) - Multirace
Residents with income below the poverty level (%) - Other Race
Air pollution - Air Quality Index (AQI)
Air pollution - CO
Air pollution - NO2
Air pollution - SO2
Air pollution - Ozone
Air pollution - PM10
Air pollution - PM25
Air pollution - Pb
Crime - Murders per 100,000 population
Crime - Rapes per 100,000 population
Crime - Robberies per 100,000 population
Crime - Assaults per 100,000 population
Crime - Burglaries per 100,000 population
Crime - Thefts per 100,000 population
Crime - Auto thefts per 100,000 population
Crime - Arson per 100,000 population
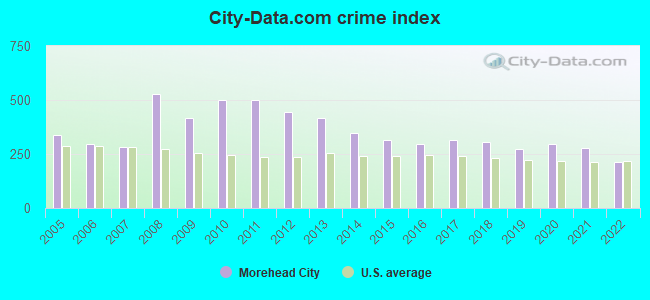
Crime - City-data.com crime index
Crime - Violent crime index
Crime - Property crime index
Crime - Murders per 100,000 population (5 year average)
Crime - Rapes per 100,000 population (5 year average)
Crime - Robberies per 100,000 population (5 year average)
Crime - Assaults per 100,000 population (5 year average)
Crime - Burglaries per 100,000 population (5 year average)
Crime - Thefts per 100,000 population (5 year average)
Crime - Auto thefts per 100,000 population (5 year average)
Crime - Arson per 100,000 population (5 year average)
Crime - City-data.com crime index (5 year average)
Crime - Violent crime index (5 year average)
Crime - Property crime index (5 year average)
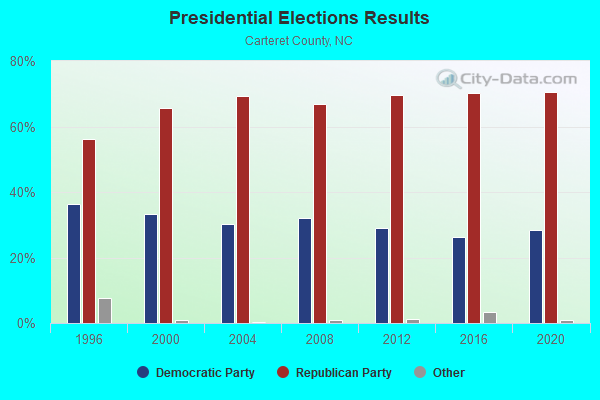
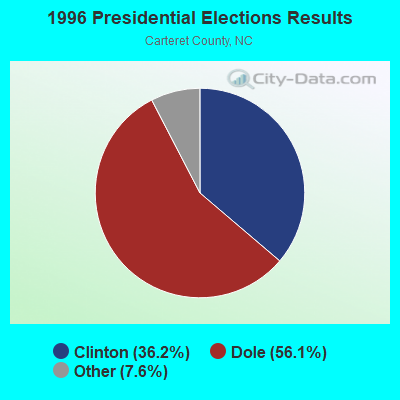
1996 Presidential Elections Results (%) - Democratic Party (Clinton)
1996 Presidential Elections Results (%) - Republican Party (Dole)
1996 Presidential Elections Results (%) - Other
2000 Presidential Elections Results (%) - Democratic Party (Gore)
2000 Presidential Elections Results (%) - Republican Party (Bush)
2000 Presidential Elections Results (%) - Other
2004 Presidential Elections Results (%) - Democratic Party (Kerry)
2004 Presidential Elections Results (%) - Republican Party (Bush)
2004 Presidential Elections Results (%) - Other
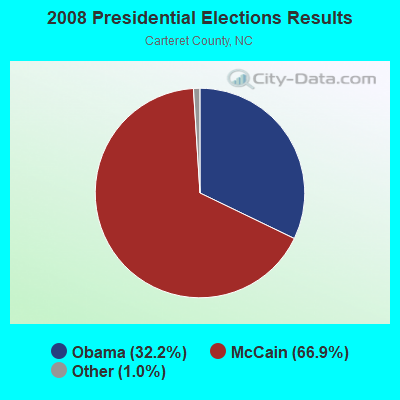
2008 Presidential Elections Results (%) - Democratic Party (Obama)
2008 Presidential Elections Results (%) - Republican Party (McCain)
2008 Presidential Elections Results (%) - Other
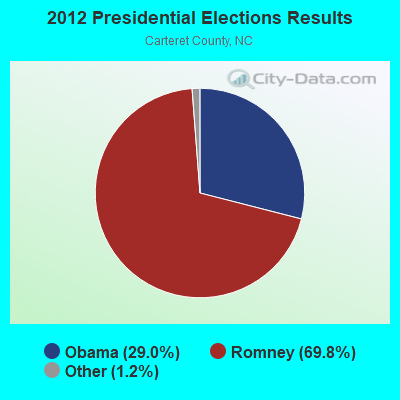
2012 Presidential Elections Results (%) - Democratic Party (Obama)
2012 Presidential Elections Results (%) - Republican Party (Romney)
2012 Presidential Elections Results (%) - Other
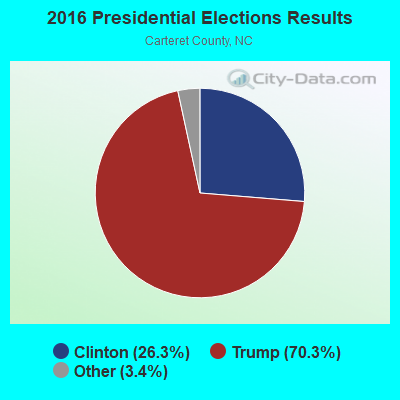
2016 Presidential Elections Results (%) - Democratic Party (Clinton)
2016 Presidential Elections Results (%) - Republican Party (Trump)
2016 Presidential Elections Results (%) - Other
2020 Presidential Elections Results (%) - Democratic Party (Biden)
2020 Presidential Elections Results (%) - Republican Party (Trump)
2020 Presidential Elections Results (%) - Other
Ancestries Reported - Arab (%)
Ancestries Reported - Czech (%)
Ancestries Reported - Danish (%)
Ancestries Reported - Dutch (%)
Ancestries Reported - English (%)
Ancestries Reported - French (%)
Ancestries Reported - French Canadian (%)
Ancestries Reported - German (%)
Ancestries Reported - Greek (%)
Ancestries Reported - Hungarian (%)
Ancestries Reported - Irish (%)
Ancestries Reported - Italian (%)
Ancestries Reported - Lithuanian (%)
Ancestries Reported - Norwegian (%)
Ancestries Reported - Polish (%)
Ancestries Reported - Portuguese (%)
Ancestries Reported - Russian (%)
Ancestries Reported - Scotch-Irish (%)
Ancestries Reported - Scottish (%)
Ancestries Reported - Slovak (%)
Ancestries Reported - Subsaharan African (%)
Ancestries Reported - Swedish (%)
Ancestries Reported - Swiss (%)
Ancestries Reported - Ukrainian (%)
Ancestries Reported - United States (%)
Ancestries Reported - Welsh (%)
Ancestries Reported - West Indian (%)
Ancestries Reported - Other (%)
Educational Attainment - No schooling completed (%)
Educational Attainment - Less than high school (%)
Educational Attainment - High school or equivalent (%)
Educational Attainment - Less than 1 year of college (%)
Educational Attainment - 1 or more years of college (%)
Educational Attainment - Associate degree (%)
Educational Attainment - Bachelor's degree (%)
Educational Attainment - Master's degree (%)
Educational Attainment - Professional school degree (%)
Educational Attainment - Doctorate degree (%)
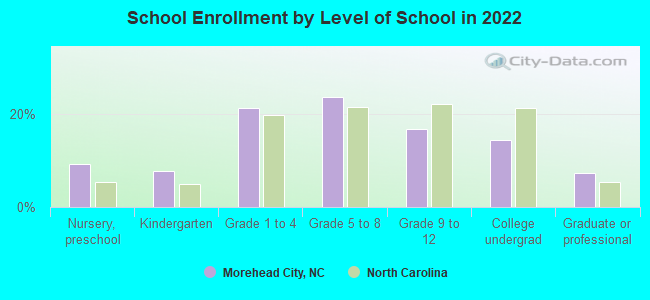
School Enrollment - Nursery, preschool (%)
School Enrollment - Kindergarten (%)
School Enrollment - Grade 1 to 4 (%)
School Enrollment - Grade 5 to 8 (%)
School Enrollment - Grade 9 to 12 (%)
School Enrollment - College undergrad (%)
School Enrollment - Graduate or professional (%)
School Enrollment - Not enrolled in school (%)
School enrollment - Public schools (%)
School enrollment - Private schools (%)
School enrollment - Not enrolled (%)
Median number of rooms in houses and condos
Median number of rooms in apartments
Housing units lacking complete plumbing facilities (%)
Housing units lacking complete kitchen facilities (%)
Density of houses
Urban houses (%)
Rural houses (%)
Households with people 60 years and over (%)
Households with people 65 years and over (%)
Households with people 75 years and over (%)
Households with one or more nonrelatives (%)
Households with no nonrelatives (%)
Population in households (%)
Family households (%)
Nonfamily households (%)
Population in families (%)
Family households with own children (%)
Median number of bedrooms in owner occupied houses
Mean number of bedrooms in owner occupied houses
Median number of bedrooms in renter occupied houses
Mean number of bedrooms in renter occupied houses
Median number of vehichles in owner occupied houses
Mean number of vehichles in owner occupied houses
Median number of vehichles in renter occupied houses
Mean number of vehichles in renter occupied houses
Mortgage status - with mortgage (%)
Mortgage status - with second mortgage (%)
Mortgage status - with home equity loan (%)
Mortgage status - with both second mortgage and home equity loan (%)
Mortgage status - without a mortgage (%)
Average family size
Average family size - White
Average family size - Black or African American
Average family size - Asian
Average family size - Hispanic or Latino
Average family size - American Indian and Alaska Native
Average family size - Multirace
Average family size - Other Race
Geographical mobility - Same house 1 year ago (%)
Geographical mobility - Moved within same county (%)
Geographical mobility - Moved from different county within same state (%)
Geographical mobility - Moved from different state (%)
Geographical mobility - Moved from abroad (%)
Place of birth - Born in state of residence (%)
Place of birth - Born in other state (%)
Place of birth - Native, outside of US (%)
Place of birth - Foreign born (%)
Housing units in structures - 1, detached (%)
Housing units in structures - 1, attached (%)
Housing units in structures - 2 (%)
Housing units in structures - 3 or 4 (%)
Housing units in structures - 5 to 9 (%)
Housing units in structures - 10 to 19 (%)
Housing units in structures - 20 to 49 (%)
Housing units in structures - 50 or more (%)
Housing units in structures - Mobile home (%)
Housing units in structures - Boat, RV, van, etc. (%)
House/condo owner moved in on average (years ago)
Renter moved in on average (years ago)
Year householder moved into unit - Moved in 1999 to March 2000 (%)
Year householder moved into unit - Moved in 1995 to 1998 (%)
Year householder moved into unit - Moved in 1990 to 1994 (%)
Year householder moved into unit - Moved in 1980 to 1989 (%)
Year householder moved into unit - Moved in 1970 to 1979 (%)
Year householder moved into unit - Moved in 1969 or earlier (%)
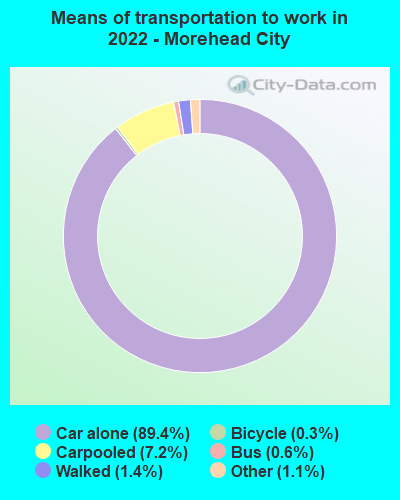
Means of transportation to work - Drove car alone (%)
Means of transportation to work - Carpooled (%)
Means of transportation to work - Public transportation (%)
Means of transportation to work - Bus or trolley bus (%)
Means of transportation to work - Streetcar or trolley car (%)
Means of transportation to work - Subway or elevated (%)
Means of transportation to work - Railroad (%)
Means of transportation to work - Ferryboat (%)
Means of transportation to work - Taxicab (%)
Means of transportation to work - Motorcycle (%)
Means of transportation to work - Bicycle (%)
Means of transportation to work - Walked (%)
Means of transportation to work - Other means (%)
Working at home (%)
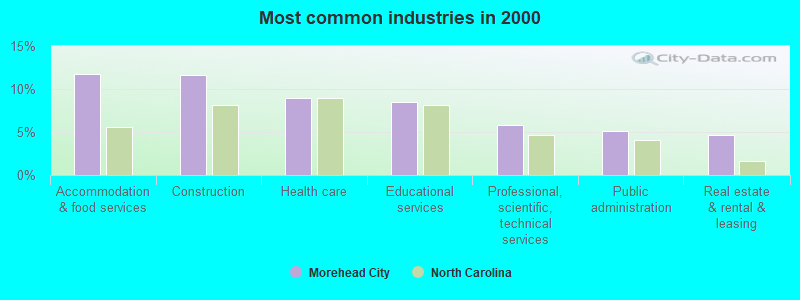
Industry diversity
Most Common Industries - Agriculture, forestry, fishing and hunting, and mining (%)
Most Common Industries - Agriculture, forestry, fishing and hunting (%)
Most Common Industries - Mining, quarrying, and oil and gas extraction (%)
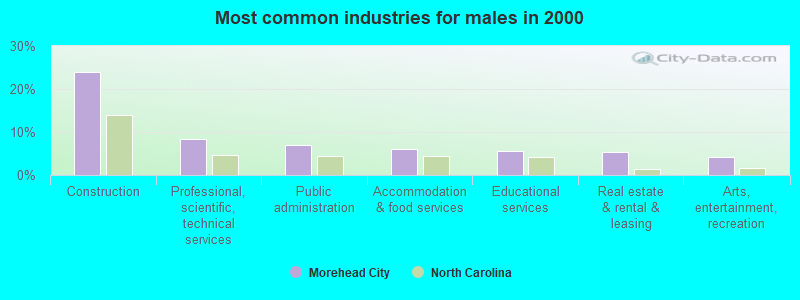
Most Common Industries - Construction (%)
Most Common Industries - Manufacturing (%)
Most Common Industries - Wholesale trade (%)
Most Common Industries - Retail trade (%)
Most Common Industries - Transportation and warehousing, and utilities (%)
Most Common Industries - Transportation and warehousing (%)
Most Common Industries - Utilities (%)
Most Common Industries - Information (%)
Most Common Industries - Finance and insurance, and real estate and rental and leasing (%)
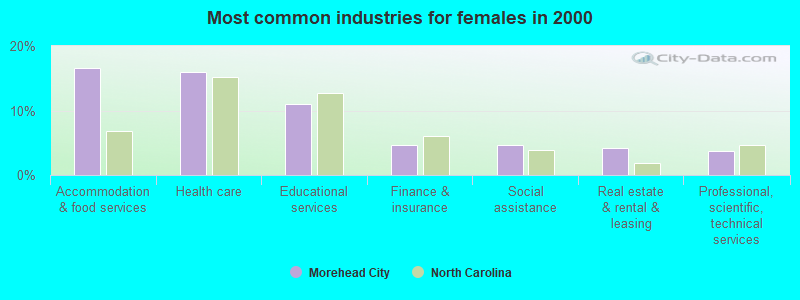
Most Common Industries - Finance and insurance (%)
Most Common Industries - Real estate and rental and leasing (%)
Most Common Industries - Professional, scientific, and management, and administrative and waste management services (%)
Most Common Industries - Professional, scientific, and technical services (%)
Most Common Industries - Management of companies and enterprises (%)
Most Common Industries - Administrative and support and waste management services (%)
Most Common Industries - Educational services, and health care and social assistance (%)
Most Common Industries - Educational services (%)
Most Common Industries - Health care and social assistance (%)
Most Common Industries - Arts, entertainment, and recreation, and accommodation and food services (%)
Most Common Industries - Arts, entertainment, and recreation (%)
Most Common Industries - Accommodation and food services (%)
Most Common Industries - Other services, except public administration (%)
Most Common Industries - Public administration (%)
Occupation diversity
Most Common Occupations - Management, business, science, and arts occupations (%)
Most Common Occupations - Management, business, and financial occupations (%)
Most Common Occupations - Management occupations (%)
Most Common Occupations - Business and financial operations occupations (%)
Most Common Occupations - Computer, engineering, and science occupations (%)
Most Common Occupations - Computer and mathematical occupations (%)
Most Common Occupations - Architecture and engineering occupations (%)
Most Common Occupations - Life, physical, and social science occupations (%)
Most Common Occupations - Education, legal, community service, arts, and media occupations (%)
Most Common Occupations - Community and social service occupations (%)
Most Common Occupations - Legal occupations (%)
Most Common Occupations - Education, training, and library occupations (%)
Most Common Occupations - Arts, design, entertainment, sports, and media occupations (%)
Most Common Occupations - Healthcare practitioners and technical occupations (%)
Most Common Occupations - Health diagnosing and treating practitioners and other technical occupations (%)
Most Common Occupations - Health technologists and technicians (%)
Most Common Occupations - Service occupations (%)
Most Common Occupations - Healthcare support occupations (%)
Most Common Occupations - Protective service occupations (%)
Most Common Occupations - Fire fighting and prevention, and other protective service workers including supervisors (%)
Most Common Occupations - Law enforcement workers including supervisors (%)
Most Common Occupations - Food preparation and serving related occupations (%)
Most Common Occupations - Building and grounds cleaning and maintenance occupations (%)
Most Common Occupations - Personal care and service occupations (%)
Most Common Occupations - Sales and office occupations (%)
Most Common Occupations - Sales and related occupations (%)
Most Common Occupations - Office and administrative support occupations (%)
Most Common Occupations - Natural resources, construction, and maintenance occupations (%)
Most Common Occupations - Farming, fishing, and forestry occupations (%)
Most Common Occupations - Construction and extraction occupations (%)
Most Common Occupations - Installation, maintenance, and repair occupations (%)
Most Common Occupations - Production, transportation, and material moving occupations (%)
Most Common Occupations - Production occupations (%)
Most Common Occupations - Transportation occupations (%)
Most Common Occupations - Material moving occupations (%)
People in Group quarters - Institutionalized population (%)
People in Group quarters - Correctional institutions (%)
People in Group quarters - Federal prisons and detention centers (%)
People in Group quarters - Halfway houses (%)
People in Group quarters - Local jails and other confinement facilities (including police lockups) (%)
People in Group quarters - Military disciplinary barracks (%)
People in Group quarters - State prisons (%)
People in Group quarters - Other types of correctional institutions (%)
People in Group quarters - Nursing homes (%)
People in Group quarters - Hospitals/wards, hospices, and schools for the handicapped (%)
People in Group quarters - Hospitals/wards and hospices for chronically ill (%)
People in Group quarters - Hospices or homes for chronically ill (%)
People in Group quarters - Military hospitals or wards for chronically ill (%)
People in Group quarters - Other hospitals or wards for chronically ill (%)
People in Group quarters - Hospitals or wards for drug/alcohol abuse (%)
People in Group quarters - Mental (Psychiatric) hospitals or wards (%)
People in Group quarters - Schools, hospitals, or wards for the mentally retarded (%)
People in Group quarters - Schools, hospitals, or wards for the physically handicapped (%)
People in Group quarters - Institutions for the deaf (%)
People in Group quarters - Institutions for the blind (%)
People in Group quarters - Orthopedic wards and institutions for the physically handicapped (%)
People in Group quarters - Wards in general hospitals for patients who have no usual home elsewhere (%)
People in Group quarters - Wards in military hospitals for patients who have no usual home elsewhere (%)
People in Group quarters - Juvenile institutions (%)
People in Group quarters - Long-term care (%)
People in Group quarters - Homes for abused, dependent, and neglected children (%)
People in Group quarters - Residential treatment centers for emotionally disturbed children (%)
People in Group quarters - Training schools for juvenile delinquents (%)
People in Group quarters - Short-term care, detention or diagnostic centers for delinquent children (%)
People in Group quarters - Type of juvenile institution unknown (%)
People in Group quarters - Noninstitutionalized population (%)
People in Group quarters - College dormitories (includes college quarters off campus) (%)
People in Group quarters - Military quarters (%)
People in Group quarters - On base (%)
People in Group quarters - Barracks, unaccompanied personnel housing (UPH), (Enlisted/Officer), ;and similar group living quarters for military personnel (%)
People in Group quarters - Transient quarters for temporary residents (%)
People in Group quarters - Military ships (%)
People in Group quarters - Group homes (%)
People in Group quarters - Homes or halfway houses for drug/alcohol abuse (%)
People in Group quarters - Homes for the mentally ill (%)
People in Group quarters - Homes for the mentally retarded (%)
People in Group quarters - Homes for the physically handicapped (%)
People in Group quarters - Other group homes (%)
People in Group quarters - Religious group quarters (%)
People in Group quarters - Dormitories (%)
People in Group quarters - Agriculture workers' dormitories on farms (%)
People in Group quarters - Job Corps and vocational training facilities (%)
People in Group quarters - Other workers' dormitories (%)
People in Group quarters - Crews of maritime vessels (%)
People in Group quarters - Other nonhousehold living situations (%)
People in Group quarters - Other noninstitutional group quarters (%)
Residents speaking English at home (%)
Residents speaking English at home - Born in the United States (%)
Residents speaking English at home - Native, born elsewhere (%)
Residents speaking English at home - Foreign born (%)
Residents speaking Spanish at home (%)
Residents speaking Spanish at home - Born in the United States (%)
Residents speaking Spanish at home - Native, born elsewhere (%)
Residents speaking Spanish at home - Foreign born (%)
Residents speaking other language at home (%)
Residents speaking other language at home - Born in the United States (%)
Residents speaking other language at home - Native, born elsewhere (%)
Residents speaking other language at home - Foreign born (%)
Class of Workers - Employee of private company (%)
Class of Workers - Self-employed in own incorporated business (%)
Class of Workers - Private not-for-profit wage and salary workers (%)
Class of Workers - Local government workers (%)
Class of Workers - State government workers (%)
Class of Workers - Federal government workers (%)
Class of Workers - Self-employed workers in own not incorporated business and Unpaid family workers (%)
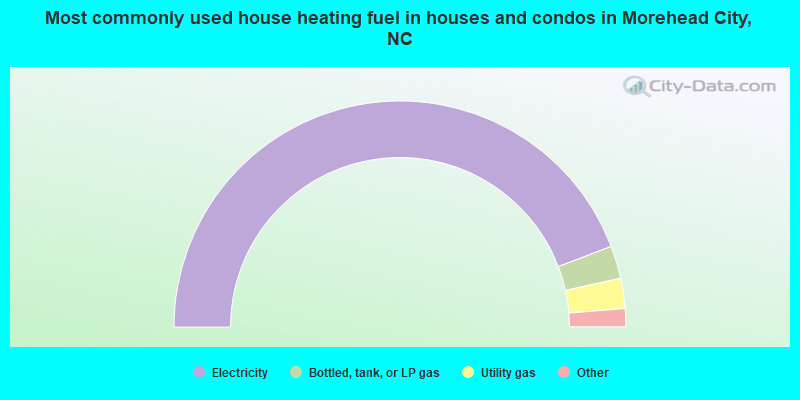
House heating fuel used in houses and condos - Utility gas (%)
House heating fuel used in houses and condos - Bottled, tank, or LP gas (%)
House heating fuel used in houses and condos - Electricity (%)
House heating fuel used in houses and condos - Fuel oil, kerosene, etc. (%)
House heating fuel used in houses and condos - Coal or coke (%)
House heating fuel used in houses and condos - Wood (%)
House heating fuel used in houses and condos - Solar energy (%)
House heating fuel used in houses and condos - Other fuel (%)
House heating fuel used in houses and condos - No fuel used (%)
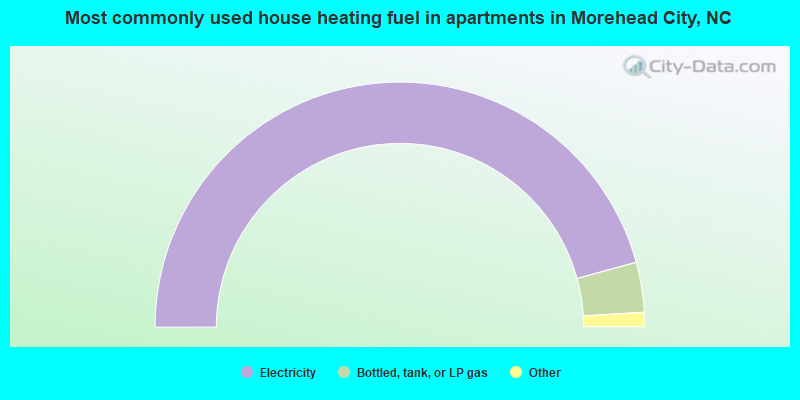
House heating fuel used in apartments - Utility gas (%)
House heating fuel used in apartments - Bottled, tank, or LP gas (%)
House heating fuel used in apartments - Electricity (%)
House heating fuel used in apartments - Fuel oil, kerosene, etc. (%)
House heating fuel used in apartments - Coal or coke (%)
House heating fuel used in apartments - Wood (%)
House heating fuel used in apartments - Solar energy (%)
House heating fuel used in apartments - Other fuel (%)
House heating fuel used in apartments - No fuel used (%)
Armed forces status - In Armed Forces (%)
Armed forces status - Civilian (%)
Armed forces status - Civilian - Veteran (%)
Armed forces status - Civilian - Nonveteran (%)
Fatal accidents locations in years 2005-2021
Fatal accidents locations in 2005
Fatal accidents locations in 2006
Fatal accidents locations in 2007
Fatal accidents locations in 2008
Fatal accidents locations in 2009
Fatal accidents locations in 2010
Fatal accidents locations in 2011
Fatal accidents locations in 2012
Fatal accidents locations in 2013
Fatal accidents locations in 2014
Fatal accidents locations in 2015
Fatal accidents locations in 2016
Fatal accidents locations in 2017
Fatal accidents locations in 2018
Fatal accidents locations in 2019
Fatal accidents locations in 2020
Fatal accidents locations in 2021
Alcohol use - People drinking some alcohol every month (%)
Alcohol use - People not drinking at all (%)
Alcohol use - Average days/month drinking alcohol
Alcohol use - Average drinks/week
Alcohol use - Average days/year people drink much
Audiometry - Average condition of hearing (%)
Audiometry - People that can hear a whisper from across a quiet room (%)
Audiometry - People that can hear normal voice from across a quiet room (%)
Audiometry - Ears ringing, roaring, buzzing (%)
Audiometry - Had a job exposure to loud noise (%)
Audiometry - Had off-work exposure to loud noise (%)
Blood Pressure & Cholesterol - Has high blood pressure (%)
Blood Pressure & Cholesterol - Checking blood pressure at home (%)
Blood Pressure & Cholesterol - Frequently checking blood cholesterol (%)
Blood Pressure & Cholesterol - Has high cholesterol level (%)
Consumer Behavior - Money monthly spent on food at supermarket/grocery store
Consumer Behavior - Money monthly spent on food at other stores
Consumer Behavior - Money monthly spent on eating out
Consumer Behavior - Money monthly spent on carryout/delivered foods
Consumer Behavior - Income spent on food at supermarket/grocery store (%)
Consumer Behavior - Income spent on food at other stores (%)
Consumer Behavior - Income spent on eating out (%)
Consumer Behavior - Income spent on carryout/delivered foods (%)
Current Health Status - General health condition (%)
Current Health Status - Blood donors (%)
Current Health Status - Has blood ever tested for HIV virus (%)
Current Health Status - Left-handed people (%)
Dermatology - People using sunscreen (%)
Diabetes - Diabetics (%)
Diabetes - Had a blood test for high blood sugar (%)
Diabetes - People taking insulin (%)
Diet Behavior & Nutrition - Diet health (%)
Diet Behavior & Nutrition - Milk product consumption (# of products/month)
Diet Behavior & Nutrition - Meals not home prepared (#/week)
Diet Behavior & Nutrition - Meals from fast food or pizza place (#/week)
Diet Behavior & Nutrition - Ready-to-eat foods (#/month)
Diet Behavior & Nutrition - Frozen meals/pizza (#/month)
Drug Use - People that ever used marijuana or hashish (%)
Drug Use - Ever used hard drugs (%)
Drug Use - Ever used any form of cocaine (%)
Drug Use - Ever used heroin (%)
Drug Use - Ever used methamphetamine (%)
Health Insurance - People covered by health insurance (%)
Kidney Conditions-Urology - Avg. # of times urinating at night
Medical Conditions - People with asthma (%)
Medical Conditions - People with anemia (%)
Medical Conditions - People with psoriasis (%)
Medical Conditions - People with overweight (%)
Medical Conditions - Elderly people having difficulties in thinking or remembering (%)
Medical Conditions - People who ever received blood transfusion (%)
Medical Conditions - People having trouble seeing even with glass/contacts (%)
Medical Conditions - People with arthritis (%)
Medical Conditions - People with gout (%)
Medical Conditions - People with congestive heart failure (%)
Medical Conditions - People with coronary heart disease (%)
Medical Conditions - People with angina pectoris (%)
Medical Conditions - People who ever had heart attack (%)
Medical Conditions - People who ever had stroke (%)
Medical Conditions - People with emphysema (%)
Medical Conditions - People with thyroid problem (%)
Medical Conditions - People with chronic bronchitis (%)
Medical Conditions - People with any liver condition (%)
Medical Conditions - People who ever had cancer or malignancy (%)
Mental Health - People who have little interest in doing things (%)
Mental Health - People feeling down, depressed, or hopeless (%)
Mental Health - People who have trouble sleeping or sleeping too much (%)
Mental Health - People feeling tired or having little energy (%)
Mental Health - People with poor appetite or overeating (%)
Mental Health - People feeling bad about themself (%)
Mental Health - People who have trouble concentrating on things (%)
Mental Health - People moving or speaking slowly or too fast (%)
Mental Health - People having thoughts they would be better off dead (%)
Oral Health - Average years since last visit a dentist
Oral Health - People embarrassed because of mouth (%)
Oral Health - People with gum disease (%)
Oral Health - General health of teeth and gums (%)
Oral Health - Average days a week using dental floss/device
Oral Health - Average days a week using mouthwash for dental problem
Oral Health - Average number of teeth
Pesticide Use - Households using pesticides to control insects (%)
Pesticide Use - Households using pesticides to kill weeds (%)
Physical Activity - People doing vigorous-intensity work activities (%)
Physical Activity - People doing moderate-intensity work activities (%)
Physical Activity - People walking or bicycling (%)
Physical Activity - People doing vigorous-intensity recreational activities (%)
Physical Activity - People doing moderate-intensity recreational activities (%)
Physical Activity - Average hours a day doing sedentary activities
Physical Activity - Average hours a day watching TV or videos
Physical Activity - Average hours a day using computer
Physical Functioning - People having limitations keeping them from working (%)
Physical Functioning - People limited in amount of work they can do (%)
Physical Functioning - People that need special equipment to walk (%)
Physical Functioning - People experiencing confusion/memory problems (%)
Physical Functioning - People requiring special healthcare equipment (%)
Prescription Medications - Average number of prescription medicines taking
Preventive Aspirin Use - Adults 40+ taking low-dose aspirin (%)
Reproductive Health - Vaginal deliveries (%)
Reproductive Health - Cesarean deliveries (%)
Reproductive Health - Deliveries resulted in a live birth (%)
Reproductive Health - Pregnancies resulted in a delivery (%)
Reproductive Health - Women breastfeeding newborns (%)
Reproductive Health - Women that had a hysterectomy (%)
Reproductive Health - Women that had both ovaries removed (%)
Reproductive Health - Women that have ever taken birth control pills (%)
Reproductive Health - Women taking birth control pills (%)
Reproductive Health - Women that have ever used Depo-Provera or injectables (%)
Reproductive Health - Women that have ever used female hormones (%)
Sexual Behavior - People 18+ that ever had sex (vaginal, anal, or oral) (%)
Sexual Behavior - Males 18+ that ever had vaginal sex with a woman (%)
Sexual Behavior - Males 18+ that ever performed oral sex on a woman (%)
Sexual Behavior - Males 18+ that ever had anal sex with a woman (%)
Sexual Behavior - Males 18+ that ever had any sex with a man (%)
Sexual Behavior - Females 18+ that ever had vaginal sex with a man (%)
Sexual Behavior - Females 18+ that ever performed oral sex on a man (%)
Sexual Behavior - Females 18+ that ever had anal sex with a man (%)
Sexual Behavior - Females 18+ that ever had any kind of sex with a woman (%)
Sexual Behavior - Average age people first had sex
Sexual Behavior - Average number of female sex partners in lifetime (males 18+)
Sexual Behavior - Average number of female vaginal sex partners in lifetime (males 18+)
Sexual Behavior - Average age people first performed oral sex on a woman (18+)
Sexual Behavior - Average number of woman performed oral sex on in lifetime (18+)
Sexual Behavior - Average number of male sex partners in lifetime (males 18+)
Sexual Behavior - Average number of male anal sex partners in lifetime (males 18+)
Sexual Behavior - Average age people first performed oral sex on a man (18+)
Sexual Behavior - Average number of male oral sex partners in lifetime (18+)
Sexual Behavior - People using protection when performing oral sex (%)
Sexual Behavior - Average number of times people have vaginal or anal sex a year
Sexual Behavior - People having sex without condom (%)
Sexual Behavior - Average number of male sex partners in lifetime (females 18+)
Sexual Behavior - Average number of male vaginal sex partners in lifetime (females 18+)
Sexual Behavior - Average number of female sex partners in lifetime (females 18+)
Sexual Behavior - Circumcised males 18+ (%)
Sleep Disorders - Average hours sleeping at night
Sleep Disorders - People that has trouble sleeping (%)
Smoking-Cigarette Use - People smoking cigarettes (%)
Taste & Smell - People 40+ having problems with smell (%)
Taste & Smell - People 40+ having problems with taste (%)
Taste & Smell - People 40+ that ever had wisdom teeth removed (%)
Taste & Smell - People 40+ that ever had tonsils teeth removed (%)
Taste & Smell - People 40+ that ever had a loss of consciousness because of a head injury (%)
Taste & Smell - People 40+ that ever had a broken nose or other serious injury to face or skull (%)
Taste & Smell - People 40+ that ever had two or more sinus infections (%)
Weight - Average height (inches)
Weight - Average weight (pounds)
Weight - Average BMI
Weight - People that are obese (%)
Weight - People that ever were obese (%)
Weight - People trying to lose weight (%)
Officers per 1,000 residents here:
4.19North Carolina average:
2.27
Latest news from Morehead City, NC collected exclusively by city-data.com from local newspapers, TV, and radio stations
Ancestries: English (31.1%), American (11.0%), German (5.9%), Irish (5.4%), European (4.5%), Italian (2.1%).
Current Local Time:
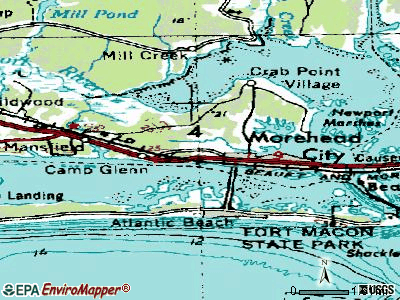
Land area: 5.10 square miles.
Population density: 1,932 people per square mile (low).
355 residents are foreign born (1.4% Latin America , 1.2% Europe , 0.6% Asia ).
This town:
3.6%North Carolina:
8.3%
Median real estate property taxes paid for housing units with mortgages in 2022: $1,608 (0.4%)Median real estate property taxes paid for housing units with no mortgage in 2022: $1,402 (0.4%)
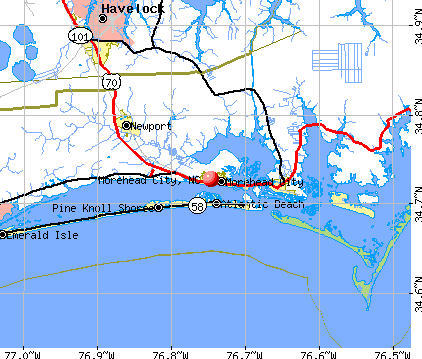
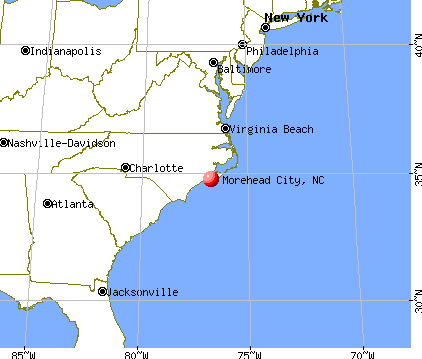
Nearest city with pop. 50,000+: Jacksonville, NC
Nearest city with pop. 200,000+: Raleigh, NC
Nearest city with pop. 1,000,000+: Philadelphia, PA
Nearest cities:
Indian Beach, NC (2.9 miles),
Latitude: 34.73 N, Longitude: 76.75 W
Daytime population change due to commuting: +7,466 (+76.4%)Workers who live and work in this town: 2,623 (59.4%)
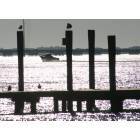
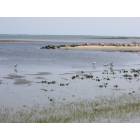
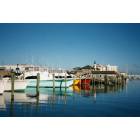
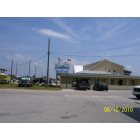
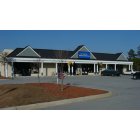
Morehead City tourist attractions:
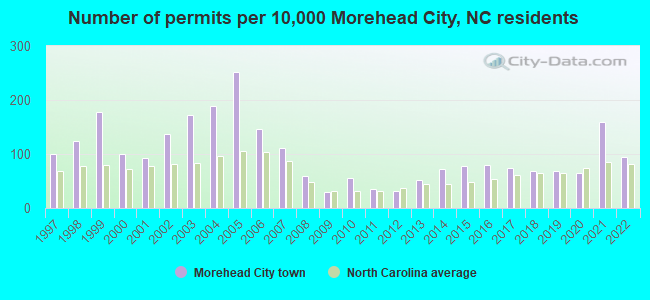
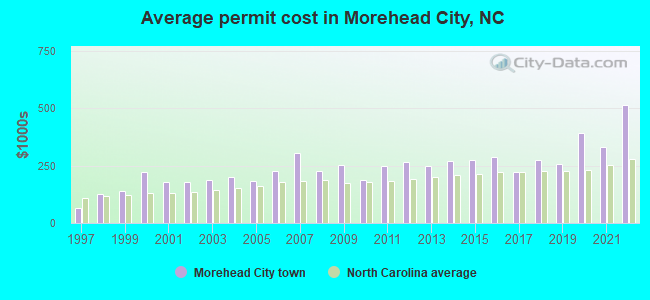
Single-family new house construction building permits:
2022: 73 buildings , average cost: $514,5002021: 122 buildings , average cost: $329,6002020: 49 buildings , average cost: $392,1002019: 52 buildings , average cost: $258,3002018: 53 buildings , average cost: $273,6002017: 57 buildings , average cost: $224,1002016: 61 buildings , average cost: $287,6002015: 60 buildings , average cost: $272,7002014: 55 buildings , average cost: $271,7002013: 40 buildings , average cost: $247,0002012: 24 buildings , average cost: $266,4002011: 28 buildings , average cost: $246,8002010: 42 buildings , average cost: $186,0002009: 23 buildings , average cost: $250,7002008: 46 buildings , average cost: $225,9002007: 85 buildings , average cost: $302,6002006: 112 buildings , average cost: $225,5002005: 194 buildings , average cost: $183,3002004: 145 buildings , average cost: $200,2002003: 133 buildings , average cost: $187,1002002: 105 buildings , average cost: $179,7002001: 71 buildings , average cost: $178,8002000: 77 buildings , average cost: $220,8001999: 136 buildings , average cost: $139,6001998: 95 buildings , average cost: $127,4001997: 77 buildings , average cost: $65,900Unemployment in December 2023: Here:
2.9%North Carolina:
3.2%
Population change in the 1990s: +52 (+0.7%).
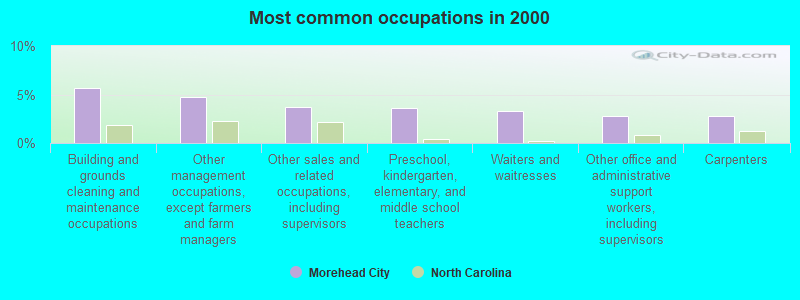
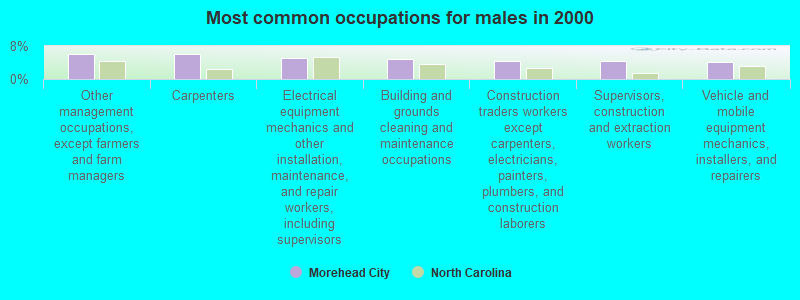
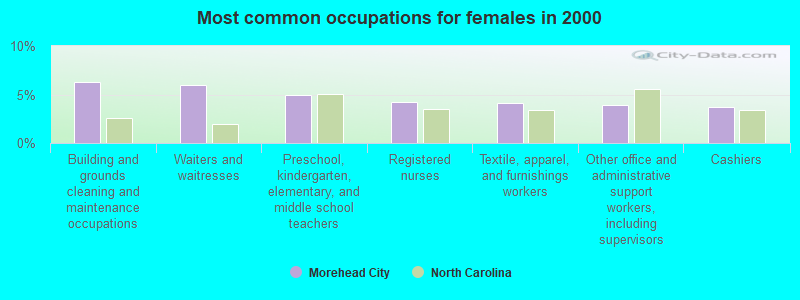
Most common occupations in Morehead City, NC (%)
Both Males Females
Building and grounds cleaning and maintenance occupations (5.7%)
Other management occupations, except farmers and farm managers (4.7%)
Other sales and related occupations, including supervisors (3.7%)
Preschool, kindergarten, elementary, and middle school teachers (3.6%)
Waiters and waitresses (3.3%)
Other office and administrative support workers, including supervisors (2.8%)
Carpenters (2.8%)
Other management occupations, except farmers and farm managers (6.1%)
Carpenters (6.1%)
Electrical equipment mechanics and other installation, maintenance, and repair workers, including supervisors (5.0%)
Building and grounds cleaning and maintenance occupations (4.9%)
Construction traders workers except carpenters, electricians, painters, plumbers, and construction laborers (4.4%)
Supervisors, construction and extraction workers (4.3%)
Vehicle and mobile equipment mechanics, installers, and repairers (4.1%)
Building and grounds cleaning and maintenance occupations (6.3%)
Waiters and waitresses (6.0%)
Preschool, kindergarten, elementary, and middle school teachers (5.0%)
Registered nurses (4.2%)
Textile, apparel, and furnishings workers (4.1%)
Other office and administrative support workers, including supervisors (4.0%)
Cashiers (3.7%)
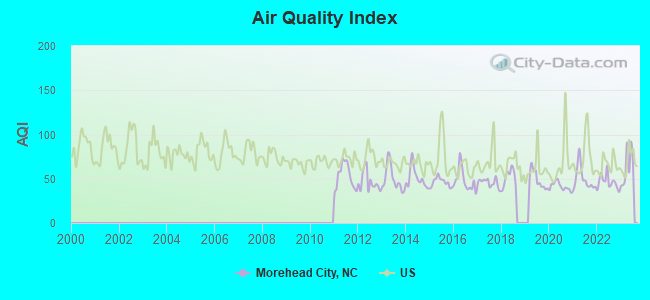
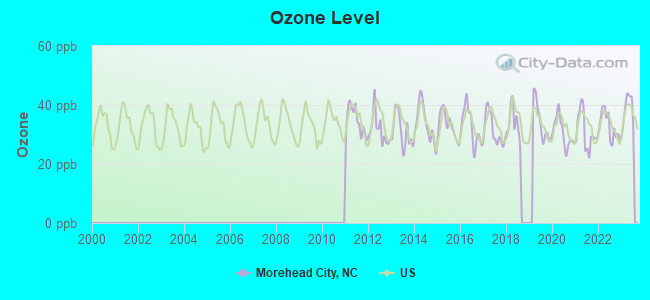
Air pollution and air quality trends(lower is better)
AQI Ozone
Tornado activity:
Morehead City-area historical tornado activity is below North Carolina state average. It is 42% smaller than the overall U.S. average.
On 3/17/1965, a category F3 (max. wind speeds 158-206 mph) tornado 32.8 miles away from the Morehead City town center killed 2 people and injured 85 people and caused between $500,000 and $5,000,000 in damages.
On 12/3/1967, a category F2 (max. wind speeds 113-157 mph) tornado 1.9 miles away from the town center caused between $50,000 and $500,000 in damages.
Earthquake activity:
Morehead City-area historical earthquake activity is significantly above North Carolina state average. It is 70% smaller than the overall U.S. average. On 8/23/2011 at 17:51:04, a magnitude 5.8 (5.8 MW, Depth: 3.7 mi, Class: Moderate, Intensity: VI - VII) earthquake occurred 229.9 miles away from the city center On 8/9/2020 at 12:07:37, a magnitude 5.1 (5.1 MW, Depth: 4.7 mi) earthquake occurred 272.7 miles away from Morehead City center On 8/6/1994 at 19:54:09, a magnitude 3.8 (3.6 LG, 3.8 LG, Depth: 3.1 mi, Class: Light, Intensity: II - III) earthquake occurred 23.5 miles away from Morehead City center On 11/22/1974 at 05:25:55, a magnitude 4.7 (4.7 MB, Class: Light, Intensity: IV - V) earthquake occurred 232.6 miles away from the city center On 12/9/2003 at 20:59:14, a magnitude 4.5 (4.5 MB, 4.5 LG) earthquake occurred 208.0 miles away from the city center On 12/9/2003 at 20:59:18, a magnitude 4.5 (4.5 ML, Depth: 6.2 mi) earthquake occurred 223.8 miles away from the city center Magnitude types: regional Lg-wave magnitude (LG), body-wave magnitude (MB), local magnitude (ML), moment magnitude (MW) Natural disasters: The number of natural disasters in Carteret County (21) is greater than the US average (15).Major Disasters (Presidential) Declared: 9Emergencies Declared: 8Hurricanes: 19, Snowfall: 1, Winter Storm: 1, Other: 1 (Note: some incidents may be assigned to more than one category). Hospitals and medical centers in Morehead City: CARTERET GENERAL HOSPITAL (Proprietary, provides emergency services, 3500 ARENDELL ST) HOSPICE OF CARTERET COUNTY (302 MEDICAL PARK CT, PO DRAWER 1619) CRYSTAL BLUFFS REHABILITATION AND HEALTH CARE CENT (4010 BRIDGES STREET EXTENSION)
HARBORVIEW HEALTH CARE CENTER (812 SHEPARD ST)
MOREHEAD NURSING CENTER (PENNY LANE)
BMA OF CRYSTAL COAST INC (3332 BRIDGES STREET)
CARTERET HOME HEALTH SERVICES (302 MEDICAL PARK COURT)
TAR HEEL HOME HEALTH (CYPRESS BAY PLAZA 5167 US HWY 70 WEST)
Heliports located in Morehead City:
College/University in Morehead City: Carteret Community College Full-time enrollment: 1,431; Location: 3505 Arendell St; Public; Website: www.carteret.edu)
Colleges/universities with over 2000 students nearest to Morehead City:
Craven Community College (about 34 miles; New Bern, NC ; Full-time enrollment: 2,712)
Coastal Carolina Community College (about 37 miles; Jacksonville, NC ; FT enrollment: 4,502)
Lenoir Community College (about 59 miles; Kinston, NC ; FT enrollment: 2,555)
Pitt Community College (about 69 miles; Winterville, NC ; FT enrollment: 7,026)
East Carolina University (about 71 miles; Greenville, NC ; FT enrollment: 23,943)
University of North Carolina Wilmington (about 74 miles; Wilmington, NC ; FT enrollment: 13,112)
Miller-Motte College-Wilmington (about 74 miles; Wilmington, NC ; FT enrollment: 2,395)
Public high schools in Morehead City: WEST CARTERET HIGH Location: 4700 COUNTRY CLUB ROAD, Grades: 9-12)BRIDGES SCHOOL Location: 140 VASHTI DR, Grades: KG-12)
Public elementary/middle schools in Morehead City: MOREHEAD CITY MIDDLE Location: 400 BARBOUR ROAD, Grades: 5-8)MOREHEAD ELEM AT CAMP GLENN Location: 3316 ARENDELL STREET, Grades: 4-5)
MOREHEAD CITY PRIMARY Location: 4409 COUNTRY CLUB ROAD, Grades: PK-3)Private elementary/middle school in Morehead City: ST EGBERT CATHOLIC SCHOOL Students: 110, Location: 1705 EVANS ST, Grades: PK-5)
See full list of schools located in Morehead City
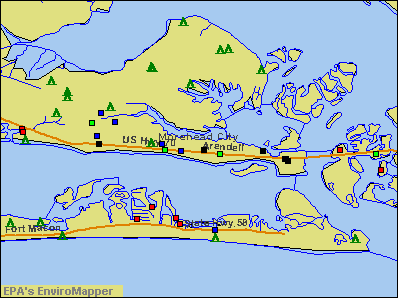
Notable locations in Morehead City: (A) , Camp Glen (B) , Morehead Gulf Docks (C) , Carteret County Museum of History (D) , Spooners Creek Marina (E) , Chamber of Commerce Visitor Center (F) , Carteret County Civic Center (G) , Carteret Historical Museum (H) , Harborview Health Care Center (I) , Carolinas Center for Surgery (J) , Morehead City Hall (K) , Morehead City Police Chief (L) , Morehead City Police Department (M) . Display/hide their locations on the map
Shopping Centers: (1) , Cypress Bay Shopping Center (2) , Market Place Shopping Center (3) . Display/hide their locations on the map
Cemetery: (1) . Display/hide its location on the map
Swamps: (A) . Display/hide its location on the map
Creeks: (A) , Spooner Creek (B) . Display/hide their locations on the map
Park in Morehead City: (1) . Display/hide its location on the map
Tourist attractions: (1) , Downtown Revitalization (801 Arendell Street) (2) . Display/hide their approximate locations on the map
Hotels: (1) , Best Western Buccaneer Inn (2806 Arendell) (2) , Edgewater Motel (1100 Edgewater Place # A) (3) , Buccaneer Motor Lodge (2806 Arendell Street) (4) , Hampton Inn (4035 Arendell Street) (5) , Comfort Inn Morehead City (3100 Arendell Street) (6) . Display/hide their approximate locations on the map
Court: (1) . Display/hide its approximate location on the map
Birthplace of: Chip Peterson - Swimmer, Jake Wade (baseball) - Baseball player, Matt Dodge - Football player, Algenon L. Marbley - District Judge, Calvin Daniels - Football player, Eric McCoo - Football player, Vaughan Johnson - Football player.
Carteret County has a predicted average indoor radon screening level less than 2 pCi/L (pico curies per liter) - Low Potential Drinking water stations with addresses in Morehead City and their reported violations in the past:
LOOKOUT FORD (Population served: 75, Groundwater):
Past health violations:
MCL, Monthly (TCR) - Between JAN-2014 and MAR-2014, Contaminant: Coliform. Follow-up actions: St Public Notif requested (MAR-19-2014), St Formal NOV issued (MAR-19-2014), St Public Notif received (MAR-19-2014), St AO (w/o penalty) issued (MAR-19-2014), St Compliance achieved (APR-30-2014)
Population served: 50, Groundwater):
Past monitoring violations:
2 regular monitoring violations
Population served: 50, Groundwater):
Past health violations:
MCL, Monthly (TCR) - Between APR-2012 and JUN-2012, Contaminant: Coliform. Follow-up actions: St Public Notif requested (MAY-29-2012), St Formal NOV issued (MAY-29-2012), St AO (w/o penalty) issued (MAY-29-2012), St Public Notif received (MAY-30-2012), St Compliance achieved (JUN-11-2012)
MCL, Monthly (TCR) - Between JUL-2011 and SEP-2011, Contaminant: Coliform. Follow-up actions: St Public Notif requested (AUG-24-2011), St Formal NOV issued (AUG-24-2011), St Public Notif received (AUG-24-2011), St AO (w/o penalty) issued (AUG-24-2011), St Compliance achieved (JUN-11-2012)
MCL, Monthly (TCR) - Between OCT-2009 and DEC-2009, Contaminant: Coliform. Follow-up actions: St Public Notif requested (JAN-27-2010), St Formal NOV issued (JAN-27-2010), St Public Notif received (FEB-02-2010), St Compliance achieved (JUL-19-2010)
Past monitoring violations:
One routine major monitoring violation
One minor monitoring violation
Drinking water stations with addresses in Morehead City that have no violations reported:
BALLOU MHP (Population served: 95, Primary Water Source Type: Groundwater)
HANDY HOUSE NO 10 (Population served: 50, Primary Water Source Type: Groundwater)
OPEN DOOR BAPTIST CHURCH (Population served: 50, Primary Water Source Type: Groundwater)
IHRIE SUPPLY COMPANY (Population served: 30, Primary Water Source Type: Groundwater)
Average household size: This town:
2.1 peopleNorth Carolina:
2.5 people
Percentage of family households: This town:
53.3%Whole state:
66.7%
Percentage of households with unmarried partners: This town:
6.4%Whole state:
5.9%
Likely homosexual households (counted as self-reported same-sex unmarried-partner households)
Lesbian couples: 0.3% of all households Gay men: 0.1% of all households
People in group quarters in Morehead City in 2010:
133 people in nursing facilities/skilled-nursing facilities
30 people in other noninstitutional facilities
20 people in emergency and transitional shelters (with sleeping facilities) for people experiencing homelessness
5 people in group homes intended for adults
People in group quarters in Morehead City in 2000:
144 people in other noninstitutional group quarters
73 people in nursing homes
45 people in agriculture workers' dormitories on farms
14 people in hospitals/wards and hospices for chronically ill
14 people in other hospitals or wards for chronically ill
Banks with most branches in Morehead City (2011 data):
Branch Banking and Trust Company: 70 West Main Branch, Morehead City Plaza Branch, Governor's Station Branch. Info updated 2010/03/29: Bank assets: $168,867.6 mil, Deposits: $127,549.5 mil, headquarters in Winston Salem, NC, positive income , Commercial Lending Specialization, 1793 total offices , Holding Company: Bb&T Corporation
Wells Fargo Bank, National Association: Morehead City Branch at 800 Arendell Street, branch established on 1954/09/01; Mitchell Village Branch at 5003 Executive Drive, branch established on 1972/08/30. Info updated 2011/04/05: Bank assets: $1,161,490.0 mil, Deposits: $905,653.0 mil, headquarters in Sioux Falls, SD, positive income , 6395 total offices , Holding Company: Wells Fargo & Company
Sound Banking Company: Messenger Service at 5039 Executive Drive, branch established on 2005/04/12; at 5039 Executive Drive, branch established on 2001/09/04. Info updated 2006/11/03: Bank assets: $113.5 mil, Deposits: $87.3 mil, local headquarters , positive income , Commercial Lending Specialization, 4 total offices
The East Carolina Bank: Morehead City Branch at 168 Nc Highway 24, branch established on 2004/01/26. Info updated 2010/05/27: Bank assets: $921.7 mil, Deposits: $797.6 mil, headquarters in Engelhard, NC, positive income , Commercial Lending Specialization, 25 total offices , Holding Company: Ecb Bancorp, Inc.
Woodforest National Bank: Morehead City Wal-Mart Branch at 300 Highway 24, branch established on 2005/06/22. Info updated 2011/05/10: Bank assets: $3,488.9 mil, Deposits: $3,097.6 mil, headquarters in Houston, TX, positive income , Commercial Lending Specialization, 766 total offices , Holding Company: Woodforest Financial Group Employee Stock Ownership Plan (With 401(K) Provisions)
First Bank: Morehead City Branch 20 at 137 Highway 24 West, branch established on 2003/07/01. Info updated 2011/01/25: Bank assets: $3,289.4 mil, Deposits: $2,759.1 mil, headquarters in Troy, NC, positive income , Commercial Lending Specialization, 98 total offices , Holding Company: First Bancorp
First-Citizens Bank & Trust Company: Morehead City Main Branch at 3412 Bridges Street, branch established on 1971/03/29. Info updated 2011/10/11: Bank assets: $20,566.4 mil, Deposits: $17,596.8 mil, headquarters in Raleigh, NC, positive income , Commercial Lending Specialization, 433 total offices , Holding Company: First Citizens Bancshares, Inc.
Bank of America, National Association: Morehead City Branch at 4913 Arendell Street, branch established on 1996/07/19. Info updated 2009/11/18: Bank assets: $1,451,969.3 mil, Deposits: $1,077,176.8 mil, headquarters in Charlotte, NC, positive income , 5782 total offices , Holding Company: Bank Of America Corporation
PNC Bank, National Association: Arendell Branch at 2300 Arendell Street, branch established on 1996/12/02. Info updated 2012/03/20: Bank assets: $263,309.6 mil, Deposits: $197,343.0 mil, headquarters in Wilmington, DE, positive income , Commercial Lending Specialization, 3085 total offices , Holding Company: Pnc Financial Services Group, Inc., The
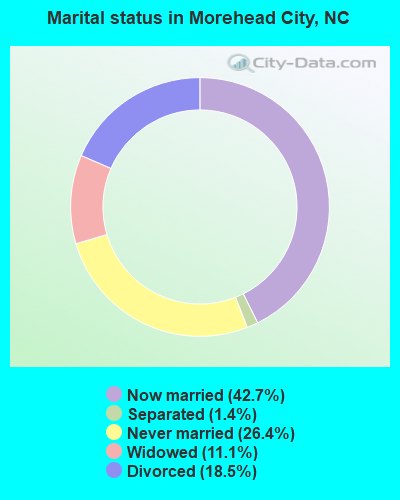
For population 15 years and over in Morehead City:
Never married: 26.4%Now married: 42.7%Separated: 1.4%Widowed: 11.1%Divorced: 18.5% For population 25 years and over in Morehead City:
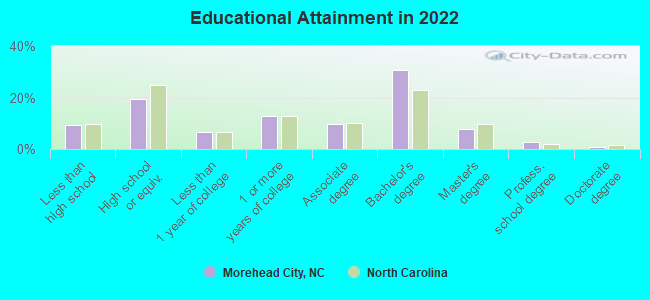
High school or higher: 91.0%Bachelor's degree or higher: 37.8%Graduate or professional degree: 13.5%Unemployed: 7.8%Mean travel time to work (commute): 15.3 minutes
Education Gini index (Inequality in education) Here:
10.2North Carolina average:
11.7
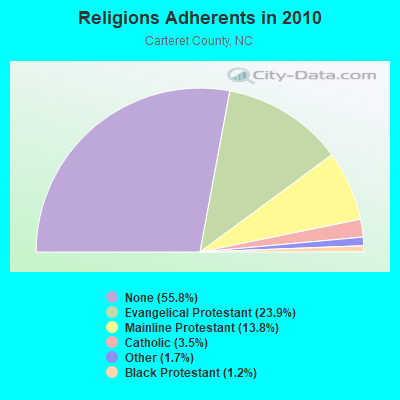
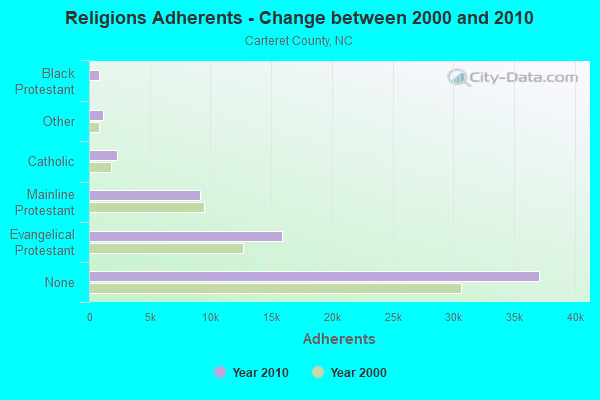
Religion statistics for Morehead City, NC (based on Carteret County data)
Religion Adherents Congregations Evangelical Protestant 15,896 73 Mainline Protestant 9,171 34 Catholic 2,345 1 Other 1,147 6 Black Protestant 813 7 None 37,097 -
Source: Clifford Grammich, Kirk Hadaway, Richard Houseal, Dale E.Jones, Alexei Krindatch, Richie Stanley and Richard H.Taylor. 2012. 2010 U.S.Religion Census: Religious Congregations & Membership Study. Association of Statisticians of American Religious Bodies. Jones, Dale E., et al. 2002. Congregations and Membership in the United States 2000. Nashville, TN: Glenmary Research Center. Graphs represent county-level data
Food Environment Statistics: Number of grocery stores : 15Carteret County :
2.38 / 10,000 pop.State :
2.05 / 10,000 pop.
Number of supercenters and club stores : 2Here :
0.32 / 10,000 pop.State :
0.14 / 10,000 pop.
Number of convenience stores (no gas) : 3This county :
0.48 / 10,000 pop.North Carolina :
0.92 / 10,000 pop.
Number of convenience stores (with gas) : 43Carteret County :
6.81 / 10,000 pop.North Carolina :
4.75 / 10,000 pop.
Number of full-service restaurants : 96Carteret County :
15.20 / 10,000 pop.State :
7.57 / 10,000 pop.
Adult diabetes rate : This county :
11.0%North Carolina :
9.8%
Low-income preschool obesity rate : Carteret County :
15.0%North Carolina :
15.6%
Health and Nutrition: Healthy diet rate : Here:
50.4%North Carolina:
48.9%
Average overall health of teeth and gums : Morehead City:
46.8%State:
46.1%
Average BMI : This city:
28.8North Carolina:
28.8
People feeling badly about themselves : Morehead City:
20.2%State:
20.7%
People not drinking alcohol at all : Morehead City:
12.1%North Carolina:
10.7%
Average hours sleeping at night : This city:
6.8North Carolina:
6.8
Overweight people : Morehead City:
34.9%State:
33.7%
General health condition : This city:
55.2%North Carolina:
55.8%
Average condition of hearing : This city:
77.4%North Carolina:
79.7%
More about Health and Nutrition of Morehead City, NC Residents
Local government employment and payroll (March 2022)
Function
Full-time employees
Monthly full-time payroll
Average yearly full-time wage
Part-time employees
Monthly part-time payroll
Firefighters
48 $246,771 $61,693 7 $8,893 Police Protection - Officers
38 $206,814 $65,310 0 $0 Other and Unallocable
15 $62,534 $50,027 2 $2,409 Water Supply
13 $55,700 $51,415 1 $1,149 Financial Administration
12 $62,538 $62,538 0 $0 Parks and Recreation
9 $37,209 $49,612 8 $5,624 Streets and Highways
7 $26,671 $45,722 0 $0 Sewerage
7 $28,713 $49,222 0 $0 Other Government Administration
6 $43,336 $86,672 0 $0 Police - Other
3 $13,140 $52,560 2 $3,051 Solid Waste Management
1 $3,388 $40,656 0 $0 Fire - Other
1 $3,554 $42,648 0 $0 Local Libraries
0 $0 8 $7,292
Totals for Government
160 $790,367 $59,278 28 $28,418
Morehead City government finances - Expenditure in 2021 (per resident):
Construction - General - Other: $6,673,000 ($676.98)
Current Operations - Local Fire Protection: $5,196,000 ($527.14)
Police Protection: $3,963,000 ($402.05)Water Utilities: $3,075,000 ($311.96)Sewerage: $2,816,000 ($285.69)Parks and Recreation: $1,075,000 ($109.06)Central Staff Services: $1,071,000 ($108.65)Solid Waste Management: $1,055,000 ($107.03)Regular Highways: $766,000 ($77.71)General - Other: $657,000 ($66.65)Protective Inspection and Regulation - Other: $596,000 ($60.46)General Public Buildings: $364,000 ($36.93)Financial Administration: $240,000 ($24.35)Libraries: $114,000 ($11.57)General - Interest on Debt: $551,000 ($55.90)
Water Utilities - Interest on Debt: $172,000 ($17.45)
Morehead City government finances - Revenue in 2021 (per resident):
Charges - Sewerage: $3,707,000 ($376.08)
Solid Waste Management: $1,224,000 ($124.18)Hospital Public: $1,042,000 ($105.71)Miscellaneous Commercial Activities: $92,000 ($9.33)Parks and Recreation: $81,000 ($8.22)Federal Intergovernmental - Other: $285,000 ($28.91)
Local Intergovernmental - Education: $256,000 ($25.97)
Miscellaneous - General Revenue - Other: $997,000 ($101.15)
Sale of Property: $31,000 ($3.14)Donations From Private Sources: $25,000 ($2.54)Interest Earnings: $11,000 ($1.12)Revenue - Water Utilities: $4,061,000 ($411.99)
State Intergovernmental - Other: $1,666,000 ($169.02)
General Local Government Support: $213,000 ($21.61)Public Welfare: $72,000 ($7.30)Housing and Community Development: $36,000 ($3.65)Tax - Property: $8,611,000 ($873.59)
General Sales and Gross Receipts: $5,219,000 ($529.47)Occupation and Business License - Other: $612,000 ($62.09)Motor Vehicle License: $53,000 ($5.38)
Morehead City government finances - Debt in 2021 (per resident):
Long Term Debt - Beginning Outstanding - Unspecified Public Purpose: $18,597,000 ($1886.68)
Outstanding Unspecified Public Purpose: $17,176,000 ($1742.52)Retired Unspecified Public Purpose: $1,420,000 ($144.06)
Businesses in Morehead City, NC
Name Count Name Count
AT&T 1 Lowe's 1 Advance Auto Parts 1 MasterBrand Cabinets 7 Applebee's 1 Maurices 1 Arby's 1 McDonald's 2 Ashley Furniture 1 Nike 2 AutoZone 1 Olive Garden 1 Baskin-Robbins 1 Outback 1 Bed Bath & Beyond 1 Outback Steakhouse 1 Blockbuster 1 Panera Bread 1 Buffalo Wild Wings 1 PetSmart 1 Burger King 1 Pier 1 Imports 1 CVS 1 Pizza Hut 1 Chevrolet 1 Quality 1 Chick-Fil-A 1 RadioShack 1 Curves 1 Rite Aid 1 Dairy Queen 1 Ruby Tuesday 1 Decora Cabinetry 1 Rue21 1 Domino's Pizza 1 SONIC Drive-In 1 Dunkin Donuts 2 Sears 2 Econo Lodge 1 Staples 1 FedEx 3 Starbucks 1 Ford 1 Subway 1 GNC 1 T-Mobile 2 GameStop 1 T.J.Maxx 1 H&R Block 2 Taco Bell 1 Hardee's 1 The Athlete's Foot 1 Hilton 1 True Value 1 Holiday Inn 1 U-Haul 3 Honda 1 U.S. Cellular 1 Jones New York 2 UPS 7 KFC 1 Verizon Wireless 1 Kmart 1 Walgreens 2 Lane Furniture 1 Walmart 1 Little Caesars Pizza 1 Wendy's 1
Strongest AM radio stations in Morehead City:
WBTB (1400 AM; 1 kW; BEAUFORT, NC; Owner: EASTERN CAROLINA BROADCASTING COMPAN)
WSMO (1120 AM; 20 kW; CAMP LEJEUNE, NC; Owner: CTC MEDIA GROUP, INC.)
WPTF (680 AM; 50 kW; RALEIGH, NC; Owner: FIRST STATE COMMUNICATIONS)
WSTK (910 AM; 5 kW; JACKSONVILLE, NC; Owner: EASTERN BROADCASTING, INC.)
WJCV (1290 AM; 5 kW; JACKSONVILLE, NC; Owner: DOWN EAST BROADCASTING CO INC.)
WANG (1330 AM; daytime; 1 kW; HAVELOCK, NC; Owner: NM LICENSING, LLC)
WTAR (850 AM; 50 kW; NORFOLK, VA; Owner: SINCLAIR COMMUNICATIONS)
WFTK (1030 AM; daytime; 50 kW; WAKE FOREST, NC; Owner: POSITIVE RADIO GROUP, INC.)
WCKO (1110 AM; daytime; 50 kW; NORFOLK, VA; Owner: WORD BROADCASTING NETWORK, INC.)
WNCT (1070 AM; 10 kW; GREENVILLE, NC; Owner: WNCT LICENSE LIMITED PARTNERSHIP)
WDLX (930 AM; 5 kW; WASHINGTON, NC; Owner: NM LICENSING, LLC)
WRNS (960 AM; 5 kW; KINSTON, NC; Owner: NM LICENSING, LLC)
WRVA (1140 AM; 50 kW; RICHMOND, VA; Owner: CLEAR CHANNEL BROADCASTING LICENSES, INC.)
Strongest FM radio stations in Morehead City:
W218AR (91.5 FM; BEAUFORT, NC; Owner: AMERICAN FAMILY ASSOCIATION)
WBJD (91.5 FM; ATLANTIC BEACH, NC; Owner: CRAVEN COMMUNITY COLLEGE)
WRHT (96.3 FM; MOREHEAD CITY, NC; Owner: ABG NORTH CAROLINA, LLC)
WLGP (100.3 FM; HARKERS ISLAND, NC; Owner: BARINOWSKI INVESTMENT COMPANY)
WOTJ (90.7 FM; MOREHEAD CITY, NC; Owner: GRACE CHRISTIAN SCHOOL)
WANG-FM (105.1 FM; HAVELOCK, NC; Owner: NM LICENSING, LLC)
W203BC (88.5 FM; BEAUFORT, NC; Owner: AMERICAN FAMILY ASSOCIATION)
WTKF (107.3 FM; ATLANTIC, NC; Owner: ATLANTIC RIDGE TELECASTERS, INC.)
WMGV (103.3 FM; NEWPORT, NC; Owner: WMGV LICENSE LIMITED PARTNERSHIP)
WNBR (94.1 FM; ORIENTAL, NC; Owner: ABG NORTH CAROLINA, LLC)
WRUP (97.9 FM; BAYBORO, NC; Owner: CONNER MEDIA CORPORATION)
WERO (93.3 FM; WASHINGTON, NC; Owner: NM LICENSING, LLC)
WNCT-FM (107.9 FM; GREENVILLE, NC; Owner: WNCT LICENSE LIMITED PARTNERSHIP)
W220DD (91.9 FM; MOREHEAD CITY, NC; Owner: FAMILY WORSHIP CENTER CHURCH, INC.)
WIKS (101.9 FM; NEW BERN, NC; Owner: WIKS LICENSE LIMITED PARTNERSHIP)
WSFL-FM (106.5 FM; NEW BERN, NC; Owner: WSFL LICENSE LIMITED PARTNERSHIP)
TV broadcast stations around Morehead City:
W05BI (Channel 5; MOREHEAD CITY, NC; Owner: MEDIA GENERAL COMMUNICATIONS, INC.)
WFXI (Channel 8; MOREHEAD CITY, NC; Owner: PIEDMONT TELEVISION OF EASTERN CAROLINA LICENSE LLC)
WCTI-TV (Channel 12; NEW BERN, NC; Owner: EASTERN NORTH CAROLINA BROADCASTING CORPORATION)
WUNM-TV (Channel 19; JACKSONVILLE, NC; Owner: UNIVERSITY OF NORTH CAROLINA)
WITN-TV (Channel 7; WASHINGTON, NC; Owner: WITN LICENSEE CORP.)
WNCT-TV (Channel 9; GREENVILLE, NC; Owner: MEDIA GENERAL COMMUNICATIONS, INC.)
WPXU-TV (Channel 35; JACKSONVILLE, NC; Owner: PAXSON JACKSONVILLE LICENSE, INC.)
National Bridge Inventory (NBI) Statistics 4 Number of bridges46ft / 13.6m Total length32,000 Total average daily traffic3,172 Total average daily truck traffic64,000 Total future (year 2040) average daily traffic
Fire-safe hotels and motels in Morehead City, North Carolina:
Quality Inn, 3100 Arendell St, Morehead City, North Carolina 28557 Phone: (252) 247-3434, Fax: (252) 247-4411
Econo Lodge Crystal Coast, 3410 Bridges St, Morehead City, North Carolina 28557 Phone: (252) 247-2940, Fax: (252) 247-0746
Buccaneer Inn Magnuson Hotel, 2806 Arendell St, Morehead City, North Carolina 28557 Phone: (252) 726-3115, Fax: (252) 726-3864
Amerisuites, 118 Salter Path Rd, Morehead City, North Carolina 28557 Phone: (252) 247-5118, Fax: (252) 247-5705
Bask Hotel, 814 Shepard St, Morehead city, North Carolina 28557 Phone: (252) 499-9200, Fax: (252) 499-9181
All 5 fire-safe hotels and motels in Morehead City, North Carolina
Most common first names in Morehead City, NC among deceased individuals Name Count Lived (average)
William 142 72.1 years John 140 73.9 years James 132 71.6 years Mary 131 77.4 years Robert 80 74.0 years Charles 78 71.6 years George 69 73.8 years Margaret 54 77.8 years Elizabeth 44 81.5 years Ruth 42 80.9 years
Most common last names in Morehead City, NC among deceased individuals Last name Count Lived (average)
Willis 178 76.3 years Smith 98 73.8 years Lewis 98 76.3 years Jones 79 75.4 years Guthrie 70 74.3 years Bell 61 77.7 years Davis 58 78.6 years Johnson 40 73.0 years Fulcher 32 74.3 years Williams 31 76.5 years
Morehead City compared to North Carolina state average:
Unemployed percentage below state average. Black race population percentage below state average. Foreign-born population percentage below state average. Length of stay since moving in significantly above state average. Percentage of population with a bachelor's degree or higher above state average. Morehead City on our top lists :
#54 on the list of "Top 101 cities with the highest number of police officers per 1000 residents (population 5,000+)"
#57 on the list of "Top 101 cities with largest percentage of males in occupations: health technologists and technicians (population 5,000+)"
#94 on the list of "Top 101 cities with the smallest racial income disparities between White and Black householders (with at least 200 householders)"
#52 on the list of "Top 101 counties with the largest number of people moving in compared to moving out (pop. 50,000+)"
#91 on the list of "Top 101 counties with the lowest total withdrawal of fresh water for public supply (pop. 50,000+)"
#98 on the list of "Top 101 counties with highest percentage of residents voting for Romney (Republican) in the 2012 Presidential Election (pop. 50,000+)"
Top Patent Applicants
David G. Kent (5)
John F. Farrell (2)
Daniel Rittschof (2)
Matthew F. Cagle (1)
Beatriz Orihuela De Diaz (1)
Chris Milner (1)
Lester Snedaker (1)
Clifford Craig Willis, Jr. (1)
Ralph W. Brittingham, Jr. (1)
Jason Gray Yeomans (1)
Total of 18 patent applications in 2008-2024.


 Recent articles from our blog. Our writers, many of them Ph.D. graduates or candidates, create easy-to-read articles on a wide variety of topics.

 (37.7 miles
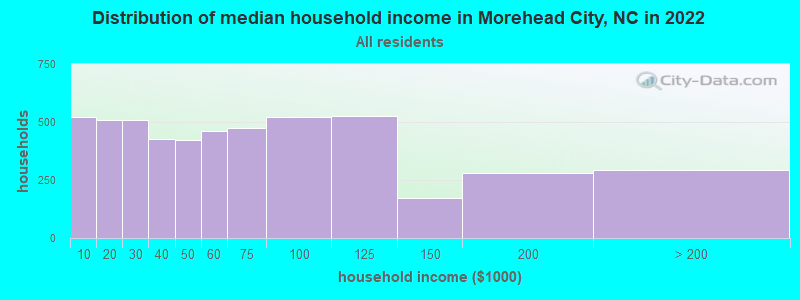


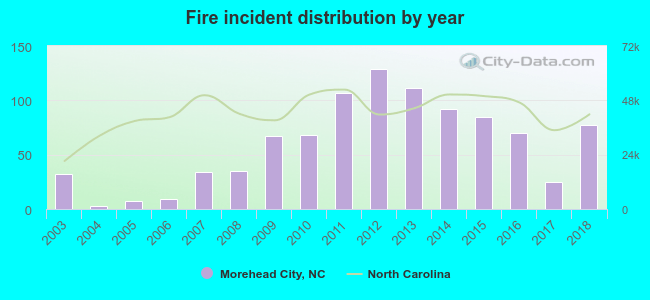 Based on the data from the years 2003 - 2018 the average number of fire incidents per year is 59. The highest number of reported fires - 129 took place in 2012, and the least - 3 in 2004. The data has a growing trend.
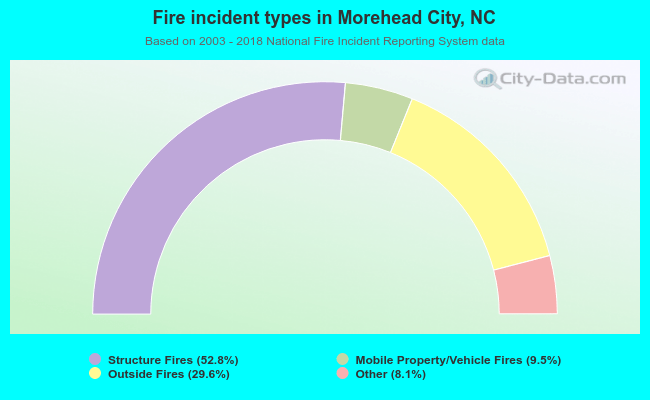 When looking into fire subcategories, the most incidents belonged to: Structure Fires (52.8%), and Outside Fires (29.6%).