Alachua, Florida
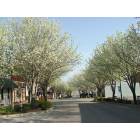
Alachua: Alachua;s Million Dollar Main Street in Spring
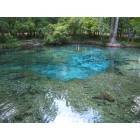
Alachua: Picture taken Florida Springs..
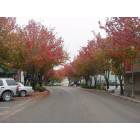
Alachua: Main Street in fall
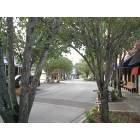
Alachua: First annual ScareCrow Row 2004 sponsored by the Alachua Business League
- add
your
Submit your own pictures of this city and show them to the world
- OSM Map
- General Map
- Google Map
- MSN Map
Population change since 2000: +76.7%
| Males: 4,470 | |
| Females: 6,303 |
| Median resident age: | 40.7 years |
| Florida median age: | 42.7 years |
Zip codes: 32615, 32616, 32643, 32653.
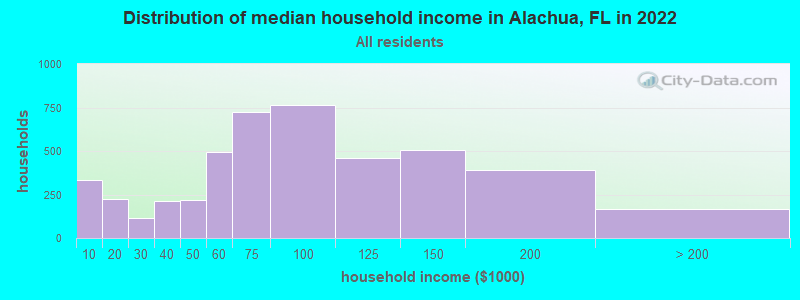
Alachua Zip Code Map| Alachua: | $73,483 |
| FL: | $69,303 |
Estimated per capita income in 2022: $36,396 (it was $18,299 in 2000)
Alachua city income, earnings, and wages data
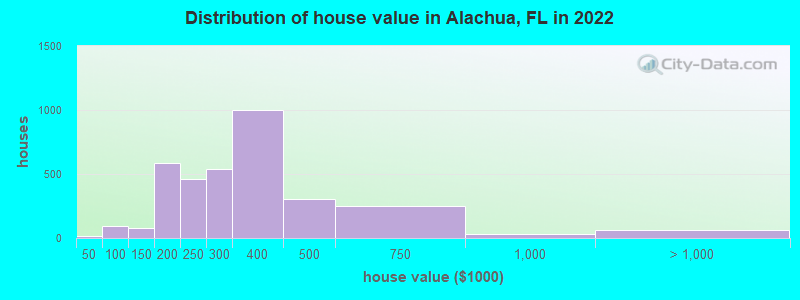
Estimated median house or condo value in 2022: $307,568 (it was $87,500 in 2000)
| Alachua: | $307,568 |
| FL: | $354,100 |
Mean prices in 2022: all housing units: $288,819; detached houses: $292,267; townhouses or other attached units: $227,833; in 5-or-more-unit structures: $224,489; mobile homes: $221,183
Median gross rent in 2022: $1,202.
(6.1% for White Non-Hispanic residents, 30.5% for Black residents, 7.2% for Hispanic or Latino residents, 10.1% for two or more races residents)
Detailed information about poverty and poor residents in Alachua, FL


Compare current foreclosures near Alachua, FL:
| Photo | Address | Area | Beds / Baths | Price | Details |
|---|---|---|---|---|---|

|
#1
NW 74th Ave
Alachua, FL 32615
|
2,778 sq. feet
|
2 baths 2 beds |
show details | |

|
#2
NW 197th Ter
Alachua, FL 32615
|
2,036 sq. feet
|
2 baths 3 beds |
show details | |

|
#3
Old Bellamy Rd
Alachua, FL 32615
|
1,728 sq. feet
|
2 baths 3 beds |
show details | |

|
#4
NW 181st Ter
Alachua, FL 32615
|
924 sq. feet
|
2 baths 3 beds |
show details | |

|
#5
NW 290th Ave
Alachua, FL 32615
|
1,128 sq. feet
|
4 baths 4 beds |
show details | |

|
#6
NW County Road 239
Alachua, FL 32615
|
- sq. feet
|
- baths - beds |
show details | |

|
#7
NW 174th Dr Ste D
Alachua, FL 32615
|
- sq. feet
|
- baths - beds |
show details | |

|
#8
Blvd
Alachua, FL 32615
|
- sq. feet
|
- baths - beds |
show details | |

|
#9
Turkey Crk
Alachua, FL 32615
|
- sq. feet
|
- baths - beds |
show details | |
|
|
#10
NW 141st Pl
Alachua, FL 32615
|
- sq. feet
|
- baths - beds |
show details |
| Photo | Address | Area | Beds / Baths | Price | Details |
|---|---|---|---|---|---|

|
#11
NW 105th Ln
Alachua, FL 32615
|
- sq. feet
|
- baths - beds |
show details | |

|
#12
NE 31st Ave
Gainesville, FL 32609
|
1,525 sq. feet
|
2 baths 4 beds |
show details | |

|
#13
NW 47th Way
Gainesville, FL 32653
|
1,380 sq. feet
|
2 baths 3 beds |
show details | |

|
#14
NW 70th Ln
Gainesville, FL 32653
|
2,003 sq. feet
|
2 baths 3 beds |
show details | |

|
#15
NE 48th St
Gainesville, FL 32641
|
1,308 sq. feet
|
2 baths 3 beds |
show details | |

|
#16
SW 84th Ter
Lake Butler, FL 32054
|
- sq. feet
|
2 baths 3 beds |
show details | |

|
#17
SW 35th Pl Apt 1505
Gainesville, FL 32608
|
1,001 sq. feet
|
1 baths 2 beds |
show details | |

|
#18
SW 14th Dr
Gainesville, FL 32608
|
1,376 sq. feet
|
2 baths 3 beds |
show details | |

|
#19
SW 35th Pl Apt H
Gainesville, FL 32608
|
1,450 sq. feet
|
2 baths 2 beds |
show details | |

|
#20
SW 14th Dr
Gainesville, FL 32608
|
1,670 sq. feet
|
2 baths 3 beds |
show details |
| Photo | Address | Area | Beds / Baths | Price | Details |
|---|---|---|---|---|---|

|
#21
SW 64th Ln
Gainesville, FL 32608
|
2,234 sq. feet
|
3 baths 3 beds |
show details | |

|
#22
NE 17th Pl
Gainesville, FL 32609
|
1,025 sq. feet
|
2 baths 3 beds |
show details | |

|
#23
NE 31st Ave
Gainesville, FL 32609
|
1,525 sq. feet
|
2 baths 4 beds |
show details | |

|
#24
NE 20th Ave
Gainesville, FL 32609
|
1,506 sq. feet
|
2 baths 3 beds |
show details | |

|
#25
SW 63rd Ct
Gainesville, FL 32608
|
1,296 sq. feet
|
2 baths 3 beds |
show details | |

|
#26
NE 17th Ter
Gainesville, FL 32609
|
1,662 sq. feet
|
2 baths 3 beds |
show details | |

|
#27
SW 86th Ter
Gainesville, FL 32608
|
1,137 sq. feet
|
2 baths 3 beds |
show details | |

|
#28
SW 86th Ter
Gainesville, FL 32608
|
1,269 sq. feet
|
2 baths 3 beds |
show details | |

|
#29
NE 11th Pl
Gainesville, FL 32641
|
1,348 sq. feet
|
2 baths 3 beds |
show details | |

|
#30
NW 7th Ave
Gainesville, FL 32601
|
1,170 sq. feet
|
2 baths 4 beds |
show details |
| Photo | Address | Area | Beds / Baths | Price | Details |
|---|---|---|---|---|---|

|
#31
SE 2nd Ave
Gainesville, FL 32641
|
1,004 sq. feet
|
1 baths 2 beds |
show details | |

|
#32
SW 92nd St
Gainesville, FL 32608
|
1,505 sq. feet
|
2 baths 3 beds |
show details | |

|
#33
SW Atlantis Pl
Fort White, FL 32038
|
1,040 sq. feet
|
2 baths 3 beds |
show details | |

|
#34
SW 35th Way
Gainesville, FL 32608
|
4,077 sq. feet
|
4 baths 4 beds |
show details | |

|
#35
SE 50th St
Gainesville, FL 32641
|
1,206 sq. feet
|
1 baths 3 beds |
show details | |

|
#36
SW 169th Way
Archer, FL 32618
|
1,176 sq. feet
|
1 baths 3 beds |
show details | |

|
#37
SE 17th Ave
Gainesville, FL 32641
|
1,092 sq. feet
|
2 baths 3 beds |
show details | |

|
#38
SE County Road 232
Trenton, FL 32693
|
2,052 sq. feet
|
2 baths 4 beds |
show details | |

|
#39
SE 18th Ave
Gainesville, FL 32641
|
988 sq. feet
|
1 baths 3 beds |
show details | |

|
#40
SE 20th Ave
Gainesville, FL 32641
|
1,356 sq. feet
|
2 baths 3 beds |
show details |
| Photo | Address | Area | Beds / Baths | Price | Details |
|---|---|---|---|---|---|

|
#41
SE 14th Ter
Gainesville, FL 32641
|
1,690 sq. feet
|
2 baths 3 beds |
show details | |

|
#42
SE 64th St
Newberry, FL 32669
|
1,782 sq. feet
|
2 baths 3 beds |
show details | |

|
#43
SW 37th Way
Gainesville, FL 32608
|
4,867 sq. feet
|
4 baths 5 beds |
show details | |

|
#44
SE 11th Ave
Gainesville, FL 32641
|
1,020 sq. feet
|
1 baths 2 beds |
show details | |

|
#45
SW 46th Ln
Gainesville, FL 32608
|
3,055 sq. feet
|
3 baths 4 beds |
show details | |

|
#46
SW 91st Ave
Gainesville, FL 32608
|
1,152 sq. feet
|
2 baths 3 beds |
show details | |

|
#47
SE 9th Pl
Gainesville, FL 32641
|
1,486 sq. feet
|
1 baths 2 beds |
show details | |

|
#48
SW County Road 245
Lake Butler, FL 32054
|
1,988 sq. feet
|
2 baths 3 beds |
show details | |

|
#49
SW 46th Ave
Newberry, FL 32669
|
1,162 sq. feet
|
2 baths 3 beds |
show details | |

|
Check over 1 million property listings on Foreclosure.com!
|
browse all offers | |||


- 6,19057.7%White alone
- 2,55423.8%Black alone
- 1,37812.8%Hispanic
- 3102.9%Two or more races
- 1911.8%Asian alone
- 690.6%Other race alone
- 50.05%American Indian alone
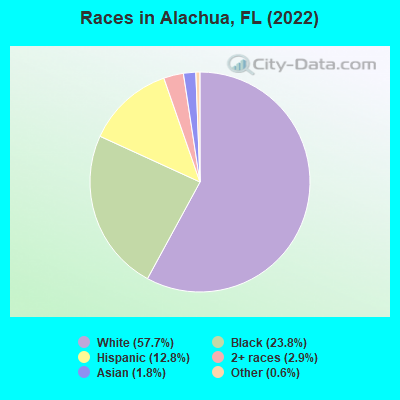
Races in Alachua detailed stats: ancestries, foreign born residents, place of birth
According to our research of Florida and other state lists, there were 45 registered sex offenders living in Alachua, Florida as of April 25, 2024.
The ratio of all residents to sex offenders in Alachua is 218 to 1.
Type |
2009 |
2010 |
2011 |
2012 |
2013 |
2014 |
2015 |
2016 |
2017 |
2018 |
2019 |
2020 |
|---|---|---|---|---|---|---|---|---|---|---|---|---|
| Murders (per 100,000) | 0 (0.0) | 0 (0.0) | 0 (0.0) | 0 (0.0) | 0 (0.0) | 0 (0.0) | 0 (0.0) | 0 (0.0) | 0 (0.0) | 2 (19.8) | 0 (0.0) | 0 (0.0) |
| Rapes (per 100,000) | 1 (10.3) | 3 (33.1) | 1 (10.9) | 3 (32.4) | 2 (21.4) | 5 (52.9) | 4 (41.3) | 6 (60.6) | 4 (39.9) | 1 (9.9) | 4 (39.7) | 2 (20.0) |
| Robberies (per 100,000) | 16 (165.5) | 12 (132.5) | 6 (65.3) | 4 (43.2) | 2 (21.4) | 7 (74.0) | 1 (10.3) | 4 (40.4) | 6 (59.8) | 6 (59.3) | 7 (69.5) | 3 (30.0) |
| Assaults (per 100,000) | 38 (393.0) | 27 (298.0) | 23 (250.5) | 33 (356.2) | 32 (342.7) | 21 (222.1) | 28 (289.0) | 32 (323.2) | 30 (298.9) | 45 (444.5) | 30 (297.9) | 35 (350.1) |
| Burglaries (per 100,000) | 89 (920.5) | 76 (838.9) | 59 (642.6) | 66 (712.4) | 40 (428.4) | 54 (571.1) | 51 (526.5) | 64 (646.5) | 45 (448.3) | 37 (365.5) | 32 (317.8) | 35 (350.1) |
| Thefts (per 100,000) | 244 (2,524) | 193 (2,130) | 218 (2,374) | 159 (1,716) | 120 (1,285) | 162 (1,713) | 204 (2,106) | 219 (2,212) | 211 (2,102) | 204 (2,015) | 191 (1,897) | 188 (1,880) |
| Auto thefts (per 100,000) | 13 (134.5) | 9 (99.3) | 15 (163.4) | 6 (64.8) | 6 (64.3) | 10 (105.8) | 6 (61.9) | 23 (232.3) | 10 (99.6) | 22 (217.3) | 7 (69.5) | 28 (280.1) |
| Arson (per 100,000) | 1 (10.3) | 0 (0.0) | 0 (0.0) | 0 (0.0) | 1 (10.7) | 0 (0.0) | 0 (0.0) | 1 (10.1) | 2 (19.9) | 2 (19.8) | 1 (9.9) | 0 (0.0) |
| City-Data.com crime index | 312.6 | 277.7 | 231.4 | 233.8 | 178.6 | 225.9 | 220.0 | 277.6 | 233.0 | 277.7 | 215.9 | 217.1 |
The City-Data.com crime index weighs serious crimes and violent crimes more heavily. Higher means more crime, U.S. average is 246.1. It adjusts for the number of visitors and daily workers commuting into cities.
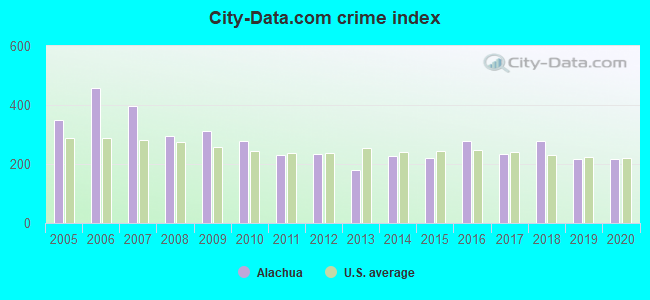
Crime rate in Alachua detailed stats: murders, rapes, robberies, assaults, burglaries, thefts, arson
Full-time law enforcement employees in 2021, including police officers: 35 (27 officers - 24 male; 3 female).
| Officers per 1,000 residents here: | 2.70 |
| Florida average: | 2.33 |
 Recent articles from our blog. Our writers, many of them Ph.D. graduates or candidates, create easy-to-read articles on a wide variety of topics.

 | Is Alachua or Gainesville safer? (4 replies) |
| Sarasota & Manatee Counties news thread (3759 replies) |
| Alachua city pet limit? (2 replies) |
| Coronavirus positives in Bradenton and Hillsborough Counties (2490 replies) |
| DeSantis vaccine priority as screwed up (413 replies) |
| Gainesville Area Rentals? (20 replies) |
Latest news from Alachua, FL collected exclusively by city-data.com from local newspapers, TV, and radio stations
Ancestries: English (11.3%), American (9.0%), European (8.0%), German (6.5%), Irish (5.9%), Jamaican (4.9%).
Current Local Time: EST time zone
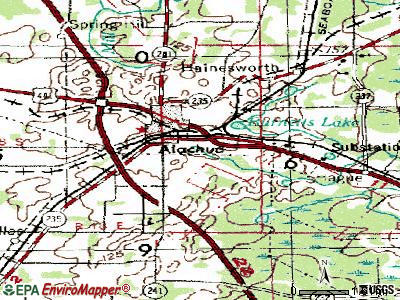
Elevation: 85 feet
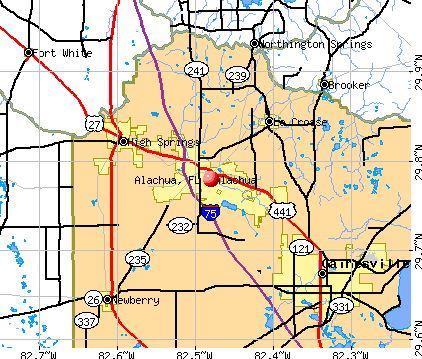
Land area: 28.9 square miles.
Population density: 373 people per square mile (very low).
568 residents are foreign born (1.8% Latin America, 1.4% Asia, 1.0% North America, 1.0% Europe).
| This city: | 5.3% |
| Florida: | 21.1% |
Median real estate property taxes paid for housing units with mortgages in 2022: $2,736 (1.0%)
Median real estate property taxes paid for housing units with no mortgage in 2022: $2,958 (0.8%)
Nearest city with pop. 50,000+: Gainesville, FL  (11.7 miles , pop. 95,447).
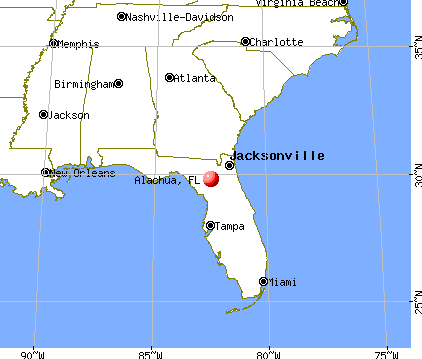
Nearest city with pop. 200,000+: Jacksonville, FL (61.7 miles , pop. 735,617).
Nearest city with pop. 1,000,000+: Houston, TX (774.3 miles , pop. 1,953,631).
Nearest cities:
), ), ), Latitude: 29.78 N, Longitude: 82.48 W
Daytime population change due to commuting: +2,714 (+25.3%)
Workers who live and work in this city: 1,521 (31.9%)
Area code: 386
Alachua, Florida accommodation & food services, waste management - Economy and Business Data
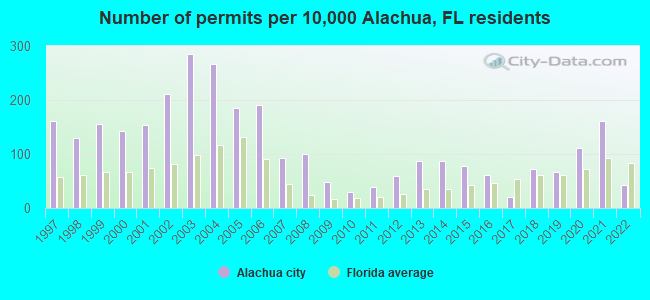
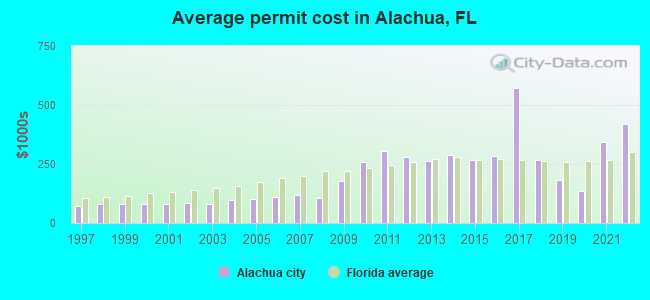
Single-family new house construction building permits:
- 2022: 26 buildings, average cost: $418,100
- 2021: 98 buildings, average cost: $342,300
- 2020: 68 buildings, average cost: $134,800
- 2019: 40 buildings, average cost: $183,600
- 2018: 44 buildings, average cost: $265,900
- 2017: 13 buildings, average cost: $570,100
- 2016: 38 buildings, average cost: $284,900
- 2015: 47 buildings, average cost: $268,500
- 2014: 53 buildings, average cost: $290,100
- 2013: 53 buildings, average cost: $264,100
- 2012: 36 buildings, average cost: $281,400
- 2011: 23 buildings, average cost: $303,900
- 2010: 18 buildings, average cost: $259,500
- 2009: 30 buildings, average cost: $179,800
- 2008: 61 buildings, average cost: $106,900
- 2007: 57 buildings, average cost: $119,400
- 2006: 116 buildings, average cost: $111,100
- 2005: 113 buildings, average cost: $99,500
- 2004: 162 buildings, average cost: $97,200
- 2003: 174 buildings, average cost: $79,200
- 2002: 129 buildings, average cost: $84,100
- 2001: 93 buildings, average cost: $79,300
- 2000: 87 buildings, average cost: $79,300
- 1999: 95 buildings, average cost: $79,400
- 1998: 79 buildings, average cost: $78,700
- 1997: 98 buildings, average cost: $69,800
| Here: | 3.1% |
| Florida: | 2.9% |
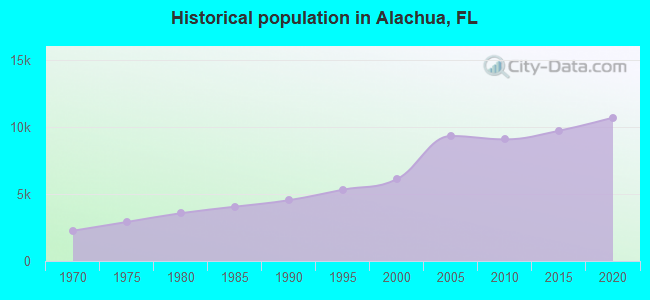
Population change in the 1990s: +1,885 (+44.7%).
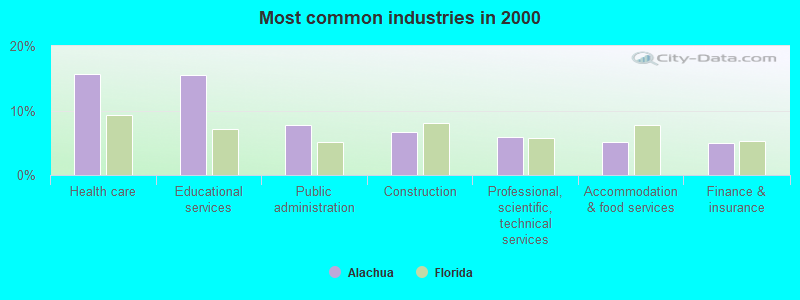
- Health care (15.7%)
- Educational services (15.4%)
- Public administration (7.7%)
- Construction (6.6%)
- Professional, scientific, technical services (5.8%)
- Accommodation & food services (5.1%)
- Finance & insurance (4.9%)
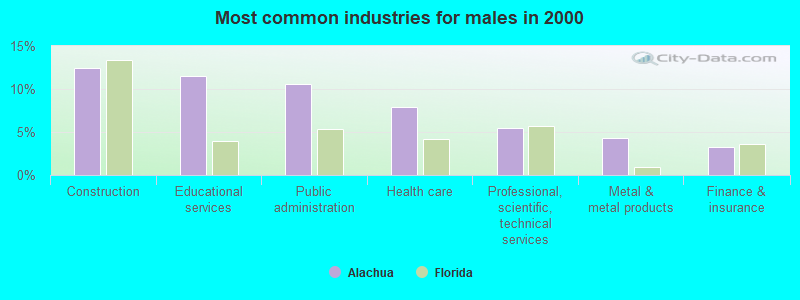
- Construction (12.5%)
- Educational services (11.5%)
- Public administration (10.6%)
- Health care (7.9%)
- Professional, scientific, technical services (5.5%)
- Metal & metal products (4.3%)
- Finance & insurance (3.3%)
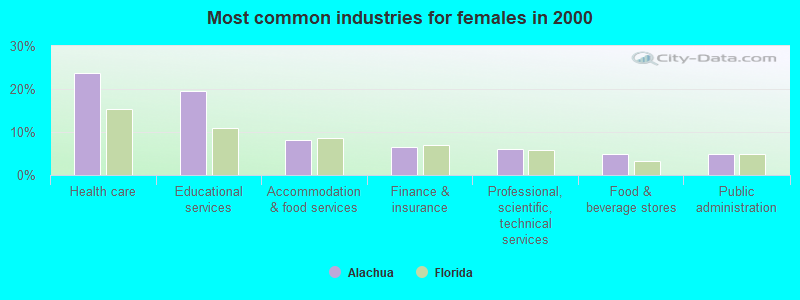
- Health care (23.7%)
- Educational services (19.4%)
- Accommodation & food services (8.2%)
- Finance & insurance (6.6%)
- Professional, scientific, technical services (6.1%)
- Food & beverage stores (4.9%)
- Public administration (4.9%)
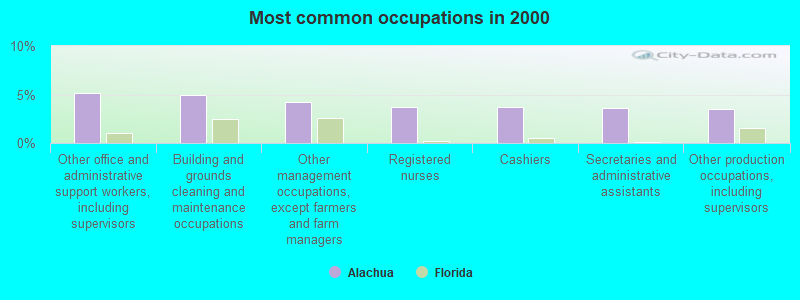
- Other office and administrative support workers, including supervisors (5.1%)
- Building and grounds cleaning and maintenance occupations (4.9%)
- Other management occupations, except farmers and farm managers (4.2%)
- Registered nurses (3.7%)
- Cashiers (3.7%)
- Secretaries and administrative assistants (3.6%)
- Other production occupations, including supervisors (3.6%)
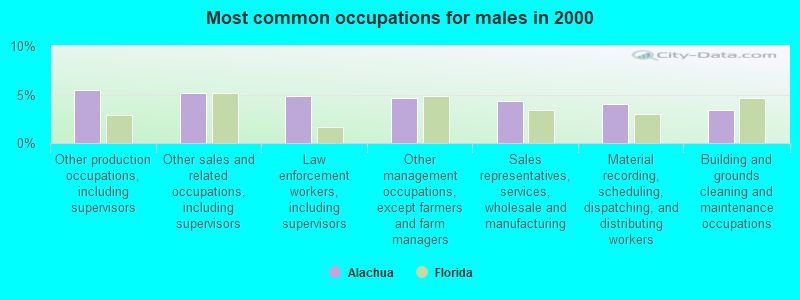
- Other production occupations, including supervisors (5.4%)
- Other sales and related occupations, including supervisors (5.1%)
- Law enforcement workers, including supervisors (4.8%)
- Other management occupations, except farmers and farm managers (4.6%)
- Sales representatives, services, wholesale and manufacturing (4.3%)
- Material recording, scheduling, dispatching, and distributing workers (4.0%)
- Building and grounds cleaning and maintenance occupations (3.4%)

- Other office and administrative support workers, including supervisors (8.8%)
- Secretaries and administrative assistants (7.2%)
- Cashiers (6.8%)
- Building and grounds cleaning and maintenance occupations (6.5%)
- Registered nurses (6.2%)
- Preschool, kindergarten, elementary, and middle school teachers (5.0%)
- Other management occupations, except farmers and farm managers (3.7%)
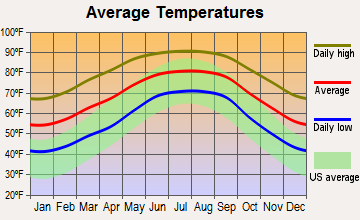
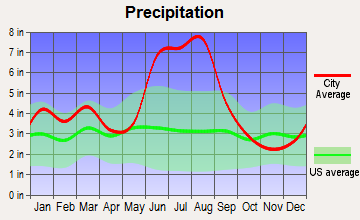
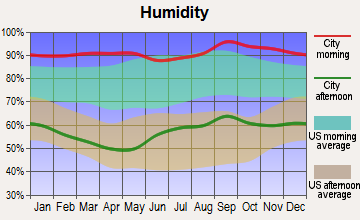
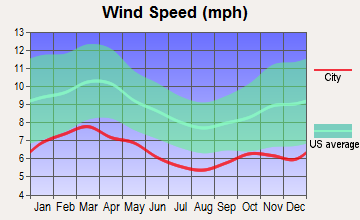
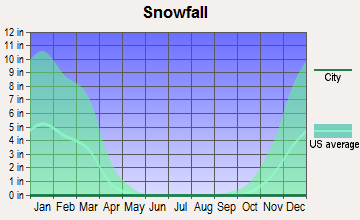
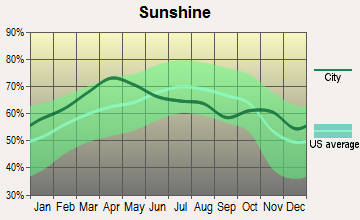
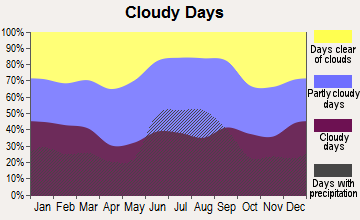
Average climate in Alachua, Florida
Based on data reported by over 4,000 weather stations
|
|

(lower is better)
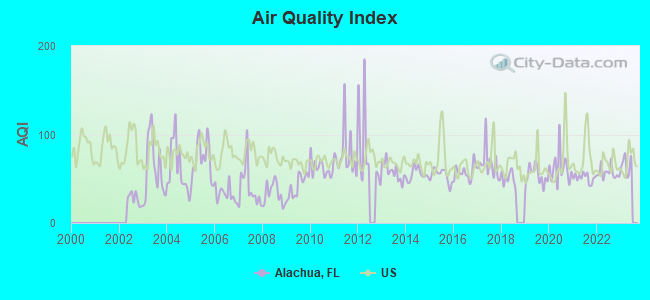
Air Quality Index (AQI) level in 2022 was 56.7. This is better than average.
| City: | 56.7 |
| U.S.: | 72.6 |
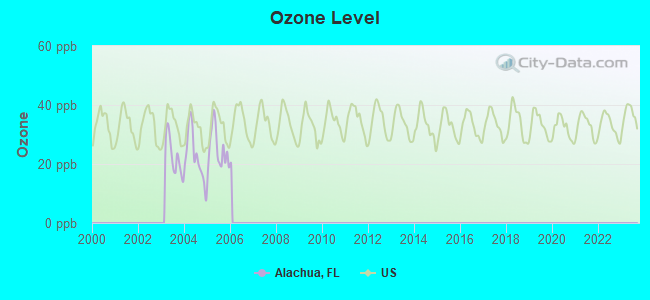
Ozone [ppb] level in 2005 was 25.1. This is better than average. Closest monitor was 6.6 miles away from the city center.
| City: | 25.1 |
| U.S.: | 33.3 |
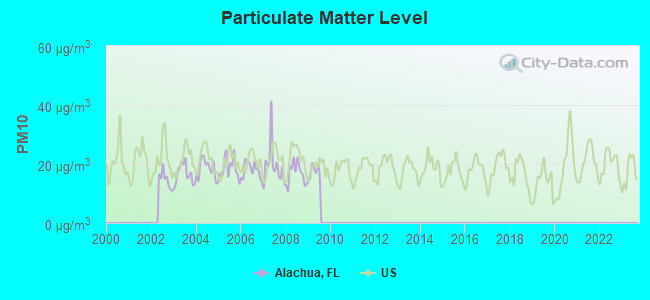
Particulate Matter (PM10) [µg/m3] level in 2009 was 17.5. This is about average. Closest monitor was 7.5 miles away from the city center.
| City: | 17.5 |
| U.S.: | 19.2 |
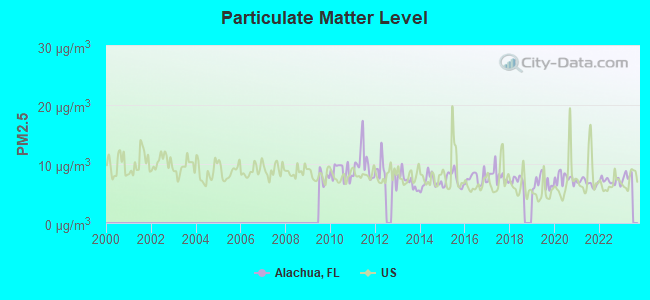
Particulate Matter (PM2.5) [µg/m3] level in 2022 was 7.12. This is about average. Closest monitor was 7.5 miles away from the city center.
| City: | 7.12 |
| U.S.: | 8.11 |
Tornado activity:
Alachua-area historical tornado activity is slightly below Florida state average. It is 10% smaller than the overall U.S. average.
On 2/25/1960, a category F3 (max. wind speeds 158-206 mph) tornado 30.5 miles away from the Alachua city center caused between $50,000 and $500,000 in damages.
On 4/19/1978, a category F2 (max. wind speeds 113-157 mph) tornado 6.8 miles away from the city center injured 6 people and caused between $50,000 and $500,000 in damages.
Earthquake activity:
Alachua-area historical earthquake activity is significantly above Florida state average. It is 82% smaller than the overall U.S. average.On 9/10/2006 at 14:56:08, a magnitude 5.9 (5.9 MB, 5.5 MS, 5.8 MW, Class: Moderate, Intensity: VI - VII) earthquake occurred 351.8 miles away from the city center
On 8/2/1974 at 08:52:09, a magnitude 4.9 (4.3 MB, 4.9 LG, Class: Light, Intensity: IV - V) earthquake occurred 283.1 miles away from Alachua center
On 11/22/1974 at 05:25:55, a magnitude 4.7 (4.7 MB) earthquake occurred 256.1 miles away from the city center
On 10/24/1997 at 08:35:17, a magnitude 4.9 (4.8 MB, 4.2 MS, 4.9 LG, Depth: 6.2 mi) earthquake occurred 300.4 miles away from the city center
On 8/21/1992 at 16:31:55, a magnitude 4.4 (4.1 MB, 4.1 LG, 4.4 LG, Depth: 6.2 mi) earthquake occurred 265.8 miles away from Alachua center
On 9/4/2016 at 18:29:29, a magnitude 3.8 (3.8 ML, Class: Light, Intensity: II - III) earthquake occurred 177.5 miles away from the city center
Magnitude types: regional Lg-wave magnitude (LG), body-wave magnitude (MB), local magnitude (ML), surface-wave magnitude (MS), moment magnitude (MW)
Natural disasters:
The number of natural disasters in Alachua County (16) is near the US average (15).Major Disasters (Presidential) Declared: 8
Emergencies Declared: 3
Causes of natural disasters: Hurricanes: 6, Fires: 5, Tropical Storms: 3, Tornadoes: 2, Flood: 1, Freeze: 1, Wind: 1, Other: 1 (Note: some incidents may be assigned to more than one category).
Main business address for: REGENERATION TECHNOLOGIES INC (ORTHOPEDIC, PROSTHETIC & SURGICAL APPLIANCES & SUPPLIES).
Hospitals and medical centers in Alachua:
Other hospitals and medical centers near Alachua:
- UPREACH PAVILION (Hospital, about 7 miles away; GAINESVILLE, FL)
- UNIVERSITY OF FLORIDA DIALYSIS (Dialysis Facility, about 8 miles away; GAINESVILLE, FL)
- MEDERI CARETENDERS (Home Health Center, about 8 miles away; GAINESVILLE, FL)
- HAVEN HOSPICE (Hospital, about 8 miles away; GAINESVILLE, FL)
- GAINESVILLE 39TH AVENUE CLUSTER (Hospital, about 8 miles away; GAINESVILLE, FL)
- GENTIVA HEALTH SERVICES (Home Health Center, about 9 miles away; GAINESVILLE, FL)
- BMA - GAINESVILLE (Dialysis Facility, about 10 miles away; GAINESVILLE, FL)
Airports located in Alachua:
- Link Field Airport (63FD) (Runways: 1)
- Santa Fe River Ranch Airport (FA62) (Runways: 1)
- Sullivan Field Airport (63FA) (Runways: 1)
Amtrak stations near Alachua:
- 13 miles: GAINESVILLE (116 INDUSTRIAL BLVD.) - Bus Station . Services: ticket office, enclosed waiting area.
- 19 miles: WALDO (U.S. 301 & STATE RD.) . Services: partially wheelchair accessible, enclosed waiting area, public restrooms, public payphones, free short-term parking, free long-term parking, call for taxi service.
Colleges/universities with over 2000 students nearest to Alachua:
- Santa Fe College (about 8 miles; Gainesville, FL; Full-time enrollment: 11,819)
- University of Florida (about 13 miles; Gainesville, FL; FT enrollment: 43,357)
- Florida Gateway College (about 28 miles; Lake City, FL; FT enrollment: 2,179)
- College of Central Florida (about 47 miles; Ocala, FL; FT enrollment: 6,103)
- Rasmussen College-Florida (about 48 miles; Ocala, FL; FT enrollment: 5,736)
- Saint Johns River State College (about 49 miles; Palatka, FL; FT enrollment: 4,698)
- Florida State College at Jacksonville (about 63 miles; Jacksonville, FL; FT enrollment: 21,810)
Public high school in Alachua:
Private high school in Alachua:
Public elementary/middle schools in Alachua:
- ALACHUA ELEMENTARY SCHOOL (Students: 245, Location: 13800 NW 152ND PL, Grades: PK-5)
- A. L. MEBANE MIDDLE SCHOOL (Location: 16401 NW 140TH ST, Grades: 6-8)
- W. W. IRBY ELEMENTARY SCHOOL (Location: 13505 NW 140TH ST, Grades: PK-2)
- ALACHUA LEARNING CENTER, INC. ELEMENTARY (Location: 11100 W SR 235, Grades: KG-5, Charter school)
- ALACHUA LEARNING CENTER , INC. MIDDLE (Location: 11100 W STATE ROAD 235, Grades: 6-8, Charter school)
Private elementary/middle school in Alachua:
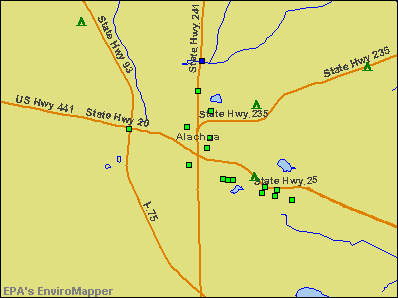
Points of interest:
Notable locations in Alachua: Turkey Creek Golf and Country Club (A), Alachua County Library - Alachua Branch (B), Alachua Police Department (C), Alachua County Fire Rescue Station 21 (D). Display/hide their locations on the map
Main business address in Alachua: REGENERATION TECHNOLOGIES INC (A). Display/hide its location on the map
Churches in Alachua include: New Saint Mary Missionary Baptist Church (A), Saint Matthew Baptist Church (B), Old Shiloh Missionary Baptist Church (C), Kingdom Hall of Jehovahs Witnesses (D), First United Methodist Church of Alachua (E), Faith Hope and Charity Deliverance Center (F), Crusaders for Christ Church (G), Church of God by Faith (H), Church of Christ at Alachua (I). Display/hide their locations on the map
Cemeteries: Old Thomas Cemetery (1), Cathcart Cemetery (2), Mount Nebo Cemetery (3). Display/hide their locations on the map
Lake: Burnetts Lake (A). Display/hide its location on the map
Creek: Turkey Creek (A). Display/hide its location on the map
Park in Alachua: City of Alachua Recreation and Community Center (1). Display/hide its location on the map
Hotels: Comfort Inn (15405 Martin Luther King Blvd) (1), Comfort Inn Alachua (15920 Northwest US Highway 441) (2). Display/hide their approximate locations on the map
Drinking water stations with addresses in Alachua and their reported violations in the past:
ALACHUA WTP (Population served: 7,764, Groundwater):Past health violations:THE LAKES APARTMENTS (Population served: 25, Groundwater):Past monitoring violations:
- MCL, Monthly (TCR) - In SEP-2011, Contaminant: Coliform. Follow-up actions: St Public Notif requested (NOV-03-2011), St Public Notif received (NOV-07-2011), St Compliance achieved (MAR-14-2012)
- One routine major monitoring violation
- One regular monitoring violation
Past monitoring violations:
- 3 routine major monitoring violations
- 3 minor monitoring violations
- 2 regular monitoring violations
Drinking water stations with addresses in Alachua that have no violations reported:
- TRAVELERS CAMPGROUND (Population served: 300, Primary Water Source Type: Groundwater)
| This city: | 2.5 people |
| Florida: | 2.5 people |
| This city: | 70.1% |
| Whole state: | 65.2% |
| This city: | 5.8% |
| Whole state: | 7.3% |
Likely homosexual households (counted as self-reported same-sex unmarried-partner households)
- Lesbian couples: 0.6% of all households
- Gay men: 0.3% of all households
6 people in homes for the mentally retarded in 2000
Banks with branches in Alachua (2011 data):
- Gateway Bank of Central Florida: Alachua Branch at 15652 Nw Highway 441, branch established on 2009/01/22. Info updated 2008/12/05: Bank assets: $184.1 mil, Deposits: $147.2 mil, headquarters in Ocala, FL, negative income in the last year, Commercial Lending Specialization, 4 total offices, Holding Company: Gateway Financial Holdings Of Florida, Inc.
- Alarion Bank: Alachua Branch at 16404 Nw 17th Drive, branch established on 2006/12/20. Info updated 2006/11/03: Bank assets: $284.0 mil, Deposits: $242.6 mil, headquarters in Ocala, FL, negative income in the last year, Commercial Lending Specialization, 6 total offices, Holding Company: Alarion Financial Services, Inc.
- PNC Bank, National Association: Alachue Towne Center Branch at 14480 Nw 152nd Lane, branch established on 2008/04/12. Info updated 2012/03/20: Bank assets: $263,309.6 mil, Deposits: $197,343.0 mil, headquarters in Wilmington, DE, positive income, Commercial Lending Specialization, 3085 total offices, Holding Company: Pnc Financial Services Group, Inc., The
- Capital City Bank: Alachua Branch at 15000 Northwest 140th Street, branch established on 2005/05/21. Info updated 2006/11/03: Bank assets: $2,617.3 mil, Deposits: $2,181.2 mil, headquarters in Tallahassee, FL, positive income, Commercial Lending Specialization, 74 total offices, Holding Company: Capital City Bank Group, Inc.
For population 15 years and over in Alachua:
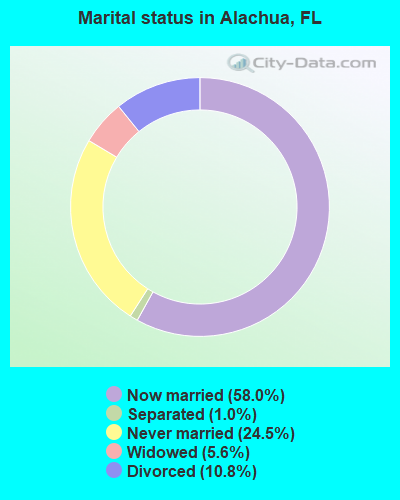
- Never married: 24.5%
- Now married: 58.0%
- Separated: 1.0%
- Widowed: 5.6%
- Divorced: 10.8%
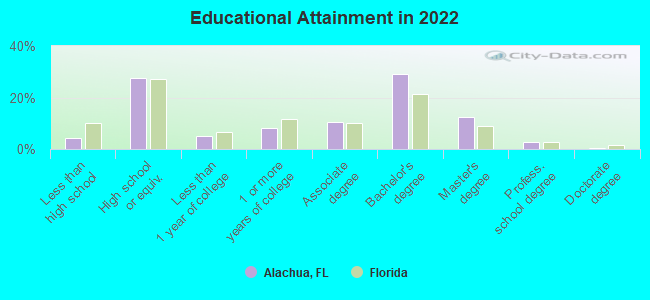
For population 25 years and over in Alachua:
- High school or higher: 95.5%
- Bachelor's degree or higher: 44.1%
- Graduate or professional degree: 14.4%
- Unemployed: 4.9%
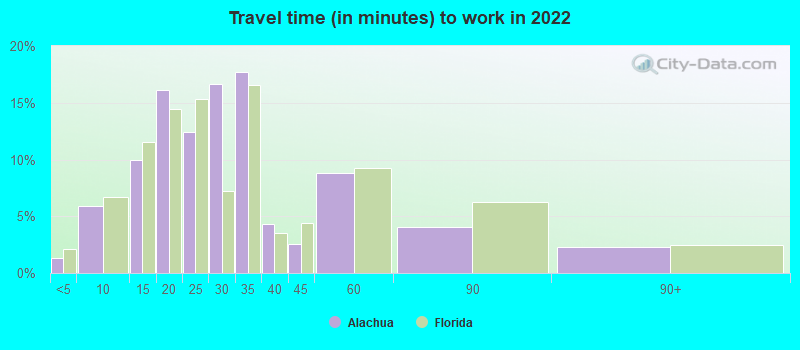
- Mean travel time to work (commute): 21.3 minutes
| Here: | 9.3 |
| Florida average: | 12.2 |

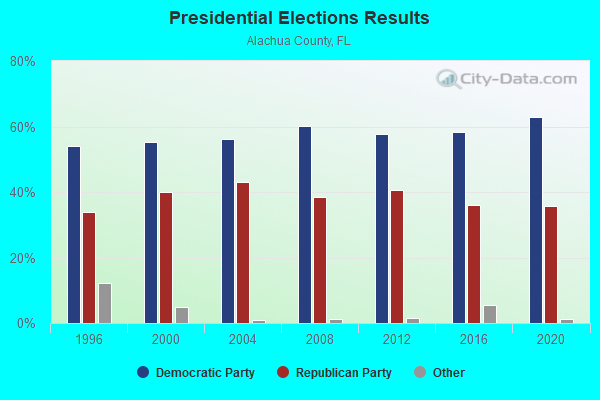
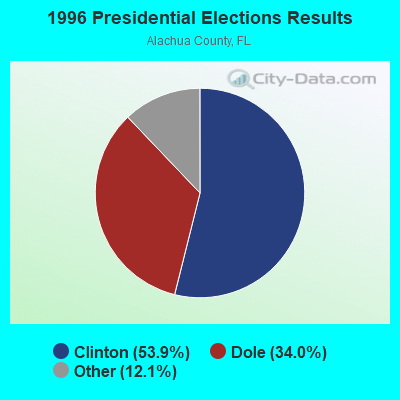
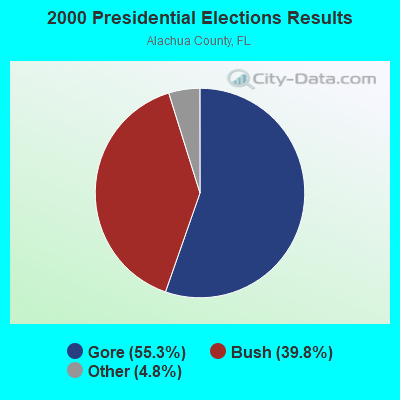
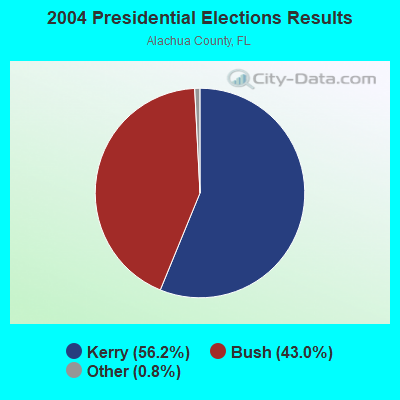
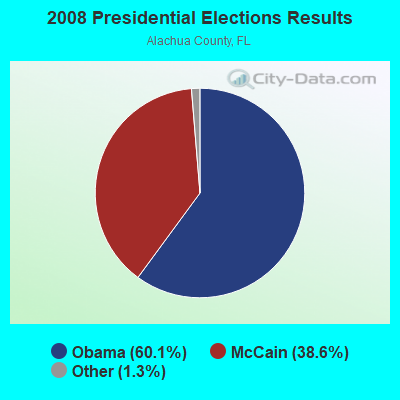
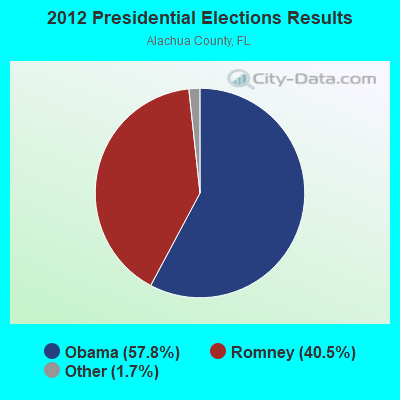
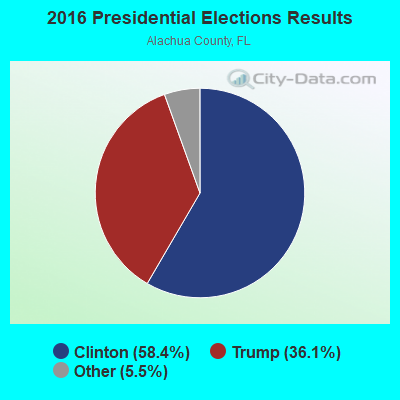
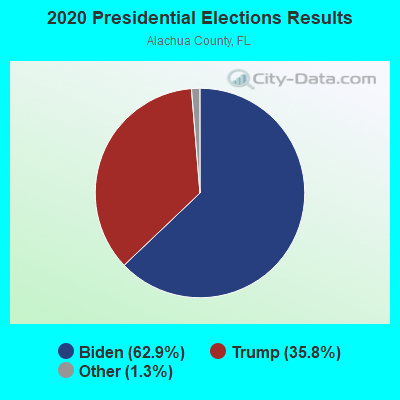
Graphs represent county-level data. Detailed 2008 Election Results
Religion statistics for Alachua, FL (based on Alachua County data)
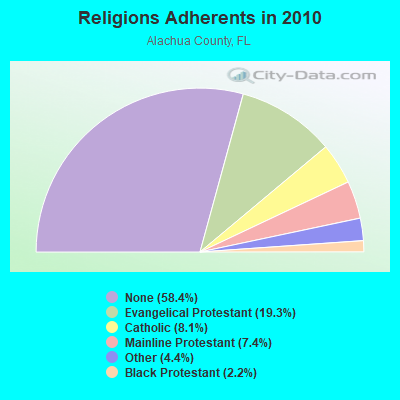
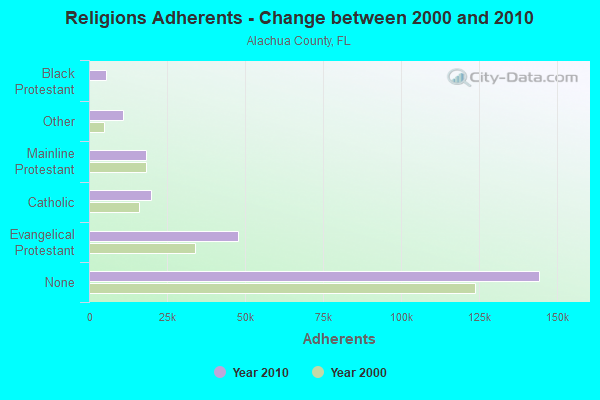
| Religion | Adherents | Congregations |
|---|---|---|
| Evangelical Protestant | 47,845 | 173 |
| Catholic | 20,004 | 6 |
| Mainline Protestant | 18,361 | 57 |
| Other | 10,974 | 34 |
| Black Protestant | 5,424 | 30 |
| Orthodox | 233 | 2 |
| None | 144,495 | - |
Food Environment Statistics:
| Alachua County: | 1.88 / 10,000 pop. |
| Florida: | 2.04 / 10,000 pop. |
| This county: | 0.04 / 10,000 pop. |
| State: | 0.11 / 10,000 pop. |
| Alachua County: | 1.25 / 10,000 pop. |
| Florida: | 1.28 / 10,000 pop. |
| Alachua County: | 4.80 / 10,000 pop. |
| State: | 3.04 / 10,000 pop. |
| Here: | 6.52 / 10,000 pop. |
| State: | 7.45 / 10,000 pop. |
| This county: | 7.9% |
| Florida: | 9.2% |
| Alachua County: | 24.6% |
| Florida: | 23.7% |
| This county: | 10.8% |
| State: | 14.0% |
Health and Nutrition:
| Alachua: | 52.6% |
| Florida: | 51.4% |
| This city: | 51.0% |
| Florida: | 49.4% |
| Here: | 28.5 |
| Florida: | 28.6 |
| Alachua: | 19.3% |
| State: | 19.5% |
| Alachua: | 9.8% |
| State: | 10.7% |
| Here: | 6.8 |
| State: | 6.9 |
| Alachua: | 35.0% |
| Florida: | 34.7% |
| This city: | 58.4% |
| State: | 57.0% |
| This city: | 80.8% |
| Florida: | 79.2% |
More about Health and Nutrition of Alachua, FL Residents
| Local government employment and payroll (March 2022) | |||||
| Function | Full-time employees | Monthly full-time payroll | Average yearly full-time wage | Part-time employees | Monthly part-time payroll |
|---|---|---|---|---|---|
| Police Protection - Officers | 26 | $138,175 | $63,773 | 1 | $1,662 |
| Other Government Administration | 22 | $99,513 | $54,280 | 1 | $1,133 |
| Other and Unallocable | 19 | $85,903 | $54,255 | 1 | $5,561 |
| Financial Administration | 15 | $64,959 | $51,967 | 0 | $0 |
| Parks and Recreation | 14 | $42,009 | $36,008 | 0 | $0 |
| Electric Power | 10 | $79,661 | $95,593 | 0 | $0 |
| Streets and Highways | 7 | $22,007 | $37,726 | 0 | $0 |
| Police - Other | 7 | $23,446 | $40,193 | 0 | $0 |
| Water Supply | 6 | $28,909 | $57,818 | 0 | $0 |
| Sewerage | 5 | $30,429 | $73,030 | 0 | $0 |
| Totals for Government | 131 | $615,011 | $56,337 | 3 | $8,357 |
Alachua government finances - Expenditure in 2018 (per resident):
- Construction - Regular Highways: $613,000 ($56.90)
- Current Operations - Electric Utilities: $10,694,000 ($992.67)
Police Protection: $2,703,000 ($250.91)
Sewerage: $2,452,000 ($227.61)
Financial Administration: $2,128,000 ($197.53)
Central Staff Services: $1,440,000 ($133.67)
Water Utilities: $1,348,000 ($125.13)
General - Other: $1,301,000 ($120.76)
Solid Waste Management: $708,000 ($65.72)
Parks and Recreation: $593,000 ($55.05)
Regular Highways: $563,000 ($52.26)
Judicial and Legal Services: $213,000 ($19.77)
Protective Inspection and Regulation - Other: $185,000 ($17.17)
Natural Resources - Other: $42,000 ($3.90)
- Electric Utilities - Interest on Debt: $80,000 ($7.43)
- General - Interest on Debt: $725,000 ($67.30)
- Intergovernmental to Local - Other - Local Fire Protection: $668,000 ($62.01)
- Other Capital Outlay - Parks and Recreation: $6,298,000 ($584.61)
Natural Resources - Other: $220,000 ($20.42)
General - Other: $143,000 ($13.27)
Police Protection: $123,000 ($11.42)
Financial Administration: $7,000 ($0.65)
Protective Inspection and Regulation - Other: $2,000 ($0.19)
Central Staff Services: $1,000 ($0.09)
- Water Utilities - Interest on Debt: $11,000 ($1.02)
Alachua government finances - Revenue in 2018 (per resident):
- Charges - Sewerage: $2,270,000 ($210.71)
Solid Waste Management: $806,000 ($74.82)
Other: $148,000 ($13.74)
Natural Resources - Other: $59,000 ($5.48)
Parks and Recreation: $35,000 ($3.25)
- Federal Intergovernmental - Other: $385,000 ($35.74)
- Local Intergovernmental - General Local Government Support: $276,000 ($25.62)
- Miscellaneous - General Revenue - Other: $74,000 ($6.87)
Rents: $74,000 ($6.87)
Fines and Forfeits: $62,000 ($5.76)
Interest Earnings: $56,000 ($5.20)
Donations From Private Sources: $46,000 ($4.27)
Sale of Property: $13,000 ($1.21)
Special Assessments: $7,000 ($0.65)
- Revenue - Electric Utilities: $13,736,000 ($1275.04)
Water Utilities: $1,582,000 ($146.85)
- State Intergovernmental - General Local Government Support: $891,000 ($82.71)
Highways: $42,000 ($3.90)
- Tax - Property: $4,171,000 ($387.17)
Public Utilities Sales: $1,736,000 ($161.14)
Occupation and Business License - Other: $358,000 ($33.23)
Other Selective Sales: $250,000 ($23.21)
Other License: $175,000 ($16.24)
Alachua government finances - Debt in 2018 (per resident):
- Long Term Debt - Beginning Outstanding - Unspecified Public Purpose: $28,604,000 ($2655.16)
Outstanding Unspecified Public Purpose: $26,973,000 ($2503.76)
Retired Unspecified Public Purpose: $1,305,000 ($121.14)
Alachua government finances - Cash and Securities in 2018 (per resident):
- Other Funds - Cash and Securities: $20,300,000 ($1884.34)
- Sinking Funds - Cash and Securities: $655,000 ($60.80)
8.73% of this county's 2021 resident taxpayers lived in other counties in 2020 ($59,189 average adjusted gross income)
| Here: | 8.73% |
| Florida average: | 8.80% |
0.02% of residents moved from foreign countries ($124 average AGI)
Alachua County: 0.02% Florida average: 0.05%
Top counties from which taxpayers relocated into this county between 2020 and 2021:
| from Marion County, FL | |
| from Miami-Dade County, FL | |
| from Duval County, FL |
9.50% of this county's 2020 resident taxpayers moved to other counties in 2021 ($57,151 average adjusted gross income)
| Here: | 9.50% |
| Florida average: | 7.45% |
0.03% of residents moved to foreign countries ($137 average AGI)
Alachua County: 0.03% Florida average: 0.04%
Top counties to which taxpayers relocated from this county between 2020 and 2021:
| to Marion County, FL | |
| to Duval County, FL | |
| to Hillsborough County, FL |
| Businesses in Alachua, FL | ||||
| Name | Count | Name | Count | |
|---|---|---|---|---|
| AT&T | 1 | McDonald's | 1 | |
| Ace Hardware | 1 | Pizza Hut | 1 | |
| Advance Auto Parts | 1 | Quality | 1 | |
| CVS | 1 | RadioShack | 1 | |
| Domino's Pizza | 1 | Sprint Nextel | 1 | |
| Econo Lodge | 1 | Subway | 2 | |
| FedEx | 4 | Taco Bell | 1 | |
| Ford | 1 | U-Haul | 1 | |
| H&R Block | 1 | UPS | 2 | |
| KFC | 1 | Waffle House | 1 | |
| Lowe's | 1 | Walgreens | 1 | |
Strongest AM radio stations in Alachua:
- WRUF (850 AM; 5 kW; GAINESVILLE, FL; Owner: UNIVERSITY OF FLORIDA)
- WFVR (910 AM; 50 kW; VALDOSTA, GA; Owner: RAMA COMMUNICATIONS, INC.)
- WOKV (690 AM; 50 kW; JACKSONVILLE, FL; Owner: COX RADIO, INC.)
- WTMN (1430 AM; daytime; 10 kW; GAINESVILLE, FL; Owner: 6 JOHNSON ROAD LICENSES, INC.)
- WLUS (980 AM; 5 kW; GAINESVILLE, FL; Owner: 6 JOHNSON ROAD LICENSES, INC.)
- WAJD (1390 AM; 5 kW; GAINESVILLE, FL)
- WGGG (1230 AM; 1 kW; GAINESVILLE, FL; Owner: FLORIDA SPORTSTALK, INC.)
- WGSR (1570 AM; 50 kW; FERNANDINA BEACH, FL; Owner: RJM COMMUNICATIONS, INC)
- WOBS (1530 AM; daytime; 50 kW; JACKSONVILLE, FL; Owner: WORD BROADCASTING NETWORK, INC.)
- WFLF (540 AM; 50 kW; PINE HILLS, FL; Owner: CLEAR CHANNEL BROADCASTING LICENSES, INC.)
- WQTM (740 AM; 50 kW; ORLANDO, FL; Owner: CLEAR CHANNEL BROADCASTING LICENSES, INC.)
- WDYZ (990 AM; 50 kW; ORLANDO, FL; Owner: ABC, INC.)
- WCFI (1290 AM; 10 kW; OCALA, FL; Owner: VECTOR COMMUNICATIONS, INC.)
Strongest FM radio stations in Alachua:
- WUFT-FM (89.1 FM; GAINESVILLE, FL; Owner: BOARD OF TRUSTEES, UNIVERSITY OF FLORIDA)
- WYGC (104.9 FM; HIGH SPRINGS, FL; Owner: ASTERISK COMMUNICATIONS, INC.)
- WNDT (92.5 FM; ALACHUA, FL; Owner: OCALA BROADCASTING CORPORATION, L.L.)
- WHHZ (100.5 FM; NEWBERRY, FL; Owner: 6 JOHNSON ROAD LICENSES, INC.)
- WRUF-FM (103.7 FM; GAINESVILLE, FL; Owner: THE UNIVERSITY OF FLORIDA)
- WJLF (91.7 FM; GAINESVILLE, FL; Owner: FIRST ASSEMBLY OF GOD)
- WBXY (99.5 FM; LA CROSSE, FL; Owner: ASTERISK COMMUNICATIONS, INC.)
- WYKS (105.3 FM; GAINESVILLE, FL; Owner: GILLEN BROADCASTING CORPORATION)
- WSKY-FM (97.3 FM; MICANOPY, FL; Owner: ENTERCOM GAINESVILLE LICENSE, LLC)
- WYFB (90.5 FM; GAINESVILLE, FL; Owner: BIBLE BROADCASTING NETWORK, INC.)
- W204BL (88.7 FM; GAINESVILLE, FL; Owner: EDUCATIONAL MEDIA FOUNDATION)
- WKTK (98.5 FM; CRYSTAL RIVER, FL; Owner: ENTERCOM GAINESVILLE LICENSE, LLC)
- WOGK (93.7 FM; OCALA, FL; Owner: OCALA BROADCASTING, L.L.C.)
- WXJZ (100.9 FM; GAINESVILLE, FL; Owner: ASTERISK COMMUNICATIONS, INC)
- WEAG-FM (106.3 FM; STARKE, FL; Owner: DICKERSON BROADCASTING, INC.)
- WDJY (101.7 FM; TRENTON, FL; Owner: 6 JOHNSON ROAD LICENSES, INC.)
- WNFB (94.3 FM; LAKE CITY, FL; Owner: NEWMAN MEDIA, INC.)
- WTMG (101.3 FM; WILLISTON, FL; Owner: 6 JOHNSON ROAD LICENSES, INC.)
- WQLC (102.1 FM; WATERTOWN, FL; Owner: LOUIS D. BOLTON, II)
TV broadcast stations around Alachua:
- WUFT (Channel 5; GAINESVILLE, FL; Owner: BOARD OF TRUSTEES, UNIVERSITY OF FLORIDA)
- WLUF-LP (Channel 10; GAINESVILLE, FL; Owner: BOARD OF TRUSTEES, UNIVERSITY OF FLORIDA)
- WGFL (Channel 53; HIGH SPRINGS, FL; Owner: BUDD BROADCASTING COMPANY, INC.)
- WFXU (Channel 57; LIVE OAK, FL; Owner: WFXU LICENSE CORPORATION)
- WCJB-TV (Channel 20; GAINESVILLE, FL; Owner: DIVERSIFIED BROADCASTING, INC.)
- WBXG-CA (Channel 31; GAINESVILLE, FL; Owner: THE BOX WORLDWIDE LLC)
- WYPN-CA (Channel 45; GAINESVILLE, FL; Owner: BUDD BROADCASTING COMPANY, INC.)
- WOGX (Channel 51; OCALA, FL; Owner: FOX TELEVISION STATIONS, INC.)
- W69AY (Channel 69; ALACHUA, ETC., FL; Owner: ASSOCIATED CHRISTIAN TV SYSTEM, INC.)
- National Bridge Inventory (NBI) Statistics
- 32Number of bridges
- 1,430ft / 436mTotal length
- $18,000,000Total costs
- 675,343Total average daily traffic
- 187,149Total average daily truck traffic
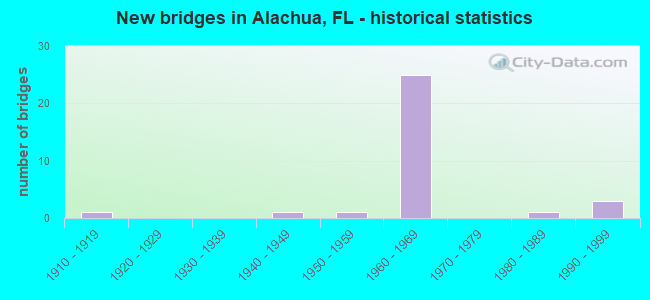
- New bridges - historical statistics
- 11910-1919
- 11940-1949
- 11950-1959
- 251960-1969
- 11980-1989
- 31990-1999
FCC Registered Antenna Towers: 200 (See the full list of FCC Registered Antenna Towers)
FCC Registered Commercial Land Mobile Towers: 1 (See the full list of FCC Registered Commercial Land Mobile Towers in Alachua, FL)
FCC Registered Broadcast Land Mobile Towers: 21 (See the full list of FCC Registered Broadcast Land Mobile Towers)
FCC Registered Microwave Towers: 15 (See the full list of FCC Registered Microwave Towers in this town)
FCC Registered Amateur Radio Licenses: 98 (See the full list of FCC Registered Amateur Radio Licenses in Alachua)
FAA Registered Aircraft: 22 (See the full list of FAA Registered Aircraft in Alachua)
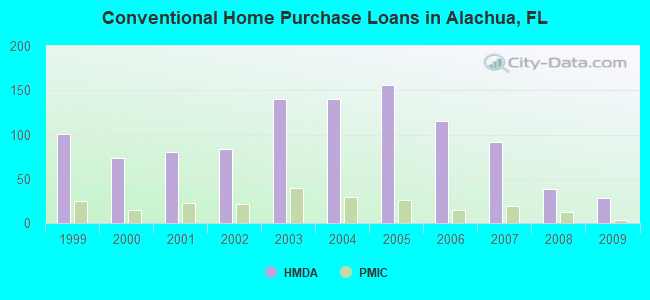
| Home Mortgage Disclosure Act Aggregated Statistics For Year 2009 (Based on 12 partial tracts) | ||||||||||||
| A) FHA, FSA/RHS & VA Home Purchase Loans | B) Conventional Home Purchase Loans | C) Refinancings | D) Home Improvement Loans | F) Non-occupant Loans on < 5 Family Dwellings (A B C & D) | G) Loans On Manufactured Home Dwelling (A B C & D) | |||||||
|---|---|---|---|---|---|---|---|---|---|---|---|---|
| Number | Average Value | Number | Average Value | Number | Average Value | Number | Average Value | Number | Average Value | Number | Average Value | |
| LOANS ORIGINATED | 30 | $162,398 | 28 | $216,494 | 96 | $186,929 | 4 | $173,930 | 5 | $166,774 | 5 | $88,110 |
| APPLICATIONS APPROVED, NOT ACCEPTED | 1 | $268,940 | 2 | $213,995 | 8 | $177,281 | 0 | $0 | 0 | $0 | 1 | $100,970 |
| APPLICATIONS DENIED | 3 | $191,233 | 4 | $226,610 | 33 | $209,518 | 2 | $36,970 | 2 | $136,255 | 3 | $111,657 |
| APPLICATIONS WITHDRAWN | 3 | $133,277 | 5 | $210,844 | 31 | $200,151 | 1 | $266,550 | 2 | $196,345 | 1 | $133,120 |
| FILES CLOSED FOR INCOMPLETENESS | 1 | $132,800 | 2 | $165,675 | 11 | $231,606 | 2 | $118,650 | 0 | $0 | 0 | $0 |
Detailed HMDA statistics for the following Tracts: 0018.01 , 0018.02, 0018.04, 0018.05, 0018.06
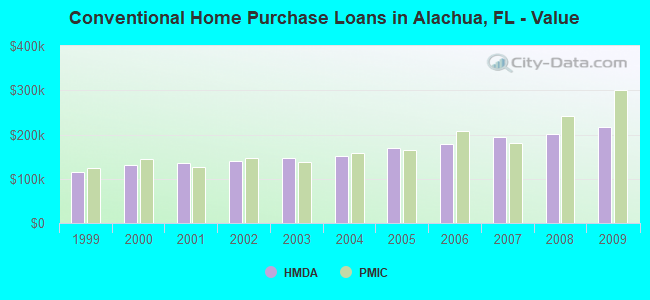
| Private Mortgage Insurance Companies Aggregated Statistics For Year 2009 (Based on 12 partial tracts) | ||||
| A) Conventional Home Purchase Loans | B) Refinancings | |||
|---|---|---|---|---|
| Number | Average Value | Number | Average Value | |
| LOANS ORIGINATED | 3 | $300,810 | 1 | $135,390 |
| APPLICATIONS APPROVED, NOT ACCEPTED | 2 | $184,210 | 0 | $0 |
| APPLICATIONS DENIED | 0 | $0 | 0 | $0 |
| APPLICATIONS WITHDRAWN | 0 | $0 | 0 | $0 |
| FILES CLOSED FOR INCOMPLETENESS | 1 | $90,260 | 0 | $0 |
Detailed PMIC statistics for the following Tracts: 0018.01 , 0018.02, 0018.04, 0018.05, 0018.06
2003 - 2018 National Fire Incident Reporting System (NFIRS) incidents
- Fire incident types reported to NFIRS in Alachua, FL
- 49352.3%Outside Fires
- 23625.1%Structure Fires
- 18719.9%Mobile Property/Vehicle Fires
- 262.8%Other
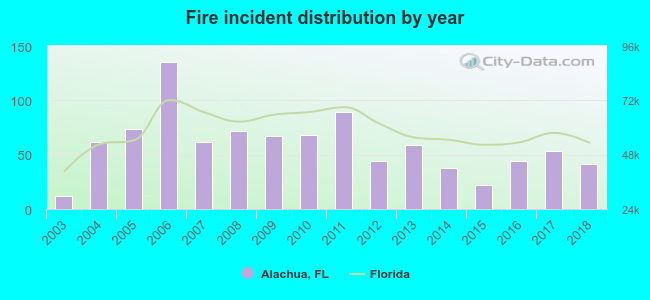 Based on the data from the years 2003 - 2018 the average number of fire incidents per year is 59. The highest number of fire incidents - 135 took place in 2006, and the least - 12 in 2003. The data has a rising trend.
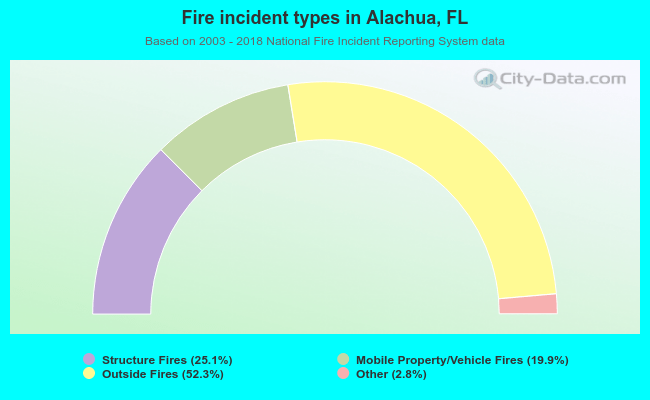 When looking into fire subcategories, the most incidents belonged to: Outside Fires (52.3%), and Structure Fires (25.1%).
Fire-safe hotels and motels in Alachua, Florida:
- Quality Inn Of Alachua, 15960 NW Us Hwy 441, Alachua, Florida 32615 , Phone: (386) 462-2244, Fax: (386) 462-2012
- Holiday Inn Express & Suites Alachua, 16367 NW 167th Blvd, Alachua, Florida 32615 , Phone: (386) 518-6777, Fax: (384) 518-6778
| Most common first names in Alachua, FL among deceased individuals | ||
| Name | Count | Lived (average) |
|---|---|---|
| James | 57 | 73.7 years |
| John | 55 | 72.1 years |
| William | 40 | 74.0 years |
| Mary | 36 | 77.1 years |
| Willie | 31 | 68.5 years |
| George | 30 | 74.0 years |
| Charles | 27 | 76.9 years |
| Robert | 27 | 68.9 years |
| Henry | 17 | 73.3 years |
| Dorothy | 17 | 76.2 years |
| Most common last names in Alachua, FL among deceased individuals | ||
| Last name | Count | Lived (average) |
|---|---|---|
| Williams | 51 | 67.3 years |
| Smith | 35 | 74.5 years |
| Jones | 22 | 67.1 years |
| Davis | 21 | 78.6 years |
| Lee | 18 | 73.4 years |
| Dixon | 17 | 74.8 years |
| Robinson | 16 | 73.7 years |
| Brown | 16 | 74.5 years |
| Johnson | 16 | 76.6 years |
| White | 16 | 74.1 years |
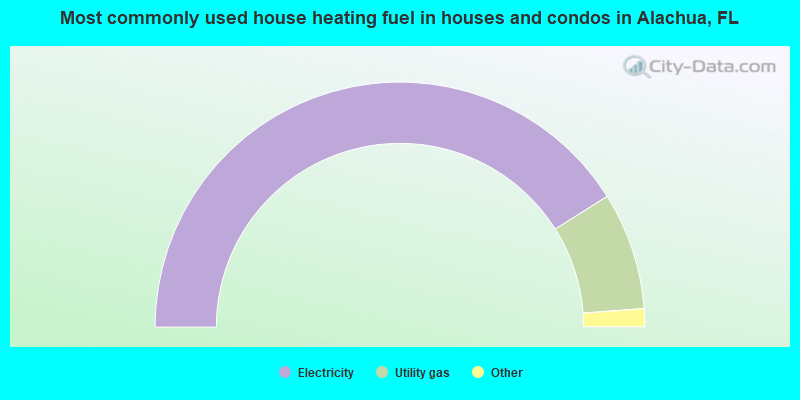
- 82.1%Electricity
- 15.5%Utility gas
- 1.3%Other fuel
- 0.8%Bottled, tank, or LP gas
- 0.3%No fuel used

- 87.0%Electricity
- 5.4%Utility gas
- 4.0%Bottled, tank, or LP gas
- 3.7%No fuel used
Alachua compared to Florida state average:
- Unemployed percentage significantly below state average.
- Black race population percentage above state average.
- Foreign-born population percentage below state average.
- Length of stay since moving in significantly above state average.
- Percentage of population with a bachelor's degree or higher above state average.
Alachua on our top lists:
- #33 on the list of "Top 101 cities with the most residents born in Europe, n.e.c. (population 500+)"
- #50 on the list of "Top 101 cities with largest percentage of females in industries: health care and social assistance (population 5,000+)"
- #60 on the list of "Top 101 cities with largest percentage of females in occupations: architecture and engineering occupations (population 5,000+)"
- #79 on the list of "Top 101 cities with largest percentage of males in occupations: health diagnosing and treating practitioners and other technical occupations (population 5,000+)"
- #40 on the list of "Top 101 counties with the largest increase in the number of births per 1000 residents 2000-2006 to 2007-2013 (pop 50,000+)"
- #41 on the list of "Top 101 counties with the lowest Ozone (1-hour) air pollution readings in 2012 (ppm)"
- #51 on the list of "Top 101 counties with the highest percentage of residents relocating to other counties in 2011 (pop. 50,000+)"
- #90 on the list of "Top 101 counties with the highest ground withdrawal of fresh water for public supply"
- #96 on the list of "Top 101 counties with the lowest Particulate Matter (PM2.5) Annual air pollution readings in 2012 (µg/m3)"

|
|
Total of 135 patent applications in 2008-2024.