Bainbridge Island, Washington Submit your own pictures of this city and show them to the world
OSM Map
General Map
Google Map
MSN Map
OSM Map
General Map
Google Map
MSN Map
OSM Map
General Map
Google Map
MSN Map
OSM Map
General Map
Google Map
MSN Map
Please wait while loading the map...
Population in 2022: 24,494 (89% urban, 11% rural). Population change since 2000: +20.6%Males: 12,171 Females: 12,323
March 2022 cost of living index in Bainbridge Island: 112.1 (more than average, U.S. average is 100) Percentage of residents living in poverty in 2022: 2.9%for White Non-Hispanic residents , 27.6% for Black residents , 2.9% for Hispanic or Latino residents , 20.4% for other race residents , 3.9% for two or more races residents )
Profiles of local businesses
Business Search - 14 Million verified businesses
Data:
Median household income ($)
Median household income (% change since 2000)
Household income diversity
Ratio of average income to average house value (%)
Ratio of average income to average rent
Median household income ($) - White
Median household income ($) - Black or African American
Median household income ($) - Asian
Median household income ($) - Hispanic or Latino
Median household income ($) - American Indian and Alaska Native
Median household income ($) - Multirace
Median household income ($) - Other Race
Median household income for houses/condos with a mortgage ($)
Median household income for apartments without a mortgage ($)
Races - White alone (%)
Races - White alone (% change since 2000)
Races - Black alone (%)
Races - Black alone (% change since 2000)
Races - American Indian alone (%)
Races - American Indian alone (% change since 2000)
Races - Asian alone (%)
Races - Asian alone (% change since 2000)
Races - Hispanic (%)
Races - Hispanic (% change since 2000)
Races - Native Hawaiian and Other Pacific Islander alone (%)
Races - Native Hawaiian and Other Pacific Islander alone (% change since 2000)
Races - Two or more races (%)
Races - Two or more races (% change since 2000)
Races - Other race alone (%)
Races - Other race alone (% change since 2000)
Racial diversity
Unemployment (%)
Unemployment (% change since 2000)
Unemployment (%) - White
Unemployment (%) - Black or African American
Unemployment (%) - Asian
Unemployment (%) - Hispanic or Latino
Unemployment (%) - American Indian and Alaska Native
Unemployment (%) - Multirace
Unemployment (%) - Other Race
Population density (people per square mile)
Population - Males (%)
Population - Females (%)
Population - Males (%) - White
Population - Males (%) - Black or African American
Population - Males (%) - Asian
Population - Males (%) - Hispanic or Latino
Population - Males (%) - American Indian and Alaska Native
Population - Males (%) - Multirace
Population - Males (%) - Other Race
Population - Females (%) - White
Population - Females (%) - Black or African American
Population - Females (%) - Asian
Population - Females (%) - Hispanic or Latino
Population - Females (%) - American Indian and Alaska Native
Population - Females (%) - Multirace
Population - Females (%) - Other Race
Coronavirus confirmed cases (Apr 25, 2024)
Deaths caused by coronavirus (Apr 25, 2024)
Coronavirus confirmed cases (per 100k population) (Apr 25, 2024)
Deaths caused by coronavirus (per 100k population) (Apr 25, 2024)
Daily increase in number of cases (Apr 25, 2024)
Weekly increase in number of cases (Apr 25, 2024)
Cases doubled (in days) (Apr 25, 2024)
Hospitalized patients (Apr 18, 2022)
Negative test results (Apr 18, 2022)
Total test results (Apr 18, 2022)
COVID Vaccine doses distributed (per 100k population) (Sep 19, 2023)
COVID Vaccine doses administered (per 100k population) (Sep 19, 2023)
COVID Vaccine doses distributed (Sep 19, 2023)
COVID Vaccine doses administered (Sep 19, 2023)
Likely homosexual households (%)
Likely homosexual households (% change since 2000)
Likely homosexual households - Lesbian couples (%)
Likely homosexual households - Lesbian couples (% change since 2000)
Likely homosexual households - Gay men (%)
Likely homosexual households - Gay men (% change since 2000)
Cost of living index
Median gross rent ($)
Median contract rent ($)
Median monthly housing costs ($)
Median house or condo value ($)
Median house or condo value ($ change since 2000)
Mean house or condo value by units in structure - 1, detached ($)
Mean house or condo value by units in structure - 1, attached ($)
Mean house or condo value by units in structure - 2 ($)
Mean house or condo value by units in structure by units in structure - 3 or 4 ($)
Mean house or condo value by units in structure - 5 or more ($)
Mean house or condo value by units in structure - Boat, RV, van, etc. ($)
Mean house or condo value by units in structure - Mobile home ($)
Median house or condo value ($) - White
Median house or condo value ($) - Black or African American
Median house or condo value ($) - Asian
Median house or condo value ($) - Hispanic or Latino
Median house or condo value ($) - American Indian and Alaska Native
Median house or condo value ($) - Multirace
Median house or condo value ($) - Other Race
Median resident age
Resident age diversity
Median resident age - Males
Median resident age - Females
Median resident age - White
Median resident age - Black or African American
Median resident age - Asian
Median resident age - Hispanic or Latino
Median resident age - American Indian and Alaska Native
Median resident age - Multirace
Median resident age - Other Race
Median resident age - Males - White
Median resident age - Males - Black or African American
Median resident age - Males - Asian
Median resident age - Males - Hispanic or Latino
Median resident age - Males - American Indian and Alaska Native
Median resident age - Males - Multirace
Median resident age - Males - Other Race
Median resident age - Females - White
Median resident age - Females - Black or African American
Median resident age - Females - Asian
Median resident age - Females - Hispanic or Latino
Median resident age - Females - American Indian and Alaska Native
Median resident age - Females - Multirace
Median resident age - Females - Other Race
Commute - mean travel time to work (minutes)
Travel time to work - Less than 5 minutes (%)
Travel time to work - Less than 5 minutes (% change since 2000)
Travel time to work - 5 to 9 minutes (%)
Travel time to work - 5 to 9 minutes (% change since 2000)
Travel time to work - 10 to 19 minutes (%)
Travel time to work - 10 to 19 minutes (% change since 2000)
Travel time to work - 20 to 29 minutes (%)
Travel time to work - 20 to 29 minutes (% change since 2000)
Travel time to work - 30 to 39 minutes (%)
Travel time to work - 30 to 39 minutes (% change since 2000)
Travel time to work - 40 to 59 minutes (%)
Travel time to work - 40 to 59 minutes (% change since 2000)
Travel time to work - 60 to 89 minutes (%)
Travel time to work - 60 to 89 minutes (% change since 2000)
Travel time to work - 90 or more minutes (%)
Travel time to work - 90 or more minutes (% change since 2000)
Marital status - Never married (%)
Marital status - Now married (%)
Marital status - Separated (%)
Marital status - Widowed (%)
Marital status - Divorced (%)
Median family income ($)
Median family income (% change since 2000)
Median non-family income ($)
Median non-family income (% change since 2000)
Median per capita income ($)
Median per capita income (% change since 2000)
Median family income ($) - White
Median family income ($) - Black or African American
Median family income ($) - Asian
Median family income ($) - Hispanic or Latino
Median family income ($) - American Indian and Alaska Native
Median family income ($) - Multirace
Median family income ($) - Other Race
Median year house/condo built
Median year apartment built
Year house built - Built 2005 or later (%)
Year house built - Built 2000 to 2004 (%)
Year house built - Built 1990 to 1999 (%)
Year house built - Built 1980 to 1989 (%)
Year house built - Built 1970 to 1979 (%)
Year house built - Built 1960 to 1969 (%)
Year house built - Built 1950 to 1959 (%)
Year house built - Built 1940 to 1949 (%)
Year house built - Built 1939 or earlier (%)
Average household size
Household density (households per square mile)
Average household size - White
Average household size - Black or African American
Average household size - Asian
Average household size - Hispanic or Latino
Average household size - American Indian and Alaska Native
Average household size - Multirace
Average household size - Other Race
Occupied housing units (%)
Vacant housing units (%)
Owner occupied housing units (%)
Renter occupied housing units (%)
Vacancy status - For rent (%)
Vacancy status - For sale only (%)
Vacancy status - Rented or sold, not occupied (%)
Vacancy status - For seasonal, recreational, or occasional use (%)
Vacancy status - For migrant workers (%)
Vacancy status - Other vacant (%)
Residents with income below the poverty level (%)
Residents with income below 50% of the poverty level (%)
Children below poverty level (%)
Poor families by family type - Married-couple family (%)
Poor families by family type - Male, no wife present (%)
Poor families by family type - Female, no husband present (%)
Poverty status for native-born residents (%)
Poverty status for foreign-born residents (%)
Poverty among high school graduates not in families (%)
Poverty among people who did not graduate high school not in families (%)
Residents with income below the poverty level (%) - White
Residents with income below the poverty level (%) - Black or African American
Residents with income below the poverty level (%) - Asian
Residents with income below the poverty level (%) - Hispanic or Latino
Residents with income below the poverty level (%) - American Indian and Alaska Native
Residents with income below the poverty level (%) - Multirace
Residents with income below the poverty level (%) - Other Race
Air pollution - Air Quality Index (AQI)
Air pollution - CO
Air pollution - NO2
Air pollution - SO2
Air pollution - Ozone
Air pollution - PM10
Air pollution - PM25
Air pollution - Pb
Crime - Murders per 100,000 population
Crime - Rapes per 100,000 population
Crime - Robberies per 100,000 population
Crime - Assaults per 100,000 population
Crime - Burglaries per 100,000 population
Crime - Thefts per 100,000 population
Crime - Auto thefts per 100,000 population
Crime - Arson per 100,000 population
Crime - City-data.com crime index
Crime - Violent crime index
Crime - Property crime index
Crime - Murders per 100,000 population (5 year average)
Crime - Rapes per 100,000 population (5 year average)
Crime - Robberies per 100,000 population (5 year average)
Crime - Assaults per 100,000 population (5 year average)
Crime - Burglaries per 100,000 population (5 year average)
Crime - Thefts per 100,000 population (5 year average)
Crime - Auto thefts per 100,000 population (5 year average)
Crime - Arson per 100,000 population (5 year average)
Crime - City-data.com crime index (5 year average)
Crime - Violent crime index (5 year average)
Crime - Property crime index (5 year average)
1996 Presidential Elections Results (%) - Democratic Party (Clinton)
1996 Presidential Elections Results (%) - Republican Party (Dole)
1996 Presidential Elections Results (%) - Other
2000 Presidential Elections Results (%) - Democratic Party (Gore)
2000 Presidential Elections Results (%) - Republican Party (Bush)
2000 Presidential Elections Results (%) - Other
2004 Presidential Elections Results (%) - Democratic Party (Kerry)
2004 Presidential Elections Results (%) - Republican Party (Bush)
2004 Presidential Elections Results (%) - Other
2008 Presidential Elections Results (%) - Democratic Party (Obama)
2008 Presidential Elections Results (%) - Republican Party (McCain)
2008 Presidential Elections Results (%) - Other
2012 Presidential Elections Results (%) - Democratic Party (Obama)
2012 Presidential Elections Results (%) - Republican Party (Romney)
2012 Presidential Elections Results (%) - Other
2016 Presidential Elections Results (%) - Democratic Party (Clinton)
2016 Presidential Elections Results (%) - Republican Party (Trump)
2016 Presidential Elections Results (%) - Other
2020 Presidential Elections Results (%) - Democratic Party (Biden)
2020 Presidential Elections Results (%) - Republican Party (Trump)
2020 Presidential Elections Results (%) - Other
Ancestries Reported - Arab (%)
Ancestries Reported - Czech (%)
Ancestries Reported - Danish (%)
Ancestries Reported - Dutch (%)
Ancestries Reported - English (%)
Ancestries Reported - French (%)
Ancestries Reported - French Canadian (%)
Ancestries Reported - German (%)
Ancestries Reported - Greek (%)
Ancestries Reported - Hungarian (%)
Ancestries Reported - Irish (%)
Ancestries Reported - Italian (%)
Ancestries Reported - Lithuanian (%)
Ancestries Reported - Norwegian (%)
Ancestries Reported - Polish (%)
Ancestries Reported - Portuguese (%)
Ancestries Reported - Russian (%)
Ancestries Reported - Scotch-Irish (%)
Ancestries Reported - Scottish (%)
Ancestries Reported - Slovak (%)
Ancestries Reported - Subsaharan African (%)
Ancestries Reported - Swedish (%)
Ancestries Reported - Swiss (%)
Ancestries Reported - Ukrainian (%)
Ancestries Reported - United States (%)
Ancestries Reported - Welsh (%)
Ancestries Reported - West Indian (%)
Ancestries Reported - Other (%)
Educational Attainment - No schooling completed (%)
Educational Attainment - Less than high school (%)
Educational Attainment - High school or equivalent (%)
Educational Attainment - Less than 1 year of college (%)
Educational Attainment - 1 or more years of college (%)
Educational Attainment - Associate degree (%)
Educational Attainment - Bachelor's degree (%)
Educational Attainment - Master's degree (%)
Educational Attainment - Professional school degree (%)
Educational Attainment - Doctorate degree (%)
School Enrollment - Nursery, preschool (%)
School Enrollment - Kindergarten (%)
School Enrollment - Grade 1 to 4 (%)
School Enrollment - Grade 5 to 8 (%)
School Enrollment - Grade 9 to 12 (%)
School Enrollment - College undergrad (%)
School Enrollment - Graduate or professional (%)
School Enrollment - Not enrolled in school (%)
School enrollment - Public schools (%)
School enrollment - Private schools (%)
School enrollment - Not enrolled (%)
Median number of rooms in houses and condos
Median number of rooms in apartments
Housing units lacking complete plumbing facilities (%)
Housing units lacking complete kitchen facilities (%)
Density of houses
Urban houses (%)
Rural houses (%)
Households with people 60 years and over (%)
Households with people 65 years and over (%)
Households with people 75 years and over (%)
Households with one or more nonrelatives (%)
Households with no nonrelatives (%)
Population in households (%)
Family households (%)
Nonfamily households (%)
Population in families (%)
Family households with own children (%)
Median number of bedrooms in owner occupied houses
Mean number of bedrooms in owner occupied houses
Median number of bedrooms in renter occupied houses
Mean number of bedrooms in renter occupied houses
Median number of vehichles in owner occupied houses
Mean number of vehichles in owner occupied houses
Median number of vehichles in renter occupied houses
Mean number of vehichles in renter occupied houses
Mortgage status - with mortgage (%)
Mortgage status - with second mortgage (%)
Mortgage status - with home equity loan (%)
Mortgage status - with both second mortgage and home equity loan (%)
Mortgage status - without a mortgage (%)
Average family size
Average family size - White
Average family size - Black or African American
Average family size - Asian
Average family size - Hispanic or Latino
Average family size - American Indian and Alaska Native
Average family size - Multirace
Average family size - Other Race
Geographical mobility - Same house 1 year ago (%)
Geographical mobility - Moved within same county (%)
Geographical mobility - Moved from different county within same state (%)
Geographical mobility - Moved from different state (%)
Geographical mobility - Moved from abroad (%)
Place of birth - Born in state of residence (%)
Place of birth - Born in other state (%)
Place of birth - Native, outside of US (%)
Place of birth - Foreign born (%)
Housing units in structures - 1, detached (%)
Housing units in structures - 1, attached (%)
Housing units in structures - 2 (%)
Housing units in structures - 3 or 4 (%)
Housing units in structures - 5 to 9 (%)
Housing units in structures - 10 to 19 (%)
Housing units in structures - 20 to 49 (%)
Housing units in structures - 50 or more (%)
Housing units in structures - Mobile home (%)
Housing units in structures - Boat, RV, van, etc. (%)
House/condo owner moved in on average (years ago)
Renter moved in on average (years ago)
Year householder moved into unit - Moved in 1999 to March 2000 (%)
Year householder moved into unit - Moved in 1995 to 1998 (%)
Year householder moved into unit - Moved in 1990 to 1994 (%)
Year householder moved into unit - Moved in 1980 to 1989 (%)
Year householder moved into unit - Moved in 1970 to 1979 (%)
Year householder moved into unit - Moved in 1969 or earlier (%)
Means of transportation to work - Drove car alone (%)
Means of transportation to work - Carpooled (%)
Means of transportation to work - Public transportation (%)
Means of transportation to work - Bus or trolley bus (%)
Means of transportation to work - Streetcar or trolley car (%)
Means of transportation to work - Subway or elevated (%)
Means of transportation to work - Railroad (%)
Means of transportation to work - Ferryboat (%)
Means of transportation to work - Taxicab (%)
Means of transportation to work - Motorcycle (%)
Means of transportation to work - Bicycle (%)
Means of transportation to work - Walked (%)
Means of transportation to work - Other means (%)
Working at home (%)
Industry diversity
Most Common Industries - Agriculture, forestry, fishing and hunting, and mining (%)
Most Common Industries - Agriculture, forestry, fishing and hunting (%)
Most Common Industries - Mining, quarrying, and oil and gas extraction (%)
Most Common Industries - Construction (%)
Most Common Industries - Manufacturing (%)
Most Common Industries - Wholesale trade (%)
Most Common Industries - Retail trade (%)
Most Common Industries - Transportation and warehousing, and utilities (%)
Most Common Industries - Transportation and warehousing (%)
Most Common Industries - Utilities (%)
Most Common Industries - Information (%)
Most Common Industries - Finance and insurance, and real estate and rental and leasing (%)
Most Common Industries - Finance and insurance (%)
Most Common Industries - Real estate and rental and leasing (%)
Most Common Industries - Professional, scientific, and management, and administrative and waste management services (%)
Most Common Industries - Professional, scientific, and technical services (%)
Most Common Industries - Management of companies and enterprises (%)
Most Common Industries - Administrative and support and waste management services (%)
Most Common Industries - Educational services, and health care and social assistance (%)
Most Common Industries - Educational services (%)
Most Common Industries - Health care and social assistance (%)
Most Common Industries - Arts, entertainment, and recreation, and accommodation and food services (%)
Most Common Industries - Arts, entertainment, and recreation (%)
Most Common Industries - Accommodation and food services (%)
Most Common Industries - Other services, except public administration (%)
Most Common Industries - Public administration (%)
Occupation diversity
Most Common Occupations - Management, business, science, and arts occupations (%)
Most Common Occupations - Management, business, and financial occupations (%)
Most Common Occupations - Management occupations (%)
Most Common Occupations - Business and financial operations occupations (%)
Most Common Occupations - Computer, engineering, and science occupations (%)
Most Common Occupations - Computer and mathematical occupations (%)
Most Common Occupations - Architecture and engineering occupations (%)
Most Common Occupations - Life, physical, and social science occupations (%)
Most Common Occupations - Education, legal, community service, arts, and media occupations (%)
Most Common Occupations - Community and social service occupations (%)
Most Common Occupations - Legal occupations (%)
Most Common Occupations - Education, training, and library occupations (%)
Most Common Occupations - Arts, design, entertainment, sports, and media occupations (%)
Most Common Occupations - Healthcare practitioners and technical occupations (%)
Most Common Occupations - Health diagnosing and treating practitioners and other technical occupations (%)
Most Common Occupations - Health technologists and technicians (%)
Most Common Occupations - Service occupations (%)
Most Common Occupations - Healthcare support occupations (%)
Most Common Occupations - Protective service occupations (%)
Most Common Occupations - Fire fighting and prevention, and other protective service workers including supervisors (%)
Most Common Occupations - Law enforcement workers including supervisors (%)
Most Common Occupations - Food preparation and serving related occupations (%)
Most Common Occupations - Building and grounds cleaning and maintenance occupations (%)
Most Common Occupations - Personal care and service occupations (%)
Most Common Occupations - Sales and office occupations (%)
Most Common Occupations - Sales and related occupations (%)
Most Common Occupations - Office and administrative support occupations (%)
Most Common Occupations - Natural resources, construction, and maintenance occupations (%)
Most Common Occupations - Farming, fishing, and forestry occupations (%)
Most Common Occupations - Construction and extraction occupations (%)
Most Common Occupations - Installation, maintenance, and repair occupations (%)
Most Common Occupations - Production, transportation, and material moving occupations (%)
Most Common Occupations - Production occupations (%)
Most Common Occupations - Transportation occupations (%)
Most Common Occupations - Material moving occupations (%)
People in Group quarters - Institutionalized population (%)
People in Group quarters - Correctional institutions (%)
People in Group quarters - Federal prisons and detention centers (%)
People in Group quarters - Halfway houses (%)
People in Group quarters - Local jails and other confinement facilities (including police lockups) (%)
People in Group quarters - Military disciplinary barracks (%)
People in Group quarters - State prisons (%)
People in Group quarters - Other types of correctional institutions (%)
People in Group quarters - Nursing homes (%)
People in Group quarters - Hospitals/wards, hospices, and schools for the handicapped (%)
People in Group quarters - Hospitals/wards and hospices for chronically ill (%)
People in Group quarters - Hospices or homes for chronically ill (%)
People in Group quarters - Military hospitals or wards for chronically ill (%)
People in Group quarters - Other hospitals or wards for chronically ill (%)
People in Group quarters - Hospitals or wards for drug/alcohol abuse (%)
People in Group quarters - Mental (Psychiatric) hospitals or wards (%)
People in Group quarters - Schools, hospitals, or wards for the mentally retarded (%)
People in Group quarters - Schools, hospitals, or wards for the physically handicapped (%)
People in Group quarters - Institutions for the deaf (%)
People in Group quarters - Institutions for the blind (%)
People in Group quarters - Orthopedic wards and institutions for the physically handicapped (%)
People in Group quarters - Wards in general hospitals for patients who have no usual home elsewhere (%)
People in Group quarters - Wards in military hospitals for patients who have no usual home elsewhere (%)
People in Group quarters - Juvenile institutions (%)
People in Group quarters - Long-term care (%)
People in Group quarters - Homes for abused, dependent, and neglected children (%)
People in Group quarters - Residential treatment centers for emotionally disturbed children (%)
People in Group quarters - Training schools for juvenile delinquents (%)
People in Group quarters - Short-term care, detention or diagnostic centers for delinquent children (%)
People in Group quarters - Type of juvenile institution unknown (%)
People in Group quarters - Noninstitutionalized population (%)
People in Group quarters - College dormitories (includes college quarters off campus) (%)
People in Group quarters - Military quarters (%)
People in Group quarters - On base (%)
People in Group quarters - Barracks, unaccompanied personnel housing (UPH), (Enlisted/Officer), ;and similar group living quarters for military personnel (%)
People in Group quarters - Transient quarters for temporary residents (%)
People in Group quarters - Military ships (%)
People in Group quarters - Group homes (%)
People in Group quarters - Homes or halfway houses for drug/alcohol abuse (%)
People in Group quarters - Homes for the mentally ill (%)
People in Group quarters - Homes for the mentally retarded (%)
People in Group quarters - Homes for the physically handicapped (%)
People in Group quarters - Other group homes (%)
People in Group quarters - Religious group quarters (%)
People in Group quarters - Dormitories (%)
People in Group quarters - Agriculture workers' dormitories on farms (%)
People in Group quarters - Job Corps and vocational training facilities (%)
People in Group quarters - Other workers' dormitories (%)
People in Group quarters - Crews of maritime vessels (%)
People in Group quarters - Other nonhousehold living situations (%)
People in Group quarters - Other noninstitutional group quarters (%)
Residents speaking English at home (%)
Residents speaking English at home - Born in the United States (%)
Residents speaking English at home - Native, born elsewhere (%)
Residents speaking English at home - Foreign born (%)
Residents speaking Spanish at home (%)
Residents speaking Spanish at home - Born in the United States (%)
Residents speaking Spanish at home - Native, born elsewhere (%)
Residents speaking Spanish at home - Foreign born (%)
Residents speaking other language at home (%)
Residents speaking other language at home - Born in the United States (%)
Residents speaking other language at home - Native, born elsewhere (%)
Residents speaking other language at home - Foreign born (%)
Class of Workers - Employee of private company (%)
Class of Workers - Self-employed in own incorporated business (%)
Class of Workers - Private not-for-profit wage and salary workers (%)
Class of Workers - Local government workers (%)
Class of Workers - State government workers (%)
Class of Workers - Federal government workers (%)
Class of Workers - Self-employed workers in own not incorporated business and Unpaid family workers (%)
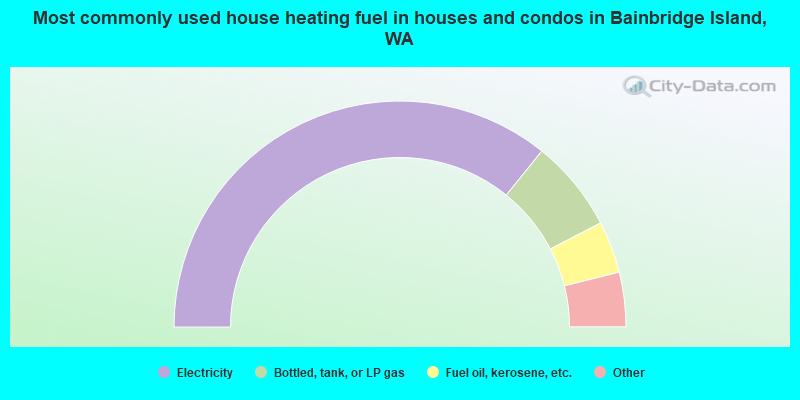
House heating fuel used in houses and condos - Utility gas (%)
House heating fuel used in houses and condos - Bottled, tank, or LP gas (%)
House heating fuel used in houses and condos - Electricity (%)
House heating fuel used in houses and condos - Fuel oil, kerosene, etc. (%)
House heating fuel used in houses and condos - Coal or coke (%)
House heating fuel used in houses and condos - Wood (%)
House heating fuel used in houses and condos - Solar energy (%)
House heating fuel used in houses and condos - Other fuel (%)
House heating fuel used in houses and condos - No fuel used (%)
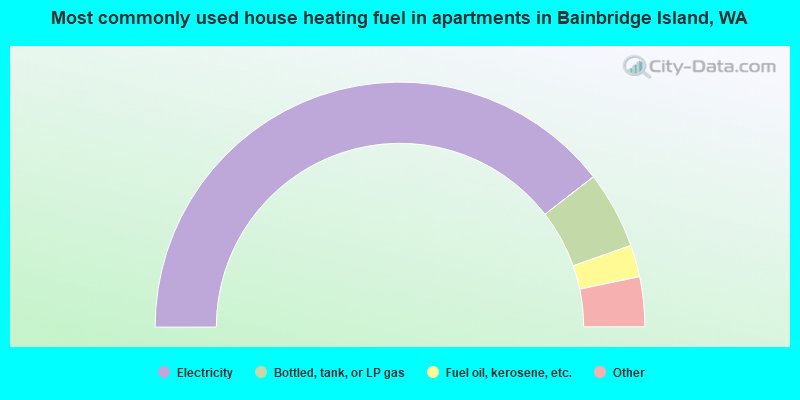
House heating fuel used in apartments - Utility gas (%)
House heating fuel used in apartments - Bottled, tank, or LP gas (%)
House heating fuel used in apartments - Electricity (%)
House heating fuel used in apartments - Fuel oil, kerosene, etc. (%)
House heating fuel used in apartments - Coal or coke (%)
House heating fuel used in apartments - Wood (%)
House heating fuel used in apartments - Solar energy (%)
House heating fuel used in apartments - Other fuel (%)
House heating fuel used in apartments - No fuel used (%)
Armed forces status - In Armed Forces (%)
Armed forces status - Civilian (%)
Armed forces status - Civilian - Veteran (%)
Armed forces status - Civilian - Nonveteran (%)
Fatal accidents locations in years 2005-2021
Fatal accidents locations in 2005
Fatal accidents locations in 2006
Fatal accidents locations in 2007
Fatal accidents locations in 2008
Fatal accidents locations in 2009
Fatal accidents locations in 2010
Fatal accidents locations in 2011
Fatal accidents locations in 2012
Fatal accidents locations in 2013
Fatal accidents locations in 2014
Fatal accidents locations in 2015
Fatal accidents locations in 2016
Fatal accidents locations in 2017
Fatal accidents locations in 2018
Fatal accidents locations in 2019
Fatal accidents locations in 2020
Fatal accidents locations in 2021
Alcohol use - People drinking some alcohol every month (%)
Alcohol use - People not drinking at all (%)
Alcohol use - Average days/month drinking alcohol
Alcohol use - Average drinks/week
Alcohol use - Average days/year people drink much
Audiometry - Average condition of hearing (%)
Audiometry - People that can hear a whisper from across a quiet room (%)
Audiometry - People that can hear normal voice from across a quiet room (%)
Audiometry - Ears ringing, roaring, buzzing (%)
Audiometry - Had a job exposure to loud noise (%)
Audiometry - Had off-work exposure to loud noise (%)
Blood Pressure & Cholesterol - Has high blood pressure (%)
Blood Pressure & Cholesterol - Checking blood pressure at home (%)
Blood Pressure & Cholesterol - Frequently checking blood cholesterol (%)
Blood Pressure & Cholesterol - Has high cholesterol level (%)
Consumer Behavior - Money monthly spent on food at supermarket/grocery store
Consumer Behavior - Money monthly spent on food at other stores
Consumer Behavior - Money monthly spent on eating out
Consumer Behavior - Money monthly spent on carryout/delivered foods
Consumer Behavior - Income spent on food at supermarket/grocery store (%)
Consumer Behavior - Income spent on food at other stores (%)
Consumer Behavior - Income spent on eating out (%)
Consumer Behavior - Income spent on carryout/delivered foods (%)
Current Health Status - General health condition (%)
Current Health Status - Blood donors (%)
Current Health Status - Has blood ever tested for HIV virus (%)
Current Health Status - Left-handed people (%)
Dermatology - People using sunscreen (%)
Diabetes - Diabetics (%)
Diabetes - Had a blood test for high blood sugar (%)
Diabetes - People taking insulin (%)
Diet Behavior & Nutrition - Diet health (%)
Diet Behavior & Nutrition - Milk product consumption (# of products/month)
Diet Behavior & Nutrition - Meals not home prepared (#/week)
Diet Behavior & Nutrition - Meals from fast food or pizza place (#/week)
Diet Behavior & Nutrition - Ready-to-eat foods (#/month)
Diet Behavior & Nutrition - Frozen meals/pizza (#/month)
Drug Use - People that ever used marijuana or hashish (%)
Drug Use - Ever used hard drugs (%)
Drug Use - Ever used any form of cocaine (%)
Drug Use - Ever used heroin (%)
Drug Use - Ever used methamphetamine (%)
Health Insurance - People covered by health insurance (%)
Kidney Conditions-Urology - Avg. # of times urinating at night
Medical Conditions - People with asthma (%)
Medical Conditions - People with anemia (%)
Medical Conditions - People with psoriasis (%)
Medical Conditions - People with overweight (%)
Medical Conditions - Elderly people having difficulties in thinking or remembering (%)
Medical Conditions - People who ever received blood transfusion (%)
Medical Conditions - People having trouble seeing even with glass/contacts (%)
Medical Conditions - People with arthritis (%)
Medical Conditions - People with gout (%)
Medical Conditions - People with congestive heart failure (%)
Medical Conditions - People with coronary heart disease (%)
Medical Conditions - People with angina pectoris (%)
Medical Conditions - People who ever had heart attack (%)
Medical Conditions - People who ever had stroke (%)
Medical Conditions - People with emphysema (%)
Medical Conditions - People with thyroid problem (%)
Medical Conditions - People with chronic bronchitis (%)
Medical Conditions - People with any liver condition (%)
Medical Conditions - People who ever had cancer or malignancy (%)
Mental Health - People who have little interest in doing things (%)
Mental Health - People feeling down, depressed, or hopeless (%)
Mental Health - People who have trouble sleeping or sleeping too much (%)
Mental Health - People feeling tired or having little energy (%)
Mental Health - People with poor appetite or overeating (%)
Mental Health - People feeling bad about themself (%)
Mental Health - People who have trouble concentrating on things (%)
Mental Health - People moving or speaking slowly or too fast (%)
Mental Health - People having thoughts they would be better off dead (%)
Oral Health - Average years since last visit a dentist
Oral Health - People embarrassed because of mouth (%)
Oral Health - People with gum disease (%)
Oral Health - General health of teeth and gums (%)
Oral Health - Average days a week using dental floss/device
Oral Health - Average days a week using mouthwash for dental problem
Oral Health - Average number of teeth
Pesticide Use - Households using pesticides to control insects (%)
Pesticide Use - Households using pesticides to kill weeds (%)
Physical Activity - People doing vigorous-intensity work activities (%)
Physical Activity - People doing moderate-intensity work activities (%)
Physical Activity - People walking or bicycling (%)
Physical Activity - People doing vigorous-intensity recreational activities (%)
Physical Activity - People doing moderate-intensity recreational activities (%)
Physical Activity - Average hours a day doing sedentary activities
Physical Activity - Average hours a day watching TV or videos
Physical Activity - Average hours a day using computer
Physical Functioning - People having limitations keeping them from working (%)
Physical Functioning - People limited in amount of work they can do (%)
Physical Functioning - People that need special equipment to walk (%)
Physical Functioning - People experiencing confusion/memory problems (%)
Physical Functioning - People requiring special healthcare equipment (%)
Prescription Medications - Average number of prescription medicines taking
Preventive Aspirin Use - Adults 40+ taking low-dose aspirin (%)
Reproductive Health - Vaginal deliveries (%)
Reproductive Health - Cesarean deliveries (%)
Reproductive Health - Deliveries resulted in a live birth (%)
Reproductive Health - Pregnancies resulted in a delivery (%)
Reproductive Health - Women breastfeeding newborns (%)
Reproductive Health - Women that had a hysterectomy (%)
Reproductive Health - Women that had both ovaries removed (%)
Reproductive Health - Women that have ever taken birth control pills (%)
Reproductive Health - Women taking birth control pills (%)
Reproductive Health - Women that have ever used Depo-Provera or injectables (%)
Reproductive Health - Women that have ever used female hormones (%)
Sexual Behavior - People 18+ that ever had sex (vaginal, anal, or oral) (%)
Sexual Behavior - Males 18+ that ever had vaginal sex with a woman (%)
Sexual Behavior - Males 18+ that ever performed oral sex on a woman (%)
Sexual Behavior - Males 18+ that ever had anal sex with a woman (%)
Sexual Behavior - Males 18+ that ever had any sex with a man (%)
Sexual Behavior - Females 18+ that ever had vaginal sex with a man (%)
Sexual Behavior - Females 18+ that ever performed oral sex on a man (%)
Sexual Behavior - Females 18+ that ever had anal sex with a man (%)
Sexual Behavior - Females 18+ that ever had any kind of sex with a woman (%)
Sexual Behavior - Average age people first had sex
Sexual Behavior - Average number of female sex partners in lifetime (males 18+)
Sexual Behavior - Average number of female vaginal sex partners in lifetime (males 18+)
Sexual Behavior - Average age people first performed oral sex on a woman (18+)
Sexual Behavior - Average number of woman performed oral sex on in lifetime (18+)
Sexual Behavior - Average number of male sex partners in lifetime (males 18+)
Sexual Behavior - Average number of male anal sex partners in lifetime (males 18+)
Sexual Behavior - Average age people first performed oral sex on a man (18+)
Sexual Behavior - Average number of male oral sex partners in lifetime (18+)
Sexual Behavior - People using protection when performing oral sex (%)
Sexual Behavior - Average number of times people have vaginal or anal sex a year
Sexual Behavior - People having sex without condom (%)
Sexual Behavior - Average number of male sex partners in lifetime (females 18+)
Sexual Behavior - Average number of male vaginal sex partners in lifetime (females 18+)
Sexual Behavior - Average number of female sex partners in lifetime (females 18+)
Sexual Behavior - Circumcised males 18+ (%)
Sleep Disorders - Average hours sleeping at night
Sleep Disorders - People that has trouble sleeping (%)
Smoking-Cigarette Use - People smoking cigarettes (%)
Taste & Smell - People 40+ having problems with smell (%)
Taste & Smell - People 40+ having problems with taste (%)
Taste & Smell - People 40+ that ever had wisdom teeth removed (%)
Taste & Smell - People 40+ that ever had tonsils teeth removed (%)
Taste & Smell - People 40+ that ever had a loss of consciousness because of a head injury (%)
Taste & Smell - People 40+ that ever had a broken nose or other serious injury to face or skull (%)
Taste & Smell - People 40+ that ever had two or more sinus infections (%)
Weight - Average height (inches)
Weight - Average weight (pounds)
Weight - Average BMI
Weight - People that are obese (%)
Weight - People that ever were obese (%)
Weight - People trying to lose weight (%)
Officers per 1,000 residents here:
0.82Washington average:
1.35
Latest news from Bainbridge Island, WA collected exclusively by city-data.com from local newspapers, TV, and radio stations
Ancestries: English (12.9%), European (10.8%), Irish (10.5%), German (10.5%), American (6.3%), Italian (2.9%).
Current Local Time:
Land area: 27.6 square miles.
Population density: 887 people per square mile (low).
1,884 residents are foreign born (2.5% Asia , 2.2% Europe , 1.1% North America , 0.9% Latin America ).
This city:
7.6%Washington:
14.9%
Median real estate property taxes paid for housing units with mortgages in 2022: $7,749 (0.7%)Median real estate property taxes paid for housing units with no mortgage in 2022: $7,892 (0.7%)
Nearest city with pop. 50,000+: Seattle, WA
Nearest city with pop. 1,000,000+: Los Angeles, CA
Nearest cities:
Latitude: 47.66 N, Longitude: 122.54 W
Daytime population change due to commuting: -411 (-1.7%)Workers who live and work in this city: 7,411 (65.5%)
Single-family new house construction building permits:
2022: 38 buildings , average cost: $593,4002021: 61 buildings , average cost: $444,1002020: 86 buildings , average cost: $440,6002019: 94 buildings , average cost: $442,5002018: 138 buildings , average cost: $490,0002017: 88 buildings , average cost: $441,2002016: 114 buildings , average cost: $500,0002015: 125 buildings , average cost: $408,9002014: 49 buildings , average cost: $355,3002013: 96 buildings , average cost: $281,8002012: 52 buildings , average cost: $252,3002011: 53 buildings , average cost: $304,2002010: 27 buildings , average cost: $276,4002009: 30 buildings , average cost: $299,8002008: 42 buildings , average cost: $314,5002007: 83 buildings , average cost: $324,7002006: 107 buildings , average cost: $294,6002005: 161 buildings , average cost: $263,9002004: 146 buildings , average cost: $246,0002003: 157 buildings , average cost: $238,1002002: 136 buildings , average cost: $203,8002001: 160 buildings , average cost: $232,5002000: 238 buildings , average cost: $197,4001999: 217 buildings , average cost: $206,6001998: 183 buildings , average cost: $186,9001997: 178 buildings , average cost: $191,100Unemployment in December 2023: Population change in the 1990s: +4,265 (+26.6%).
Most common occupations in Bainbridge Island, WA (%)
Both Males Females
Other management occupations, except farmers and farm managers (7.0%)
Other sales and related occupations, including supervisors (5.2%)
Computer specialists (4.8%)
Lawyers (4.2%)
Sales representatives, services, wholesale and manufacturing (4.1%)
Preschool, kindergarten, elementary, and middle school teachers (3.7%)
Top executives (3.6%)
Other management occupations, except farmers and farm managers (7.8%)
Computer specialists (7.6%)
Lawyers (6.7%)
Other sales and related occupations, including supervisors (4.7%)
Top executives (4.7%)
Sales representatives, services, wholesale and manufacturing (4.7%)
Building and grounds cleaning and maintenance occupations (3.8%)
Preschool, kindergarten, elementary, and middle school teachers (6.5%)
Other management occupations, except farmers and farm managers (6.1%)
Other sales and related occupations, including supervisors (5.7%)
Registered nurses (4.3%)
Art and design workers (4.0%)
Other office and administrative support workers, including supervisors (3.9%)
Sales representatives, services, wholesale and manufacturing (3.4%)
Earthquake activity:
Bainbridge Island-area historical earthquake activity is significantly above Washington state average. It is 1275% greater than the overall U.S. average. On 4/13/1949 at 19:55:42, a magnitude 7.0 (7.0 UK, Class: Major, Intensity: VIII - XII) earthquake occurred 28.1 miles away from the city center, causing $80,000,000 total damage On 2/28/2001 at 18:54:32, a magnitude 6.8 (6.8 MD, Depth: 32.2 mi, Class: Strong, Intensity: VII - IX) earthquake occurred 36.1 miles away from Bainbridge Island center On 2/28/2001 at 18:54:32, a magnitude 6.8 (6.5 MB, 6.6 MS, 6.8 MW) earthquake occurred 39.2 miles away from the city center, causing $2,000,000,000 total damage and $305,000,000 insured lossesOn 4/29/1965 at 15:28:43, a magnitude 6.6 (6.6 UK) earthquake occurred 25.2 miles away from the city center, causing $28,000,000 total damage On 7/3/1999 at 01:43:54, a magnitude 5.8 (5.4 MB, 5.5 MS, 5.8 MW, 5.3 ME, Depth: 25.2 mi, Class: Moderate, Intensity: VI - VII) earthquake occurred 52.6 miles away from Bainbridge Island center On 5/3/1996 at 04:04:22, a magnitude 5.5 (5.2 MB, 5.3 MD, 5.5 ML, Depth: 2.5 mi) earthquake occurred 38.8 miles away from the city center Magnitude types: body-wave magnitude (MB), duration magnitude (MD), energy magnitude (ME), local magnitude (ML), surface-wave magnitude (MS), moment magnitude (MW) Natural disasters: The number of natural disasters in Kitsap County (15) is near the US average (15).Major Disasters (Presidential) Declared: 14Emergencies Declared: 1Floods: 9, Storms: 9, Mudslides: 4, Landslides: 3, Earthquakes: 2, Hurricane: 1, Snow: 1, Volcanic Eruption: 1, Winter Storm: 1, Other: 1 (Note: some incidents may be assigned to more than one category). Hospitals and medical centers in Bainbridge Island: ISLAND HEALTH AND REHAB CENTER (835 MADISON AVENUE NORTH)
MESSENGER HOUSE CARE CENTER (10861 NE MANITOU PARK BLVD)
Other hospitals and medical centers near Bainbridge Island: MAGNOLIA HEALTH CARE CENTER (Nursing Home, about 7 miles away; SEATTLE, WA)
OLYMPIC PENINSULA KIDNEY CENTER (Dialysis Facility, about 7 miles away; BREMERTON, WA)
HARRISON MEDICAL CENTER (about 7 miles away; BREMERTON, WA)
BREMERTON CONVALESCENT CENTER (Nursing Home, about 7 miles away; BREMERTON, WA)
BREMERTON HEALTH AND REHABILITATION CENTER (Nursing Home, about 7 miles away; BREMERTON, WA)
HARRISON HOME HEALTH (Home Health Center, about 7 miles away; BREMERTON, WA)
RESTHAVEN NURSING HOME (Nursing Home, about 7 miles away; BREMERTON, WA)
Heliports located in Bainbridge Island: Amtrak stations near Bainbridge Island: 11 miles: SEATTLE (303 S. JACKSON ST.) Services: ticket office, fully wheelchair accessible, enclosed waiting area, public restrooms, public payphones, vending machines, paid short-term parking, paid long-term parking, call for car rental service, taxi stand, intercity bus service, public transit connection.
13 miles: EDMONDS (211 RAILROAD AVE.) Services: ticket office, fully wheelchair accessible, enclosed waiting area, public restrooms, public payphones, vending machines, paid short-term parking, paid long-term parking, call for taxi service, public transit connection.
Colleges/universities with over 2000 students nearest to Bainbridge Island:
Olympic College (about 8 miles; Bremerton, WA ; Full-time enrollment: 6,158)
Seattle Pacific University (about 9 miles; Seattle, WA ; FT enrollment: 3,897)
Seattle Community College-North Campus (about 10 miles; Seattle, WA ; FT enrollment: 4,220)
Seattle Central College (about 11 miles; Seattle, WA ; FT enrollment: 5,825)
University of Washington-Seattle Campus (about 11 miles; Seattle, WA ; FT enrollment: 39,445)
Shoreline Community College (about 11 miles; Shoreline, WA ; FT enrollment: 5,026)
Seattle University (about 11 miles; Seattle, WA ; FT enrollment: 5,808)
Public high schools in Bainbridge Island:
Public elementary/middle schools in Bainbridge Island:
Private elementary/middle schools in Bainbridge Island: MADRONA SCHOOL Students: 136, Location: 219 MADISON AVE S, Grades: PK-6)
ST CECILIA CATHOLIC SCHOOL Students: 112, Location: 1310 MADISON AVE N, Grades: PK-8)
THE ISLAND SCHOOL Students: 108, Location: 8553 NE DAY RD, Grades: KG-5)
HYLA MIDDLE SCHOOL Students: 82, Location: 7861 BUCKLIN HILL RD NE, Grades: 6-8)
MONTESSORI COUNTRY SCHOOL Students: 81, Location: 10994 ARROW POINT DR NE, Grades: PK-1)
CARDEN COUNTRY SCHOOL Students: 41, Location: 6974 ISLAND CENTER RD, Grades: KG-8)
VOYAGER MONTESSORI ELEMENTARY SCHOOL Students: 35, Location: 8225 NE HIGH SCHOOL RD, Grades: 1-5)
See full list of schools located in Bainbridge Island
Notable locations in Bainbridge Island: (A) , Island Center (B) , Bainbridge Isle Ferry Landing (C) , Pleasant Beach (D) , Eagle Harbor Marina (E) , Harbour Marina (F) , Eagledale Moorings (G) , Queen City Yacht Club Outstation (H) , Bainbridge Marina (I) , Winslow Wharf Marina (J) , The Chandlery at Winslow Wharf (K) , Port Madison Yacht Club (L) , Seattle Yacht Club Port Madison Outstation (M) , Bainbridge Island City Sewage Treatment Plant (N) , Point Monroe Light (O) , Bainbridge Island Fire Department Station 23 (P) , Bainbridge Island Fire Department Station 22 (Q) , Bainbridge Island Ambulance Association (R) , Battle Point Light (S) , Bainbridge Island Senior Community Center (T) . Display/hide their locations on the map
Shopping Center: (1) . Display/hide its location on the map
Churches in Bainbridge Island include: (A) , Bethany Lutheran Church (B) , Eagle Harbor Congregational Church (C) , Grace Church (D) , Island Church (E) , Life Staff Ministries (F) , Saint Cecilia Catholic Church (G) , Bainbridge Bible Chapel (H) , Bainbridge First Baptist Church (I) . Display/hide their locations on the map
Cemeteries: (1) , Seabold Cemetery (2) . Display/hide their locations on the map
Lakes and reservoirs: (A) , Erickson Reservoir (B) , Battlepoint Park Reservoir (C) . Display/hide their locations on the map
Creeks: (A) , Manzanita Creek (B) , Miemois Creek (C) . Display/hide their locations on the map
Parks in Bainbridge Island include: (1) , Battle Point Park (2) , Fort Ward State Park (3) . Display/hide their locations on the map
Tourist attraction: (1) . Display/hide its approximate location on the map
Hotels: (1) , Monarch Manor Estates LLC- Bed And Beach (7656 Madrona Drive NE) (2) . Display/hide their approximate locations on the map
Court: (1) . Display/hide its approximate location on the map
Kitsap County has a predicted average indoor radon screening level less than 2 pCi/L (pico curies per liter) - Low Potential Drinking water stations with addresses in Bainbridge Island and their reported violations in the past:
EAGLE HARBOR MARINA (Population served: 257, Groundwater):
Past monitoring violations:
6 routine major monitoring violations
Population served: 73, Groundwater):
Past monitoring violations:
2 routine major monitoring violations
Population served: 51, Groundwater):
Past monitoring violations:
2 routine major monitoring violations
Population served: 48, Groundwater):
Past monitoring violations:
One routine major monitoring violation
One regular monitoring violation
Drinking water stations with addresses in Bainbridge Island that have no violations reported:
BAINBRIDGE ISLAND, CITY OF (Address: 7305 Hidden Cove Rd Population served: 11,059, Primary Water Source Type: Groundwater)
Average household size: This city:
2.4 peopleWashington:
2.5 people
Percentage of family households: This city:
69.8%Whole state:
64.4%
Percentage of households with unmarried partners: This city:
4.6%Whole state:
7.7%
Likely homosexual households (counted as self-reported same-sex unmarried-partner households)
Lesbian couples: 0.7% of all households Gay men: 0.5% of all households
People in group quarters in Bainbridge Island in 2010:
132 people in nursing facilities/skilled-nursing facilities
43 people in other noninstitutional facilities
26 people in college/university student housing
5 people in group homes intended for adults
5 people in workers' group living quarters and job corps centers
people in nursing homes in 2000people in other noninstitutional group quarters in 2000Banks with most branches in Bainbridge Island (2011 data):
Columbia State Bank: Village Branch at 208 High School Road Ne, branch established on 1968/01/25; Branch at 249 Winslow Way East, branch established on 1948/09/17. Info updated 2011/08/09: Bank assets: $4,785.2 mil, Deposits: $3,892.8 mil, headquarters in Tacoma, WA, positive income , Commercial Lending Specialization, 104 total offices , Holding Company: Columbia Banking System, Inc.
Union Bank, National Association: Bainbridge Island Branch at 901 Hildebrand Lane Ne, branch established on 1991/03/25. Info updated 2011/09/01: Bank assets: $88,967.5 mil, Deposits: $65,286.4 mil, headquarters in San Francisco, CA, positive income , Commercial Lending Specialization, 403 total offices , Holding Company: Mitsubishi Ufj Financial Group, Inc.
JPMorgan Chase Bank, National Association: Bainbridge Island at 231 Winslow Way East, branch established on 1916/01/01. Info updated 2011/11/10: Bank assets: $1,811,678.0 mil, Deposits: $1,190,738.0 mil, headquarters in Columbus, OH, positive income , International Specialization, 5577 total offices , Holding Company: Jpmorgan Chase & Co.
Kitsap Bank: Bainbridge Island Branch at 10140 N.E. High School Road, branch established on 1979/12/05. Info updated 2009/05/11: Bank assets: $903.9 mil, Deposits: $775.3 mil, headquarters in Port Orchard, WA, positive income , Commercial Lending Specialization, 22 total offices , Holding Company: Olympic Bancorp, Inc.
Wells Fargo Bank, National Association: Bainbridge Branch at 1180 Hildebrand Lane Northeast, branch established on 1995/01/07. Info updated 2011/04/05: Bank assets: $1,161,490.0 mil, Deposits: $905,653.0 mil, headquarters in Sioux Falls, SD, positive income , 6395 total offices , Holding Company: Wells Fargo & Company
AmericanWest Bank: Bainbridge Island Branch at 945 Hildebrand Lane Suite 240, branch established on 2006/05/21. Info updated 2011/12/12: Bank assets: $2,274.6 mil, Deposits: $1,889.1 mil, headquarters in Spokane, WA, positive income , Commercial Lending Specialization, 76 total offices , Holding Company: Skbhc Holdings Llc
Sterling Savings Bank: Winslow Branch at 600 Winslow Way East, Ste 120, branch established on 1988/06/30. Info updated 2012/03/21: Bank assets: $9,207.8 mil, Deposits: $6,454.1 mil, headquarters in Spokane, WA, positive income , Commercial Lending Specialization, 192 total offices , Holding Company: Sterling Financial Corporation
KeyBank National Association: Winslow Branch at 617 High School Road Ne, branch established on 1993/03/03. Info updated 2008/03/03: Bank assets: $86,198.8 mil, Deposits: $64,214.8 mil, headquarters in Cleveland, OH, positive income , Commercial Lending Specialization, 1067 total offices , Holding Company: Keycorp
Bank of America, National Association: Bainbridge Island Branch at 1200 Hildebrand Lane, Northeast, branch established on 1994/08/01. Info updated 2009/11/18: Bank assets: $1,451,969.3 mil, Deposits: $1,077,176.8 mil, headquarters in Charlotte, NC, positive income , 5782 total offices , Holding Company: Bank Of America Corporation
For population 15 years and over in Bainbridge Island:
Never married: 19.7%Now married: 67.2%Separated: 1.2%Widowed: 3.7%Divorced: 8.2% For population 25 years and over in Bainbridge Island:
High school or higher: 99.6%Bachelor's degree or higher: 73.8%Graduate or professional degree: 34.8%Unemployed: 2.6%Mean travel time to work (commute): 26.0 minutes
Education Gini index (Inequality in education) Here:
8.1Washington average:
11.6
Religion statistics for Bainbridge Island, WA (based on Kitsap County data)
Religion Adherents Congregations Evangelical Protestant 33,373 118 Other 12,378 42 Mainline Protestant 11,484 39 Catholic 8,572 5 Orthodox 140 2 Black Protestant 84 1 None 185,102 -
Source: Clifford Grammich, Kirk Hadaway, Richard Houseal, Dale E.Jones, Alexei Krindatch, Richie Stanley and Richard H.Taylor. 2012. 2010 U.S.Religion Census: Religious Congregations & Membership Study. Association of Statisticians of American Religious Bodies. Jones, Dale E., et al. 2002. Congregations and Membership in the United States 2000. Nashville, TN: Glenmary Research Center. Graphs represent county-level data
Food Environment Statistics: Number of grocery stores : 43Kitsap County :
1.81 / 10,000 pop.Washington :
2.06 / 10,000 pop.
Number of supercenters and club stores : 3This county :
0.13 / 10,000 pop.State :
0.19 / 10,000 pop.
Number of convenience stores (no gas) : 33Kitsap County :
1.39 / 10,000 pop.Washington :
1.18 / 10,000 pop.
Number of convenience stores (with gas) : 53Kitsap County :
2.23 / 10,000 pop.State :
2.67 / 10,000 pop.
Number of full-service restaurants : 173Here :
7.26 / 10,000 pop.State :
8.26 / 10,000 pop.
Adult diabetes rate : This county :
7.9%Washington :
7.7%
Adult obesity rate : Kitsap County :
27.6%Washington :
25.7%
Low-income preschool obesity rate : This county :
11.4%State :
13.9%
Health and Nutrition:
Average overall health of teeth and gums : Bainbridge Island:
60.5%Washington:
47.2%
Average BMI : Bainbridge Island:
27.9State:
28.4
People feeling badly about themselves : Bainbridge Island:
17.5%Washington:
20.9%
People not drinking alcohol at all : Bainbridge Island:
7.4%Washington:
10.5%
Average hours sleeping at night : This city:
7.0Washington:
6.8
Overweight people : This city:
35.5%Washington:
32.8%
General health condition : Bainbridge Island:
64.4%Washington:
56.8%
Average condition of hearing : This city:
81.4%State:
79.4%
More about Health and Nutrition of Bainbridge Island, WA Residents
Local government employment and payroll (March 2022)
Function
Full-time employees
Monthly full-time payroll
Average yearly full-time wage
Part-time employees
Monthly part-time payroll
Other Government Administration
40 $295,382 $88,615 6 $2,886 Police Protection - Officers
20 $204,486 $122,692 0 $0 Streets and Highways
20 $153,452 $92,071 0 $0 Financial Administration
13 $114,574 $105,761 0 $0 Other and Unallocable
6 $45,542 $91,084 0 $0 Water Supply
6 $47,646 $95,292 0 $0 Judicial and Legal
5 $44,586 $107,006 2 $10,402 Sewerage
4 $28,384 $85,152 1 $2,944 Police - Other
4 $27,068 $81,204 2 $9,104 Natural Resources
3 $19,968 $79,872 0 $0 Health
1 $6,284 $75,408 0 $0
Totals for Government
122 $987,372 $97,119 11 $25,336
Bainbridge Island government finances - Expenditure in 2017 (per resident):
Construction - Regular Highways: $1,942,000 ($79.28)
Parks and Recreation: $1,705,000 ($69.61)Parking Facilities: $73,000 ($2.98)Police Protection: $14,000 ($0.57)General - Other: $11,000 ($0.45)Current Operations - Central Staff Services: $3,997,000 ($163.18)
Police Protection: $3,838,000 ($156.69)Sewerage: $2,837,000 ($115.82)Regular Highways: $2,127,000 ($86.84)Financial Administration: $1,710,000 ($69.81)Judicial and Legal Services: $1,384,000 ($56.50)General - Other: $1,197,000 ($48.87)Water Utilities: $839,000 ($34.25)Housing and Community Development: $815,000 ($33.27)Parks and Recreation: $502,000 ($20.49)Health - Other: $167,000 ($6.82)General Public Buildings: $118,000 ($4.82)Protective Inspection and Regulation - Other: $94,000 ($3.84)Solid Waste Management: $37,000 ($1.51)Parking Facilities: $10,000 ($0.41)Libraries: $9,000 ($0.37)Correctional Institutions: $2,000 ($0.08)General - Interest on Debt: $1,403,000 ($57.28)
Intergovernmental to Local - Other - Sewerage: $717,000 ($29.27)
Other - Local Fire Protection: $272,000 ($11.10)Other - Water Utilities: $120,000 ($4.90)Other - Police Protection: $88,000 ($3.59)Other - Health - Other: $79,000 ($3.23)Other - General - Other: $74,000 ($3.02)Other - Correctional Institutions: $61,000 ($2.49)Other - Financial Administration: $26,000 ($1.06)Other - Housing and Community Development: $16,000 ($0.65)Other - Central Staff Services: $14,000 ($0.57)Other - Natural Resources - Other: $10,000 ($0.41)Other - Regular Highways: $9,000 ($0.37)Other - Judicial and Legal Services: $1,000 ($0.04)Other Capital Outlay - Police Protection: $225,000 ($9.19)
Regular Highways: $198,000 ($8.08)Parks and Recreation: $83,000 ($3.39)General - Other: $68,000 ($2.78)Total Salaries and Wages: $9,758,000 ($398.38)
Transit Utilities - Interest on Debt: $21,000 ($0.86)
Bainbridge Island government finances - Revenue in 2017 (per resident):
Charges - Sewerage: $3,632,000 ($148.28)
Other: $2,877,000 ($117.46)Parks and Recreation: $1,000 ($0.04)Miscellaneous - Special Assessments: $864,000 ($35.27)
Rents: $390,000 ($15.92)Sale of Property: $339,000 ($13.84)General Revenue - Other: $120,000 ($4.90)Fines and Forfeits: $99,000 ($4.04)Donations From Private Sources: $7,000 ($0.29)Interest Earnings: $0 ($0.00)Revenue - Water Utilities: $1,288,000 ($52.58)
State Intergovernmental - Other: $1,724,000 ($70.38)
Highways: $696,000 ($28.42)General Local Government Support: $311,000 ($12.70)Health and Hospitals: $118,000 ($4.82)Tax - Property: $7,723,000 ($315.30)
General Sales and Gross Receipts: $4,015,000 ($163.92)Public Utilities Sales: $3,594,000 ($146.73)Documentary and Stock Transfer: $2,882,000 ($117.66)Other Selective Sales: $1,135,000 ($46.34)Other License: $744,000 ($30.37)Occupation and Business License - Other: $668,000 ($27.27)Motor Vehicle License: $409,000 ($16.70)Amusements Sales: $1,000 ($0.04)
Bainbridge Island government finances - Debt in 2017 (per resident):
Long Term Debt - Beginning Outstanding - Unspecified Public Purpose: $35,619,000 ($1454.19)
Outstanding Unspecified Public Purpose: $33,225,000 ($1356.45)Retired Unspecified Public Purpose: $4,486,000 ($183.15)Issue, Unspecified Public Purpose: $2,091,000 ($85.37)
8.72% of this county's 2021 resident taxpayers lived in other counties in 2020 ($89,569 average adjusted gross income )
Here:
8.72%Washington average:
7.53%
0.23% of residents moved from foreign countries ($1,775 average AGI )Kitsap County:
0.23%Washington average:
0.05%
Top counties from which taxpayers relocated into this county between 2020 and 2021:
8.34% of this county's 2020 resident taxpayers moved to other counties in 2021 ($88,661 average adjusted gross income )
Here:
8.34%Washington average:
7.40%
0.15% of residents moved to foreign countries ($1,281 average AGI )Kitsap County:
0.15%Washington average:
0.04%
Top counties to which taxpayers relocated from this county between 2020 and 2021:
Businesses in Bainbridge Island, WA
Name Count Name Count
Ace Hardware 1 Nike 2 Best Western 1 Rite Aid 1 Curves 1 Starbucks 1 FedEx 3 Subway 1 GNC 1 U-Haul 1 McDonald's 1 UPS 5 New Balance 1 Vons 1
Strongest AM radio stations in Bainbridge Island:
KKOL (1300 AM; 50 kW; SEATTLE, WA; Owner: INSPIRATION MEDIA, INC.)
KLFE (1590 AM; 10 kW; SEATTLE, WA; Owner: INSPIRATION MEDIA, INC.)
KOMO (1000 AM; 50 kW; SEATTLE, WA; Owner: FISHER BROADCASTING - SEATTLE RADIO, L.L.C.)
KGNW (820 AM; 50 kW; BURIEN-SEATTLE, WA; Owner: INSPIRATION MEDIA, INC.)
KIRO (710 AM; 50 kW; SEATTLE, WA; Owner: ENTERCOM SEATTLE LICENSE, LLC)
KIXI (880 AM; 50 kW; MERCER ISLAND/SEATTL, WA; Owner: BELLEVUE RADIO, INC.)
KTTH (770 AM; 50 kW; SEATTLE, WA; Owner: ENTERCOM SEATTLE LICENSE, LLC)
KYCW (1090 AM; 50 kW; SEATTLE, WA; Owner: INFINITY RADIO SUBSIDIARY OPERATIONS INC.)
KJR (950 AM; 50 kW; SEATTLE, WA)
KCIS (630 AM; 5 kW; EDMONDS, WA; Owner: CRISTA MINISTRIES)
KRKO (1380 AM; 50 kW; EVERETT, WA; Owner: S-R BROADCASTING, CO.)
KBLE (1050 AM; 5 kW; SEATTLE, WA; Owner: SACRED HEART RADIO, INC.)
KKDZ (1250 AM; 5 kW; SEATTLE, WA; Owner: WMAL, INC.)
Strongest FM radio stations in Bainbridge Island:
KQBZ (100.7 FM; SEATTLE, WA; Owner: ENTERCOM SEATTLE LICENSE, LLC)
KISW (99.9 FM; SEATTLE, WA; Owner: ENTERCOM SEATTLE LICENSE, LLC)
KRWM (106.9 FM; BREMERTON, WA; Owner: SEASCAPE RADIO, INC.)
KCMS (105.3 FM; EDMONDS, WA; Owner: CRISTA MINISTRIES, INC.)
K205DD (88.9 FM; BREMERTON, WA; Owner: CALVARY CHAPEL OF TWIN FALLS, INC.)
KMTT (103.7 FM; TACOMA, WA; Owner: ENTERCOM SEATTLE LICENSE, LLC)
KNDD (107.7 FM; SEATTLE, WA; Owner: ENTERCOM SEATTLE LICENSE, LLC)
KYPT (96.5 FM; SEATTLE, WA; Owner: INFINITY RADIO SUBSIDIARY OPERATIONS INC.)
KBSG-FM (97.3 FM; TACOMA, WA; Owner: ENTERCOM SEATTLE LICENSE, LLC)
KUOW (94.9 FM; SEATTLE, WA; Owner: THE UNIVERSITY OF WASHINGTON)
KEXP-FM (90.3 FM; SEATTLE, WA; Owner: UNIVERSITY OF WASHINGTON BOARD OF REGENTS)
KBKS (106.1 FM; TACOMA, WA; Owner: INFINITY RADIO SUBSIDIARY OPERATIONS INC.)
KING-FM (98.1 FM; SEATTLE, WA; Owner: CLASSIC RADIO, INC.)
KLSY-FM (92.5 FM; BELLEVUE, WA; Owner: BELLEVUE RADIO INC.)
KPLU-FM (88.5 FM; TACOMA, WA; Owner: PACIFIC LUTHERAN UNIVERSITY, INC.)
KWJZ (98.9 FM; SEATTLE, WA; Owner: ORCA RADIO, INC.)
KZOK-FM (102.5 FM; SEATTLE, WA; Owner: INFINITY RADIO SUBSIDIARY OPERATIONS INC.)
KMPS-FM (94.1 FM; SEATTLE, WA; Owner: INFINITY RADIO SUBSIDIARY OPERATIONS INC.)
KJR-FM (95.7 FM; SEATTLE, WA; Owner: ACKERLEY MEDIA GROUP, INC.)
KUBE (93.3 FM; SEATTLE, WA; Owner: ACKERLEY MEDIA GROUP, INC.)
TV broadcast stations around Bainbridge Island:
KING-TV (Channel 5; SEATTLE, WA; Owner: KING BROADCASTING COMPANY)
KSTW (Channel 11; TACOMA, WA; Owner: UPN TELEVISION STATIONS INC.)
KOMO-TV (Channel 4; SEATTLE, WA; Owner: FISHER BROADCASTING - SEATTLE TV, L.L.C.)
KIRO-TV (Channel 7; SEATTLE, WA; Owner: KIRO-TV HOLDINGS, INC.)
K58DP (Channel 58; SEATTLE, WA; Owner: WORD OF GOD FELLOWSHIP, INC.)
KTWB-TV (Channel 22; SEATTLE, WA; Owner: TRIBUNE TELEVISION HOLDINGS, INC.)
K57HB (Channel 57; EUREKA, CA; Owner: MS COMMUNICATIONS, LLC)
KCTS-TV (Channel 9; SEATTLE, WA; Owner: KCTS TELEVISION)
KONG-TV (Channel 16; EVERETT, WA; Owner: KONG-TV, INC.)
KCPQ (Channel 13; TACOMA, WA; Owner: TRIBUNE TELEVISION NORTHWEST, INC.)
K68DL (Channel 68; SEATTLE, WA; Owner: THREE ANGELS BROADCASTING NETWORK)
KHCV (Channel 45; SEATTLE, WA; Owner: NORTH PACIFIC INTERNATIONAL TELEVISION, INC.)
KWPX (Channel 33; BELLEVUE, WA; Owner: PAXSON COMMUNICATIONS LICENSE COMPANY, LLC)
KWDK (Channel 56; TACOMA, WA; Owner: PUGET SOUND EDUCATIONAL TV, INC.)
KTBW-TV (Channel 20; TACOMA, WA; Owner: TRINITY BROADCASTING OF WASHINGTON)
KBTC-TV (Channel 28; TACOMA, WA; Owner: BATES TECHNICAL COLLEGE)
K54AO (Channel 54; BREMERTON, WA; Owner: KIRO-TV HOLDINGS, INC.)
K02EO (Channel 2; SEATTLE, WA; Owner: KIRO-TV HOLDINGS, INC.)
National Bridge Inventory (NBI) Statistics 7 Number of bridges249ft / 75.6m Total length $42,622,000 Total costs59,603 Total average daily traffic1,815 Total average daily truck traffic
Home Mortgage Disclosure Act Aggregated Statistics For Year 2009(Based on 4 full tracts) A) FHA, FSA/RHS & VA B) Conventional C) Refinancings D) Home Improvement Loans F) Non-occupant Loans on G) Loans On Manufactured Number Average Value Number Average Value Number Average Value Number Average Value Number Average Value Number Average Value
LOANS ORIGINATED 22 $374,364 199 $387,628 1,124 $318,343 39 $231,026 90 $307,800 5 $197,200 APPLICATIONS APPROVED, NOT ACCEPTED 1 $294,000 24 $421,292 111 $345,423 4 $357,000 3 $322,667 0 $0 APPLICATIONS DENIED 3 $378,667 31 $412,613 210 $388,681 17 $114,059 21 $344,762 4 $180,000 APPLICATIONS WITHDRAWN 3 $402,333 29 $506,483 155 $348,968 4 $215,500 18 $289,556 2 $201,500 FILES CLOSED FOR INCOMPLETENESS 0 $0 1 $417,000 32 $379,188 2 $117,000 4 $317,000 0 $0
Aggregated Statistics For Year 2008(Based on 4 full tracts) A) FHA, FSA/RHS & VA B) Conventional C) Refinancings D) Home Improvement Loans F) Non-occupant Loans on G) Loans On Manufactured Number Average Value Number Average Value Number Average Value Number Average Value Number Average Value Number Average Value
LOANS ORIGINATED 14 $396,357 171 $466,906 433 $378,979 31 $235,806 58 $590,397 5 $267,400 APPLICATIONS APPROVED, NOT ACCEPTED 0 $0 34 $406,324 65 $404,215 6 $143,333 8 $390,750 1 $153,000 APPLICATIONS DENIED 1 $312,000 47 $490,617 125 $524,656 24 $255,708 26 $508,654 4 $197,000 APPLICATIONS WITHDRAWN 4 $360,750 30 $486,233 115 $399,087 7 $231,000 18 $458,722 2 $257,500 FILES CLOSED FOR INCOMPLETENESS 0 $0 7 $470,571 15 $459,933 4 $74,000 1 $400,000 0 $0
Aggregated Statistics For Year 2007(Based on 4 full tracts) A) FHA, FSA/RHS & VA B) Conventional C) Refinancings D) Home Improvement Loans E) Loans on Dwellings For 5+ Families F) Non-occupant Loans on G) Loans On Manufactured Number Average Value Number Average Value Number Average Value Number Average Value Number Average Value Number Average Value Number Average Value
LOANS ORIGINATED 1 $245,000 505 $448,059 561 $447,622 55 $178,036 2 $327,500 127 $370,157 11 $280,909 APPLICATIONS APPROVED, NOT ACCEPTED 0 $0 64 $473,188 66 $462,515 13 $236,385 0 $0 19 $531,895 0 $0 APPLICATIONS DENIED 0 $0 94 $546,745 158 $550,987 17 $135,176 0 $0 28 $399,821 9 $221,889 APPLICATIONS WITHDRAWN 0 $0 42 $474,667 91 $443,956 7 $95,429 0 $0 10 $442,400 2 $271,000 FILES CLOSED FOR INCOMPLETENESS 0 $0 10 $645,900 32 $450,688 3 $194,333 0 $0 5 $713,600 0 $0
Aggregated Statistics For Year 2006(Based on 4 full tracts) A) FHA, FSA/RHS & VA B) Conventional C) Refinancings D) Home Improvement Loans F) Non-occupant Loans on G) Loans On Manufactured Number Average Value Number Average Value Number Average Value Number Average Value Number Average Value Number Average Value
LOANS ORIGINATED 1 $388,000 617 $364,323 595 $406,903 61 $175,508 232 $348,284 7 $195,857 APPLICATIONS APPROVED, NOT ACCEPTED 0 $0 100 $362,600 75 $407,173 10 $182,800 26 $305,885 1 $224,000 APPLICATIONS DENIED 0 $0 76 $416,026 146 $415,699 18 $201,611 30 $443,300 7 $182,000 APPLICATIONS WITHDRAWN 0 $0 66 $362,212 137 $382,066 6 $286,167 28 $333,893 2 $222,500 FILES CLOSED FOR INCOMPLETENESS 0 $0 21 $390,238 22 $326,227 4 $78,250 4 $248,500 0 $0
Aggregated Statistics For Year 2005(Based on 4 full tracts) A) FHA, FSA/RHS & VA B) Conventional C) Refinancings D) Home Improvement Loans E) Loans on Dwellings For 5+ Families F) Non-occupant Loans on G) Loans On Manufactured Number Average Value Number Average Value Number Average Value Number Average Value Number Average Value Number Average Value Number Average Value
LOANS ORIGINATED 2 $302,500 558 $386,292 704 $346,955 68 $175,515 1 $5,213,000 154 $321,175 13 $193,615 APPLICATIONS APPROVED, NOT ACCEPTED 0 $0 45 $378,911 88 $356,773 17 $343,235 0 $0 12 $401,833 1 $175,000 APPLICATIONS DENIED 0 $0 64 $395,422 174 $379,799 29 $152,069 0 $0 18 $403,500 7 $211,429 APPLICATIONS WITHDRAWN 1 $216,000 69 $437,261 162 $366,315 23 $186,435 0 $0 22 $458,318 4 $189,500 FILES CLOSED FOR INCOMPLETENESS 0 $0 13 $308,846 48 $333,896 2 $229,500 0 $0 7 $270,143 2 $152,500
Aggregated Statistics For Year 2004(Based on 4 full tracts) A) FHA, FSA/RHS & VA B) Conventional C) Refinancings D) Home Improvement Loans E) Loans on Dwellings For 5+ Families F) Non-occupant Loans on G) Loans On Manufactured Number Average Value Number Average Value Number Average Value Number Average Value Number Average Value Number Average Value Number Average Value
LOANS ORIGINATED 3 $202,000 616 $312,235 789 $306,490 64 $147,922 5 $823,000 132 $273,273 15 $150,400 APPLICATIONS APPROVED, NOT ACCEPTED 0 $0 76 $317,171 102 $323,039 11 $167,182 0 $0 11 $352,091 1 $326,000 APPLICATIONS DENIED 0 $0 93 $315,538 192 $325,172 27 $213,111 0 $0 32 $241,219 11 $150,364 APPLICATIONS WITHDRAWN 0 $0 52 $323,000 181 $312,188 16 $133,750 0 $0 10 $291,100 4 $166,750 FILES CLOSED FOR INCOMPLETENESS 0 $0 13 $387,692 34 $325,353 4 $216,000 0 $0 2 $117,000 0 $0
Aggregated Statistics For Year 2003(Based on 4 full tracts) A) FHA, FSA/RHS & VA B) Conventional C) Refinancings D) Home Improvement Loans E) Loans on Dwellings For 5+ Families F) Non-occupant Loans on Number Average Value Number Average Value Number Average Value Number Average Value Number Average Value Number Average Value
LOANS ORIGINATED 2 $216,500 518 $298,317 2,213 $254,067 37 $86,027 2 $254,000 156 $223,045 APPLICATIONS APPROVED, NOT ACCEPTED 0 $0 67 $263,075 193 $269,021 10 $37,600 0 $0 18 $234,000 APPLICATIONS DENIED 1 $103,000 71 $332,704 269 $299,375 13 $41,692 0 $0 28 $370,143 APPLICATIONS WITHDRAWN 0 $0 47 $340,383 188 $290,660 5 $35,400 0 $0 10 $272,200 FILES CLOSED FOR INCOMPLETENESS 0 $0 13 $380,077 51 $291,333 3 $62,000 0 $0 3 $380,667
Aggregated Statistics For Year 2002(Based on 4 full tracts) A) FHA, FSA/RHS & VA B) Conventional C) Refinancings D) Home Improvement Loans E) Loans on Dwellings For 5+ Families F) Non-occupant Loans on Number Average Value Number Average Value Number Average Value Number Average Value Number Average Value Number Average Value
LOANS ORIGINATED 7 $186,571 477 $263,407 1,442 $258,990 35 $57,257 2 $1,265,000 107 $216,944 APPLICATIONS APPROVED, NOT ACCEPTED 0 $0 68 $469,838 189 $275,857 10 $49,600 0 $0 20 $202,650 APPLICATIONS DENIED 2 $225,000 45 $205,800 162 $278,920 8 $36,875 0 $0 17 $194,176 APPLICATIONS WITHDRAWN 2 $188,500 43 $241,163 130 $276,823 4 $43,750 1 $14,625,000 19 $202,632 FILES CLOSED FOR INCOMPLETENESS 0 $0 12 $198,667 72 $293,792 0 $0 0 $0 3 $197,333
Aggregated Statistics For Year 2001(Based on 4 full tracts) A) FHA, FSA/RHS & VA B) Conventional C) Refinancings D) Home Improvement Loans E) Loans on Dwellings For 5+ Families F) Non-occupant Loans on Number Average Value Number Average Value Number Average Value Number Average Value Number Average Value Number Average Value
LOANS ORIGINATED 3 $174,667 513 $274,602 1,073 $236,508 82 $51,280 1 $4,800,000 91 $203,934 APPLICATIONS APPROVED, NOT ACCEPTED 2 $138,000 56 $267,696 107 $241,458 12 $40,667 0 $0 6 $254,167 APPLICATIONS DENIED 0 $0 63 $290,159 192 $270,365 21 $60,095 0 $0 17 $205,529 APPLICATIONS WITHDRAWN 0 $0 69 $265,565 140 $233,536 11 $44,091 0 $0 11 $259,818 FILES CLOSED FOR INCOMPLETENESS 0 $0 12 $318,167 48 $274,583 1 $88,000 0 $0 2 $131,000
Aggregated Statistics For Year 2000(Based on 4 full tracts) A) FHA, FSA/RHS & VA B) Conventional C) Refinancings D) Home Improvement Loans E) Loans on Dwellings For 5+ Families F) Non-occupant Loans on Number Average Value Number Average Value Number Average Value Number Average Value Number Average Value Number Average Value
LOANS ORIGINATED 3 $155,333 476 $257,326 237 $201,511 112 $43,580 1 $130,000 50 $205,600 APPLICATIONS APPROVED, NOT ACCEPTED 0 $0 57 $282,193 52 $196,462 15 $34,667 0 $0 3 $125,000 APPLICATIONS DENIED 1 $102,000 74 $237,473 95 $194,863 27 $30,778 0 $0 18 $245,278 APPLICATIONS WITHDRAWN 1 $102,000 37 $256,973 49 $185,061 11 $80,727 0 $0 9 $251,333 FILES CLOSED FOR INCOMPLETENESS 0 $0 7 $153,571 20 $327,500 4 $29,000 0 $0 0 $0
Aggregated Statistics For Year 1999(Based on 1 full and 3 partial tracts) A) FHA, FSA/RHS & VA B) Conventional C) Refinancings D) Home Improvement Loans F) Non-occupant Loans on Number Average Value Number Average Value Number Average Value Number Average Value Number Average Value
LOANS ORIGINATED 4 $170,930 390 $238,003 410 $210,056 100 $52,560 52 $196,225 APPLICATIONS APPROVED, NOT ACCEPTED 1 $124,680 51 $259,800 59 $222,196 10 $43,315 9 $171,112 APPLICATIONS DENIED 0 $0 59 $190,471 90 $214,381 16 $28,215 14 $184,810 APPLICATIONS WITHDRAWN 1 $122,740 37 $222,500 49 $234,584 5 $84,198 5 $192,948 FILES CLOSED FOR INCOMPLETENESS 0 $0 5 $204,812 25 $194,515 1 $9,690 3 $237,320
Detailed HMDA statistics for the following Tracts:
0907.00
, 0908.00 , 0909.00 , 0910.00
Private Mortgage Insurance Companies Aggregated Statistics For Year 2009(Based on 4 full tracts) A) Conventional B) Refinancings C) Non-occupant Loans on Number Average Value Number Average Value Number Average Value
LOANS ORIGINATED 16 $350,250 8 $355,500 0 $0 APPLICATIONS APPROVED, NOT ACCEPTED 6 $385,000 1 $398,000 1 $298,000 APPLICATIONS DENIED 3 $294,667 1 $352,000 0 $0 APPLICATIONS WITHDRAWN 4 $387,750 0 $0 0 $0 FILES CLOSED FOR INCOMPLETENESS 0 $0 0 $0 0 $0
Aggregated Statistics For Year 2008(Based on 4 full tracts) A) Conventional B) Refinancings C) Non-occupant Loans on Number Average Value Number Average Value Number Average Value
LOANS ORIGINATED 9 $433,444 8 $393,250 2 $375,500 APPLICATIONS APPROVED, NOT ACCEPTED 4 $524,500 0 $0 0 $0 APPLICATIONS DENIED 1 $531,000 0 $0 0 $0 APPLICATIONS WITHDRAWN 1 $364,000 0 $0 0 $0 FILES CLOSED FOR INCOMPLETENESS 1 $344,000 0 $0 1 $344,000
Aggregated Statistics For Year 2007(Based on 4 full tracts) A) Conventional B) Refinancings C) Non-occupant Loans on Number Average Value Number Average Value Number Average Value
LOANS ORIGINATED 14 $345,714 7 $436,571 0 $0 APPLICATIONS APPROVED, NOT ACCEPTED 5 $516,200 1 $410,000 2 $295,500 APPLICATIONS DENIED 0 $0 0 $0 0 $0 APPLICATIONS WITHDRAWN 1 $356,000 0 $0 1 $356,000 FILES CLOSED FOR INCOMPLETENESS 0 $0 0 $0 0 $0
Aggregated Statistics For Year 2006(Based on 4 full tracts) A) Conventional B) Refinancings C) Non-occupant Loans on D) Loans On Manufactured Number Average Value Number Average Value Number Average Value Number Average Value
LOANS ORIGINATED 7 $330,571 4 $460,000 3 $251,000 1 $252,000 APPLICATIONS APPROVED, NOT ACCEPTED 3 $381,667 4 $444,750 1 $234,000 0 $0 APPLICATIONS DENIED 0 $0 1 $960,000 0 $0 0 $0 APPLICATIONS WITHDRAWN 0 $0 1 $237,000 0 $0 0 $0 FILES CLOSED FOR INCOMPLETENESS 0 $0 0 $0 0 $0 0 $0
Aggregated Statistics For Year 2005(Based on 4 full tracts) A) Conventional B) Refinancings C) Non-occupant Loans on D) Loans On Manufactured Number Average Value Number Average Value Number Average Value Number Average Value
LOANS ORIGINATED 19 $348,947 10 $352,400 2 $260,000 1 $220,000 APPLICATIONS APPROVED, NOT ACCEPTED 7 $275,143 1 $476,000 1 $258,000 0 $0 APPLICATIONS DENIED 1 $254,000 0 $0 0 $0 0 $0 APPLICATIONS WITHDRAWN 2 $370,000 0 $0 1 $391,000 0 $0 FILES CLOSED FOR INCOMPLETENESS 0 $0 0 $0 0 $0 0 $0
Aggregated Statistics For Year 2004(Based on 4 full tracts) A) Conventional B) Refinancings C) Non-occupant Loans on Number Average Value Number Average Value Number Average Value
LOANS ORIGINATED 36 $296,083 10 $329,500 8 $294,750 APPLICATIONS APPROVED, NOT ACCEPTED 11 $284,545 4 $307,000 3 $142,333 APPLICATIONS DENIED 0 $0 0 $0 0 $0 APPLICATIONS WITHDRAWN 4 $307,000 0 $0 1 $391,000 FILES CLOSED FOR INCOMPLETENESS 0 $0 1 $211,000 0 $0
Aggregated Statistics For Year 2003(Based on 4 full tracts) A) Conventional B) Refinancings C) Non-occupant Loans on Number Average Value Number Average Value Number Average Value
LOANS ORIGINATED 47 $284,319 27 $264,444 9 $240,667 APPLICATIONS APPROVED, NOT ACCEPTED 13 $327,692 12 $297,583 1 $236,000 APPLICATIONS DENIED 1 $249,000 0 $0 0 $0 APPLICATIONS WITHDRAWN 0 $0 2 $250,500 0 $0 FILES CLOSED FOR INCOMPLETENESS 0 $0 0 $0 0 $0
Aggregated Statistics For Year 2002(Based on 4 full tracts) A) Conventional B) Refinancings C) Non-occupant Loans on Number Average Value Number Average Value Number Average Value
LOANS ORIGINATED 56 $281,375 26 $321,769 4 $135,250 APPLICATIONS APPROVED, NOT ACCEPTED 23 $285,783 8 $306,000 3 $248,000 APPLICATIONS DENIED 1 $342,000 1 $298,000 0 $0 APPLICATIONS WITHDRAWN 4 $258,250 3 $270,667 1 $156,000 FILES CLOSED FOR INCOMPLETENESS 0 $0 0 $0 0 $0
Aggregated Statistics For Year 2001(Based on 4 full tracts) A) Conventional B) Refinancings C) Non-occupant Loans on Number Average Value Number Average Value Number Average Value
LOANS ORIGINATED 52 $254,269 26 $261,654 1 $273,000 APPLICATIONS APPROVED, NOT ACCEPTED 5 $357,400 8 $232,375 0 $0 APPLICATIONS DENIED 5 $259,800 3 $401,000 0 $0 APPLICATIONS WITHDRAWN 3 $343,333 2 $209,000 1 $516,000 FILES CLOSED FOR INCOMPLETENESS 0 $0 0 $0 0 $0
Aggregated Statistics For Year 2000(Based on 4 full tracts) A) Conventional B) Refinancings C) Non-occupant Loans on Number Average Value Number Average Value Number Average Value
LOANS ORIGINATED 59 $237,576 11 $229,727 5 $157,000 APPLICATIONS APPROVED, NOT ACCEPTED 12 $259,083 0 $0 0 $0 APPLICATIONS DENIED 2 $294,500 1 $246,000 0 $0 APPLICATIONS WITHDRAWN 2 $150,000 0 $0 0 $0 FILES CLOSED FOR INCOMPLETENESS 1 $300,000 0 $0 0 $0
Aggregated Statistics For Year 1999(Based on 1 full and 3 partial tracts) A) Conventional B) Refinancings C) Non-occupant Loans on Number Average Value Number Average Value Number Average Value
LOANS ORIGINATED 60 $235,590 10 $216,584 3 $173,793 APPLICATIONS APPROVED, NOT ACCEPTED 4 $267,052 4 $234,250 0 $0 APPLICATIONS DENIED 1 $147,940 2 $160,235 0 $0 APPLICATIONS WITHDRAWN 2 $214,375 2 $192,000 0 $0 FILES CLOSED FOR INCOMPLETENESS 0 $0 1 $428,950 0 $0
Detailed PMIC statistics for the following Tracts:
0907.00
, 0908.00 , 0909.00 , 0910.00 Fire-safe hotels and motels in Bainbridge Island, Washington:
Island Country Inn, 920 Hildebrand Lane NE, Bainbridge Island, Washington 98110 Phone: (206) 842-6861, Fax: (206) 842-9808
Best Western Bainbridge Island Suites, 350 High School Rd NE, Bainbridge Island, Washington 98110 Phone: (206) 855-9666, Fax: (206) 855-9790
All 2 fire-safe hotels and motels in Bainbridge Island, Washington
Most common first names in Bainbridge Island, WA among deceased individuals Name Count Lived (average)
John 107 78.5 years Robert 87 74.5 years William 76 77.0 years Mary 70 81.8 years Helen 58 83.9 years James 54 78.1 years Charles 53 78.3 years Ruth 53 84.1 years Margaret 50 82.5 years George 46 80.3 years
Most common last names in Bainbridge Island, WA among deceased individuals Last name Count Lived (average)
Smith 38 78.4 years Johnson 36 78.1 years Anderson 21 81.8 years Thompson 19 79.9 years Jones 18 83.1 years Allen 17 81.1 years Brown 17 80.3 years Hansen 16 78.2 years Peterson 15 80.2 years Nelson 15 79.3 years
Bainbridge Island compared to Washington state average:
Median household income above state average. Median house value above state average. Unemployed percentage significantly below state average. Black race population percentage significantly below state average. Hispanic race population percentage significantly below state average. Median age significantly above state average. Foreign-born population percentage below state average. Renting percentage below state average. Length of stay since moving in above state average. Percentage of population with a bachelor's degree or higher significantly above state average. Bainbridge Island on our top lists :
#17 on the list of "Top 101 cities with the most people taking a motorcycle to work (population 5,000+)"
#33 on the list of "Top 101 cities with the highest percentage of workers working at home, population 5,000+"
#40 on the list of "Top 101 cities with the lowest number of robberies per 100,000 residents (population 5,000+)"
#44 on the list of "Top 101 cities with the most people taking a ferryboat to work (population 5,000+)"
#54 on the list of "Top 101 cities with the lowest number of police officers per 1000 residents (population 5,000+)"
#64 on the list of "Top 101 cities with largest percentage of males in occupations: architecture and engineering occupations (population 5,000+)"
#17 on the list of "Top 101 counties with the lowest Particulate Matter (PM2.5 ) Annual air pollution readings in 2012 (µg/m3 )"
#26 on the list of "Top 101 counties with the highest percentage of residents relocating from foreign countries between 2010 and 2011"
#36 on the list of "Top 101 counties with the highest average weight of females"
#38 on the list of "Top 101 counties with the highest percentage of residents relocating to foreign countries in 2011 (pop. 50,000+)"
#42 on the list of "Top 101 counties with the highest percentage of residents that exercised in the past month"
Top Patent Applicants
Alistair K. Chan (120)
Bradley E. Marshall (48)
Bradley Eugene Marshall (25)
Julia E. Novak (22)
William C. Knight (22)
Joshua Nordberg (21)
Dan Alan Preston (21)
Brett R. Taylor (21)
Raymond W. Riley (20)
Ehren Brav (17)
Total of 1223 patent applications in 2008-2024.


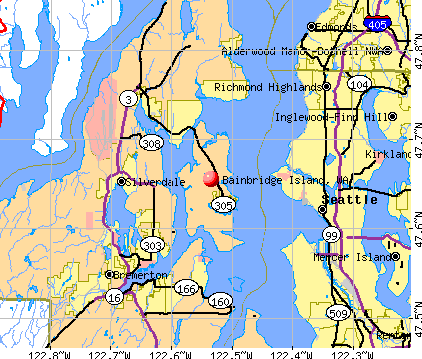


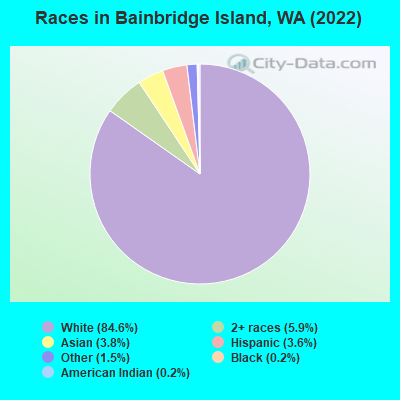
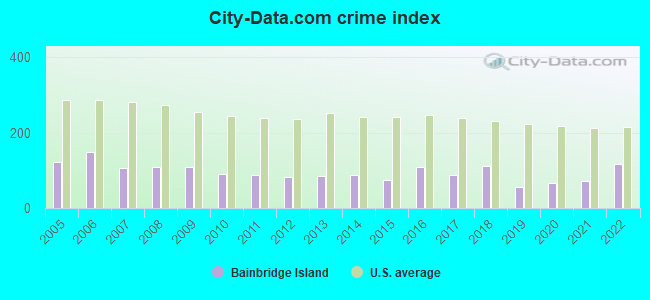
 Recent articles from our blog. Our writers, many of them Ph.D. graduates or candidates, create easy-to-read articles on a wide variety of topics.

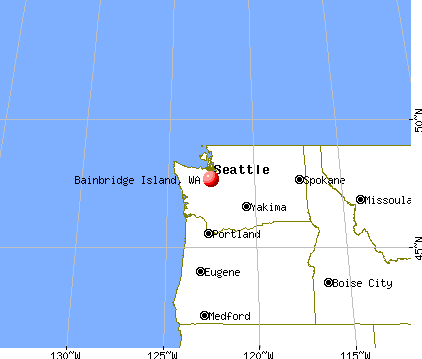
 (9.6 miles
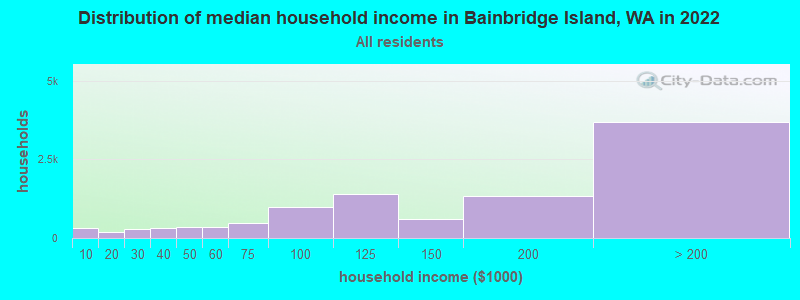
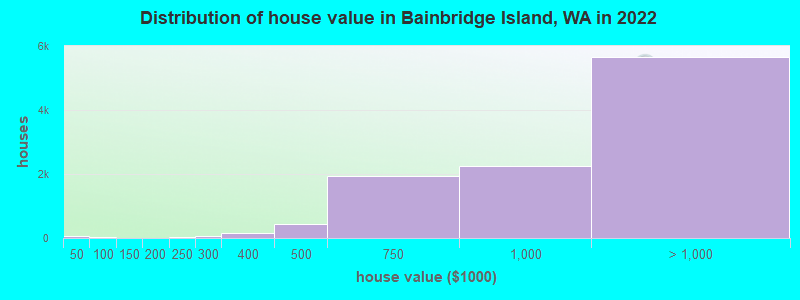
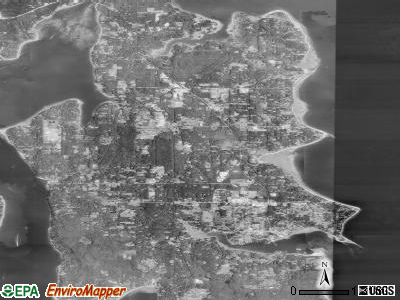
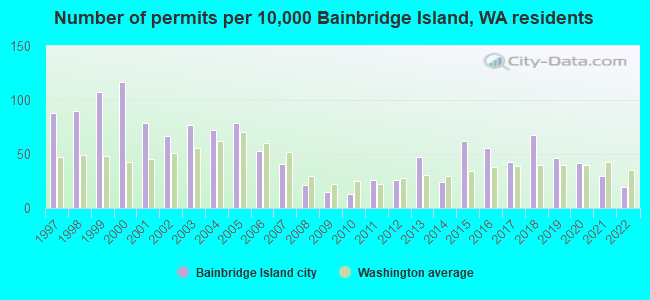
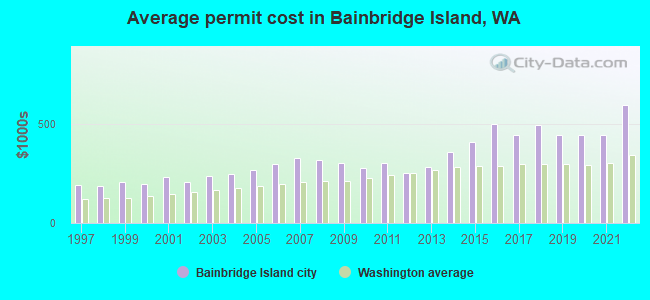
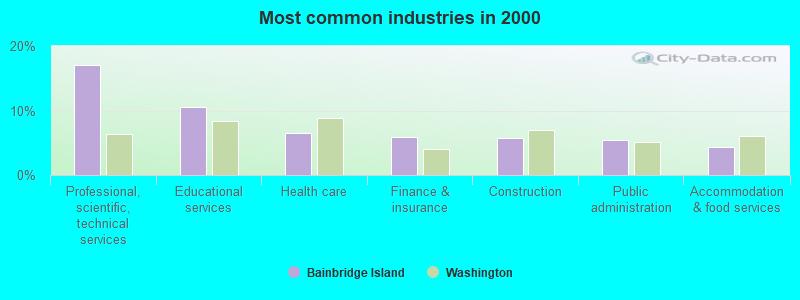
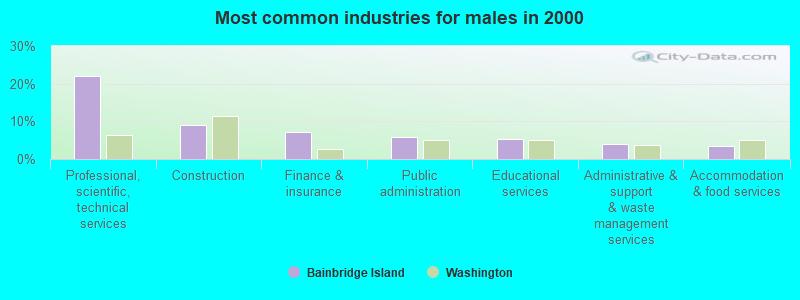
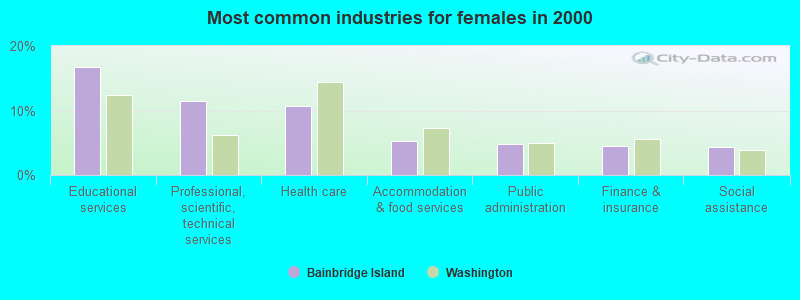
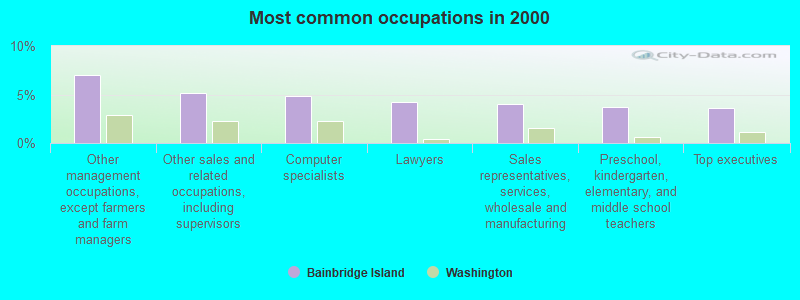
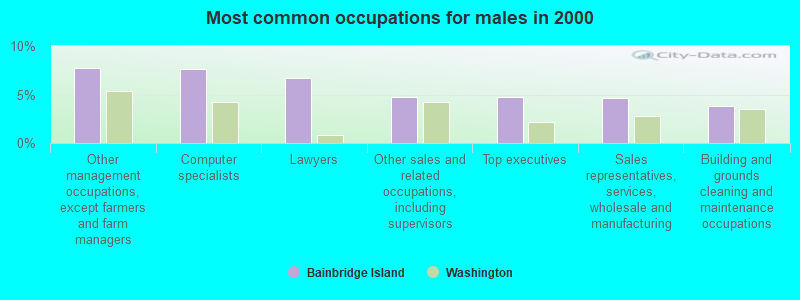
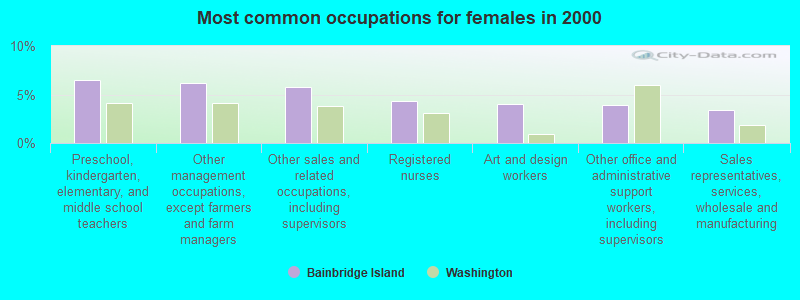
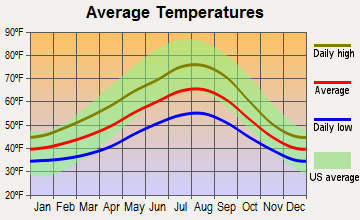
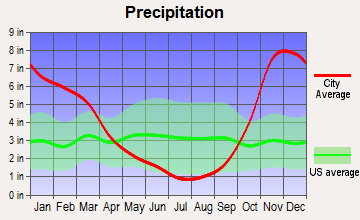
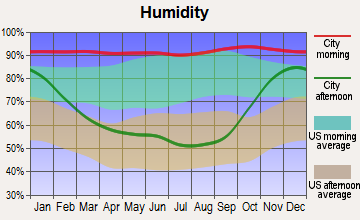
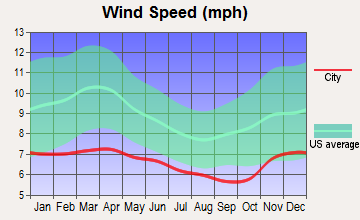
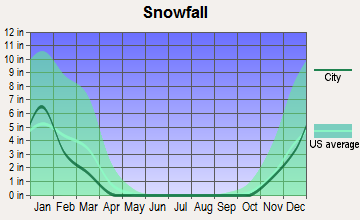
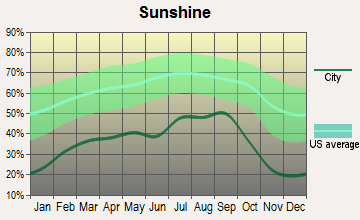
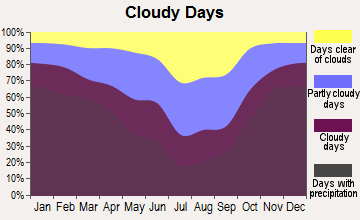
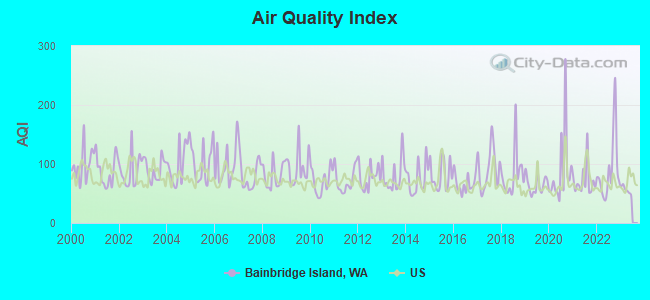
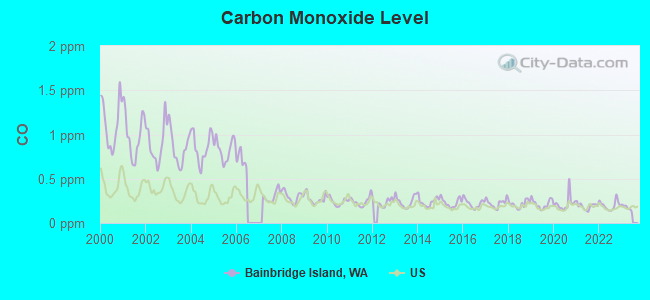
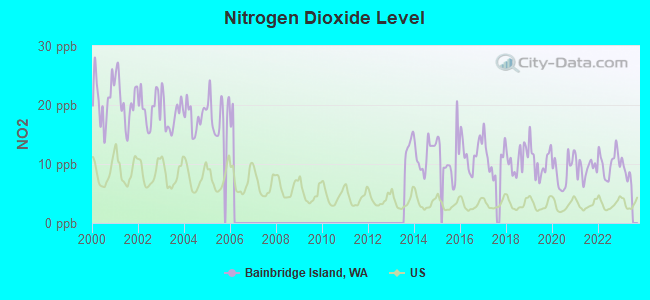
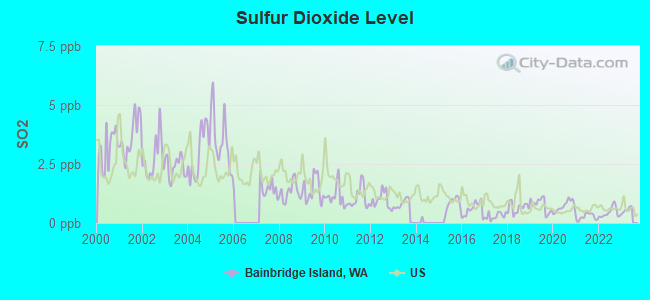
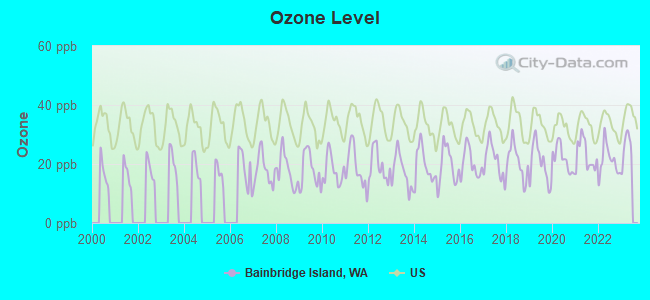
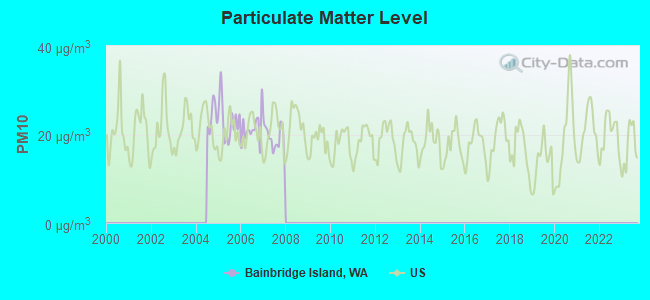
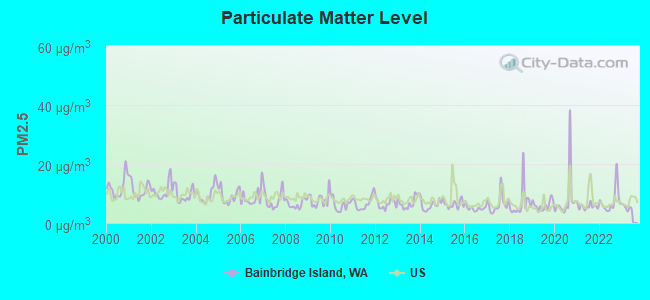
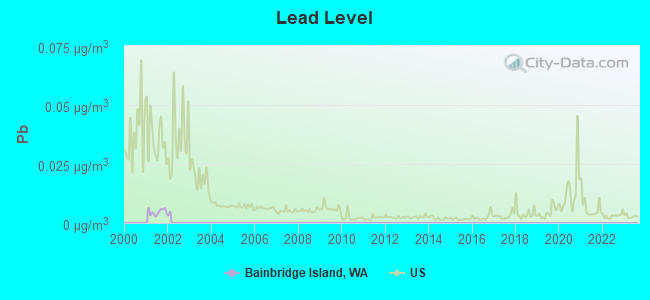
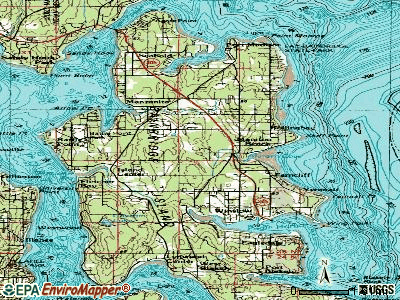
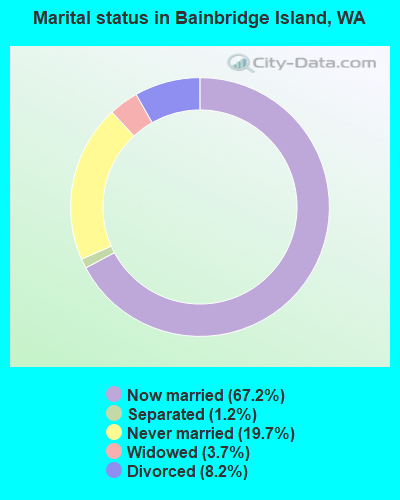
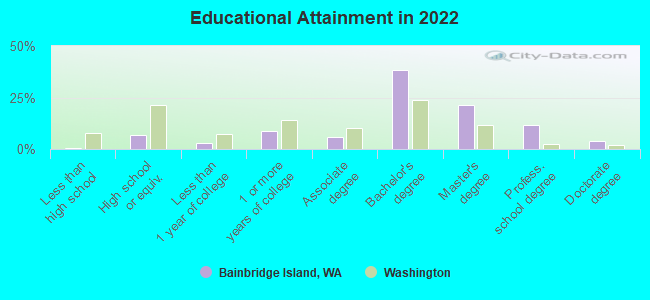
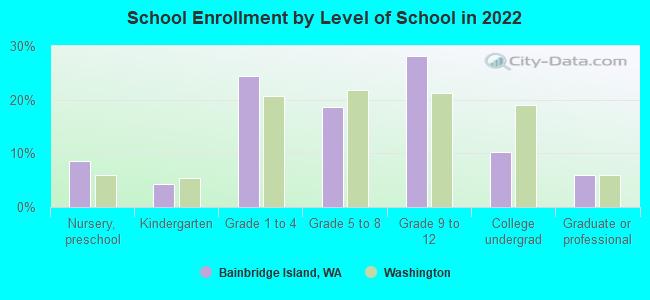
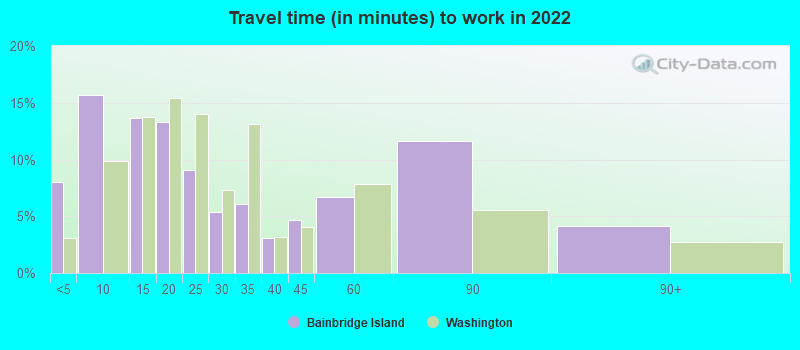
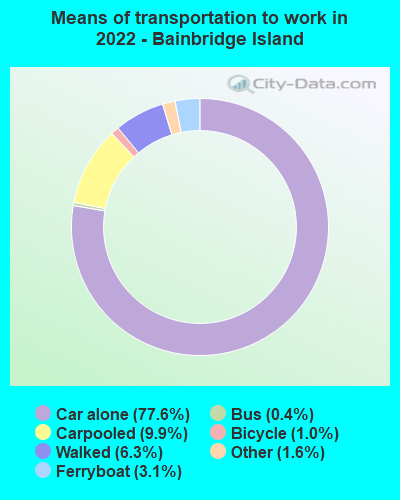
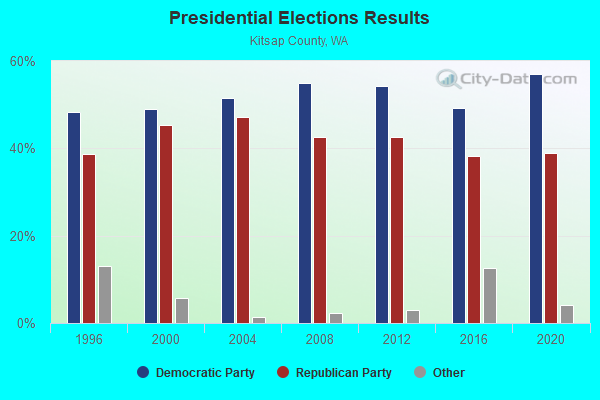
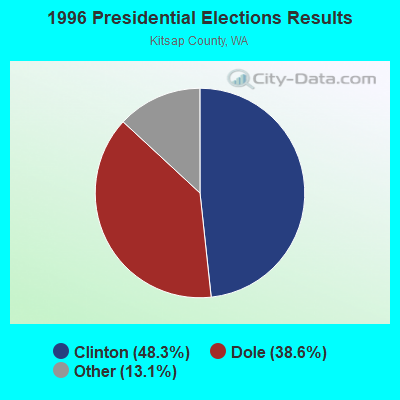
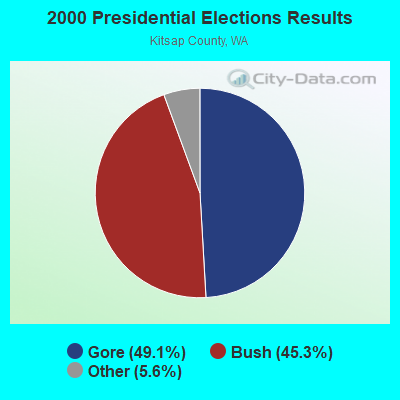
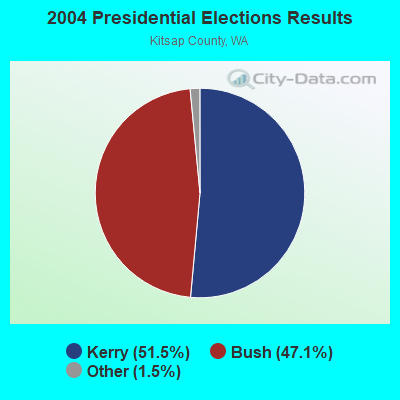
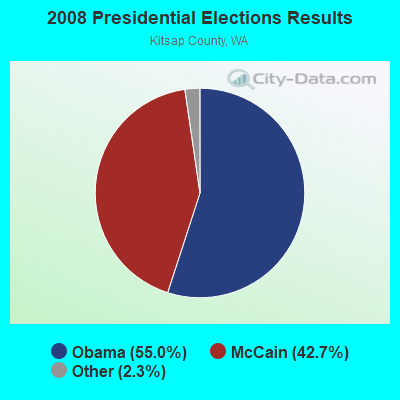
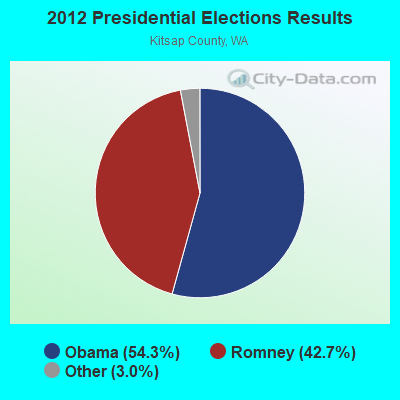

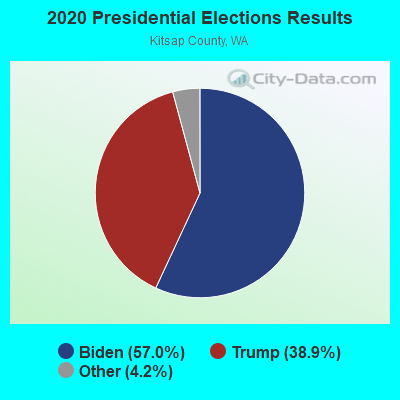
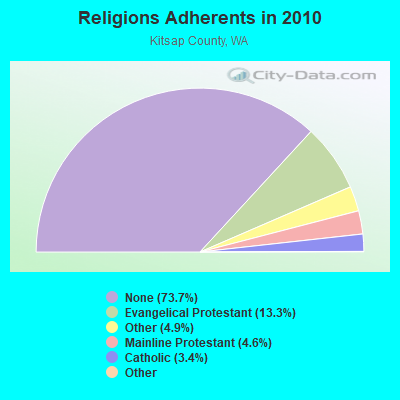
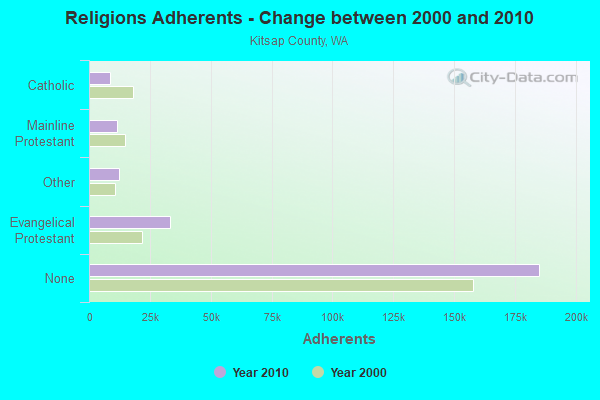
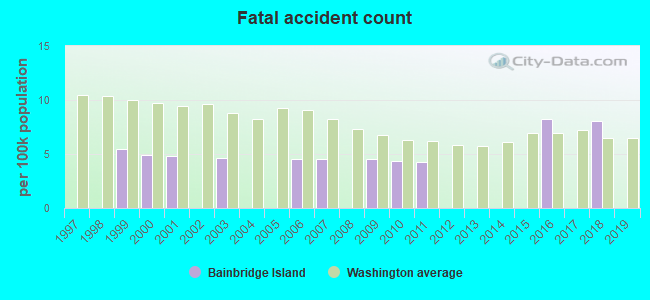
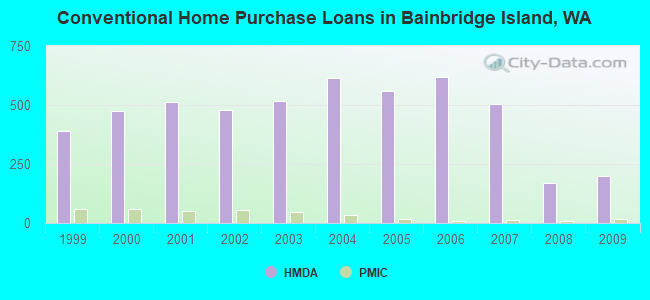
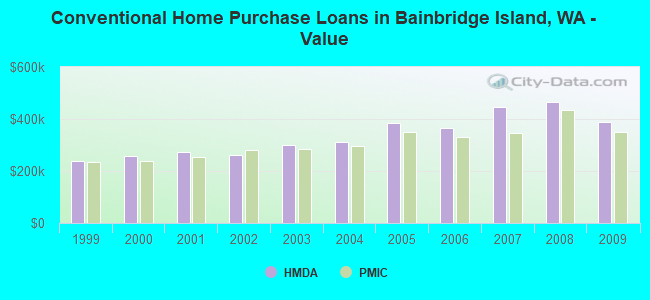
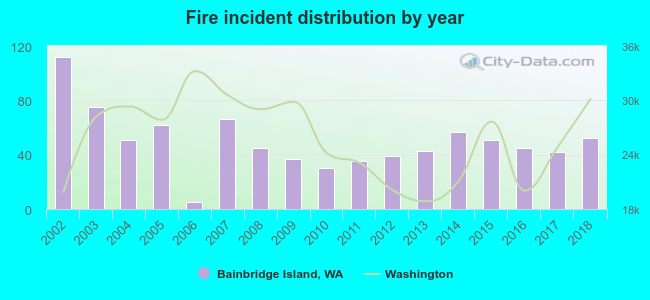 According to the data from the years 2002 - 2018 the average number of fire incidents per year is 50. The highest number of reported fires - 112 took place in 2002, and the least - 5 in 2006. The data has a declining trend.
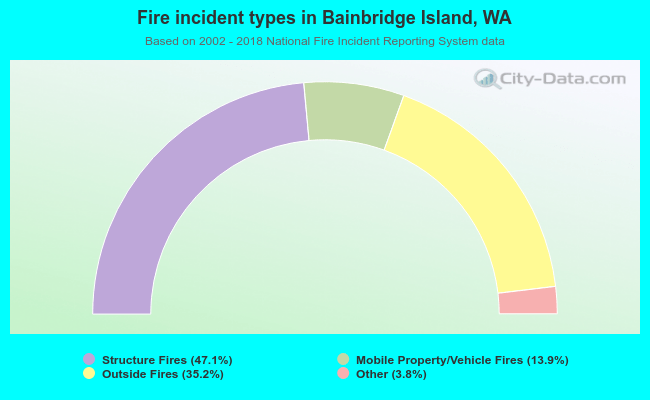 When looking into fire subcategories, the most reports belonged to: Structure Fires (47.1%), and Outside Fires (35.2%).