Estimated zip code population in 2022: 34,870 Zip code population in 2010: 30,842 Zip code population in 2000: 28,557
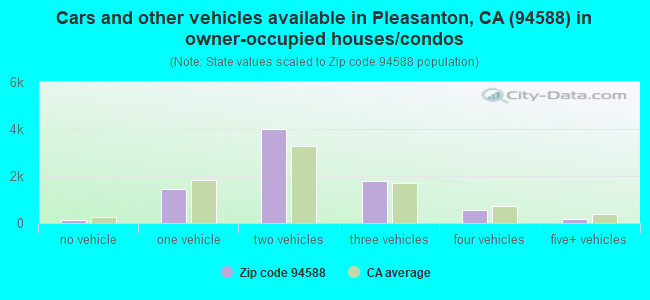
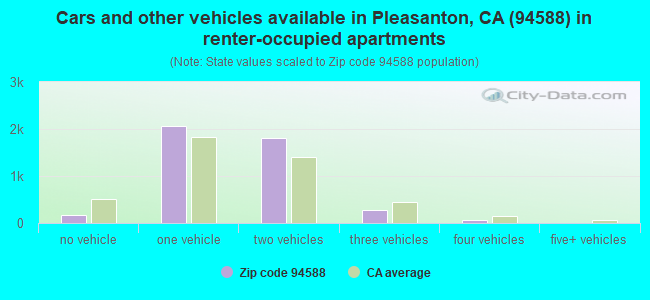
Houses and condos: 12,777 Renter-occupied apartments: 4,386
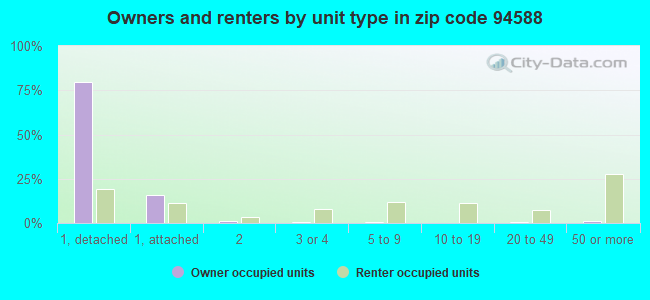
% of renters here:
35%
State:
44%
March 2022 cost of living index in zip code 94588: 120.1 (high, U.S. average is 100)
Land area: 32.6 sq. mi. Water area: 0.0 sq. mi.
Population density: 1,068 people per square mile
(low).
OSM Map
General Map
Google Map
MSN Map
OSM Map
General Map
Google Map
MSN Map
OSM Map
General Map
Google Map
MSN Map
OSM Map
General Map
Google Map
MSN Map
Please wait while loading the map...
Real estate property taxes paid for housing units in 2022:
This zip code:
0.7% ($8,966)
California:
0.7% ($4,831)
Median real estate property taxes paid for housing units with mortgages in 2022: $9,605 (0.7%) Median real estate property taxes paid for housing units with no mortgage in 2022: $6,636 (0.5%)
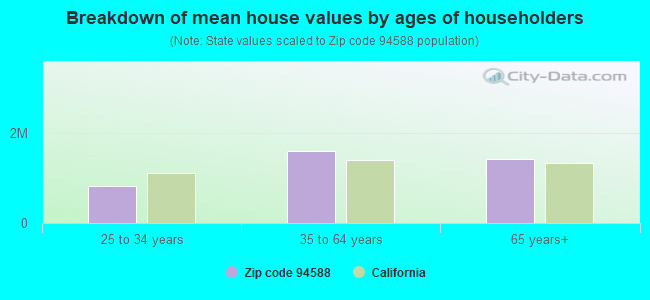
Estimated median house/condo value in 2022: $1,339,720
94588:
$1,339,720
California:
$715,900
According to our research of California and other state lists, there were 7 registered sex offenders living in 94588 zip code as of April 27, 2024. The ratio of all residents to sex offenders in zip code 94588 is 5,015 to 1. The ratio of registered sex offenders to all residents in this zip code is much lower than the state average.
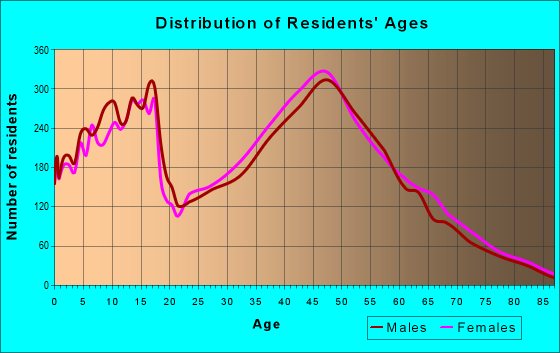
Median resident age:
This zip code:
39.9 years
California median age:
37.9 years
Average household size:
This zip code:
2.8 people
California:
2.8 people
Averages for the 2020 tax year for zip code 94588, filed in 2021:
Average Adjusted Gross Income (AGI) in 2020: $191,353 (Individual Income Tax Returns)
Here:
$191,353
State:
$95,910
Salary/wage: $164,464 (reported on 82.3% of returns)
Here:
$164,464
State:
$77,331
(% of AGI for various income ranges: 1151.9% for AGIs below $25k, 3768.3% for AGIs $25k-50k, 6766.5% for AGIs $50k-75k, 10425.1% for AGIs $75k-100k, 20190.2% for AGIs $100k-200k, 115027.8% for AGIs over 200k)
Taxable interest for individuals: $2,733 (reported on 55.2% of returns)
This zip code:
$2,733
California:
$2,294
(% of AGI for various income ranges: 28.9% for AGIs below $25k, 48.3% for AGIs $25k-50k, 109.2% for AGIs $50k-75k, 157.7% for AGIs $75k-100k, 207.6% for AGIs $100k-200k, 1233.3% for AGIs over 200k)
Ordinary dividends: $9,673 (reported on 46.8% of returns)
Here:
$9,673
State:
$10,949
(% of AGI for various income ranges: 60.9% for AGIs below $25k, 133.3% for AGIs $25k-50k, 265.6% for AGIs $50k-75k, 379.7% for AGIs $75k-100k, 586.2% for AGIs $100k-200k, 3908.1% for AGIs over 200k)
Net capital gain/loss in AGI: +$45,279 (reported on 46.6% of returns)
Here:
+$45,279
State:
+$49,306
(% of AGI for various income ranges: 50.2% for AGIs below $25k, 118.3% for AGIs $25k-50k, 195.3% for AGIs $50k-75k, 331.9% for AGIs $75k-100k, 840.0% for AGIs $100k-200k, 23757.5% for AGIs over 200k)
Profit/loss from business: +$27,455 (reported on 15.2% of returns)
Here:
+$27,455
State:
+$15,671
(% of AGI for various income ranges: 108.7% for AGIs below $25k, 255.3% for AGIs $25k-50k, 332.5% for AGIs $50k-75k, 326.4% for AGIs $75k-100k, 638.7% for AGIs $100k-200k, 3198.3% for AGIs over 200k)
Taxable individual retirement arrangement distribution: $28,595 (reported on 10.2% of returns)
94588:
$28,595
California:
$23,505
(% of AGI for various income ranges: 60.8% for AGIs below $25k, 166.9% for AGIs $25k-50k, 346.0% for AGIs $50k-75k, 612.1% for AGIs $75k-100k, 789.1% for AGIs $100k-200k, 1393.0% for AGIs over 200k)
Self-employed (Keogh) retirement plans: $35,144 (reported on 1.5% of returns)
94588:
$35,144
California:
$30,163
(% of AGI for various income ranges: 84.9% for AGIs $100k-200k, 511.8% for AGIs over 200k)
Total itemized deductions: $39,001 (reported on 27.5% of returns)
Here:
$39,001
State:
$39,517
(% of AGI for various income ranges: 198.5% for AGIs below $25k, 347.7% for AGIs $25k-50k, 649.0% for AGIs $50k-75k, 1029.1% for AGIs $75k-100k, 1849.9% for AGIs $100k-200k, 8302.5% for AGIs over 200k)
Charity contributions: $8,961 (reported on 22.6% of returns)
Here:
$8,961
State:
$12,598
(% of AGI for various income ranges: 5.9% for AGIs below $25k, 24.9% for AGIs $25k-50k, 65.2% for AGIs $50k-75k, 94.1% for AGIs $75k-100k, 232.9% for AGIs $100k-200k, 1943.1% for AGIs over 200k)
Taxes paid: $9,274 (reported on 27.4% of returns)
94588:
$9,274
State:
$8,807
(% of AGI for various income ranges: 30.7% for AGIs below $25k, 68.8% for AGIs $25k-50k, 138.6% for AGIs $50k-75k, 248.4% for AGIs $75k-100k, 528.1% for AGIs $100k-200k, 1865.5% for AGIs over 200k)
Earned income credit: $1,547 (reported on 3.6% of returns)
Here:
$1,547
State:
$2,074
(% of AGI for various income ranges: 34.1% for AGIs below $25k, 28.3% for AGIs $25k-50k)
Percentage of individuals using paid preparers for their 2020 taxes: 93.1%
Here:
93%
State:
92%
(% for various income ranges: 90.4% for AGIs below $25k, 91.2% for AGIs $25k-50k, 92.4% for AGIs $50k-75k, 93.8% for AGIs $75k-100k, 93.6% for AGIs $100k-200k, 94.9% for AGIs over 200k)
Averages for the 2012 tax year for zip code 94588, filed in 2013:
Average Adjusted Gross Income (AGI) in 2012: $123,806 (Individual Income Tax Returns)
Here:
$123,806
State:
$72,726
Salary/wage: $110,119 (reported on 85.4% of returns)
Here:
$110,119
State:
$59,079
(% of AGI for various income ranges: 73.0% for AGIs below $25k, 76.6% for AGIs $25k-50k, 76.2% for AGIs $50k-75k, 77.3% for AGIs $75k-100k, 82.3% for AGIs $100k-200k, 71.8% for AGIs over 200k)
Taxable interest for individuals: $1,697 (reported on 53.8% of returns)
This zip code:
$1,697
California:
$2,146
(% of AGI for various income ranges: 1.7% for AGIs below $25k, 0.8% for AGIs $25k-50k, 0.7% for AGIs $50k-75k, 0.8% for AGIs $75k-100k, 0.5% for AGIs $100k-200k, 0.8% for AGIs over 200k)
Ordinary dividends: $6,415 (reported on 37.1% of returns)
Here:
$6,415
State:
$9,308
(% of AGI for various income ranges: 3.2% for AGIs below $25k, 2.0% for AGIs $25k-50k, 1.7% for AGIs $50k-75k, 1.7% for AGIs $75k-100k, 1.3% for AGIs $100k-200k, 2.3% for AGIs over 200k)
Net capital gain/loss in AGI: +$17,781 (reported on 34.6% of returns)
Here:
+$17,781
State:
+$30,460
(% of AGI for various income ranges: 0.1% for AGIs below $25k, 0.6% for AGIs $25k-50k, 0.5% for AGIs $75k-100k, 0.8% for AGIs $100k-200k, 9.4% for AGIs over 200k)
Profit/loss from business: +$25,878 (reported on 16.8% of returns)
Here:
+$25,878
State:
+$17,064
(% of AGI for various income ranges: 11.3% for AGIs below $25k, 6.3% for AGIs $25k-50k, 5.0% for AGIs $50k-75k, 3.1% for AGIs $75k-100k, 3.1% for AGIs $100k-200k, 3.2% for AGIs over 200k)
Taxable individual retirement arrangement distribution: $23,086 (reported on 10.8% of returns)
94588:
$23,086
California:
$19,557
(% of AGI for various income ranges: 4.4% for AGIs below $25k, 3.6% for AGIs $25k-50k, 3.4% for AGIs $50k-75k, 3.5% for AGIs $75k-100k, 2.5% for AGIs $100k-200k, 1.1% for AGIs over 200k)
Self-employment retirement plans: $25,546 (reported on 1.7% of returns)
94588:
$25,546
California:
$24,530
(% of AGI for various income ranges: 0.7% for AGIs $50k-75k, 0.3% for AGIs $100k-200k, 0.5% for AGIs over 200k)
Total itemized deductions: $38,867 (20% of AGI, reported on 55.5% of returns)
Here:
$38,867
State:
$34,004
Here:
20.5% of AGI
State:
22.7% of AGI
(% of AGI for various income ranges: 16.5% for AGIs below $25k, 16.0% for AGIs $25k-50k, 15.3% for AGIs $50k-75k, 16.9% for AGIs $75k-100k, 19.1% for AGIs $100k-200k, 16.9% for AGIs over 200k)
Charity contributions: $3,901 (reported on 47.3% of returns)
Here:
$3,901
State:
$4,659
(% of AGI for various income ranges: 0.8% for AGIs below $25k, 1.1% for AGIs $25k-50k, 1.4% for AGIs $50k-75k, 1.4% for AGIs $75k-100k, 1.5% for AGIs $100k-200k, 1.5% for AGIs over 200k)
Taxes paid: $18,820 (reported on 55.4% of returns)
94588:
$18,820
State:
$14,448
(% of AGI for various income ranges: 3.6% for AGIs below $25k, 3.9% for AGIs $25k-50k, 4.6% for AGIs $50k-75k, 5.9% for AGIs $75k-100k, 8.3% for AGIs $100k-200k, 9.9% for AGIs over 200k)
Earned income credit: $1,583 (reported on 4.7% of returns)
Here:
$1,583
State:
$2,286
(% of AGI for various income ranges: 2.2% for AGIs below $25k, 0.5% for AGIs $25k-50k)
Percentage of individuals using paid preparers for their 2012 taxes: 52.5%
Here:
53%
State:
64%
(% for various income ranges: 44.8% for AGIs below $25k, 51.6% for AGIs $25k-50k, 54.7% for AGIs $50k-75k, 54.4% for AGIs $75k-100k, 53.0% for AGIs $100k-200k, 61.3% for AGIs over 200k)
Averages for the 2004 tax year for zip code 94588, filed in 2005:
Average Adjusted Gross Income (AGI) in 2004: $109,134 (Individual Income Tax Returns)
Here:
$109,134
State:
$58,600
Salary/wage: $89,721 (reported on 86.9% of returns)
Here:
$89,721
State:
$49,455
(% of AGI for various income ranges: 214.7% for AGIs below $10k, 74.1% for AGIs $10k-25k, 80.5% for AGIs $25k-50k, 81.2% for AGIs $50k-75k, 84.5% for AGIs $75k-100k, 67.5% for AGIs over 100k)
Taxable interest for individuals: $2,302 (reported on 61.8% of returns)
This zip code:
$2,302
California:
$2,365
(% of AGI for various income ranges: 25.1% for AGIs below $10k, 2.6% for AGIs $10k-25k, 1.3% for AGIs $25k-50k, 1.6% for AGIs $50k-75k, 0.9% for AGIs $75k-100k, 1.2% for AGIs over 100k)
Taxable dividends: $3,134 (reported on 39.6% of returns)
Here:
$3,134
State:
$4,746
(% of AGI for various income ranges: 21.5% for AGIs below $10k, 2.5% for AGIs $10k-25k, 1.2% for AGIs $25k-50k, 1.0% for AGIs $50k-75k, 0.8% for AGIs $75k-100k, 1.1% for AGIs over 100k)
Net capital gain/loss: +$31,017 (reported on 37.3% of returns)
Here:
+$31,017
State:
+$23,418
(% of AGI for various income ranges: -5.9% for AGIs below $10k, 0.2% for AGIs $10k-25k, 0.7% for AGIs $25k-50k, 0.8% for AGIs $50k-75k, 0.6% for AGIs $75k-100k, 13.9% for AGIs over 100k)
Profit/loss from business: +$25,600 (reported on 17.0% of returns)
Here:
+$25,600
State:
+$16,826
(% of AGI for various income ranges: 7.2% for AGIs below $10k, 9.4% for AGIs $10k-25k, 5.9% for AGIs $25k-50k, 5.6% for AGIs $50k-75k, 4.0% for AGIs $75k-100k, 3.5% for AGIs over 100k)
IRA payment deduction: $3,485 (reported on 3.7% of returns)
94588:
$3,485
California:
$3,192
(% of AGI for various income ranges: 0.8% for AGIs below $10k, 0.3% for AGIs $10k-25k, 0.2% for AGIs $25k-50k, 0.2% for AGIs $50k-75k, 0.2% for AGIs $75k-100k, 0.1% for AGIs over 100k)
Self-employed pension: $17,046 (reported on 2.4% of returns)
Here:
$17,046
California:
$17,688
(% of AGI for various income ranges: 1.4% for AGIs below $10k, 0.2% for AGIs $25k-50k, 0.3% for AGIs $50k-75k, 0.3% for AGIs $75k-100k, 0.4% for AGIs over 100k)
Total itemized deductions: $34,935 (21% of AGI, reported on 57.1% of returns)
Here:
$34,935
State:
$28,113
Here:
21.0% of AGI
State:
25.3% of AGI
(% of AGI for various income ranges: 64.1% for AGIs below $10k, 20.9% for AGIs $10k-25k, 18.1% for AGIs $25k-50k, 21.2% for AGIs $50k-75k, 23.0% for AGIs $75k-100k, 17.2% for AGIs over 100k)
Charity contributions deductions: $3,747 (2% of AGI, reported on 51.3% of returns)
Here:
$3,747
State:
$3,923
Here:
2.2% of AGI
State:
3.3% of AGI
(% of AGI for various income ranges: 1.6% for AGIs below $10k, 1.2% for AGIs $10k-25k, 1.5% for AGIs $25k-50k, 1.9% for AGIs $50k-75k, 2.0% for AGIs $75k-100k, 1.8% for AGIs over 100k)
Total tax: $21,400 (reported on 85.2% of returns)
94588:
$21,400
State:
$10,761
(% of AGI for various income ranges: 8.0% for AGIs below $10k, 5.3% for AGIs $10k-25k, 8.4% for AGIs $25k-50k, 10.2% for AGIs $50k-75k, 10.3% for AGIs $75k-100k, 19.1% for AGIs over 100k)
Earned income credit: $1,246 (reported on 3.8% of returns)
Here:
$1,246
State:
$1,763
Percentage of individuals using paid preparers for their 2004 taxes: 53.3%
Here:
53%
State:
66%
(% for various income ranges: 43.2% for AGIs below $10k, 48.3% for AGIs $10k-25k, 51.3% for AGIs $25k-50k, 56.4% for AGIs $50k-75k, 57.1% for AGIs $75k-100k, 58.2% for AGIs over 100k)
Likely homosexual households (counted as self-reported same-sex unmarried-partner households)
Lesbian couples: 0.0% of all households
Gay men: 0.1% of all households
Household received Food Stamps/SNAP in the past 12 months: 318 Household did not receive Food Stamps/SNAP in the past 12 months: 11,918
Women who had a birth in the past 12 months: 459 (450 now married, 6 unmarried) Women who did not have a birth in the past 12 months: 7,697 (4,492 now married, 3,144 unmarried)
Housing units in zip code 94588 with a mortgage: 5,915 (926 second mortgage, 15 home equity loan, 884 both second mortgage and home equity loan) Houses without a mortgage: 179
Median monthly owner costs for units with a mortgage: $3,876 Median monthly owner costs for units without a mortgage: $1,060
Residents with income below the poverty level in 2022:
This zip code:
6.4%
Whole state:
12.2%
Residents with income below 50% of the poverty level in 2022:
This zip code:
2.4%
Whole state:
6.2%
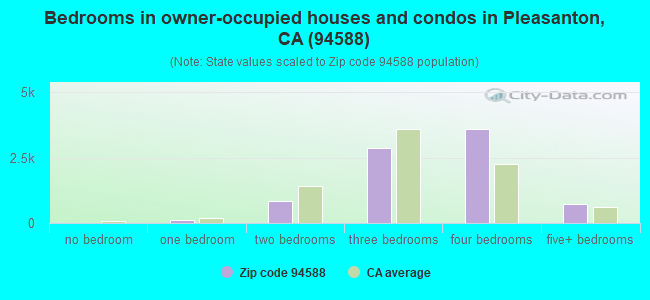
Median number of rooms in houses and condos:
Here:
6.7
State:
6.0
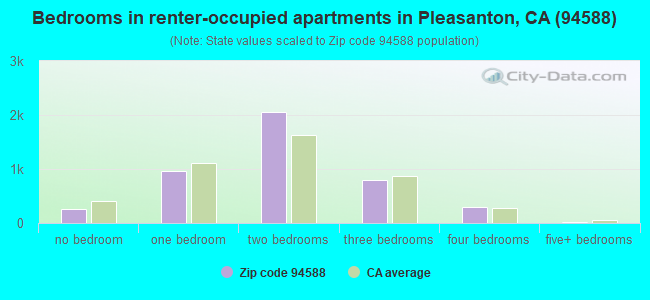
Median number of rooms in apartments:
Here:
3.9
State:
3.9
Notable locations in this zip code not listed on our city pages
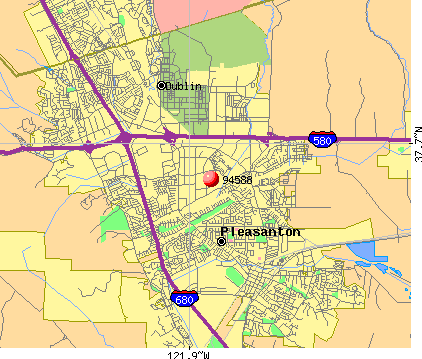
Notable locations in zip code 94588: Livermore - Pleasanton Fire Department Station 3 (A), Livermore - Pleasanton Fire Department Station 2 (B). Display/hide their locations on the map
Shopping Centers: Best Plaza Shopping Center (1), Gateway Square Shopping Center (2), Rose Pavilion Shopping Center (3), Stoneridge Mall Shopping Center (4). Display/hide their locations on the map
Streams, rivers, and creeks: Gold Creek (A), Laurel Creek (B), Tassajara Creek (C), Tehan Creek (D), South San Ramon Creek (E), Arroyo Las Positas (F), Arroyo Mocho (G). Display/hide their locations on the map
Parks in zip code 94588 include: Fairlands Park (1), Moller Park (2), Muirwood Park (3), Oakhill Park (4), Val Vista Park (5), Valley Trails Park (6), Meadows Park (7), Nielsen Park (8), Adobe Park (9). Display/hide their locations on the map
6,905 married couples with children.
853 single-parent households (286 men, 567 women).
54.5% of residents of 94588 zip code speak English at home.
4.1% of residents speak Spanish at home (80% very well, 12% well, 5% not well, 3% not at all).
16.7% of residents speak other Indo-European language at home (83% very well, 13% well, 3% not well, 1% not at all).
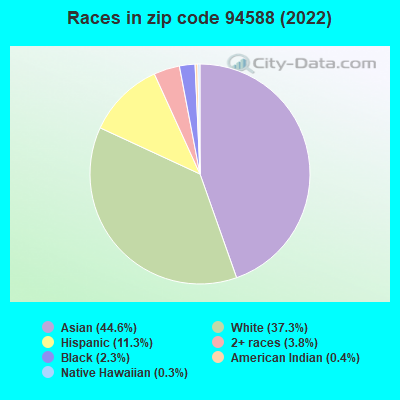
24.5% of residents speak Asian or Pacific Island language at home (65% very well, 21% well, 13% not well, 2% not at all).
0.6% of residents speak other language at home (84% very well, 16% well).
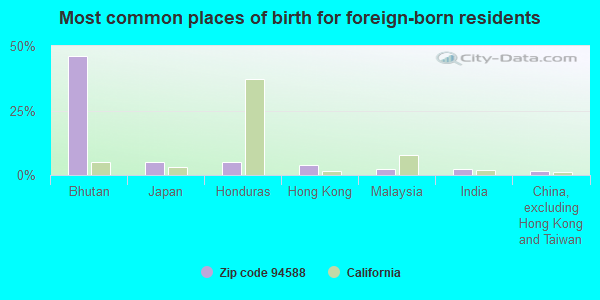
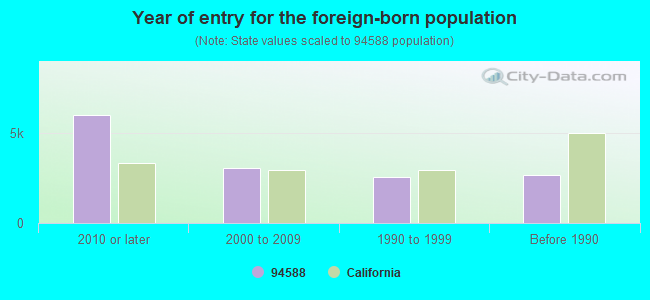
Foreign born population: 13,235 (38.0%) (47.9% of them are naturalized citizens)
Major facilities with environmental interests located in this zip code:
INFINITI OF PLEASANTON (4339 ROSEWOOD DR in PLEASANTON, CA)
STATE MASTER (California - Hazardous Waste Tracking) - HAZARDOU WASTE PROGRAM Small Quantity Generators, between 100 kg and 1000 kg of hazardous waste/month (Resource Conservation and Recovery Act (tracking hazardous waste)) - notification Organizations: HENDRICK AUTOMOTIVE GROUP (CONTACT/OWNER)
LEXUS OF PLEASANTON (4345 ROSEWOOD DR in PLEASANTON, CA)
STATE MASTER (California - Hazardous Waste Tracking) - HAZARDOU WASTE PROGRAM Small Quantity Generators, between 100 kg and 1000 kg of hazardous waste/month (Resource Conservation and Recovery Act (tracking hazardous waste)) - notification Organizations: HENDRICK AUTOMOTIVE GROUP (CONTACT/OWNER)
CHEVRON STATION NO 90917 (5280 HOPYARD RD in PLEASANTON, CA)
STATE MASTER (California - Hazardous Waste Tracking) - HAZARDOU WASTE PROGRAM Small Quantity Generators, between 100 kg and 1000 kg of hazardous waste/month (Resource Conservation and Recovery Act (tracking hazardous waste)) - notification Organizations: CHEVRON PRODUCTS CO (CONTACT/OWNER)
Alternative names: CHEVRON USA INC SERV STA #90917
MIKE CEDOLINE DBA MIKE CEDOLINI TRUCKING (4459 DOWNING CT in PLEASANTON, CA)
STATE MASTER (California - Hazardous Waste Tracking) - HAZARDOU WASTE PROGRAM TRANSPORTER (Resource Conservation and Recovery Act (tracking hazardous waste)) Business NAICS classification: GENERAL FREIGHT TRUCKING, LONG-DISTANCE, TRUCKLOAD.
FAIRLANDS ELEMENTARY (4151 W. LAS POSITAS in PLEASANTON, CA)
(National Center for Education Statistics) - STATE ID-6002323 Organizations: PLEASANTON UNIFIED (SCHOOL DISTRICT)
FOOTHILL HIGH (4375 FOOTHILL ROAD in PLEASANTON, CA)
(National Center for Education Statistics) - STATE ID-0130096 Organizations: PLEASANTON UNIFIED (SCHOOL DISTRICT)
HART (THOMAS S.) MIDDLE (4433 WILLOW RD. in PLEASANTON, CA)
(National Center for Education Statistics) - STATE ID-6117592 Organizations: PLEASANTON UNIFIED (SCHOOL DISTRICT)
LYDIKSEN ELEMENTARY (7700 HIGHLAND OAKS DR. in PLEASANTON, CA)
(National Center for Education Statistics) - STATE ID-6001416 Organizations: PLEASANTON UNIFIED (SCHOOL DISTRICT)
I T CORP (5731 W LAS POSITAS BLVD in PLEASANTON, CA)
HAZARDOUS WASTE BIENNIAL REPORTER (Resource Conservation and Recovery Act (tracking hazardous waste)) (Resource Conservation and Recovery Act (tracking hazardous waste))
HACIENDA MTRS DBA MERCEDES OF PLEASANTON (5885 OWENS DRIVE in PLEASANTON, CA)
Small Quantity Generators, between 100 kg and 1000 kg of hazardous waste/month (Resource Conservation and Recovery Act (tracking hazardous waste)) - notification Organizations: UWE WAIZENEGGER (CONTACT/OPERATOR)
Alternative names: HACIENDA MOTORS LTD
HOME DEPOT USA INC HD 0629 (6000 JOHNSON DR in PLEASANTON, CA)
Small Quantity Generators, between 100 kg and 1000 kg of hazardous waste/month (Resource Conservation and Recovery Act (tracking hazardous waste))
MERCEDES BENZ OF PLEASANTON (5871 OWENS DR in PLEASANTON, CA)
Small Quantity Generators, between 100 kg and 1000 kg of hazardous waste/month (Resource Conservation and Recovery Act (tracking hazardous waste)) Organizations: UWE WAIZENEGGER (CONTACT/OPERATOR)
, USW LIMITED PARTNERSHIP (CONTACT/OWNER)
ACTION DESIGNS OF CALIFORNIA (2142 RHEEM DRIVE in PLEASANTON, CA)
Small Quantity Generators, between 100 kg and 1000 kg of hazardous waste/month (Resource Conservation and Recovery Act (tracking hazardous waste))
Housing units lacking complete plumbing facilities: 0.2% Housing units lacking complete kitchen facilities: 0.2%
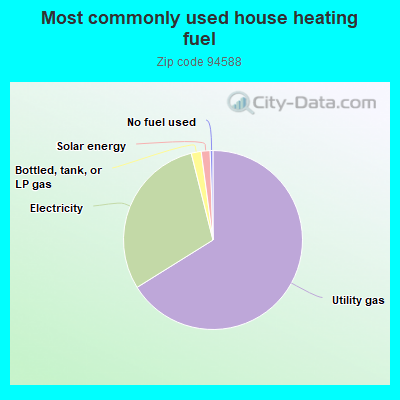
66.0%Utility gas
29.9%Electricity
1.8%Bottled, tank, or LP gas
1.6%Solar energy
0.5%No fuel used
Population in 1990: 19,032. Population change in the 1990s: +9,525 (+50.0%).
Place of birth for U.S.-born residents:
This state: 15,756
Northeast: 2,025
Midwest: 1,685
South: 746
West: 998
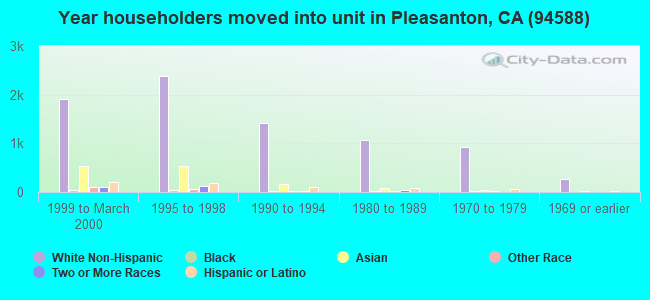
47% of the 94588 zip code residents lived in the same house 5 years ago. Out of people who lived in different houses, 45% lived in this county. Out of people who lived in different counties, 50% lived in California.
87% of the 94588 zip code residents lived in the same house 1 year ago. Out of people who lived in different houses, 42% moved from this county. Out of people who lived in different houses, 39% moved from different county within same state. Out of people who lived in different houses, 10% moved from different state. Out of people who lived in different houses, 9% moved from abroad.
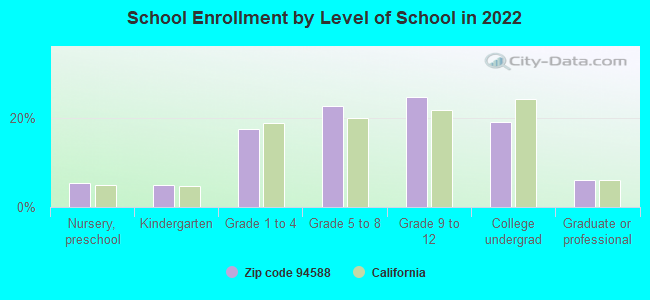
Private vs. public school enrollment:
Students in private schools in grades 1 to 8 (elementary and middle school): 227
Here:
6.3%
California:
10.5%
Students in private schools in grades 9 to 12 (high school): 157
Here:
7.1%
California:
8.5%
Students in private undergraduate colleges: 242
Here:
14.1%
California:
15.9%
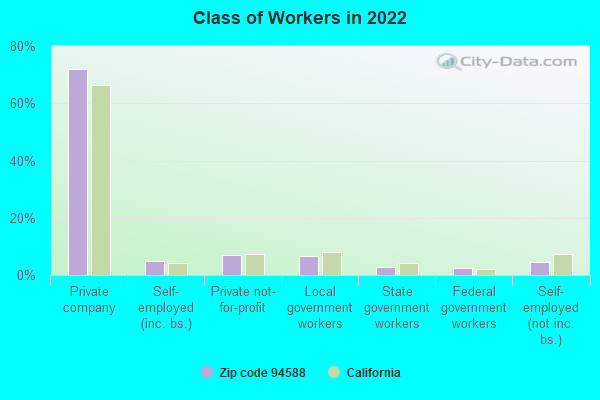
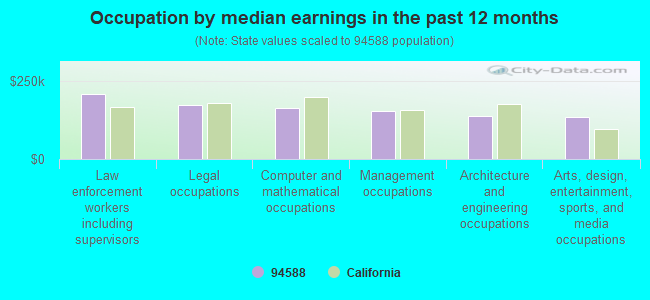
Occupation by median earnings in the past 12 months ($)
209,907Law enforcement workers including supervisors
173,345Legal occupations
164,370Computer and mathematical occupations
155,372Management occupations
138,146Architecture and engineering occupations
134,818Arts, design, entertainment, sports, and media occupations
Companies with biggest federal contracts located in this zip code (PLEASANTON, CA):
DILLINGHAM CONSTRUCTION PACIFI (5960 INGLEWOOD DRIVE) : $35,182,972 in 131 contractsfrom 1999 to 2004
Contracts for Construction of Structures and Facilities -- Troop Housing Facilities, Maintenance, Repair or Alteration of Real Property -- Fuel Storage Buildings, Construction of Structures and Facilities -- Airport Service Roads, Maintenance, Repair or Alteration of Real Property -- Waste Treatment and Storage Facilities, and moreby Navy, Air Force, United States Coast Guard (disused code: now 7008), U.S. Coast Guard, and others Signed by year:2000: $6,567,345; 2001: $18,084,750; 2002: $2,442,839; 2003: $25,556; 2004: $39,802; 2005: $0; 2006: $0.
Biggest contracts:
$16,190,000 with Navy for Construction of Structures and Facilities -- Troop Housing Facilities. Taking place in HI. Signed on 2001-01-31. Completion date: 2002-08-24.
$7,118,471 with Navy for Maintenance, Repair or Alteration of Real Property -- Fuel Storage Buildings. Taking place in HI. Signed on 1999-12-08. Completion date: 2001-01-06.
$5,458,497, same as above.Signed on 2000-12-05. Completion date: 2002-09-26.
$1,165,000, same as above.Signed on 2002-04-03. Completion date: 2002-02-21.
CPU TECHNOLOGY, INC (4900 HOPYARD RD SUITE 300; small business) : $23,525,132 in 22 contractsfrom 1999 to 2005
Contracts for Other Defense -- Engineering Development (R&D), Other Defense -- Applied Research and Exploratory Development (R&D), Defense Electronics and Communication Equipment -- Advanced Development (R&D), Defense Electronics and Communication Equipment -- Basic Research (R&D), and moreby Navy, Air Force Signed by year:2000: $3,521,000; 2001: $3,400,000; 2002: $2,100,000; 2003: $7,496,087; 2004: $600,000; 2005: $5,679,045; 2006: $0.
Biggest contracts:
$3,500,000 with Navy for Other Defense -- Engineering Development (R&D). Signed on 2000-08-08. Completion date: 2001-08-07.
$2,650,000 with Navy for Other Defense -- Applied Research and Exploratory Development (R&D). Signed on 2001-10-29. Completion date: 2002-12-31.
$2,605,188, same as above.Signed on 2003-07-26. Completion date: 2004-04-09.
$2,334,899, same as above.Signed on 2003-04-11. Completion date: 2004-04-09.
OHM REMEDIATION SERVICES CORP (5731 W LAS POSITAS BLVD) : $3,599,150 in 18 contractsfrom 1999 to 2000
Contracts for Construction of Structures and Facilities -- Restoration of real property by Navy Signed by year:2000: $3,832,240; 2001: $0; 2002: $0; 2003: $0; 2004: $0; 2005: $0; 2006: $0.
Biggest contracts:
$1,545,562 with Navy for Construction of Structures and Facilities -- Restoration of real property. Signed on 2000-02-29. Completion date: 2001-03-31.
$1,056,845, same as above.Signed on 2000-01-31. Completion date: 2001-03-31.
$998,000, same as above.Signed on 2000-01-31. Completion date: 2001-01-31.
$200,000, same as above.Signed on 2000-02-01. Completion date: 2000-09-30.
CE2 KLEINFELDER JV (7901 STONERIDGE DR STE 505; small business)
$2,842,215 with Navy for Architect - Engineer Services (including landscaping, interior layout, and designing). Signed on 2005-12-09. Completion date: 2007-08-08.
PROCESS METRIX, LLC (6622 OWENS DR; small business) : $1,647,734 in 9 contractsfrom 2002 to 2006
Contracts for Other Defense -- Operational Systems Development (R&D), Defense Electronics and Communication Equipment -- Basic Research (R&D), Defense Electronics and Communication Equipment -- Applied Research and Exploratory Development (R&D), Other Research and Development -- Advanced Development (R&D) by Air Force, Navy, U.S. Special Operations Command Signed by year:2000: $0; 2001: $0; 2002: $69,768; 2003: $304,538; 2004: $875,000; 2005: $298,464; 2006: $99,964.
Biggest contracts:
$500,000 with Air Force for Other Defense -- Operational Systems Development (R&D). Signed on 2004-09-14. Completion date: 2006-05-08.
$375,000 with Navy for Defense Electronics and Communication Equipment -- Basic Research (R&D). Signed on 2004-04-22. Completion date: 2005-11-30.
$199,940 with Navy for Defense Electronics and Communication Equipment -- Applied Research and Exploratory Development (R&D). Signed on 2005-01-06. Completion date: 2005-11-30.
$175,000 with Navy for Defense Electronics and Communication Equipment -- Basic Research (R&D). Signed on 2003-11-12. Completion date: 2005-11-30.
MIXED TECHNOLOGY ASSOCIATES (5820 STONERIDEGE MALL RD; small business) : $473,770 in 2 contractsfrom 2004 to 2005
$374,831 with Army for Other Defense -- Applied Research and Exploratory Development (R&D). Signed on 2005-11-15. Completion date: 2008-01-31.
$98,939, same as above.Signed on 2004-01-14. Completion date: 2004-09-13.
CATALYTIC DEVICES INTERNATIONA (7063 COMMERCE CIRCLE STE E; small business) : $431,515 in 5 contractsfrom 2002 to 2006
Contracts for Services -- Basic Research (R&D) by Army Signed by year:2000: $0; 2001: $0; 2002: $100,000; 2003: $81,515; 2004: $0; 2005: $75,000; 2006: $175,000.
Biggest contracts:
$175,000 with Army for Services -- Basic Research (R&D). Signed on 2006-04-21. Completion date: 2007-03-31.
$100,000, same as above.Signed on 2002-11-26. Completion date: 2003-11-24.
$81,515, same as above.Signed on 2003-05-14. Completion date: 2003-11-24.
$75,000, same as above.Signed on 2005-07-30. Completion date: 2007-03-31.
DILLINGHAM CONSTRUCTION N A , (5960 INGLEWOOD DRIVE) : $299,776 in 6 contractsfrom 2000 to 2003
Contracts for Construction of Structures and Facilities -- Other Conservation and Development Facilities, Construction of Structures and Facilities -- Ammunition Facilities by Bureau of Reclamation, Navy Signed by year:2000: $309,776; 2001: $0; 2002: $0; 2003: -$10,000; 2004: $0; 2005: $0; 2006: $0.
Biggest contracts:
$236,000 with Bureau of Reclamation for Construction of Structures and Facilities -- Other Conservation and Development Facilities. Signed on 2000-11-15. Completion date: 2001-05-15.
$56,794 with Navy for Construction of Structures and Facilities -- Ammunition Facilities. Signed on 2000-10-01. Completion date: 1999-10-20.
$11,134, same as above.Signed on 2000-10-01. Completion date: 1999-10-20.
$5,000, same as above.Signed on 2000-10-01. Completion date: 1999-10-20.
ZONE SEVEN WATER AGENCY (2722 SANTA RITA RD) : $272,016 in 6 contractsfrom 2000 to 2003
Contracts for Nursing Home Care Contracts, Water Services by Department of Veterans Affairs Signed by year:2000: $129,000; 2001: $66,000; 2002: $40,000; 2003: $37,016; 2004: $0; 2005: $0; 2006: $0.
Biggest contracts:
$112,000 with Department of Veterans Affairs for Nursing Home Care Contracts. Signed on 2000-07-15. Completion date: 2000-12-15.
$40,000 with Department of Veterans Affairs for Water Services. Signed on 2002-02-15. Completion date: 2002-09-15.
$37,016, same as above.Signed on 2003-04-15. Completion date: 2003-09-15.
$33,000, same as above.Signed on 2001-08-15. Completion date: 2001-12-15.
ADVANCED POWER SOLUTIONS (7079 COMMERCE CIRCLE; small business) : $233,234 in 11 contractsfrom 2000 to 2005
Contracts for Converters, Electrical, Nonrotating, Telephone and Telegraph Equipment, Transformers: Distribution and Power Station, ADP Support Equipment, and moreby Navy, Air Force, Army, Defense Intelligence Agency, and others Signed by year:2000: $64,943; 2001: $51,827; 2002: $0; 2003: $0; 2004: $65,226; 2005: $51,238; 2006: $0.
Biggest contracts:
$64,943 with Navy for Converters, Electrical, Nonrotating. Signed on 2000-02-14. Completion date: 2000-05-26.
$51,827 with Air Force for Telephone and Telegraph Equipment. Signed on 2001-12-18. Completion date: 2002-03-31.
$37,683 with Air Force for Transformers: Distribution and Power Station. Signed on 2004-05-25. Completion date: 2004-07-30.
$20,780 with Navy for Converters, Electrical, Nonrotating. Signed on 2005-09-15. Completion date: 2005-09-30.
Top industries in this zip code by the number of employees in 2005:
2006 - 2018 National Fire Incident Reporting System (NFIRS) incidents
Based on the data from the years 2006 - 2018 the average number of fire incidents per year is 33. The highest number of fire incidents - 60 took place in 2017, and the least - 2 in 2006. The data has a rising trend.
When looking into fire subcategories, the most reports belonged to: Outside Fires (39.8%), and Structure Fires (28.7%).
Fire incident types reported to NFIRS in Zip Code 94588
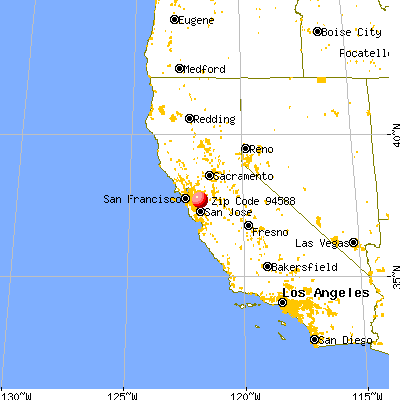


 Nearest zip codes: 94506, 94582, 94568, 94517, 94528, 94583.
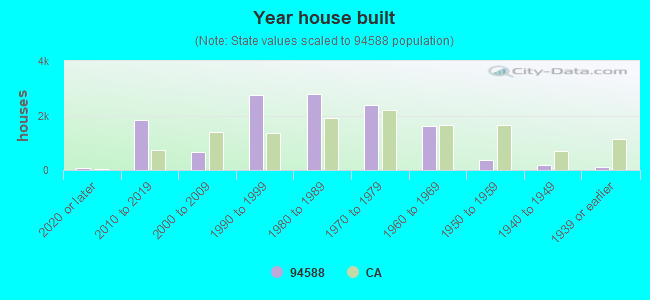


 Based on the data from the years 2006 - 2018 the average number of fire incidents per year is 33. The highest number of fire incidents - 60 took place in 2017, and the least - 2 in 2006. The data has a rising trend.
 When looking into fire subcategories, the most reports belonged to: Outside Fires (39.8%), and Structure Fires (28.7%).