Coalinga, California Submit your own pictures of this city and show them to the world
OSM Map
General Map
Google Map
MSN Map
OSM Map
General Map
Google Map
MSN Map
OSM Map
General Map
Google Map
MSN Map
OSM Map
General Map
Google Map
MSN Map
Please wait while loading the map...
Population in 2022: 17,024 (100% urban, 0% rural). Population change since 2000: +45.9%Males: 10,182 Females: 6,842
March 2022 cost of living index in Coalinga: 93.9 (less than average, U.S. average is 100) Percentage of residents living in poverty in 2022: 18.7%for White Non-Hispanic residents , 7.2% for Black residents , 21.1% for Hispanic or Latino residents , 16.8% for American Indian residents , 87.8% for Native Hawaiian and other Pacific Islander residents , 16.9% for other race residents , 21.2% for two or more races residents )
Profiles of local businesses
Business Search - 14 Million verified businesses
Data:
Median household income ($)
Median household income (% change since 2000)
Household income diversity
Ratio of average income to average house value (%)
Ratio of average income to average rent
Median household income ($) - White
Median household income ($) - Black or African American
Median household income ($) - Asian
Median household income ($) - Hispanic or Latino
Median household income ($) - American Indian and Alaska Native
Median household income ($) - Multirace
Median household income ($) - Other Race
Median household income for houses/condos with a mortgage ($)
Median household income for apartments without a mortgage ($)
Races - White alone (%)
Races - White alone (% change since 2000)
Races - Black alone (%)
Races - Black alone (% change since 2000)
Races - American Indian alone (%)
Races - American Indian alone (% change since 2000)
Races - Asian alone (%)
Races - Asian alone (% change since 2000)
Races - Hispanic (%)
Races - Hispanic (% change since 2000)
Races - Native Hawaiian and Other Pacific Islander alone (%)
Races - Native Hawaiian and Other Pacific Islander alone (% change since 2000)
Races - Two or more races (%)
Races - Two or more races (% change since 2000)
Races - Other race alone (%)
Races - Other race alone (% change since 2000)
Racial diversity
Unemployment (%)
Unemployment (% change since 2000)
Unemployment (%) - White
Unemployment (%) - Black or African American
Unemployment (%) - Asian
Unemployment (%) - Hispanic or Latino
Unemployment (%) - American Indian and Alaska Native
Unemployment (%) - Multirace
Unemployment (%) - Other Race
Population density (people per square mile)
Population - Males (%)
Population - Females (%)
Population - Males (%) - White
Population - Males (%) - Black or African American
Population - Males (%) - Asian
Population - Males (%) - Hispanic or Latino
Population - Males (%) - American Indian and Alaska Native
Population - Males (%) - Multirace
Population - Males (%) - Other Race
Population - Females (%) - White
Population - Females (%) - Black or African American
Population - Females (%) - Asian
Population - Females (%) - Hispanic or Latino
Population - Females (%) - American Indian and Alaska Native
Population - Females (%) - Multirace
Population - Females (%) - Other Race
Coronavirus confirmed cases (Apr 27, 2024)
Deaths caused by coronavirus (Apr 27, 2024)
Coronavirus confirmed cases (per 100k population) (Apr 27, 2024)
Deaths caused by coronavirus (per 100k population) (Apr 27, 2024)
Daily increase in number of cases (Apr 27, 2024)
Weekly increase in number of cases (Apr 27, 2024)
Cases doubled (in days) (Apr 27, 2024)
Hospitalized patients (Apr 18, 2022)
Negative test results (Apr 18, 2022)
Total test results (Apr 18, 2022)
COVID Vaccine doses distributed (per 100k population) (Sep 19, 2023)
COVID Vaccine doses administered (per 100k population) (Sep 19, 2023)
COVID Vaccine doses distributed (Sep 19, 2023)
COVID Vaccine doses administered (Sep 19, 2023)
Likely homosexual households (%)
Likely homosexual households (% change since 2000)
Likely homosexual households - Lesbian couples (%)
Likely homosexual households - Lesbian couples (% change since 2000)
Likely homosexual households - Gay men (%)
Likely homosexual households - Gay men (% change since 2000)
Cost of living index
Median gross rent ($)
Median contract rent ($)
Median monthly housing costs ($)
Median house or condo value ($)
Median house or condo value ($ change since 2000)
Mean house or condo value by units in structure - 1, detached ($)
Mean house or condo value by units in structure - 1, attached ($)
Mean house or condo value by units in structure - 2 ($)
Mean house or condo value by units in structure by units in structure - 3 or 4 ($)
Mean house or condo value by units in structure - 5 or more ($)
Mean house or condo value by units in structure - Boat, RV, van, etc. ($)
Mean house or condo value by units in structure - Mobile home ($)
Median house or condo value ($) - White
Median house or condo value ($) - Black or African American
Median house or condo value ($) - Asian
Median house or condo value ($) - Hispanic or Latino
Median house or condo value ($) - American Indian and Alaska Native
Median house or condo value ($) - Multirace
Median house or condo value ($) - Other Race
Median resident age
Resident age diversity
Median resident age - Males
Median resident age - Females
Median resident age - White
Median resident age - Black or African American
Median resident age - Asian
Median resident age - Hispanic or Latino
Median resident age - American Indian and Alaska Native
Median resident age - Multirace
Median resident age - Other Race
Median resident age - Males - White
Median resident age - Males - Black or African American
Median resident age - Males - Asian
Median resident age - Males - Hispanic or Latino
Median resident age - Males - American Indian and Alaska Native
Median resident age - Males - Multirace
Median resident age - Males - Other Race
Median resident age - Females - White
Median resident age - Females - Black or African American
Median resident age - Females - Asian
Median resident age - Females - Hispanic or Latino
Median resident age - Females - American Indian and Alaska Native
Median resident age - Females - Multirace
Median resident age - Females - Other Race
Commute - mean travel time to work (minutes)
Travel time to work - Less than 5 minutes (%)
Travel time to work - Less than 5 minutes (% change since 2000)
Travel time to work - 5 to 9 minutes (%)
Travel time to work - 5 to 9 minutes (% change since 2000)
Travel time to work - 10 to 19 minutes (%)
Travel time to work - 10 to 19 minutes (% change since 2000)
Travel time to work - 20 to 29 minutes (%)
Travel time to work - 20 to 29 minutes (% change since 2000)
Travel time to work - 30 to 39 minutes (%)
Travel time to work - 30 to 39 minutes (% change since 2000)
Travel time to work - 40 to 59 minutes (%)
Travel time to work - 40 to 59 minutes (% change since 2000)
Travel time to work - 60 to 89 minutes (%)
Travel time to work - 60 to 89 minutes (% change since 2000)
Travel time to work - 90 or more minutes (%)
Travel time to work - 90 or more minutes (% change since 2000)
Marital status - Never married (%)
Marital status - Now married (%)
Marital status - Separated (%)
Marital status - Widowed (%)
Marital status - Divorced (%)
Median family income ($)
Median family income (% change since 2000)
Median non-family income ($)
Median non-family income (% change since 2000)
Median per capita income ($)
Median per capita income (% change since 2000)
Median family income ($) - White
Median family income ($) - Black or African American
Median family income ($) - Asian
Median family income ($) - Hispanic or Latino
Median family income ($) - American Indian and Alaska Native
Median family income ($) - Multirace
Median family income ($) - Other Race
Median year house/condo built
Median year apartment built
Year house built - Built 2005 or later (%)
Year house built - Built 2000 to 2004 (%)
Year house built - Built 1990 to 1999 (%)
Year house built - Built 1980 to 1989 (%)
Year house built - Built 1970 to 1979 (%)
Year house built - Built 1960 to 1969 (%)
Year house built - Built 1950 to 1959 (%)
Year house built - Built 1940 to 1949 (%)
Year house built - Built 1939 or earlier (%)
Average household size
Household density (households per square mile)
Average household size - White
Average household size - Black or African American
Average household size - Asian
Average household size - Hispanic or Latino
Average household size - American Indian and Alaska Native
Average household size - Multirace
Average household size - Other Race
Occupied housing units (%)
Vacant housing units (%)
Owner occupied housing units (%)
Renter occupied housing units (%)
Vacancy status - For rent (%)
Vacancy status - For sale only (%)
Vacancy status - Rented or sold, not occupied (%)
Vacancy status - For seasonal, recreational, or occasional use (%)
Vacancy status - For migrant workers (%)
Vacancy status - Other vacant (%)
Residents with income below the poverty level (%)
Residents with income below 50% of the poverty level (%)
Children below poverty level (%)
Poor families by family type - Married-couple family (%)
Poor families by family type - Male, no wife present (%)
Poor families by family type - Female, no husband present (%)
Poverty status for native-born residents (%)
Poverty status for foreign-born residents (%)
Poverty among high school graduates not in families (%)
Poverty among people who did not graduate high school not in families (%)
Residents with income below the poverty level (%) - White
Residents with income below the poverty level (%) - Black or African American
Residents with income below the poverty level (%) - Asian
Residents with income below the poverty level (%) - Hispanic or Latino
Residents with income below the poverty level (%) - American Indian and Alaska Native
Residents with income below the poverty level (%) - Multirace
Residents with income below the poverty level (%) - Other Race
Air pollution - Air Quality Index (AQI)
Air pollution - CO
Air pollution - NO2
Air pollution - SO2
Air pollution - Ozone
Air pollution - PM10
Air pollution - PM25
Air pollution - Pb
Crime - Murders per 100,000 population
Crime - Rapes per 100,000 population
Crime - Robberies per 100,000 population
Crime - Assaults per 100,000 population
Crime - Burglaries per 100,000 population
Crime - Thefts per 100,000 population
Crime - Auto thefts per 100,000 population
Crime - Arson per 100,000 population
Crime - City-data.com crime index
Crime - Violent crime index
Crime - Property crime index
Crime - Murders per 100,000 population (5 year average)
Crime - Rapes per 100,000 population (5 year average)
Crime - Robberies per 100,000 population (5 year average)
Crime - Assaults per 100,000 population (5 year average)
Crime - Burglaries per 100,000 population (5 year average)
Crime - Thefts per 100,000 population (5 year average)
Crime - Auto thefts per 100,000 population (5 year average)
Crime - Arson per 100,000 population (5 year average)
Crime - City-data.com crime index (5 year average)
Crime - Violent crime index (5 year average)
Crime - Property crime index (5 year average)
1996 Presidential Elections Results (%) - Democratic Party (Clinton)
1996 Presidential Elections Results (%) - Republican Party (Dole)
1996 Presidential Elections Results (%) - Other
2000 Presidential Elections Results (%) - Democratic Party (Gore)
2000 Presidential Elections Results (%) - Republican Party (Bush)
2000 Presidential Elections Results (%) - Other
2004 Presidential Elections Results (%) - Democratic Party (Kerry)
2004 Presidential Elections Results (%) - Republican Party (Bush)
2004 Presidential Elections Results (%) - Other
2008 Presidential Elections Results (%) - Democratic Party (Obama)
2008 Presidential Elections Results (%) - Republican Party (McCain)
2008 Presidential Elections Results (%) - Other
2012 Presidential Elections Results (%) - Democratic Party (Obama)
2012 Presidential Elections Results (%) - Republican Party (Romney)
2012 Presidential Elections Results (%) - Other
2016 Presidential Elections Results (%) - Democratic Party (Clinton)
2016 Presidential Elections Results (%) - Republican Party (Trump)
2016 Presidential Elections Results (%) - Other
2020 Presidential Elections Results (%) - Democratic Party (Biden)
2020 Presidential Elections Results (%) - Republican Party (Trump)
2020 Presidential Elections Results (%) - Other
Ancestries Reported - Arab (%)
Ancestries Reported - Czech (%)
Ancestries Reported - Danish (%)
Ancestries Reported - Dutch (%)
Ancestries Reported - English (%)
Ancestries Reported - French (%)
Ancestries Reported - French Canadian (%)
Ancestries Reported - German (%)
Ancestries Reported - Greek (%)
Ancestries Reported - Hungarian (%)
Ancestries Reported - Irish (%)
Ancestries Reported - Italian (%)
Ancestries Reported - Lithuanian (%)
Ancestries Reported - Norwegian (%)
Ancestries Reported - Polish (%)
Ancestries Reported - Portuguese (%)
Ancestries Reported - Russian (%)
Ancestries Reported - Scotch-Irish (%)
Ancestries Reported - Scottish (%)
Ancestries Reported - Slovak (%)
Ancestries Reported - Subsaharan African (%)
Ancestries Reported - Swedish (%)
Ancestries Reported - Swiss (%)
Ancestries Reported - Ukrainian (%)
Ancestries Reported - United States (%)
Ancestries Reported - Welsh (%)
Ancestries Reported - West Indian (%)
Ancestries Reported - Other (%)
Educational Attainment - No schooling completed (%)
Educational Attainment - Less than high school (%)
Educational Attainment - High school or equivalent (%)
Educational Attainment - Less than 1 year of college (%)
Educational Attainment - 1 or more years of college (%)
Educational Attainment - Associate degree (%)
Educational Attainment - Bachelor's degree (%)
Educational Attainment - Master's degree (%)
Educational Attainment - Professional school degree (%)
Educational Attainment - Doctorate degree (%)
School Enrollment - Nursery, preschool (%)
School Enrollment - Kindergarten (%)
School Enrollment - Grade 1 to 4 (%)
School Enrollment - Grade 5 to 8 (%)
School Enrollment - Grade 9 to 12 (%)
School Enrollment - College undergrad (%)
School Enrollment - Graduate or professional (%)
School Enrollment - Not enrolled in school (%)
School enrollment - Public schools (%)
School enrollment - Private schools (%)
School enrollment - Not enrolled (%)
Median number of rooms in houses and condos
Median number of rooms in apartments
Housing units lacking complete plumbing facilities (%)
Housing units lacking complete kitchen facilities (%)
Density of houses
Urban houses (%)
Rural houses (%)
Households with people 60 years and over (%)
Households with people 65 years and over (%)
Households with people 75 years and over (%)
Households with one or more nonrelatives (%)
Households with no nonrelatives (%)
Population in households (%)
Family households (%)
Nonfamily households (%)
Population in families (%)
Family households with own children (%)
Median number of bedrooms in owner occupied houses
Mean number of bedrooms in owner occupied houses
Median number of bedrooms in renter occupied houses
Mean number of bedrooms in renter occupied houses
Median number of vehichles in owner occupied houses
Mean number of vehichles in owner occupied houses
Median number of vehichles in renter occupied houses
Mean number of vehichles in renter occupied houses
Mortgage status - with mortgage (%)
Mortgage status - with second mortgage (%)
Mortgage status - with home equity loan (%)
Mortgage status - with both second mortgage and home equity loan (%)
Mortgage status - without a mortgage (%)
Average family size
Average family size - White
Average family size - Black or African American
Average family size - Asian
Average family size - Hispanic or Latino
Average family size - American Indian and Alaska Native
Average family size - Multirace
Average family size - Other Race
Geographical mobility - Same house 1 year ago (%)
Geographical mobility - Moved within same county (%)
Geographical mobility - Moved from different county within same state (%)
Geographical mobility - Moved from different state (%)
Geographical mobility - Moved from abroad (%)
Place of birth - Born in state of residence (%)
Place of birth - Born in other state (%)
Place of birth - Native, outside of US (%)
Place of birth - Foreign born (%)
Housing units in structures - 1, detached (%)
Housing units in structures - 1, attached (%)
Housing units in structures - 2 (%)
Housing units in structures - 3 or 4 (%)
Housing units in structures - 5 to 9 (%)
Housing units in structures - 10 to 19 (%)
Housing units in structures - 20 to 49 (%)
Housing units in structures - 50 or more (%)
Housing units in structures - Mobile home (%)
Housing units in structures - Boat, RV, van, etc. (%)
House/condo owner moved in on average (years ago)
Renter moved in on average (years ago)
Year householder moved into unit - Moved in 1999 to March 2000 (%)
Year householder moved into unit - Moved in 1995 to 1998 (%)
Year householder moved into unit - Moved in 1990 to 1994 (%)
Year householder moved into unit - Moved in 1980 to 1989 (%)
Year householder moved into unit - Moved in 1970 to 1979 (%)
Year householder moved into unit - Moved in 1969 or earlier (%)
Means of transportation to work - Drove car alone (%)
Means of transportation to work - Carpooled (%)
Means of transportation to work - Public transportation (%)
Means of transportation to work - Bus or trolley bus (%)
Means of transportation to work - Streetcar or trolley car (%)
Means of transportation to work - Subway or elevated (%)
Means of transportation to work - Railroad (%)
Means of transportation to work - Ferryboat (%)
Means of transportation to work - Taxicab (%)
Means of transportation to work - Motorcycle (%)
Means of transportation to work - Bicycle (%)
Means of transportation to work - Walked (%)
Means of transportation to work - Other means (%)
Working at home (%)
Industry diversity
Most Common Industries - Agriculture, forestry, fishing and hunting, and mining (%)
Most Common Industries - Agriculture, forestry, fishing and hunting (%)
Most Common Industries - Mining, quarrying, and oil and gas extraction (%)
Most Common Industries - Construction (%)
Most Common Industries - Manufacturing (%)
Most Common Industries - Wholesale trade (%)
Most Common Industries - Retail trade (%)
Most Common Industries - Transportation and warehousing, and utilities (%)
Most Common Industries - Transportation and warehousing (%)
Most Common Industries - Utilities (%)
Most Common Industries - Information (%)
Most Common Industries - Finance and insurance, and real estate and rental and leasing (%)
Most Common Industries - Finance and insurance (%)
Most Common Industries - Real estate and rental and leasing (%)
Most Common Industries - Professional, scientific, and management, and administrative and waste management services (%)
Most Common Industries - Professional, scientific, and technical services (%)
Most Common Industries - Management of companies and enterprises (%)
Most Common Industries - Administrative and support and waste management services (%)
Most Common Industries - Educational services, and health care and social assistance (%)
Most Common Industries - Educational services (%)
Most Common Industries - Health care and social assistance (%)
Most Common Industries - Arts, entertainment, and recreation, and accommodation and food services (%)
Most Common Industries - Arts, entertainment, and recreation (%)
Most Common Industries - Accommodation and food services (%)
Most Common Industries - Other services, except public administration (%)
Most Common Industries - Public administration (%)
Occupation diversity
Most Common Occupations - Management, business, science, and arts occupations (%)
Most Common Occupations - Management, business, and financial occupations (%)
Most Common Occupations - Management occupations (%)
Most Common Occupations - Business and financial operations occupations (%)
Most Common Occupations - Computer, engineering, and science occupations (%)
Most Common Occupations - Computer and mathematical occupations (%)
Most Common Occupations - Architecture and engineering occupations (%)
Most Common Occupations - Life, physical, and social science occupations (%)
Most Common Occupations - Education, legal, community service, arts, and media occupations (%)
Most Common Occupations - Community and social service occupations (%)
Most Common Occupations - Legal occupations (%)
Most Common Occupations - Education, training, and library occupations (%)
Most Common Occupations - Arts, design, entertainment, sports, and media occupations (%)
Most Common Occupations - Healthcare practitioners and technical occupations (%)
Most Common Occupations - Health diagnosing and treating practitioners and other technical occupations (%)
Most Common Occupations - Health technologists and technicians (%)
Most Common Occupations - Service occupations (%)
Most Common Occupations - Healthcare support occupations (%)
Most Common Occupations - Protective service occupations (%)
Most Common Occupations - Fire fighting and prevention, and other protective service workers including supervisors (%)
Most Common Occupations - Law enforcement workers including supervisors (%)
Most Common Occupations - Food preparation and serving related occupations (%)
Most Common Occupations - Building and grounds cleaning and maintenance occupations (%)
Most Common Occupations - Personal care and service occupations (%)
Most Common Occupations - Sales and office occupations (%)
Most Common Occupations - Sales and related occupations (%)
Most Common Occupations - Office and administrative support occupations (%)
Most Common Occupations - Natural resources, construction, and maintenance occupations (%)
Most Common Occupations - Farming, fishing, and forestry occupations (%)
Most Common Occupations - Construction and extraction occupations (%)
Most Common Occupations - Installation, maintenance, and repair occupations (%)
Most Common Occupations - Production, transportation, and material moving occupations (%)
Most Common Occupations - Production occupations (%)
Most Common Occupations - Transportation occupations (%)
Most Common Occupations - Material moving occupations (%)
People in Group quarters - Institutionalized population (%)
People in Group quarters - Correctional institutions (%)
People in Group quarters - Federal prisons and detention centers (%)
People in Group quarters - Halfway houses (%)
People in Group quarters - Local jails and other confinement facilities (including police lockups) (%)
People in Group quarters - Military disciplinary barracks (%)
People in Group quarters - State prisons (%)
People in Group quarters - Other types of correctional institutions (%)
People in Group quarters - Nursing homes (%)
People in Group quarters - Hospitals/wards, hospices, and schools for the handicapped (%)
People in Group quarters - Hospitals/wards and hospices for chronically ill (%)
People in Group quarters - Hospices or homes for chronically ill (%)
People in Group quarters - Military hospitals or wards for chronically ill (%)
People in Group quarters - Other hospitals or wards for chronically ill (%)
People in Group quarters - Hospitals or wards for drug/alcohol abuse (%)
People in Group quarters - Mental (Psychiatric) hospitals or wards (%)
People in Group quarters - Schools, hospitals, or wards for the mentally retarded (%)
People in Group quarters - Schools, hospitals, or wards for the physically handicapped (%)
People in Group quarters - Institutions for the deaf (%)
People in Group quarters - Institutions for the blind (%)
People in Group quarters - Orthopedic wards and institutions for the physically handicapped (%)
People in Group quarters - Wards in general hospitals for patients who have no usual home elsewhere (%)
People in Group quarters - Wards in military hospitals for patients who have no usual home elsewhere (%)
People in Group quarters - Juvenile institutions (%)
People in Group quarters - Long-term care (%)
People in Group quarters - Homes for abused, dependent, and neglected children (%)
People in Group quarters - Residential treatment centers for emotionally disturbed children (%)
People in Group quarters - Training schools for juvenile delinquents (%)
People in Group quarters - Short-term care, detention or diagnostic centers for delinquent children (%)
People in Group quarters - Type of juvenile institution unknown (%)
People in Group quarters - Noninstitutionalized population (%)
People in Group quarters - College dormitories (includes college quarters off campus) (%)
People in Group quarters - Military quarters (%)
People in Group quarters - On base (%)
People in Group quarters - Barracks, unaccompanied personnel housing (UPH), (Enlisted/Officer), ;and similar group living quarters for military personnel (%)
People in Group quarters - Transient quarters for temporary residents (%)
People in Group quarters - Military ships (%)
People in Group quarters - Group homes (%)
People in Group quarters - Homes or halfway houses for drug/alcohol abuse (%)
People in Group quarters - Homes for the mentally ill (%)
People in Group quarters - Homes for the mentally retarded (%)
People in Group quarters - Homes for the physically handicapped (%)
People in Group quarters - Other group homes (%)
People in Group quarters - Religious group quarters (%)
People in Group quarters - Dormitories (%)
People in Group quarters - Agriculture workers' dormitories on farms (%)
People in Group quarters - Job Corps and vocational training facilities (%)
People in Group quarters - Other workers' dormitories (%)
People in Group quarters - Crews of maritime vessels (%)
People in Group quarters - Other nonhousehold living situations (%)
People in Group quarters - Other noninstitutional group quarters (%)
Residents speaking English at home (%)
Residents speaking English at home - Born in the United States (%)
Residents speaking English at home - Native, born elsewhere (%)
Residents speaking English at home - Foreign born (%)
Residents speaking Spanish at home (%)
Residents speaking Spanish at home - Born in the United States (%)
Residents speaking Spanish at home - Native, born elsewhere (%)
Residents speaking Spanish at home - Foreign born (%)
Residents speaking other language at home (%)
Residents speaking other language at home - Born in the United States (%)
Residents speaking other language at home - Native, born elsewhere (%)
Residents speaking other language at home - Foreign born (%)
Class of Workers - Employee of private company (%)
Class of Workers - Self-employed in own incorporated business (%)
Class of Workers - Private not-for-profit wage and salary workers (%)
Class of Workers - Local government workers (%)
Class of Workers - State government workers (%)
Class of Workers - Federal government workers (%)
Class of Workers - Self-employed workers in own not incorporated business and Unpaid family workers (%)
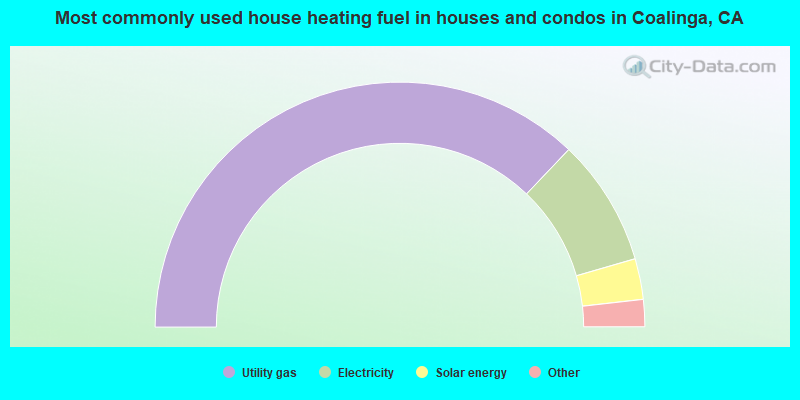
House heating fuel used in houses and condos - Utility gas (%)
House heating fuel used in houses and condos - Bottled, tank, or LP gas (%)
House heating fuel used in houses and condos - Electricity (%)
House heating fuel used in houses and condos - Fuel oil, kerosene, etc. (%)
House heating fuel used in houses and condos - Coal or coke (%)
House heating fuel used in houses and condos - Wood (%)
House heating fuel used in houses and condos - Solar energy (%)
House heating fuel used in houses and condos - Other fuel (%)
House heating fuel used in houses and condos - No fuel used (%)
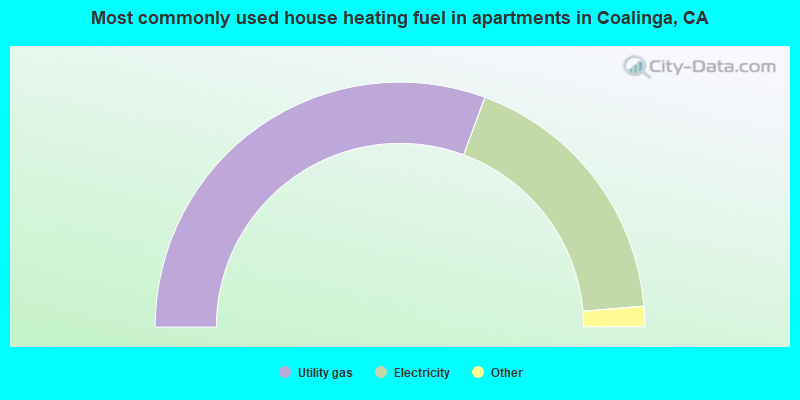
House heating fuel used in apartments - Utility gas (%)
House heating fuel used in apartments - Bottled, tank, or LP gas (%)
House heating fuel used in apartments - Electricity (%)
House heating fuel used in apartments - Fuel oil, kerosene, etc. (%)
House heating fuel used in apartments - Coal or coke (%)
House heating fuel used in apartments - Wood (%)
House heating fuel used in apartments - Solar energy (%)
House heating fuel used in apartments - Other fuel (%)
House heating fuel used in apartments - No fuel used (%)
Armed forces status - In Armed Forces (%)
Armed forces status - Civilian (%)
Armed forces status - Civilian - Veteran (%)
Armed forces status - Civilian - Nonveteran (%)
Fatal accidents locations in years 2005-2021
Fatal accidents locations in 2005
Fatal accidents locations in 2006
Fatal accidents locations in 2007
Fatal accidents locations in 2008
Fatal accidents locations in 2009
Fatal accidents locations in 2010
Fatal accidents locations in 2011
Fatal accidents locations in 2012
Fatal accidents locations in 2013
Fatal accidents locations in 2014
Fatal accidents locations in 2015
Fatal accidents locations in 2016
Fatal accidents locations in 2017
Fatal accidents locations in 2018
Fatal accidents locations in 2019
Fatal accidents locations in 2020
Fatal accidents locations in 2021
Alcohol use - People drinking some alcohol every month (%)
Alcohol use - People not drinking at all (%)
Alcohol use - Average days/month drinking alcohol
Alcohol use - Average drinks/week
Alcohol use - Average days/year people drink much
Audiometry - Average condition of hearing (%)
Audiometry - People that can hear a whisper from across a quiet room (%)
Audiometry - People that can hear normal voice from across a quiet room (%)
Audiometry - Ears ringing, roaring, buzzing (%)
Audiometry - Had a job exposure to loud noise (%)
Audiometry - Had off-work exposure to loud noise (%)
Blood Pressure & Cholesterol - Has high blood pressure (%)
Blood Pressure & Cholesterol - Checking blood pressure at home (%)
Blood Pressure & Cholesterol - Frequently checking blood cholesterol (%)
Blood Pressure & Cholesterol - Has high cholesterol level (%)
Consumer Behavior - Money monthly spent on food at supermarket/grocery store
Consumer Behavior - Money monthly spent on food at other stores
Consumer Behavior - Money monthly spent on eating out
Consumer Behavior - Money monthly spent on carryout/delivered foods
Consumer Behavior - Income spent on food at supermarket/grocery store (%)
Consumer Behavior - Income spent on food at other stores (%)
Consumer Behavior - Income spent on eating out (%)
Consumer Behavior - Income spent on carryout/delivered foods (%)
Current Health Status - General health condition (%)
Current Health Status - Blood donors (%)
Current Health Status - Has blood ever tested for HIV virus (%)
Current Health Status - Left-handed people (%)
Dermatology - People using sunscreen (%)
Diabetes - Diabetics (%)
Diabetes - Had a blood test for high blood sugar (%)
Diabetes - People taking insulin (%)
Diet Behavior & Nutrition - Diet health (%)
Diet Behavior & Nutrition - Milk product consumption (# of products/month)
Diet Behavior & Nutrition - Meals not home prepared (#/week)
Diet Behavior & Nutrition - Meals from fast food or pizza place (#/week)
Diet Behavior & Nutrition - Ready-to-eat foods (#/month)
Diet Behavior & Nutrition - Frozen meals/pizza (#/month)
Drug Use - People that ever used marijuana or hashish (%)
Drug Use - Ever used hard drugs (%)
Drug Use - Ever used any form of cocaine (%)
Drug Use - Ever used heroin (%)
Drug Use - Ever used methamphetamine (%)
Health Insurance - People covered by health insurance (%)
Kidney Conditions-Urology - Avg. # of times urinating at night
Medical Conditions - People with asthma (%)
Medical Conditions - People with anemia (%)
Medical Conditions - People with psoriasis (%)
Medical Conditions - People with overweight (%)
Medical Conditions - Elderly people having difficulties in thinking or remembering (%)
Medical Conditions - People who ever received blood transfusion (%)
Medical Conditions - People having trouble seeing even with glass/contacts (%)
Medical Conditions - People with arthritis (%)
Medical Conditions - People with gout (%)
Medical Conditions - People with congestive heart failure (%)
Medical Conditions - People with coronary heart disease (%)
Medical Conditions - People with angina pectoris (%)
Medical Conditions - People who ever had heart attack (%)
Medical Conditions - People who ever had stroke (%)
Medical Conditions - People with emphysema (%)
Medical Conditions - People with thyroid problem (%)
Medical Conditions - People with chronic bronchitis (%)
Medical Conditions - People with any liver condition (%)
Medical Conditions - People who ever had cancer or malignancy (%)
Mental Health - People who have little interest in doing things (%)
Mental Health - People feeling down, depressed, or hopeless (%)
Mental Health - People who have trouble sleeping or sleeping too much (%)
Mental Health - People feeling tired or having little energy (%)
Mental Health - People with poor appetite or overeating (%)
Mental Health - People feeling bad about themself (%)
Mental Health - People who have trouble concentrating on things (%)
Mental Health - People moving or speaking slowly or too fast (%)
Mental Health - People having thoughts they would be better off dead (%)
Oral Health - Average years since last visit a dentist
Oral Health - People embarrassed because of mouth (%)
Oral Health - People with gum disease (%)
Oral Health - General health of teeth and gums (%)
Oral Health - Average days a week using dental floss/device
Oral Health - Average days a week using mouthwash for dental problem
Oral Health - Average number of teeth
Pesticide Use - Households using pesticides to control insects (%)
Pesticide Use - Households using pesticides to kill weeds (%)
Physical Activity - People doing vigorous-intensity work activities (%)
Physical Activity - People doing moderate-intensity work activities (%)
Physical Activity - People walking or bicycling (%)
Physical Activity - People doing vigorous-intensity recreational activities (%)
Physical Activity - People doing moderate-intensity recreational activities (%)
Physical Activity - Average hours a day doing sedentary activities
Physical Activity - Average hours a day watching TV or videos
Physical Activity - Average hours a day using computer
Physical Functioning - People having limitations keeping them from working (%)
Physical Functioning - People limited in amount of work they can do (%)
Physical Functioning - People that need special equipment to walk (%)
Physical Functioning - People experiencing confusion/memory problems (%)
Physical Functioning - People requiring special healthcare equipment (%)
Prescription Medications - Average number of prescription medicines taking
Preventive Aspirin Use - Adults 40+ taking low-dose aspirin (%)
Reproductive Health - Vaginal deliveries (%)
Reproductive Health - Cesarean deliveries (%)
Reproductive Health - Deliveries resulted in a live birth (%)
Reproductive Health - Pregnancies resulted in a delivery (%)
Reproductive Health - Women breastfeeding newborns (%)
Reproductive Health - Women that had a hysterectomy (%)
Reproductive Health - Women that had both ovaries removed (%)
Reproductive Health - Women that have ever taken birth control pills (%)
Reproductive Health - Women taking birth control pills (%)
Reproductive Health - Women that have ever used Depo-Provera or injectables (%)
Reproductive Health - Women that have ever used female hormones (%)
Sexual Behavior - People 18+ that ever had sex (vaginal, anal, or oral) (%)
Sexual Behavior - Males 18+ that ever had vaginal sex with a woman (%)
Sexual Behavior - Males 18+ that ever performed oral sex on a woman (%)
Sexual Behavior - Males 18+ that ever had anal sex with a woman (%)
Sexual Behavior - Males 18+ that ever had any sex with a man (%)
Sexual Behavior - Females 18+ that ever had vaginal sex with a man (%)
Sexual Behavior - Females 18+ that ever performed oral sex on a man (%)
Sexual Behavior - Females 18+ that ever had anal sex with a man (%)
Sexual Behavior - Females 18+ that ever had any kind of sex with a woman (%)
Sexual Behavior - Average age people first had sex
Sexual Behavior - Average number of female sex partners in lifetime (males 18+)
Sexual Behavior - Average number of female vaginal sex partners in lifetime (males 18+)
Sexual Behavior - Average age people first performed oral sex on a woman (18+)
Sexual Behavior - Average number of woman performed oral sex on in lifetime (18+)
Sexual Behavior - Average number of male sex partners in lifetime (males 18+)
Sexual Behavior - Average number of male anal sex partners in lifetime (males 18+)
Sexual Behavior - Average age people first performed oral sex on a man (18+)
Sexual Behavior - Average number of male oral sex partners in lifetime (18+)
Sexual Behavior - People using protection when performing oral sex (%)
Sexual Behavior - Average number of times people have vaginal or anal sex a year
Sexual Behavior - People having sex without condom (%)
Sexual Behavior - Average number of male sex partners in lifetime (females 18+)
Sexual Behavior - Average number of male vaginal sex partners in lifetime (females 18+)
Sexual Behavior - Average number of female sex partners in lifetime (females 18+)
Sexual Behavior - Circumcised males 18+ (%)
Sleep Disorders - Average hours sleeping at night
Sleep Disorders - People that has trouble sleeping (%)
Smoking-Cigarette Use - People smoking cigarettes (%)
Taste & Smell - People 40+ having problems with smell (%)
Taste & Smell - People 40+ having problems with taste (%)
Taste & Smell - People 40+ that ever had wisdom teeth removed (%)
Taste & Smell - People 40+ that ever had tonsils teeth removed (%)
Taste & Smell - People 40+ that ever had a loss of consciousness because of a head injury (%)
Taste & Smell - People 40+ that ever had a broken nose or other serious injury to face or skull (%)
Taste & Smell - People 40+ that ever had two or more sinus infections (%)
Weight - Average height (inches)
Weight - Average weight (pounds)
Weight - Average BMI
Weight - People that are obese (%)
Weight - People that ever were obese (%)
Weight - People trying to lose weight (%)
11,267 64.0% Hispanic 4,384 24.9% White alone 689 3.9% Black alone 380 2.2% American Indian alone 383 2.2% Asian alone 342 1.9% Two or more races 132 0.7% Other race alone 43 0.2% Native Hawaiian and Other
According to our research of California and other state lists, there were 20 registered sex offenders living in Coalinga, California as of April 27, 2024 . The ratio of all residents to sex offenders in Coalinga is 845 to 1.The ratio of registered sex offenders to all residents in this city is near the state average.
Officers per 1,000 residents here:
0.86California average:
2.30
Latest news from Coalinga, CA collected exclusively by city-data.com from local newspapers, TV, and radio stations
Ancestries: American (3.4%), English (3.2%), German (2.7%), Irish (1.8%), European (1.2%).
Current Local Time:
Land area: 5.94 square miles.
Population density: 2,865 people per square mile (average).
3,595 residents are foreign born (17.8% Latin America ).
This city:
20.4%California:
26.5%
Median real estate property taxes paid for housing units with mortgages in 2022: $2,134 (0.8%)Median real estate property taxes paid for housing units with no mortgage in 2022: $1,479 (0.6%)
Nearest city with pop. 50,000+: Fresno, CA
Nearest city with pop. 1,000,000+: Los Angeles, CA
Nearest cities:
Bradley, CA (5.6 miles)
Latitude: 36.14 N, Longitude: 120.36 W
Daytime population change due to commuting: -539 (-3.1%)Workers who live and work in this city: 2,242 (38.7%)
Property values in Coalinga, CA
Single-family new house construction building permits:
2019: 70 buildings , average cost: $246,0002018: 42 buildings , average cost: $230,9002017: 46 buildings , average cost: $180,4002016: 1 building , cost: $105,0002015: 3 buildings , average cost: $225,3002014: 6 buildings , average cost: $214,3002013: 8 buildings , average cost: $214,3002008: 13 buildings , average cost: $214,3002007: 72 buildings , average cost: $210,0002006: 53 buildings , average cost: $162,2002005: 113 buildings , average cost: $474,7002004: 73 buildings , average cost: $118,9002003: 62 buildings , average cost: $115,9002002: 31 buildings , average cost: $108,7002001: 4 buildings , average cost: $79,0002000: 15 buildings , average cost: $119,8001999: 23 buildings , average cost: $98,0001998: 23 buildings , average cost: $93,1001997: 42 buildings , average cost: $83,300Unemployment in December 2023:
Most common industries in Coalinga, CA (%)
Both Males Females
Public administration (18.8%)
Educational services (15.2%)
Agriculture, forestry, fishing & hunting (12.3%)
Accommodation & food services (11.2%)
Health care (6.1%)
Construction (4.1%)
Mining, quarrying, oil & gas extraction (3.7%)
Public administration (19.1%)
Agriculture, forestry, fishing & hunting (18.4%)
Educational services (10.6%)
Construction (7.1%)
Accommodation & food services (6.6%)
Mining, quarrying, oil & gas extraction (6.1%)
Administrative & support & waste management services (3.5%)
Educational services (21.4%)
Public administration (18.3%)
Accommodation & food services (17.3%)
Health care (11.5%)
Agriculture, forestry, fishing & hunting (4.1%)
Department & other general merchandise stores (3.2%)
Food & beverage stores (2.9%)
Most common occupations in Coalinga, CA (%)
Both Males Females
Agricultural workers, including supervisors (10.2%)
Law enforcement workers, including supervisors (8.4%)
Building and grounds cleaning and maintenance occupations (7.3%)
Preschool, kindergarten, elementary, and middle school teachers (6.0%)
Other management occupations, except farmers and farm managers (3.4%)
Other office and administrative support workers, including supervisors (3.4%)
Cashiers (3.3%)
Agricultural workers, including supervisors (15.3%)
Law enforcement workers, including supervisors (10.7%)
Building and grounds cleaning and maintenance occupations (7.7%)
Driver/sales workers and truck drivers (4.9%)
Electrical equipment mechanics and other installation, maintenance, and repair workers, including supervisors (4.6%)
Other management occupations, except farmers and farm managers (3.6%)
Vehicle and mobile equipment mechanics, installers, and repairers (3.3%)
Preschool, kindergarten, elementary, and middle school teachers (10.2%)
Building and grounds cleaning and maintenance occupations (6.7%)
Other office and administrative support workers, including supervisors (6.2%)
Secretaries and administrative assistants (5.8%)
Law enforcement workers, including supervisors (5.3%)
Cashiers (5.2%)
Other teachers, instructors, education, training, and library occupations (4.4%)
Air pollution and air quality trends(lower is better)
AQI PM2.5
Earthquake activity:
Coalinga-area historical earthquake activity is significantly above California state average. It is 8146% greater than the overall U.S. average. On 7/21/1952 at 11:52:14, a magnitude 7.7 (7.7 UK, Class: Major, Intensity: VIII - XII) earthquake occurred 109.8 miles away from Coalinga center, causing $50,000,000 total damage On 11/4/1927 at 13:51:53, a magnitude 7.5 (7.5 UK) earthquake occurred 92.9 miles away from Coalinga center On 4/18/1906 at 13:12:21, a magnitude 7.9 (7.9 UK) earthquake occurred 194.4 miles away from the city center, causing $524,000,000 total damage On 10/18/1989 at 00:04:15, a magnitude 7.1 (6.5 MB, 7.1 MS, 6.9 MW, 7.0 ML) earthquake occurred 103.1 miles away from the city center, causing 62 deaths ( 62 shaking deaths) and 3757 injuries, causing $1,305,032,704 total damage On 5/2/1983 at 23:42:37, a magnitude 6.7 (6.2 MB, 6.5 MS, 6.5 MW, 6.7 ML, Class: Strong, Intensity: VII - IX) earthquake occurred 6.1 miles away from the city center, causing $31,000,000 total damage On 6/28/1992 at 11:57:34, a magnitude 7.6 (6.2 MB, 7.6 MS, 7.3 MW, Depth: 0.7 mi) earthquake occurred 255.2 miles away from the city center, causing 3 deaths ( 1 shaking deaths, 2 other deaths) and 400 injuries, causing $100,000,000 total damage and $40,000,000 insured lossesMagnitude types: body-wave magnitude (MB), local magnitude (ML), surface-wave magnitude (MS), moment magnitude (MW) Natural disasters: The number of natural disasters in Fresno County (12) is smaller than the US average (15).Major Disasters (Presidential) Declared: 8Emergencies Declared: 2Floods: 6, Storms: 4, Winter Storms: 3, Freezes: 2, Landslides: 2, Drought: 1, Fire: 1, Hurricane: 1, Other: 1 (Note: some incidents may be assigned to more than one category). Hospitals and medical centers in Coalinga: COALINGA REGIONAL MEDICAL CENTER (Government - Hospital District or Authority, provides emergency services, 1191 PHELPS AVENUE) COALINGA DISTINGUISHED COMMUNITY CARE, INC (834 MAPLE ROAD)
COALINGA REGIONAL MEDICAL CTR DP/SNF (1191 PHELPS AVE.)
Colleges/Universities in Coalinga: West Hills College-Coalinga Full-time enrollment: 1,627; Location: 300 Cherry Lane; Public; Website: www.westhillscollege.com)
West Hills Community College District Location: 9900 Cody Street; Public; Website: www.westhillscollege.com)
Colleges/universities with over 2000 students nearest to Coalinga:
West Hills College-Lemoore (about 32 miles; Lemoore, CA ; Full-time enrollment: 2,314)
Fresno Pacific University (about 54 miles; Fresno, CA ; FT enrollment: 3,083)
Fresno City College (about 54 miles; Fresno, CA ; FT enrollment: 12,994)
San Joaquin Valley College-Visalia (about 56 miles; Visalia, CA ; FT enrollment: 2,386)
Heald College-Fresno (about 57 miles; Fresno, CA ; FT enrollment: 2,199)
California State University-Fresno (about 58 miles; Fresno, CA ; FT enrollment: 18,993)
University of Phoenix-Central Valley Campus (about 59 miles; Fresno, CA ; FT enrollment: 2,109)
Public high schools in Coalinga:
Private high school in Coalinga: FAITH CHRISTIAN ACADEMY Students: 116, Location: 450 W ELM ST, Grades: PK-12)
Public elementary/middle schools in Coalinga:
See full list of schools located in Coalinga Library in Coalinga: COALINGA-HURON UNIFIED SCHOOL DISTRICT LIBR Operating income: $1,077,233; Location: 305 N. FOURTH ST.; 83,402 books ; 280 e-books ; 1,201 audio materials ; 2,312 video materials ; 6 local licensed databases ; 6 state licensed databases ; 118 print serial subscriptions )
Notable locations in Coalinga: (A) , R C Baker Memorial Museum (B) , Coalinga-Huron Library (C) , Coalinga Fire Department (D) , Coalinga Community Center (E) , Coalinga City Hall (F) , Pleasant Valley State Prison Fire Department (G) , Fresno County Fire Protection District Coalinga (H) , Coalinga State Hospital Fire Services (I) . Display/hide their locations on the map
Shopping Centers: (1) , Coalinga Shopping Center (2) . Display/hide their locations on the map
Cemetery: (1) . Display/hide its location on the map
Creek: (A) . Display/hide its location on the map
Parks in Coalinga include: (1) , Falcon Baseball Field (2) , Keck Park (3) , Olsen Park (4) . Display/hide their locations on the map
Tourist attraction: (1) . Display/hide its approximate location on the map
Hotel: (1) . Display/hide its approximate location on the map
Birthplace of: Bill Jones (California politician) - Politician, Jo Stafford - (born 1917), singer, Buddy McDonald - Child actor, Daryl Patterson - Baseball player, Don Bracken - Football player, Paul Green (American football) - Football player.
Fresno County has a predicted average indoor radon screening level between 2 and 4 pCi/L (pico curies per liter) - Moderate Potential Drinking water stations with addresses in Coalinga that have no violations reported:
SOMMERVILLE ALMOND TREE OWNERS ASSN (Population served: 500, Primary Water Source Type: Groundwater)
Average household size: This city:
3.0 peopleCalifornia:
2.9 people
Percentage of family households: This city:
74.0%Whole state:
68.7%
Percentage of households with unmarried partners: This city:
9.2%Whole state:
7.2%
Likely homosexual households (counted as self-reported same-sex unmarried-partner households)
Lesbian couples: 0.3% of all households Gay men: 0.1% of all households
People in group quarters in Coalinga in 2010:
945 people in correctional residential facilities
255 people in federal detention centers
223 people in state prisons
110 people in college/university student housing
75 people in nursing facilities/skilled-nursing facilities
16 people in workers' group living quarters and job corps centers
4 people in other noninstitutional facilities
People in group quarters in Coalinga in 2000:
422 people in state prisons
183 people in other noninstitutional group quarters
118 people in college dormitories (includes college quarters off campus)
82 people in nursing homes
Banks with branches in Coalinga (2011 data):
Union Bank, National Association: Coalinga Branch at 190 West Durian Street, branch established on 1960/05/09. Info updated 2011/09/01: Bank assets: $88,967.5 mil, Deposits: $65,286.4 mil, headquarters in San Francisco, CA, positive income , Commercial Lending Specialization, 403 total offices , Holding Company: Mitsubishi Ufj Financial Group, Inc.
United Security Bank: Coalinga Branch at 145 East Durian Street, branch established on 1960/05/01. Info updated 2007/02/28: Bank assets: $656.0 mil, Deposits: $574.5 mil, headquarters in Fresno, CA, negative income in the last year , Commercial Lending Specialization, 13 total offices , Holding Company: United Security Bancshares
For population 15 years and over in Coalinga:
Never married: 45.6%Now married: 39.0%Separated: 4.3%Widowed: 2.9%Divorced: 8.2% For population 25 years and over in Coalinga:
High school or higher: 69.9%Bachelor's degree or higher: 12.0%Graduate or professional degree: 4.1%Unemployed: 13.6%Mean travel time to work (commute): 19.9 minutes
Education Gini index (Inequality in education) Here:
17.1California average:
15.5
Religion statistics for Coalinga, CA (based on Fresno County data)
Religion Adherents Congregations Catholic 288,324 43 Evangelical Protestant 126,004 463 Other 37,977 95 Mainline Protestant 16,843 70 Orthodox 7,768 9 Black Protestant 4,160 21 None 449,374 -
Source: Clifford Grammich, Kirk Hadaway, Richard Houseal, Dale E.Jones, Alexei Krindatch, Richie Stanley and Richard H.Taylor. 2012. 2010 U.S.Religion Census: Religious Congregations & Membership Study. Association of Statisticians of American Religious Bodies. Jones, Dale E., et al. 2002. Congregations and Membership in the United States 2000. Nashville, TN: Glenmary Research Center. Graphs represent county-level data
Food Environment Statistics: Number of grocery stores : 215Here :
2.40 / 10,000 pop.California :
2.14 / 10,000 pop.
Number of supercenters and club stores : 4This county :
0.04 / 10,000 pop.State :
0.04 / 10,000 pop.
Number of convenience stores (no gas) : 108Fresno County :
1.21 / 10,000 pop.State :
0.62 / 10,000 pop.
Number of convenience stores (with gas) : 190Fresno County :
2.12 / 10,000 pop.State :
1.49 / 10,000 pop.
Number of full-service restaurants : 516Fresno County :
5.77 / 10,000 pop.California :
7.42 / 10,000 pop.
Adult diabetes rate : This county :
7.6%California :
7.3%
Adult obesity rate : This county :
26.4%California :
21.3%
Low-income preschool obesity rate : This county :
17.5%State :
17.9%
Health and Nutrition: Healthy diet rate : Coalinga:
46.0%California:
49.4%
Average overall health of teeth and gums : Coalinga:
45.0%California:
48.0%
Average BMI : Coalinga:
28.4California:
28.1
People feeling badly about themselves : Here:
23.0%California:
20.2%
People not drinking alcohol at all : Coalinga:
9.8%California:
11.2%
Average hours sleeping at night : This city:
6.8California:
6.8
Overweight people : Coalinga:
31.1%State:
31.5%
General health condition : Coalinga:
54.4%California:
56.4%
Average condition of hearing : Coalinga:
80.5%California:
80.9%
More about Health and Nutrition of Coalinga, CA Residents
Local government employment and payroll (March 2022)
Function
Full-time employees
Monthly full-time payroll
Average yearly full-time wage
Part-time employees
Monthly part-time payroll
Firefighters
22 $207,224 $113,031 4 $20,163 Police Protection - Officers
16 $120,311 $90,233 0 $0 Financial Administration
12 $73,494 $73,494 0 $0 Streets and Highways
10 $42,731 $51,277 0 $0 Police - Other
6 $22,805 $45,610 2 $2,549 Other Government Administration
6 $38,737 $77,474 5 $1,533 Sewerage
4 $26,979 $80,937 0 $0 Solid Waste Management
1 $4,019 $48,228 0 $0 Other and Unallocable
1 $7,387 $88,644 0 $0 Housing and Community Development (Local)
1 $13,233 $158,796 0 $0
Totals for Government
79 $556,919 $84,595 11 $24,245
Coalinga government finances - Expenditure in 2017 (per resident):
Construction - Housing and Community Development: $718,000 ($42.18)
Protective Inspection and Regulation - Other: $420,000 ($24.67)Current Operations - Water Utilities: $3,578,000 ($210.17)
Police Protection: $3,383,000 ($198.72)Local Fire Protection: $2,593,000 ($152.31)Solid Waste Management: $1,708,000 ($100.33)Sewerage: $1,452,000 ($85.29)Gas Utilities: $1,374,000 ($80.71)Financial Administration: $1,065,000 ($62.56)Central Staff Services: $692,000 ($40.65)Regular Highways: $506,000 ($29.72)Health - Other: $405,000 ($23.79)Parks and Recreation: $392,000 ($23.03)Transit Utilities: $303,000 ($17.80)Housing and Community Development: $200,000 ($11.75)Air Transportation: $111,000 ($6.52)General - Interest on Debt: $1,328,000 ($78.01)
Other Capital Outlay - Regular Highways: $122,000 ($7.17)
Water Utilities: $94,000 ($5.52)Local Fire Protection: $66,000 ($3.88)Police Protection: $35,000 ($2.06)Sewerage: $10,000 ($0.59)Central Staff Services: $8,000 ($0.47)Financial Administration: $7,000 ($0.41)Air Transportation: $5,000 ($0.29)Water Utilities - Interest on Debt: $350,000 ($20.56)
Coalinga government finances - Revenue in 2017 (per resident):
Charges - Other: $2,455,000 ($144.21)
Solid Waste Management: $1,733,000 ($101.80)Sewerage: $1,384,000 ($81.30)Regular Highways: $120,000 ($7.05)Air Transportation: $65,000 ($3.82)Parks and Recreation: $16,000 ($0.94)Federal Intergovernmental - Other: $1,647,000 ($96.75)
Miscellaneous - Sale of Property: $4,087,000 ($240.07)
Interest Earnings: $1,329,000 ($78.07)General Revenue - Other: $89,000 ($5.23)Rents: $44,000 ($2.58)Fines and Forfeits: $25,000 ($1.47)Donations From Private Sources: $4,000 ($0.23)Revenue - Water Utilities: $4,684,000 ($275.14)
Gas Utilities: $1,635,000 ($96.04)Transit Utilities: $526,000 ($30.90)State Intergovernmental - Other: $4,529,000 ($266.04)
Highways: $340,000 ($19.97)Water Utilities: $30,000 ($1.76)General Local Government Support: $16,000 ($0.94)Tax - Property: $2,908,000 ($170.82)
General Sales and Gross Receipts: $749,000 ($44.00)Other: $424,000 ($24.91)Other License: $355,000 ($20.85)Public Utilities Sales: $323,000 ($18.97)Occupation and Business License - Other: $103,000 ($6.05)Other Selective Sales: $20,000 ($1.17)Documentary and Stock Transfer: $19,000 ($1.12)
Coalinga government finances - Debt in 2017 (per resident):
Long Term Debt - Beginning Outstanding - Unspecified Public Purpose: $23,631,000 ($1388.10)
Outstanding Unspecified Public Purpose: $22,181,000 ($1302.93)Retired Unspecified Public Purpose: $1,450,000 ($85.17)
Coalinga government finances - Cash and Securities in 2017 (per resident):
Bond Funds - Cash and Securities: $324,000 ($19.03)
Other Funds - Cash and Securities: $16,098,000 ($945.61)
Sinking Funds - Cash and Securities: $3,752,000 ($220.39)
3.57% of this county's 2021 resident taxpayers lived in other counties in 2020 ($51,894 average adjusted gross income )
Here:
3.57%California average:
5.19%
0.01% of residents moved from foreign countries ($87 average AGI )Fresno County:
0.01%California average:
0.03%
Top counties from which taxpayers relocated into this county between 2020 and 2021:
3.88% of this county's 2020 resident taxpayers moved to other counties in 2021 ($61,665 average adjusted gross income )
Here:
3.88%California average:
6.14%
0.01% of residents moved to foreign countries ($93 average AGI )Fresno County:
0.01%California average:
0.02%
Top counties to which taxpayers relocated from this county between 2020 and 2021:
Businesses in Coalinga, CA
Name Count Name Count
Ace Hardware 1 Kmart 1 AutoZone 1 McDonald's 2 Baja Fresh Mexican Grill 1 Motel 6 1 Best Western 1 RadioShack 1 Burger King 2 Rite Aid 1 Carl\s Jr. 1 Starbucks 1 Cricket Wireless 1 Taco Bell 1 Dennys 1 Travelodge 1 FedEx 2 U-Haul 1 GNC 1 Walgreens 1 H&R Block 1
Strongest AM radio stations in Coalinga:
KKFO (1470 AM; 0 kW; COALINGA, CA; Owner: WESTERN PACIFIC BROADCASTING, INC.)
KMJ (580 AM; 50 kW; FRESNO, CA; Owner: INFINITY RADIO OPERATIONS INC.)
KWRU (940 AM; 50 kW; FRESNO, CA)
KGDP (660 AM; 50 kW; ORCUTT, CA; Owner: RADIO REPRESENTATIVES, INC.)
KERI (1180 AM; 50 kW; WASCO-GREENACRES, CA; Owner: KWSO, INC.)
KCBC (770 AM; 50 kW; RIVERBANK, CA; Owner: KIERTRON, INC.)
KMBX (700 AM; 10 kW; SOLEDAD, CA; Owner: ENTRAVISION HOLDINGS, LLC)
KYAA (1200 AM; 25 kW; SOQUEL, CA; Owner: PEOPLE'S RADIO, INC.)
KNBR (680 AM; 50 kW; SAN FRANCISCO, CA; Owner: KNBR LICO, INC.)
KLOK (1170 AM; 50 kW; SAN JOSE, CA; Owner: ENTRAVISION HOLDINGS, LLC)
KOOR (790 AM; 10 kW; CLOVIS, CA; Owner: INFINITY RADIO OPERATIONS INC.)
KGO (810 AM; 50 kW; SAN FRANCISCO, CA; Owner: KGO-AM RADIO, INC.)
KSRK (540 AM; 10 kW; CARMEL VALLEY, CA; Owner: PEOPLE'S RADIO, INC.)
Strongest FM radio stations in Coalinga:
K217EQ (91.3 FM; COALINGA, CA; Owner: CALVARY CHAPEL OF TWIN FALLS, INC.)
K203AQ (88.5 FM; HELM, ETC., CA; Owner: FAMILY STATIONS, INC.)
KDKL (88.3 FM; COALINGA, CA; Owner: EDUCATIONAL MEDIA FOUNDATION)
KRKC-FM (102.1 FM; KING CITY, CA; Owner: KING CITY COMMUNICATIONS CORPORATION)
KWOL (105.5 FM; SAN JOAQUIN, CA; Owner: MESOSPHERE BROADCASTING LIMITED PARTNERSHIP)
KBDH (91.7 FM; SAN ARDO, CA; Owner: PATAPHYSICAL BROADCASTING FOUNDATION)
K206CC (89.1 FM; LOCKWOOD, CA; Owner: PRUNEDALE EDUC. F'DATION/CENTRAL CA)
KSTT-FM (101.3 FM; LOS OSOS-BAYWOOD PAR, CA; Owner: CLEAR CHANNEL BROADCASTING LICENSES, INC.)
KSLY-FM (96.1 FM; SAN LUIS OBISPO, CA; Owner: CLEAR CHANNEL BROADCASTING LICENSES, INC.)
KKAL (99.7 FM; MORRO BAY, CA; Owner: SALISBURY BROADCASTING CORP.)
K211DG (90.1 FM; FIREBAUGH, CA; Owner: CALVARY CHAPEL OF TWIN FALLS, INC.)
TV broadcast stations around Coalinga:
KGMC-LP (Channel 22; FRESNO, CA; Owner: GARY M. COCOLA FAMILY TRUST, GARY M. COCOLA TRUSTEE)
KJKZ-LP (Channel 27; COALINGA, CA; Owner: GARY M. COCOLA FAMILY TRUST, GARY M. COCOLA TRUSTEE)
National Bridge Inventory (NBI) Statistics 13 Number of bridges148ft / 45.1m Total length29,840 Total average daily traffic2,975 Total average daily truck traffic40,141 Total future (year 2039) average daily traffic
New bridges - historical statistics
1 1920-1929 1 1930-1939 2 1940-1949 5 1970-1979 1 1980-1989 2 2000-2009 1 2010-2019
See full National Bridge Inventory statistics for Coalinga, CA
Home Mortgage Disclosure Act Aggregated Statistics For Year 2009(Based on 4 partial tracts) A) FHA, FSA/RHS & VA B) Conventional C) Refinancings D) Home Improvement Loans F) Non-occupant Loans on Number Average Value Number Average Value Number Average Value Number Average Value Number Average Value
LOANS ORIGINATED 36 $154,901 6 $130,375 25 $162,964 1 $63,500 3 $71,877 APPLICATIONS APPROVED, NOT ACCEPTED 1 $184,120 1 $58,570 7 $182,550 0 $0 2 $67,695 APPLICATIONS DENIED 9 $198,971 3 $128,033 24 $165,741 1 $60,040 5 $135,512 APPLICATIONS WITHDRAWN 2 $290,795 2 $115,845 8 $160,645 2 $99,525 2 $120,945 FILES CLOSED FOR INCOMPLETENESS 2 $183,175 1 $181,810 5 $168,528 0 $0 0 $0
Aggregated Statistics For Year 2008(Based on 4 partial tracts) A) FHA, FSA/RHS & VA B) Conventional C) Refinancings D) Home Improvement Loans F) Non-occupant Loans on G) Loans On Manufactured Number Average Value Number Average Value Number Average Value Number Average Value Number Average Value Number Average Value
LOANS ORIGINATED 22 $203,929 10 $161,599 30 $168,916 2 $65,740 8 $98,680 1 $36,190 APPLICATIONS APPROVED, NOT ACCEPTED 2 $305,785 1 $178,130 9 $221,082 3 $64,863 4 $213,850 0 $0 APPLICATIONS DENIED 7 $179,750 4 $142,662 50 $178,132 8 $80,289 7 $161,966 2 $112,295 APPLICATIONS WITHDRAWN 1 $107,740 2 $225,460 12 $179,744 1 $98,770 2 $147,660 0 $0 FILES CLOSED FOR INCOMPLETENESS 1 $83,000 0 $0 4 $214,715 0 $0 1 $245,980 0 $0
Aggregated Statistics For Year 2007(Based on 4 partial tracts) A) FHA, FSA/RHS & VA B) Conventional C) Refinancings D) Home Improvement Loans E) Loans on Dwellings For 5+ Families F) Non-occupant Loans on G) Loans On Manufactured Number Average Value Number Average Value Number Average Value Number Average Value Number Average Value Number Average Value Number Average Value
LOANS ORIGINATED 11 $218,465 38 $179,939 82 $163,020 12 $88,716 2 $443,715 18 $136,056 0 $0 APPLICATIONS APPROVED, NOT ACCEPTED 0 $0 11 $158,929 24 $172,265 3 $44,213 0 $0 2 $146,075 0 $0 APPLICATIONS DENIED 1 $135,260 13 $179,644 85 $190,751 11 $139,337 0 $0 17 $167,435 2 $38,385 APPLICATIONS WITHDRAWN 1 $247,490 4 $238,280 38 $182,334 3 $134,693 0 $0 2 $175,545 0 $0 FILES CLOSED FOR INCOMPLETENESS 0 $0 2 $110,670 16 $196,730 0 $0 0 $0 3 $210,347 0 $0
Aggregated Statistics For Year 2006(Based on 4 partial tracts) B) Conventional C) Refinancings D) Home Improvement Loans E) Loans on Dwellings For 5+ Families F) Non-occupant Loans on G) Loans On Manufactured Number Average Value Number Average Value Number Average Value Number Average Value Number Average Value Number Average Value
LOANS ORIGINATED 79 $170,451 119 $158,083 22 $104,525 1 $1,163,840 40 $160,761 1 $56,380 APPLICATIONS APPROVED, NOT ACCEPTED 20 $157,276 24 $152,525 4 $117,302 1 $211,380 9 $147,594 0 $0 APPLICATIONS DENIED 22 $149,779 70 $168,885 15 $110,928 0 $0 15 $146,425 0 $0 APPLICATIONS WITHDRAWN 14 $191,126 61 $173,114 4 $273,528 0 $0 7 $164,164 0 $0 FILES CLOSED FOR INCOMPLETENESS 3 $157,080 10 $176,073 2 $90,590 0 $0 4 $156,165 0 $0
Aggregated Statistics For Year 2005(Based on 4 partial tracts) A) FHA, FSA/RHS & VA B) Conventional C) Refinancings D) Home Improvement Loans E) Loans on Dwellings For 5+ Families F) Non-occupant Loans on G) Loans On Manufactured Number Average Value Number Average Value Number Average Value Number Average Value Number Average Value Number Average Value Number Average Value
LOANS ORIGINATED 1 $207,490 121 $138,350 142 $142,505 21 $114,233 1 $2,266,240 59 $140,356 1 $86,920 APPLICATIONS APPROVED, NOT ACCEPTED 1 $149,730 15 $135,409 22 $139,411 9 $87,624 0 $0 13 $116,898 0 $0 APPLICATIONS DENIED 0 $0 36 $142,370 65 $144,304 16 $80,112 0 $0 21 $160,286 0 $0 APPLICATIONS WITHDRAWN 0 $0 20 $150,894 76 $140,751 14 $129,456 0 $0 11 $127,213 0 $0 FILES CLOSED FOR INCOMPLETENESS 0 $0 5 $105,336 16 $140,110 0 $0 0 $0 2 $92,325 0 $0
Aggregated Statistics For Year 2004(Based on 4 partial tracts) A) FHA, FSA/RHS & VA B) Conventional C) Refinancings D) Home Improvement Loans E) Loans on Dwellings For 5+ Families F) Non-occupant Loans on G) Loans On Manufactured Number Average Value Number Average Value Number Average Value Number Average Value Number Average Value Number Average Value Number Average Value
LOANS ORIGINATED 6 $139,023 85 $113,896 114 $117,950 13 $43,969 1 $1,502,530 43 $100,777 2 $79,495 APPLICATIONS APPROVED, NOT ACCEPTED 0 $0 11 $132,168 33 $117,469 3 $66,467 0 $0 5 $134,106 0 $0 APPLICATIONS DENIED 1 $137,520 14 $98,464 72 $109,902 11 $72,065 0 $0 14 $83,330 1 $84,370 APPLICATIONS WITHDRAWN 1 $118,950 10 $97,394 77 $108,562 6 $49,105 0 $0 7 $75,744 0 $0 FILES CLOSED FOR INCOMPLETENESS 0 $0 3 $65,150 8 $133,930 1 $50,700 0 $0 0 $0 0 $0
Aggregated Statistics For Year 2003(Based on 4 partial tracts) A) FHA, FSA/RHS & VA B) Conventional C) Refinancings D) Home Improvement Loans E) Loans on Dwellings For 5+ Families F) Non-occupant Loans on Number Average Value Number Average Value Number Average Value Number Average Value Number Average Value Number Average Value
LOANS ORIGINATED 17 $120,109 67 $97,487 137 $96,698 5 $29,220 2 $1,337,240 36 $79,723 APPLICATIONS APPROVED, NOT ACCEPTED 1 $47,180 6 $115,925 19 $98,279 1 $45,260 0 $0 3 $87,023 APPLICATIONS DENIED 1 $126,230 9 $101,014 55 $93,220 8 $39,065 1 $1,933,850 5 $81,950 APPLICATIONS WITHDRAWN 1 $110,380 11 $97,246 57 $109,826 2 $20,290 0 $0 4 $96,560 FILES CLOSED FOR INCOMPLETENESS 0 $0 3 $85,913 7 $102,586 1 $41,670 0 $0 0 $0
Aggregated Statistics For Year 2002(Based on 2 partial tracts) A) FHA, FSA/RHS & VA B) Conventional C) Refinancings D) Home Improvement Loans E) Loans on Dwellings For 5+ Families F) Non-occupant Loans on Number Average Value Number Average Value Number Average Value Number Average Value Number Average Value Number Average Value
LOANS ORIGINATED 15 $93,121 45 $83,115 79 $90,413 6 $23,025 0 $0 18 $61,974 APPLICATIONS APPROVED, NOT ACCEPTED 1 $85,590 6 $91,978 10 $84,950 2 $33,595 0 $0 1 $54,730 APPLICATIONS DENIED 1 $95,300 9 $85,231 41 $83,009 8 $27,562 1 $1,682,840 2 $49,670 APPLICATIONS WITHDRAWN 0 $0 5 $104,880 29 $100,547 2 $18,590 0 $0 1 $85,570 FILES CLOSED FOR INCOMPLETENESS 0 $0 1 $56,490 6 $75,930 0 $0 0 $0 1 $31,450
Aggregated Statistics For Year 2001(Based on 2 partial tracts) A) FHA, FSA/RHS & VA B) Conventional C) Refinancings D) Home Improvement Loans F) Non-occupant Loans on Number Average Value Number Average Value Number Average Value Number Average Value Number Average Value
LOANS ORIGINATED 23 $90,482 23 $84,200 56 $87,926 5 $23,800 7 $55,464 APPLICATIONS APPROVED, NOT ACCEPTED 2 $98,175 2 $113,390 11 $74,360 1 $28,180 1 $116,460 APPLICATIONS DENIED 1 $55,070 8 $57,131 41 $79,471 6 $23,773 2 $64,325 APPLICATIONS WITHDRAWN 1 $107,860 4 $83,472 31 $89,066 3 $19,810 2 $79,715 FILES CLOSED FOR INCOMPLETENESS 0 $0 1 $12,580 7 $65,609 1 $44,040 1 $31,450
Aggregated Statistics For Year 2000(Based on 2 partial tracts) A) FHA, FSA/RHS & VA B) Conventional C) Refinancings D) Home Improvement Loans F) Non-occupant Loans on Number Average Value Number Average Value Number Average Value Number Average Value Number Average Value
LOANS ORIGINATED 18 $86,965 17 $64,422 14 $64,366 3 $29,777 4 $40,882 APPLICATIONS APPROVED, NOT ACCEPTED 1 $44,040 2 $109,815 6 $47,747 3 $23,273 0 $0 APPLICATIONS DENIED 1 $92,740 4 $93,992 25 $60,309 8 $22,939 0 $0 APPLICATIONS WITHDRAWN 2 $66,305 6 $84,587 17 $60,454 1 $31,090 1 $26,350 FILES CLOSED FOR INCOMPLETENESS 0 $0 1 $65,480 4 $78,055 0 $0 1 $58,780
Aggregated Statistics For Year 1999(Based on 4 partial tracts) A) FHA, FSA/RHS & VA B) Conventional C) Refinancings D) Home Improvement Loans E) Loans on Dwellings For 5+ Families F) Non-occupant Loans on Number Average Value Number Average Value Number Average Value Number Average Value Number Average Value Number Average Value
LOANS ORIGINATED 18 $86,395 17 $85,798 45 $69,676 7 $28,217 1 $33,030 6 $48,138 APPLICATIONS APPROVED, NOT ACCEPTED 0 $0 3 $46,923 10 $58,977 5 $15,654 0 $0 1 $68,110 APPLICATIONS DENIED 2 $98,500 6 $65,375 36 $55,616 10 $20,274 1 $58,150 2 $42,960 APPLICATIONS WITHDRAWN 3 $82,473 4 $62,615 31 $68,273 1 $9,790 0 $0 1 $53,460 FILES CLOSED FOR INCOMPLETENESS 1 $41,860 1 $68,640 7 $71,879 0 $0 0 $0 0 $0
Detailed HMDA statistics for the following Tracts:
0079.00
, 0080.00 , 0081.00
Private Mortgage Insurance Companies Aggregated Statistics For Year 2009(Based on 4 partial tracts) A) Conventional B) Refinancings Number Average Value Number Average Value
LOANS ORIGINATED 1 $182,670 2 $193,810 APPLICATIONS APPROVED, NOT ACCEPTED 1 $182,670 2 $138,415 APPLICATIONS DENIED 0 $0 0 $0 APPLICATIONS WITHDRAWN 0 $0 0 $0 FILES CLOSED FOR INCOMPLETENESS 0 $0 0 $0
Aggregated Statistics For Year 2008(Based on 4 partial tracts) A) Conventional B) Refinancings C) Non-occupant Loans on Number Average Value Number Average Value Number Average Value
LOANS ORIGINATED 4 $196,442 5 $218,870 1 $88,070 APPLICATIONS APPROVED, NOT ACCEPTED 3 $243,900 1 $246,090 0 $0 APPLICATIONS DENIED 0 $0 1 $105,930 0 $0 APPLICATIONS WITHDRAWN 0 $0 1 $201,310 0 $0 FILES CLOSED FOR INCOMPLETENESS 0 $0 0 $0 0 $0
Aggregated Statistics For Year 2007(Based on 4 partial tracts) A) Conventional B) Refinancings C) Non-occupant Loans on Number Average Value Number Average Value Number Average Value
LOANS ORIGINATED 12 $225,439 5 $208,676 1 $163,760 APPLICATIONS APPROVED, NOT ACCEPTED 2 $230,620 3 $224,060 0 $0 APPLICATIONS DENIED 0 $0 0 $0 0 $0 APPLICATIONS WITHDRAWN 1 $183,380 1 $164,050 0 $0 FILES CLOSED FOR INCOMPLETENESS 0 $0 0 $0 0 $0
Aggregated Statistics For Year 2006(Based on 4 partial tracts) B) Refinancings C) Non-occupant Loans on Number Average Value Number Average Value
LOANS ORIGINATED 4 $176,685 1 $130,130 APPLICATIONS APPROVED, NOT ACCEPTED 1 $180,350 1 $179,920 APPLICATIONS DENIED 0 $0 0 $0 APPLICATIONS WITHDRAWN 1 $373,530 0 $0 FILES CLOSED FOR INCOMPLETENESS 0 $0 0 $0
Aggregated Statistics For Year 2005(Based on 4 partial tracts) A) Conventional B) Refinancings C) Non-occupant Loans on Number Average Value Number Average Value Number Average Value
LOANS ORIGINATED 9 $192,828 3 $182,083 4 $163,365 APPLICATIONS APPROVED, NOT ACCEPTED 0 $0 0 $0 0 $0 APPLICATIONS DENIED 0 $0 0 $0 0 $0 APPLICATIONS WITHDRAWN 0 $0 0 $0 0 $0 FILES CLOSED FOR INCOMPLETENESS 0 $0 0 $0 0 $0
Aggregated Statistics For Year 2004(Based on 4 partial tracts) A) Conventional B) Refinancings C) Non-occupant Loans on Number Average Value Number Average Value Number Average Value
LOANS ORIGINATED 16 $136,588 5 $128,756 5 $104,692 APPLICATIONS APPROVED, NOT ACCEPTED 1 $118,110 4 $124,508 1 $37,750 APPLICATIONS DENIED 1 $96,250 0 $0 1 $96,250 APPLICATIONS WITHDRAWN 1 $95,910 0 $0 0 $0 FILES CLOSED FOR INCOMPLETENESS 0 $0 0 $0 0 $0
Aggregated Statistics For Year 2003(Based on 4 partial tracts) A) Conventional B) Refinancings C) Non-occupant Loans on Number Average Value Number Average Value Number Average Value
LOANS ORIGINATED 22 $108,767 15 $118,744 9 $85,879 APPLICATIONS APPROVED, NOT ACCEPTED 3 $82,680 5 $127,214 1 $38,470 APPLICATIONS DENIED 1 $44,670 0 $0 0 $0 APPLICATIONS WITHDRAWN 0 $0 1 $178,820 0 $0 FILES CLOSED FOR INCOMPLETENESS 0 $0 0 $0 0 $0
Aggregated Statistics For Year 2002(Based on 2 partial tracts) A) Conventional B) Refinancings C) Non-occupant Loans on Number Average Value Number Average Value Number Average Value
LOANS ORIGINATED 19 $92,766 13 $121,296 6 $58,303 APPLICATIONS APPROVED, NOT ACCEPTED 3 $60,490 3 $121,177 1 $68,170 APPLICATIONS DENIED 0 $0 0 $0 0 $0 APPLICATIONS WITHDRAWN 1 $44,040 0 $0 0 $0 FILES CLOSED FOR INCOMPLETENESS 0 $0 0 $0 0 $0
Aggregated Statistics For Year 2001(Based on 2 partial tracts) A) Conventional B) Refinancings Number Average Value Number Average Value
LOANS ORIGINATED 8 $83,245 11 $93,167 APPLICATIONS APPROVED, NOT ACCEPTED 2 $51,765 4 $98,472 APPLICATIONS DENIED 0 $0 0 $0 APPLICATIONS WITHDRAWN 0 $0 0 $0 FILES CLOSED FOR INCOMPLETENESS 0 $0 0 $0
Aggregated Statistics For Year 2000(Based on 2 partial tracts) A) Conventional B) Refinancings C) Non-occupant Loans on Number Average Value Number Average Value Number Average Value
LOANS ORIGINATED 6 $80,243 3 $67,187 1 $73,380 APPLICATIONS APPROVED, NOT ACCEPTED 0 $0 1 $129,450 0 $0 APPLICATIONS DENIED 0 $0 0 $0 0 $0 APPLICATIONS WITHDRAWN 1 $46,110 0 $0 0 $0 FILES CLOSED FOR INCOMPLETENESS 0 $0 0 $0 0 $0
Aggregated Statistics For Year 1999(Based on 4 partial tracts) A) Conventional B) Refinancings C) Non-occupant Loans on Number Average Value Number Average Value Number Average Value
LOANS ORIGINATED 6 $113,295 4 $93,775 1 $70,140 APPLICATIONS APPROVED, NOT ACCEPTED 1 $29,750 1 $179,800 0 $0 APPLICATIONS DENIED 1 $103,220 0 $0 0 $0 APPLICATIONS WITHDRAWN 0 $0 0 $0 0 $0 FILES CLOSED FOR INCOMPLETENESS 0 $0 0 $0 0 $0
Detailed PMIC statistics for the following Tracts:
0079.00
, 0080.00 , 0081.00 Fire-safe hotels and motels in Coalinga, California:
The Inn At Harris Ranch, 24485 W Dorris, Coalinga, California 93210 Phone: (559) 935-0717
Motel 6, #1356, 25008 W Dorris Ave, Coalinga, California 93210 Phone: (559) 935-1536, Fax: (559) 934-0814
Inn At Harris Ranch, 2405 W Dorris Ave, Coalinga, California 93210 Phone: (559) 935-0717, Fax: (559) 935-2844
Best Western Big Country Inn, 25020 W Dorris Ave, Coalinga, California 93210 Phone: (559) 935-0866, Fax: (559) 935-0644
Best Western Plus, 1786 Jayne Ave, Coalinga, California 93210 Phone: (559) 934-0101, Fax: (559) 934-0103
All 5 fire-safe hotels and motels in Coalinga, California
Most common first names in Coalinga, CA among deceased individuals Name Count Lived (average)
John 46 74.8 years James 43 71.9 years Mary 32 81.0 years William 32 77.6 years Robert 31 71.0 years George 27 73.3 years Charles 25 78.0 years Helen 23 78.0 years Joseph 19 81.0 years Ruth 19 80.2 years
Most common last names in Coalinga, CA among deceased individuals Last name Count Lived (average)
Smith 35 76.8 years Brown 23 77.9 years Gentry 18 73.3 years Davis 14 80.4 years Allen 12 80.4 years Taylor 12 73.1 years Johnson 12 72.4 years Jones 12 74.8 years Harris 11 77.5 years Lynch 10 78.6 years
Coalinga compared to California state average:
Median house value significantly below state average. Hispanic race population percentage above state average. Institutionalized population percentage significantly above state average. Percentage of population with a bachelor's degree or higher below state average.
#4 on the list of "Top 101 cities with the highest number of arson incidents per 100,000 residents, excludes tourist destinations and others with a lot of outsiders visiting based on city industries data (population 5,000+)"
#45 on the list of "Top 101 cities with the highest number of assaults per 100,000 residents, excludes tourist destinations and others with a lot of outsiders visiting based on city industries data (population 5,000+)"
#59 on the list of "Top 101 cities with the largest city-data.com crime index increase from 2002 to 2012 (population 5,000+)"
#79 on the list of "Top 101 cities with largest percentage of females in industries: agriculture, forestry, fishing and hunting (population 5,000+)"
#89 on the list of "Top 101 cities with largest percentage of females in occupations: farming, fishing, and forestry occupations (population 5,000+)"
#95 on the list of "Top 101 cities with the largest city-data.com crime index per police officer (population 5,000+)"
#5 on the list of "Top 101 counties with the highest Particulate Matter (PM2.5 ) Annual air pollution readings in 2012 (µg/m3 )"
#11 on the list of "Top 101 counties with the highest ground withdrawal of fresh water for public supply"
#15 on the list of "Top 101 counties with the highest lead air pollution readings in 2012 (µg/m3 )"
#15 on the list of "Top 101 counties with the lowest lead air pollution readings in 2012 (µg/m3 )"
#15 on the list of "Top 101 counties with the highest Particulate Matter (PM10 ) Annual air pollution readings in 2012 (µg/m3 )"
Top Patent Applicants
James Jeremiah Ian Watt (1)
Steven Robles (1)
Total of 2 patent applications in 2008-2024.
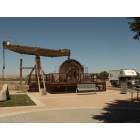
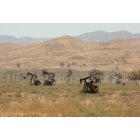
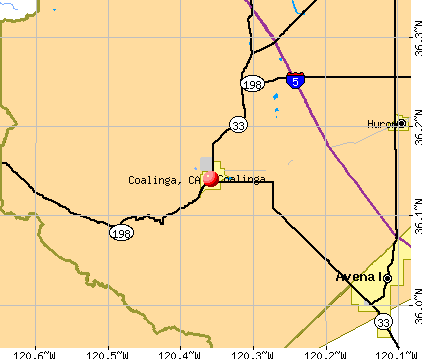


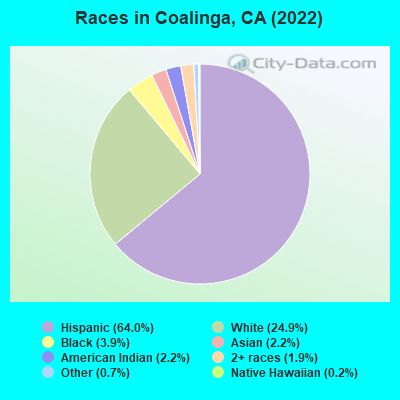
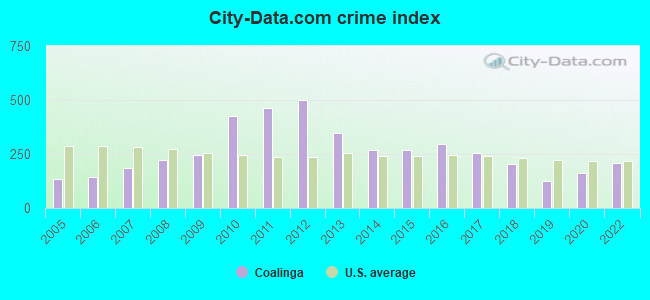
 Recent articles from our blog. Our writers, many of them Ph.D. graduates or candidates, create easy-to-read articles on a wide variety of topics.

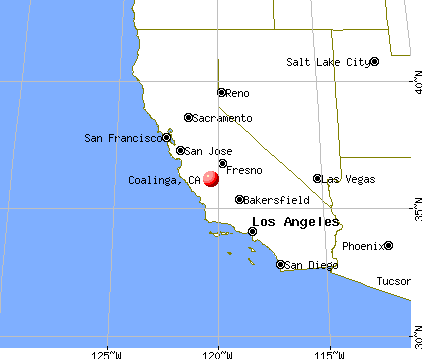
 (54.4 miles
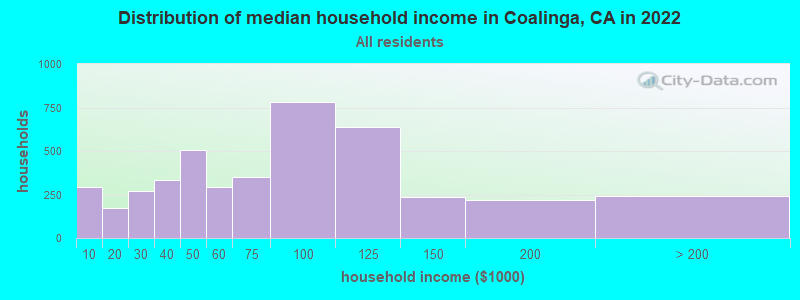
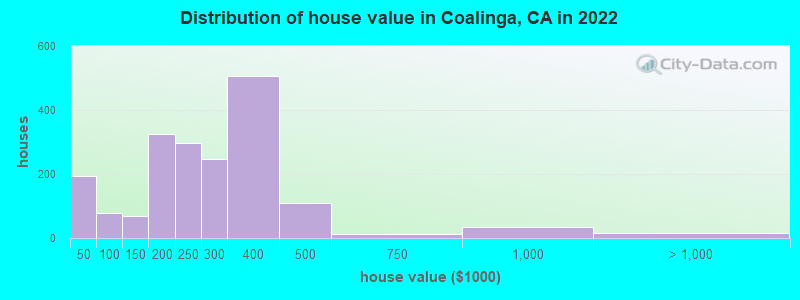
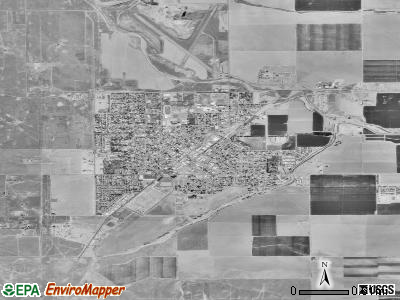
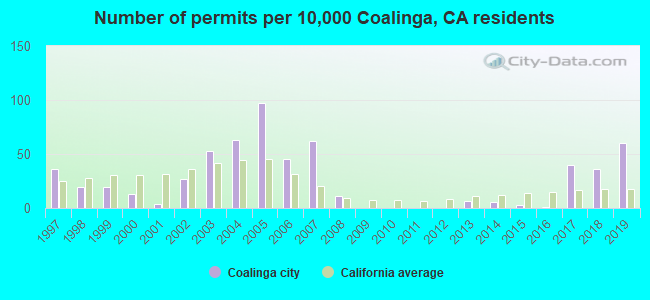
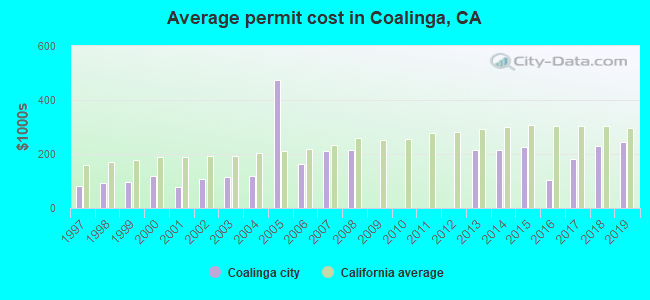
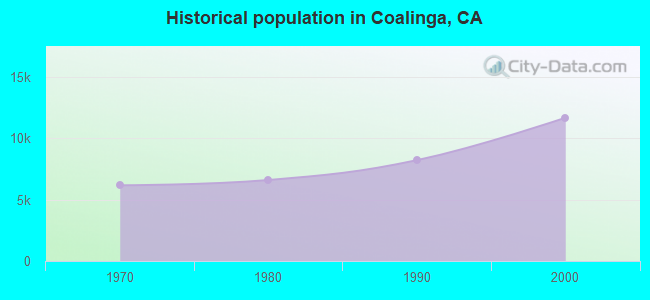
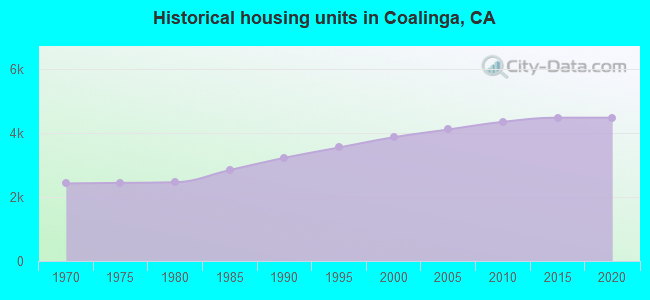
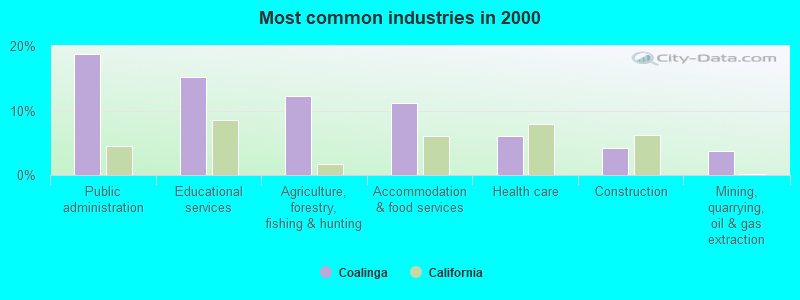
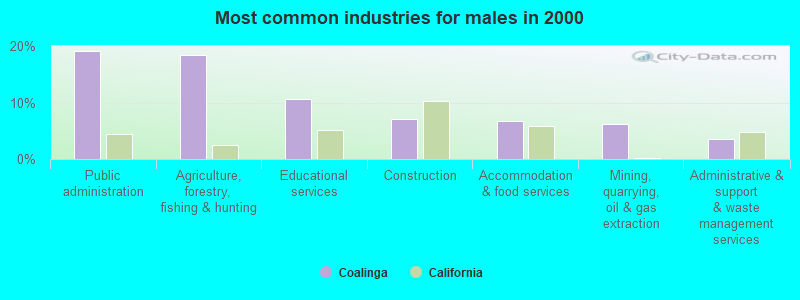
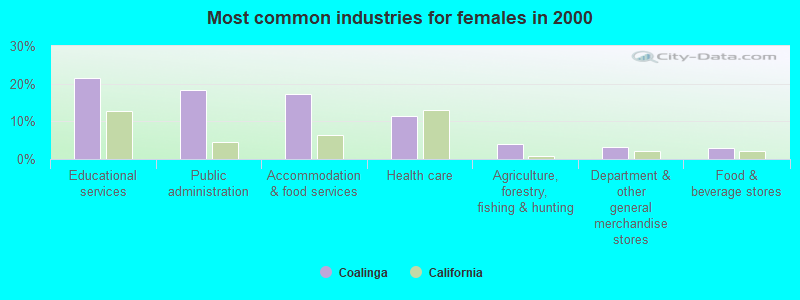
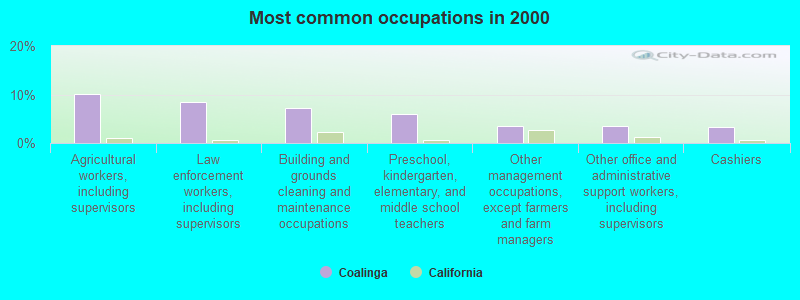
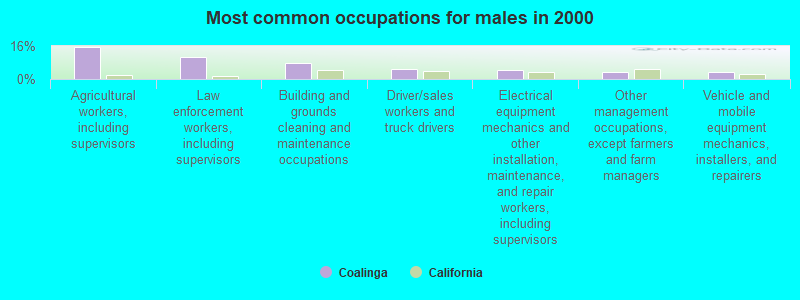
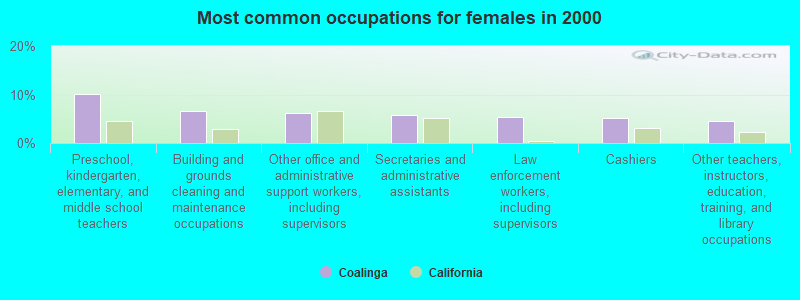
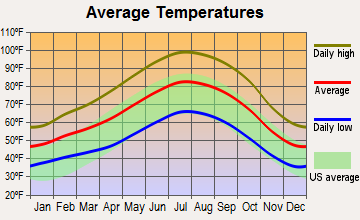
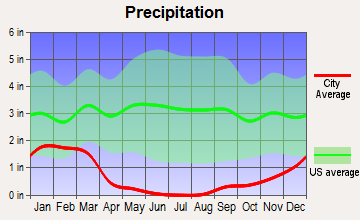
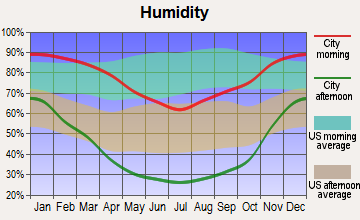
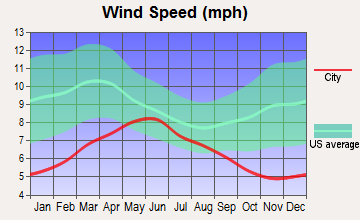
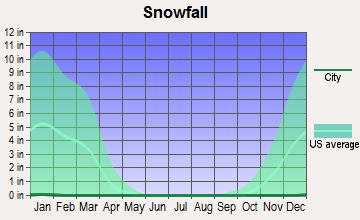
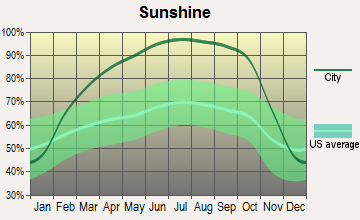
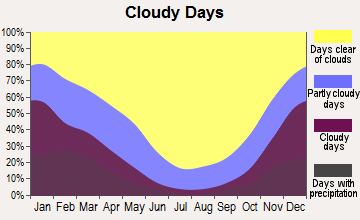
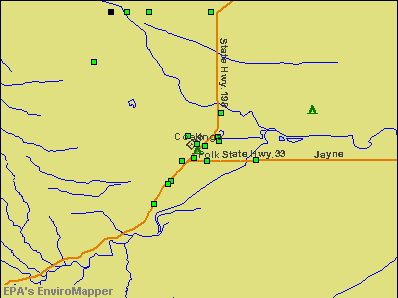

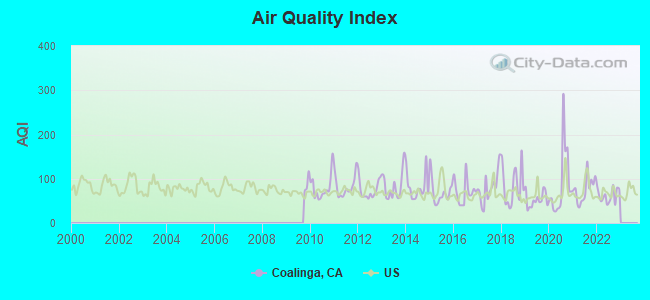
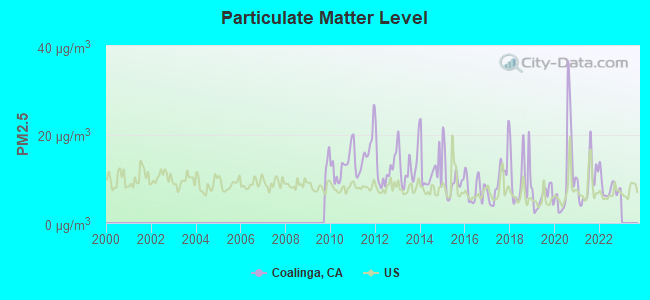
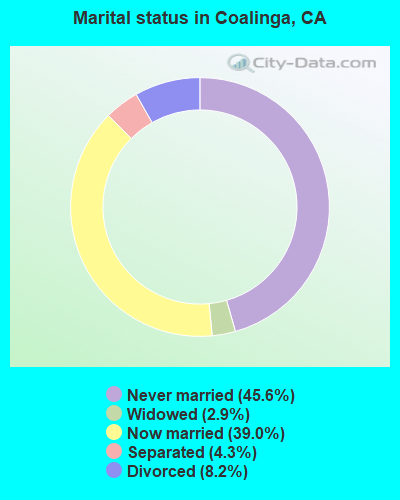
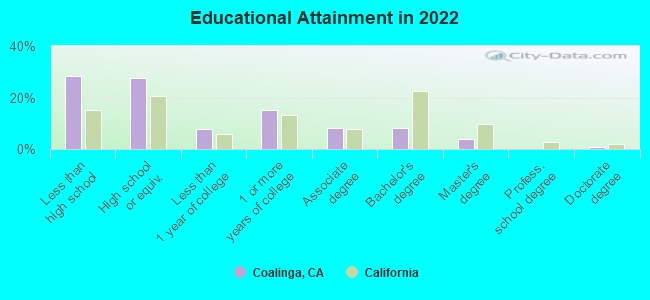
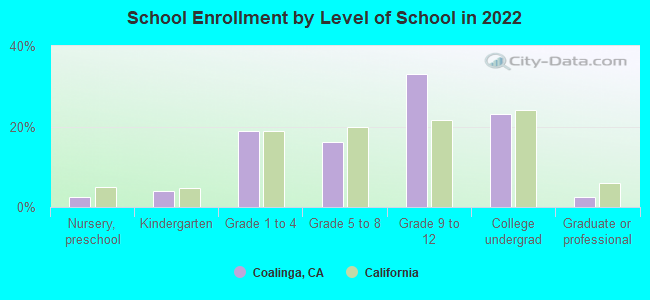
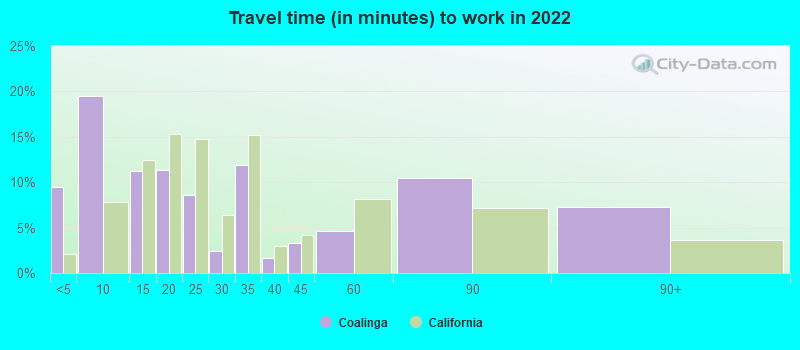
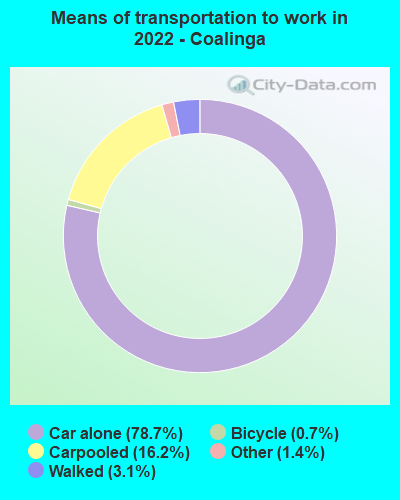
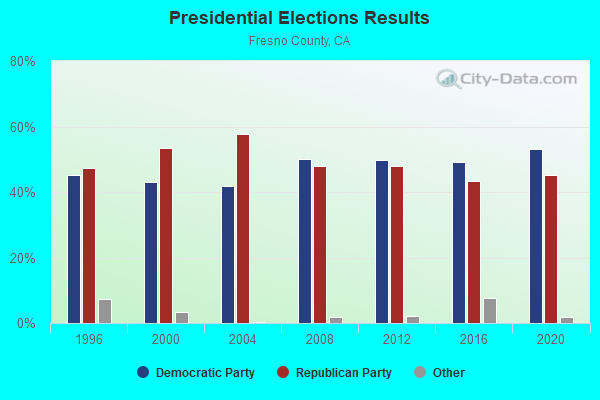
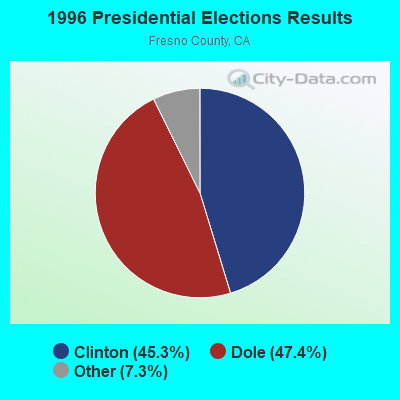
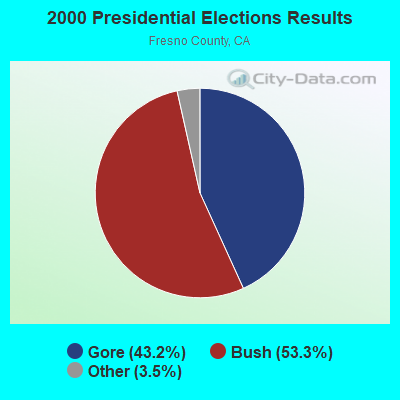
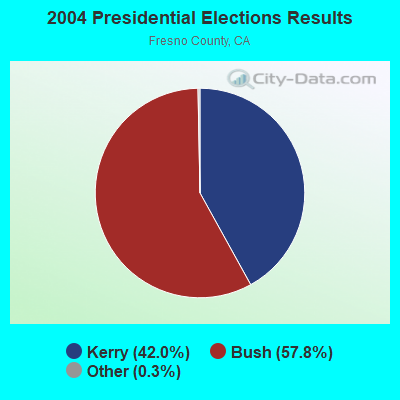
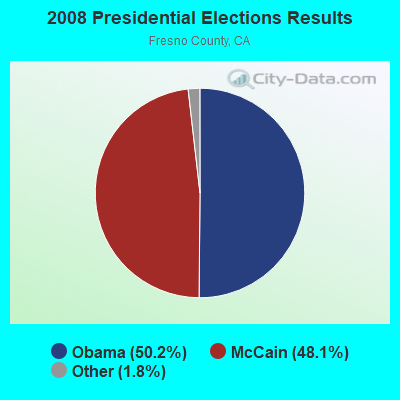
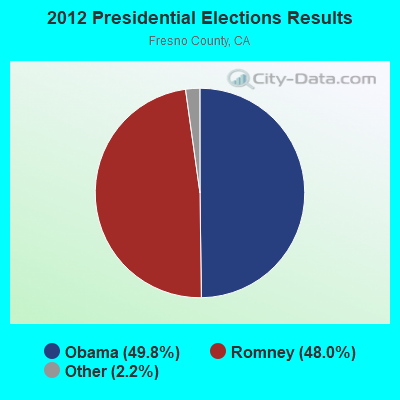
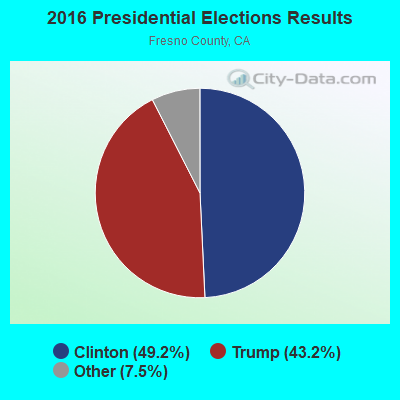
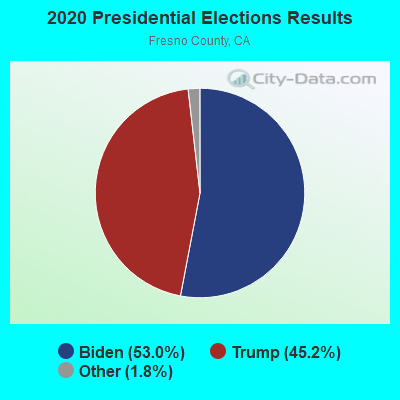
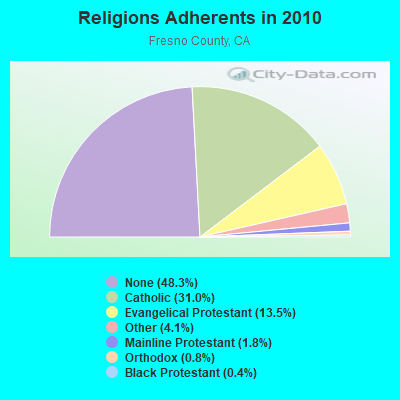
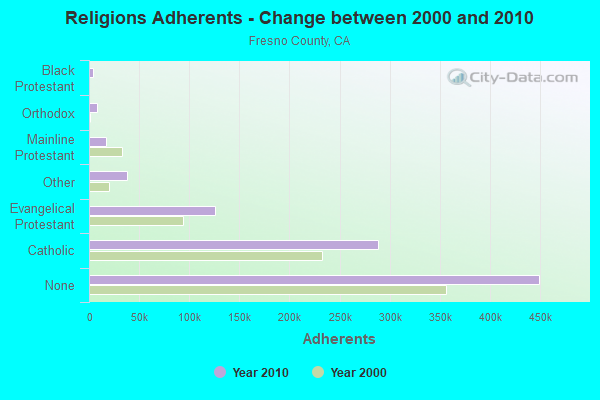
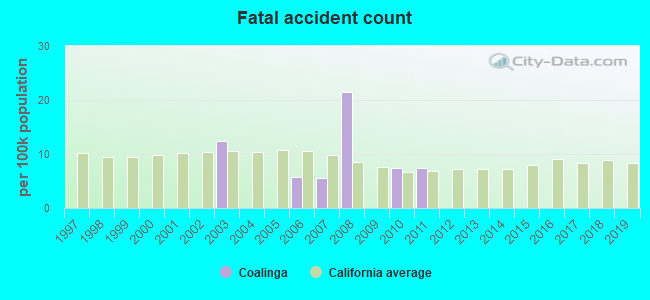
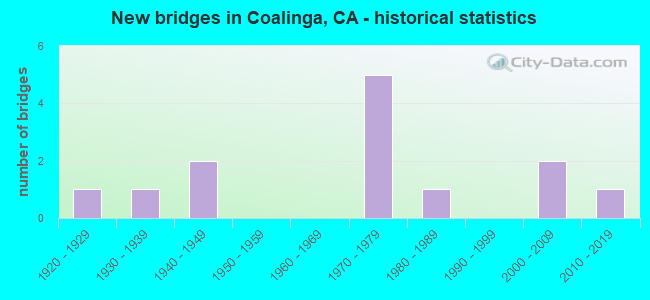
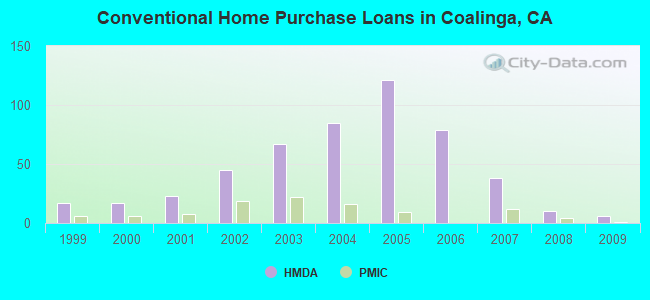
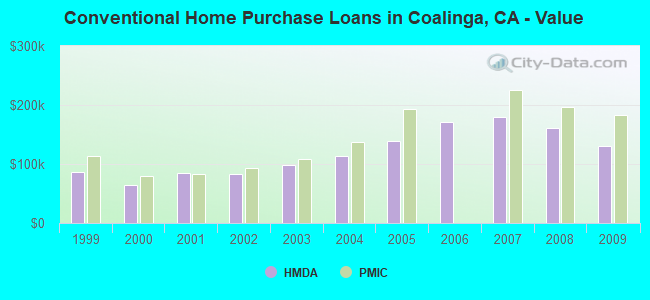
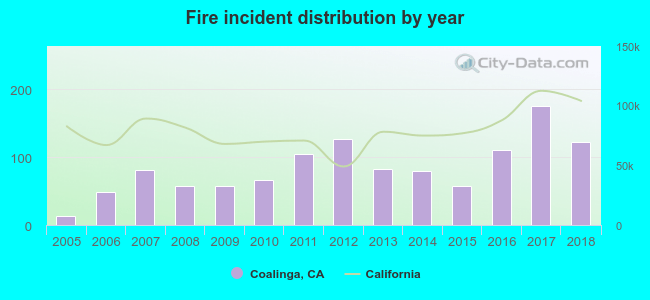 Based on the data from the years 2005 - 2018 the average number of fires per year is 85. The highest number of fires - 176 took place in 2017, and the least - 14 in 2005. The data has a growing trend.
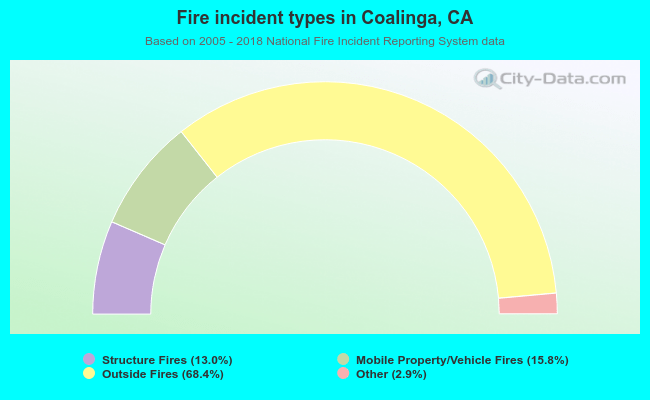 When looking into fire subcategories, the most reports belonged to: Outside Fires (68.4%), and Mobile Property/Vehicle Fires (15.8%).