Cornelius, North Carolina Submit your own pictures of this town and show them to the world
OSM Map
General Map
Google Map
MSN Map
OSM Map
General Map
Google Map
MSN Map
OSM Map
General Map
Google Map
MSN Map
OSM Map
General Map
Google Map
MSN Map
Please wait while loading the map...
Population in 2022: 32,294 (100% urban, 0% rural). Population change since 2000: +169.8%Males: 15,207 Females: 17,087
March 2022 cost of living index in Cornelius: 93.7 (less than average, U.S. average is 100) Percentage of residents living in poverty in 2022: 5.2%for White Non-Hispanic residents , 16.7% for Black residents , 15.2% for Hispanic or Latino residents , 37.4% for other race residents , 5.0% for two or more races residents )
Profiles of local businesses
Business Search - 14 Million verified businesses
Data:
Median household income ($)
Median household income (% change since 2000)
Household income diversity
Ratio of average income to average house value (%)
Ratio of average income to average rent
Median household income ($) - White
Median household income ($) - Black or African American
Median household income ($) - Asian
Median household income ($) - Hispanic or Latino
Median household income ($) - American Indian and Alaska Native
Median household income ($) - Multirace
Median household income ($) - Other Race
Median household income for houses/condos with a mortgage ($)
Median household income for apartments without a mortgage ($)
Races - White alone (%)
Races - White alone (% change since 2000)
Races - Black alone (%)
Races - Black alone (% change since 2000)
Races - American Indian alone (%)
Races - American Indian alone (% change since 2000)
Races - Asian alone (%)
Races - Asian alone (% change since 2000)
Races - Hispanic (%)
Races - Hispanic (% change since 2000)
Races - Native Hawaiian and Other Pacific Islander alone (%)
Races - Native Hawaiian and Other Pacific Islander alone (% change since 2000)
Races - Two or more races (%)
Races - Two or more races (% change since 2000)
Races - Other race alone (%)
Races - Other race alone (% change since 2000)
Racial diversity
Unemployment (%)
Unemployment (% change since 2000)
Unemployment (%) - White
Unemployment (%) - Black or African American
Unemployment (%) - Asian
Unemployment (%) - Hispanic or Latino
Unemployment (%) - American Indian and Alaska Native
Unemployment (%) - Multirace
Unemployment (%) - Other Race
Population density (people per square mile)
Population - Males (%)
Population - Females (%)
Population - Males (%) - White
Population - Males (%) - Black or African American
Population - Males (%) - Asian
Population - Males (%) - Hispanic or Latino
Population - Males (%) - American Indian and Alaska Native
Population - Males (%) - Multirace
Population - Males (%) - Other Race
Population - Females (%) - White
Population - Females (%) - Black or African American
Population - Females (%) - Asian
Population - Females (%) - Hispanic or Latino
Population - Females (%) - American Indian and Alaska Native
Population - Females (%) - Multirace
Population - Females (%) - Other Race
Coronavirus confirmed cases (Apr 27, 2024)
Deaths caused by coronavirus (Apr 27, 2024)
Coronavirus confirmed cases (per 100k population) (Apr 27, 2024)
Deaths caused by coronavirus (per 100k population) (Apr 27, 2024)
Daily increase in number of cases (Apr 27, 2024)
Weekly increase in number of cases (Apr 27, 2024)
Cases doubled (in days) (Apr 27, 2024)
Hospitalized patients (Apr 18, 2022)
Negative test results (Apr 18, 2022)
Total test results (Apr 18, 2022)
COVID Vaccine doses distributed (per 100k population) (Sep 19, 2023)
COVID Vaccine doses administered (per 100k population) (Sep 19, 2023)
COVID Vaccine doses distributed (Sep 19, 2023)
COVID Vaccine doses administered (Sep 19, 2023)
Likely homosexual households (%)
Likely homosexual households (% change since 2000)
Likely homosexual households - Lesbian couples (%)
Likely homosexual households - Lesbian couples (% change since 2000)
Likely homosexual households - Gay men (%)
Likely homosexual households - Gay men (% change since 2000)
Cost of living index
Median gross rent ($)
Median contract rent ($)
Median monthly housing costs ($)
Median house or condo value ($)
Median house or condo value ($ change since 2000)
Mean house or condo value by units in structure - 1, detached ($)
Mean house or condo value by units in structure - 1, attached ($)
Mean house or condo value by units in structure - 2 ($)
Mean house or condo value by units in structure by units in structure - 3 or 4 ($)
Mean house or condo value by units in structure - 5 or more ($)
Mean house or condo value by units in structure - Boat, RV, van, etc. ($)
Mean house or condo value by units in structure - Mobile home ($)
Median house or condo value ($) - White
Median house or condo value ($) - Black or African American
Median house or condo value ($) - Asian
Median house or condo value ($) - Hispanic or Latino
Median house or condo value ($) - American Indian and Alaska Native
Median house or condo value ($) - Multirace
Median house or condo value ($) - Other Race
Median resident age
Resident age diversity
Median resident age - Males
Median resident age - Females
Median resident age - White
Median resident age - Black or African American
Median resident age - Asian
Median resident age - Hispanic or Latino
Median resident age - American Indian and Alaska Native
Median resident age - Multirace
Median resident age - Other Race
Median resident age - Males - White
Median resident age - Males - Black or African American
Median resident age - Males - Asian
Median resident age - Males - Hispanic or Latino
Median resident age - Males - American Indian and Alaska Native
Median resident age - Males - Multirace
Median resident age - Males - Other Race
Median resident age - Females - White
Median resident age - Females - Black or African American
Median resident age - Females - Asian
Median resident age - Females - Hispanic or Latino
Median resident age - Females - American Indian and Alaska Native
Median resident age - Females - Multirace
Median resident age - Females - Other Race
Commute - mean travel time to work (minutes)
Travel time to work - Less than 5 minutes (%)
Travel time to work - Less than 5 minutes (% change since 2000)
Travel time to work - 5 to 9 minutes (%)
Travel time to work - 5 to 9 minutes (% change since 2000)
Travel time to work - 10 to 19 minutes (%)
Travel time to work - 10 to 19 minutes (% change since 2000)
Travel time to work - 20 to 29 minutes (%)
Travel time to work - 20 to 29 minutes (% change since 2000)
Travel time to work - 30 to 39 minutes (%)
Travel time to work - 30 to 39 minutes (% change since 2000)
Travel time to work - 40 to 59 minutes (%)
Travel time to work - 40 to 59 minutes (% change since 2000)
Travel time to work - 60 to 89 minutes (%)
Travel time to work - 60 to 89 minutes (% change since 2000)
Travel time to work - 90 or more minutes (%)
Travel time to work - 90 or more minutes (% change since 2000)
Marital status - Never married (%)
Marital status - Now married (%)
Marital status - Separated (%)
Marital status - Widowed (%)
Marital status - Divorced (%)
Median family income ($)
Median family income (% change since 2000)
Median non-family income ($)
Median non-family income (% change since 2000)
Median per capita income ($)
Median per capita income (% change since 2000)
Median family income ($) - White
Median family income ($) - Black or African American
Median family income ($) - Asian
Median family income ($) - Hispanic or Latino
Median family income ($) - American Indian and Alaska Native
Median family income ($) - Multirace
Median family income ($) - Other Race
Median year house/condo built
Median year apartment built
Year house built - Built 2005 or later (%)
Year house built - Built 2000 to 2004 (%)
Year house built - Built 1990 to 1999 (%)
Year house built - Built 1980 to 1989 (%)
Year house built - Built 1970 to 1979 (%)
Year house built - Built 1960 to 1969 (%)
Year house built - Built 1950 to 1959 (%)
Year house built - Built 1940 to 1949 (%)
Year house built - Built 1939 or earlier (%)
Average household size
Household density (households per square mile)
Average household size - White
Average household size - Black or African American
Average household size - Asian
Average household size - Hispanic or Latino
Average household size - American Indian and Alaska Native
Average household size - Multirace
Average household size - Other Race
Occupied housing units (%)
Vacant housing units (%)
Owner occupied housing units (%)
Renter occupied housing units (%)
Vacancy status - For rent (%)
Vacancy status - For sale only (%)
Vacancy status - Rented or sold, not occupied (%)
Vacancy status - For seasonal, recreational, or occasional use (%)
Vacancy status - For migrant workers (%)
Vacancy status - Other vacant (%)
Residents with income below the poverty level (%)
Residents with income below 50% of the poverty level (%)
Children below poverty level (%)
Poor families by family type - Married-couple family (%)
Poor families by family type - Male, no wife present (%)
Poor families by family type - Female, no husband present (%)
Poverty status for native-born residents (%)
Poverty status for foreign-born residents (%)
Poverty among high school graduates not in families (%)
Poverty among people who did not graduate high school not in families (%)
Residents with income below the poverty level (%) - White
Residents with income below the poverty level (%) - Black or African American
Residents with income below the poverty level (%) - Asian
Residents with income below the poverty level (%) - Hispanic or Latino
Residents with income below the poverty level (%) - American Indian and Alaska Native
Residents with income below the poverty level (%) - Multirace
Residents with income below the poverty level (%) - Other Race
Air pollution - Air Quality Index (AQI)
Air pollution - CO
Air pollution - NO2
Air pollution - SO2
Air pollution - Ozone
Air pollution - PM10
Air pollution - PM25
Air pollution - Pb
Crime - Murders per 100,000 population
Crime - Rapes per 100,000 population
Crime - Robberies per 100,000 population
Crime - Assaults per 100,000 population
Crime - Burglaries per 100,000 population
Crime - Thefts per 100,000 population
Crime - Auto thefts per 100,000 population
Crime - Arson per 100,000 population
Crime - City-data.com crime index
Crime - Violent crime index
Crime - Property crime index
Crime - Murders per 100,000 population (5 year average)
Crime - Rapes per 100,000 population (5 year average)
Crime - Robberies per 100,000 population (5 year average)
Crime - Assaults per 100,000 population (5 year average)
Crime - Burglaries per 100,000 population (5 year average)
Crime - Thefts per 100,000 population (5 year average)
Crime - Auto thefts per 100,000 population (5 year average)
Crime - Arson per 100,000 population (5 year average)
Crime - City-data.com crime index (5 year average)
Crime - Violent crime index (5 year average)
Crime - Property crime index (5 year average)
1996 Presidential Elections Results (%) - Democratic Party (Clinton)
1996 Presidential Elections Results (%) - Republican Party (Dole)
1996 Presidential Elections Results (%) - Other
2000 Presidential Elections Results (%) - Democratic Party (Gore)
2000 Presidential Elections Results (%) - Republican Party (Bush)
2000 Presidential Elections Results (%) - Other
2004 Presidential Elections Results (%) - Democratic Party (Kerry)
2004 Presidential Elections Results (%) - Republican Party (Bush)
2004 Presidential Elections Results (%) - Other
2008 Presidential Elections Results (%) - Democratic Party (Obama)
2008 Presidential Elections Results (%) - Republican Party (McCain)
2008 Presidential Elections Results (%) - Other
2012 Presidential Elections Results (%) - Democratic Party (Obama)
2012 Presidential Elections Results (%) - Republican Party (Romney)
2012 Presidential Elections Results (%) - Other
2016 Presidential Elections Results (%) - Democratic Party (Clinton)
2016 Presidential Elections Results (%) - Republican Party (Trump)
2016 Presidential Elections Results (%) - Other
2020 Presidential Elections Results (%) - Democratic Party (Biden)
2020 Presidential Elections Results (%) - Republican Party (Trump)
2020 Presidential Elections Results (%) - Other
Ancestries Reported - Arab (%)
Ancestries Reported - Czech (%)
Ancestries Reported - Danish (%)
Ancestries Reported - Dutch (%)
Ancestries Reported - English (%)
Ancestries Reported - French (%)
Ancestries Reported - French Canadian (%)
Ancestries Reported - German (%)
Ancestries Reported - Greek (%)
Ancestries Reported - Hungarian (%)
Ancestries Reported - Irish (%)
Ancestries Reported - Italian (%)
Ancestries Reported - Lithuanian (%)
Ancestries Reported - Norwegian (%)
Ancestries Reported - Polish (%)
Ancestries Reported - Portuguese (%)
Ancestries Reported - Russian (%)
Ancestries Reported - Scotch-Irish (%)
Ancestries Reported - Scottish (%)
Ancestries Reported - Slovak (%)
Ancestries Reported - Subsaharan African (%)
Ancestries Reported - Swedish (%)
Ancestries Reported - Swiss (%)
Ancestries Reported - Ukrainian (%)
Ancestries Reported - United States (%)
Ancestries Reported - Welsh (%)
Ancestries Reported - West Indian (%)
Ancestries Reported - Other (%)
Educational Attainment - No schooling completed (%)
Educational Attainment - Less than high school (%)
Educational Attainment - High school or equivalent (%)
Educational Attainment - Less than 1 year of college (%)
Educational Attainment - 1 or more years of college (%)
Educational Attainment - Associate degree (%)
Educational Attainment - Bachelor's degree (%)
Educational Attainment - Master's degree (%)
Educational Attainment - Professional school degree (%)
Educational Attainment - Doctorate degree (%)
School Enrollment - Nursery, preschool (%)
School Enrollment - Kindergarten (%)
School Enrollment - Grade 1 to 4 (%)
School Enrollment - Grade 5 to 8 (%)
School Enrollment - Grade 9 to 12 (%)
School Enrollment - College undergrad (%)
School Enrollment - Graduate or professional (%)
School Enrollment - Not enrolled in school (%)
School enrollment - Public schools (%)
School enrollment - Private schools (%)
School enrollment - Not enrolled (%)
Median number of rooms in houses and condos
Median number of rooms in apartments
Housing units lacking complete plumbing facilities (%)
Housing units lacking complete kitchen facilities (%)
Density of houses
Urban houses (%)
Rural houses (%)
Households with people 60 years and over (%)
Households with people 65 years and over (%)
Households with people 75 years and over (%)
Households with one or more nonrelatives (%)
Households with no nonrelatives (%)
Population in households (%)
Family households (%)
Nonfamily households (%)
Population in families (%)
Family households with own children (%)
Median number of bedrooms in owner occupied houses
Mean number of bedrooms in owner occupied houses
Median number of bedrooms in renter occupied houses
Mean number of bedrooms in renter occupied houses
Median number of vehichles in owner occupied houses
Mean number of vehichles in owner occupied houses
Median number of vehichles in renter occupied houses
Mean number of vehichles in renter occupied houses
Mortgage status - with mortgage (%)
Mortgage status - with second mortgage (%)
Mortgage status - with home equity loan (%)
Mortgage status - with both second mortgage and home equity loan (%)
Mortgage status - without a mortgage (%)
Average family size
Average family size - White
Average family size - Black or African American
Average family size - Asian
Average family size - Hispanic or Latino
Average family size - American Indian and Alaska Native
Average family size - Multirace
Average family size - Other Race
Geographical mobility - Same house 1 year ago (%)
Geographical mobility - Moved within same county (%)
Geographical mobility - Moved from different county within same state (%)
Geographical mobility - Moved from different state (%)
Geographical mobility - Moved from abroad (%)
Place of birth - Born in state of residence (%)
Place of birth - Born in other state (%)
Place of birth - Native, outside of US (%)
Place of birth - Foreign born (%)
Housing units in structures - 1, detached (%)
Housing units in structures - 1, attached (%)
Housing units in structures - 2 (%)
Housing units in structures - 3 or 4 (%)
Housing units in structures - 5 to 9 (%)
Housing units in structures - 10 to 19 (%)
Housing units in structures - 20 to 49 (%)
Housing units in structures - 50 or more (%)
Housing units in structures - Mobile home (%)
Housing units in structures - Boat, RV, van, etc. (%)
House/condo owner moved in on average (years ago)
Renter moved in on average (years ago)
Year householder moved into unit - Moved in 1999 to March 2000 (%)
Year householder moved into unit - Moved in 1995 to 1998 (%)
Year householder moved into unit - Moved in 1990 to 1994 (%)
Year householder moved into unit - Moved in 1980 to 1989 (%)
Year householder moved into unit - Moved in 1970 to 1979 (%)
Year householder moved into unit - Moved in 1969 or earlier (%)
Means of transportation to work - Drove car alone (%)
Means of transportation to work - Carpooled (%)
Means of transportation to work - Public transportation (%)
Means of transportation to work - Bus or trolley bus (%)
Means of transportation to work - Streetcar or trolley car (%)
Means of transportation to work - Subway or elevated (%)
Means of transportation to work - Railroad (%)
Means of transportation to work - Ferryboat (%)
Means of transportation to work - Taxicab (%)
Means of transportation to work - Motorcycle (%)
Means of transportation to work - Bicycle (%)
Means of transportation to work - Walked (%)
Means of transportation to work - Other means (%)
Working at home (%)
Industry diversity
Most Common Industries - Agriculture, forestry, fishing and hunting, and mining (%)
Most Common Industries - Agriculture, forestry, fishing and hunting (%)
Most Common Industries - Mining, quarrying, and oil and gas extraction (%)
Most Common Industries - Construction (%)
Most Common Industries - Manufacturing (%)
Most Common Industries - Wholesale trade (%)
Most Common Industries - Retail trade (%)
Most Common Industries - Transportation and warehousing, and utilities (%)
Most Common Industries - Transportation and warehousing (%)
Most Common Industries - Utilities (%)
Most Common Industries - Information (%)
Most Common Industries - Finance and insurance, and real estate and rental and leasing (%)
Most Common Industries - Finance and insurance (%)
Most Common Industries - Real estate and rental and leasing (%)
Most Common Industries - Professional, scientific, and management, and administrative and waste management services (%)
Most Common Industries - Professional, scientific, and technical services (%)
Most Common Industries - Management of companies and enterprises (%)
Most Common Industries - Administrative and support and waste management services (%)
Most Common Industries - Educational services, and health care and social assistance (%)
Most Common Industries - Educational services (%)
Most Common Industries - Health care and social assistance (%)
Most Common Industries - Arts, entertainment, and recreation, and accommodation and food services (%)
Most Common Industries - Arts, entertainment, and recreation (%)
Most Common Industries - Accommodation and food services (%)
Most Common Industries - Other services, except public administration (%)
Most Common Industries - Public administration (%)
Occupation diversity
Most Common Occupations - Management, business, science, and arts occupations (%)
Most Common Occupations - Management, business, and financial occupations (%)
Most Common Occupations - Management occupations (%)
Most Common Occupations - Business and financial operations occupations (%)
Most Common Occupations - Computer, engineering, and science occupations (%)
Most Common Occupations - Computer and mathematical occupations (%)
Most Common Occupations - Architecture and engineering occupations (%)
Most Common Occupations - Life, physical, and social science occupations (%)
Most Common Occupations - Education, legal, community service, arts, and media occupations (%)
Most Common Occupations - Community and social service occupations (%)
Most Common Occupations - Legal occupations (%)
Most Common Occupations - Education, training, and library occupations (%)
Most Common Occupations - Arts, design, entertainment, sports, and media occupations (%)
Most Common Occupations - Healthcare practitioners and technical occupations (%)
Most Common Occupations - Health diagnosing and treating practitioners and other technical occupations (%)
Most Common Occupations - Health technologists and technicians (%)
Most Common Occupations - Service occupations (%)
Most Common Occupations - Healthcare support occupations (%)
Most Common Occupations - Protective service occupations (%)
Most Common Occupations - Fire fighting and prevention, and other protective service workers including supervisors (%)
Most Common Occupations - Law enforcement workers including supervisors (%)
Most Common Occupations - Food preparation and serving related occupations (%)
Most Common Occupations - Building and grounds cleaning and maintenance occupations (%)
Most Common Occupations - Personal care and service occupations (%)
Most Common Occupations - Sales and office occupations (%)
Most Common Occupations - Sales and related occupations (%)
Most Common Occupations - Office and administrative support occupations (%)
Most Common Occupations - Natural resources, construction, and maintenance occupations (%)
Most Common Occupations - Farming, fishing, and forestry occupations (%)
Most Common Occupations - Construction and extraction occupations (%)
Most Common Occupations - Installation, maintenance, and repair occupations (%)
Most Common Occupations - Production, transportation, and material moving occupations (%)
Most Common Occupations - Production occupations (%)
Most Common Occupations - Transportation occupations (%)
Most Common Occupations - Material moving occupations (%)
People in Group quarters - Institutionalized population (%)
People in Group quarters - Correctional institutions (%)
People in Group quarters - Federal prisons and detention centers (%)
People in Group quarters - Halfway houses (%)
People in Group quarters - Local jails and other confinement facilities (including police lockups) (%)
People in Group quarters - Military disciplinary barracks (%)
People in Group quarters - State prisons (%)
People in Group quarters - Other types of correctional institutions (%)
People in Group quarters - Nursing homes (%)
People in Group quarters - Hospitals/wards, hospices, and schools for the handicapped (%)
People in Group quarters - Hospitals/wards and hospices for chronically ill (%)
People in Group quarters - Hospices or homes for chronically ill (%)
People in Group quarters - Military hospitals or wards for chronically ill (%)
People in Group quarters - Other hospitals or wards for chronically ill (%)
People in Group quarters - Hospitals or wards for drug/alcohol abuse (%)
People in Group quarters - Mental (Psychiatric) hospitals or wards (%)
People in Group quarters - Schools, hospitals, or wards for the mentally retarded (%)
People in Group quarters - Schools, hospitals, or wards for the physically handicapped (%)
People in Group quarters - Institutions for the deaf (%)
People in Group quarters - Institutions for the blind (%)
People in Group quarters - Orthopedic wards and institutions for the physically handicapped (%)
People in Group quarters - Wards in general hospitals for patients who have no usual home elsewhere (%)
People in Group quarters - Wards in military hospitals for patients who have no usual home elsewhere (%)
People in Group quarters - Juvenile institutions (%)
People in Group quarters - Long-term care (%)
People in Group quarters - Homes for abused, dependent, and neglected children (%)
People in Group quarters - Residential treatment centers for emotionally disturbed children (%)
People in Group quarters - Training schools for juvenile delinquents (%)
People in Group quarters - Short-term care, detention or diagnostic centers for delinquent children (%)
People in Group quarters - Type of juvenile institution unknown (%)
People in Group quarters - Noninstitutionalized population (%)
People in Group quarters - College dormitories (includes college quarters off campus) (%)
People in Group quarters - Military quarters (%)
People in Group quarters - On base (%)
People in Group quarters - Barracks, unaccompanied personnel housing (UPH), (Enlisted/Officer), ;and similar group living quarters for military personnel (%)
People in Group quarters - Transient quarters for temporary residents (%)
People in Group quarters - Military ships (%)
People in Group quarters - Group homes (%)
People in Group quarters - Homes or halfway houses for drug/alcohol abuse (%)
People in Group quarters - Homes for the mentally ill (%)
People in Group quarters - Homes for the mentally retarded (%)
People in Group quarters - Homes for the physically handicapped (%)
People in Group quarters - Other group homes (%)
People in Group quarters - Religious group quarters (%)
People in Group quarters - Dormitories (%)
People in Group quarters - Agriculture workers' dormitories on farms (%)
People in Group quarters - Job Corps and vocational training facilities (%)
People in Group quarters - Other workers' dormitories (%)
People in Group quarters - Crews of maritime vessels (%)
People in Group quarters - Other nonhousehold living situations (%)
People in Group quarters - Other noninstitutional group quarters (%)
Residents speaking English at home (%)
Residents speaking English at home - Born in the United States (%)
Residents speaking English at home - Native, born elsewhere (%)
Residents speaking English at home - Foreign born (%)
Residents speaking Spanish at home (%)
Residents speaking Spanish at home - Born in the United States (%)
Residents speaking Spanish at home - Native, born elsewhere (%)
Residents speaking Spanish at home - Foreign born (%)
Residents speaking other language at home (%)
Residents speaking other language at home - Born in the United States (%)
Residents speaking other language at home - Native, born elsewhere (%)
Residents speaking other language at home - Foreign born (%)
Class of Workers - Employee of private company (%)
Class of Workers - Self-employed in own incorporated business (%)
Class of Workers - Private not-for-profit wage and salary workers (%)
Class of Workers - Local government workers (%)
Class of Workers - State government workers (%)
Class of Workers - Federal government workers (%)
Class of Workers - Self-employed workers in own not incorporated business and Unpaid family workers (%)
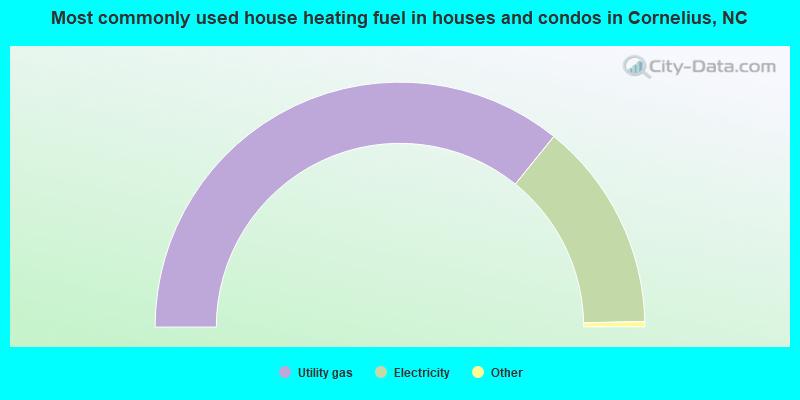
House heating fuel used in houses and condos - Utility gas (%)
House heating fuel used in houses and condos - Bottled, tank, or LP gas (%)
House heating fuel used in houses and condos - Electricity (%)
House heating fuel used in houses and condos - Fuel oil, kerosene, etc. (%)
House heating fuel used in houses and condos - Coal or coke (%)
House heating fuel used in houses and condos - Wood (%)
House heating fuel used in houses and condos - Solar energy (%)
House heating fuel used in houses and condos - Other fuel (%)
House heating fuel used in houses and condos - No fuel used (%)
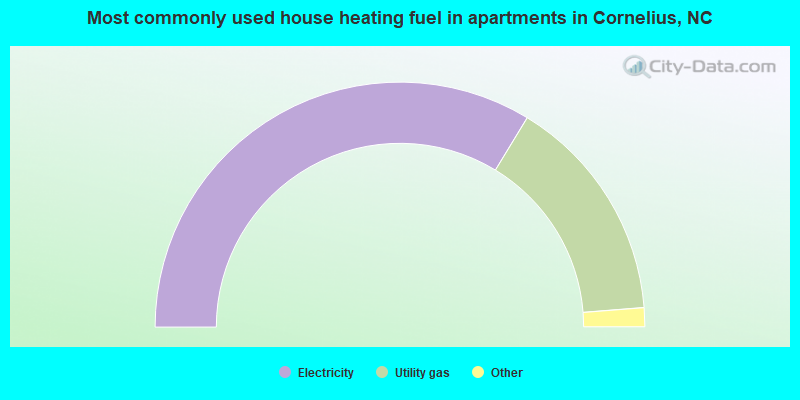
House heating fuel used in apartments - Utility gas (%)
House heating fuel used in apartments - Bottled, tank, or LP gas (%)
House heating fuel used in apartments - Electricity (%)
House heating fuel used in apartments - Fuel oil, kerosene, etc. (%)
House heating fuel used in apartments - Coal or coke (%)
House heating fuel used in apartments - Wood (%)
House heating fuel used in apartments - Solar energy (%)
House heating fuel used in apartments - Other fuel (%)
House heating fuel used in apartments - No fuel used (%)
Armed forces status - In Armed Forces (%)
Armed forces status - Civilian (%)
Armed forces status - Civilian - Veteran (%)
Armed forces status - Civilian - Nonveteran (%)
Fatal accidents locations in years 2005-2021
Fatal accidents locations in 2005
Fatal accidents locations in 2006
Fatal accidents locations in 2007
Fatal accidents locations in 2008
Fatal accidents locations in 2009
Fatal accidents locations in 2010
Fatal accidents locations in 2011
Fatal accidents locations in 2012
Fatal accidents locations in 2013
Fatal accidents locations in 2014
Fatal accidents locations in 2015
Fatal accidents locations in 2016
Fatal accidents locations in 2017
Fatal accidents locations in 2018
Fatal accidents locations in 2019
Fatal accidents locations in 2020
Fatal accidents locations in 2021
Alcohol use - People drinking some alcohol every month (%)
Alcohol use - People not drinking at all (%)
Alcohol use - Average days/month drinking alcohol
Alcohol use - Average drinks/week
Alcohol use - Average days/year people drink much
Audiometry - Average condition of hearing (%)
Audiometry - People that can hear a whisper from across a quiet room (%)
Audiometry - People that can hear normal voice from across a quiet room (%)
Audiometry - Ears ringing, roaring, buzzing (%)
Audiometry - Had a job exposure to loud noise (%)
Audiometry - Had off-work exposure to loud noise (%)
Blood Pressure & Cholesterol - Has high blood pressure (%)
Blood Pressure & Cholesterol - Checking blood pressure at home (%)
Blood Pressure & Cholesterol - Frequently checking blood cholesterol (%)
Blood Pressure & Cholesterol - Has high cholesterol level (%)
Consumer Behavior - Money monthly spent on food at supermarket/grocery store
Consumer Behavior - Money monthly spent on food at other stores
Consumer Behavior - Money monthly spent on eating out
Consumer Behavior - Money monthly spent on carryout/delivered foods
Consumer Behavior - Income spent on food at supermarket/grocery store (%)
Consumer Behavior - Income spent on food at other stores (%)
Consumer Behavior - Income spent on eating out (%)
Consumer Behavior - Income spent on carryout/delivered foods (%)
Current Health Status - General health condition (%)
Current Health Status - Blood donors (%)
Current Health Status - Has blood ever tested for HIV virus (%)
Current Health Status - Left-handed people (%)
Dermatology - People using sunscreen (%)
Diabetes - Diabetics (%)
Diabetes - Had a blood test for high blood sugar (%)
Diabetes - People taking insulin (%)
Diet Behavior & Nutrition - Diet health (%)
Diet Behavior & Nutrition - Milk product consumption (# of products/month)
Diet Behavior & Nutrition - Meals not home prepared (#/week)
Diet Behavior & Nutrition - Meals from fast food or pizza place (#/week)
Diet Behavior & Nutrition - Ready-to-eat foods (#/month)
Diet Behavior & Nutrition - Frozen meals/pizza (#/month)
Drug Use - People that ever used marijuana or hashish (%)
Drug Use - Ever used hard drugs (%)
Drug Use - Ever used any form of cocaine (%)
Drug Use - Ever used heroin (%)
Drug Use - Ever used methamphetamine (%)
Health Insurance - People covered by health insurance (%)
Kidney Conditions-Urology - Avg. # of times urinating at night
Medical Conditions - People with asthma (%)
Medical Conditions - People with anemia (%)
Medical Conditions - People with psoriasis (%)
Medical Conditions - People with overweight (%)
Medical Conditions - Elderly people having difficulties in thinking or remembering (%)
Medical Conditions - People who ever received blood transfusion (%)
Medical Conditions - People having trouble seeing even with glass/contacts (%)
Medical Conditions - People with arthritis (%)
Medical Conditions - People with gout (%)
Medical Conditions - People with congestive heart failure (%)
Medical Conditions - People with coronary heart disease (%)
Medical Conditions - People with angina pectoris (%)
Medical Conditions - People who ever had heart attack (%)
Medical Conditions - People who ever had stroke (%)
Medical Conditions - People with emphysema (%)
Medical Conditions - People with thyroid problem (%)
Medical Conditions - People with chronic bronchitis (%)
Medical Conditions - People with any liver condition (%)
Medical Conditions - People who ever had cancer or malignancy (%)
Mental Health - People who have little interest in doing things (%)
Mental Health - People feeling down, depressed, or hopeless (%)
Mental Health - People who have trouble sleeping or sleeping too much (%)
Mental Health - People feeling tired or having little energy (%)
Mental Health - People with poor appetite or overeating (%)
Mental Health - People feeling bad about themself (%)
Mental Health - People who have trouble concentrating on things (%)
Mental Health - People moving or speaking slowly or too fast (%)
Mental Health - People having thoughts they would be better off dead (%)
Oral Health - Average years since last visit a dentist
Oral Health - People embarrassed because of mouth (%)
Oral Health - People with gum disease (%)
Oral Health - General health of teeth and gums (%)
Oral Health - Average days a week using dental floss/device
Oral Health - Average days a week using mouthwash for dental problem
Oral Health - Average number of teeth
Pesticide Use - Households using pesticides to control insects (%)
Pesticide Use - Households using pesticides to kill weeds (%)
Physical Activity - People doing vigorous-intensity work activities (%)
Physical Activity - People doing moderate-intensity work activities (%)
Physical Activity - People walking or bicycling (%)
Physical Activity - People doing vigorous-intensity recreational activities (%)
Physical Activity - People doing moderate-intensity recreational activities (%)
Physical Activity - Average hours a day doing sedentary activities
Physical Activity - Average hours a day watching TV or videos
Physical Activity - Average hours a day using computer
Physical Functioning - People having limitations keeping them from working (%)
Physical Functioning - People limited in amount of work they can do (%)
Physical Functioning - People that need special equipment to walk (%)
Physical Functioning - People experiencing confusion/memory problems (%)
Physical Functioning - People requiring special healthcare equipment (%)
Prescription Medications - Average number of prescription medicines taking
Preventive Aspirin Use - Adults 40+ taking low-dose aspirin (%)
Reproductive Health - Vaginal deliveries (%)
Reproductive Health - Cesarean deliveries (%)
Reproductive Health - Deliveries resulted in a live birth (%)
Reproductive Health - Pregnancies resulted in a delivery (%)
Reproductive Health - Women breastfeeding newborns (%)
Reproductive Health - Women that had a hysterectomy (%)
Reproductive Health - Women that had both ovaries removed (%)
Reproductive Health - Women that have ever taken birth control pills (%)
Reproductive Health - Women taking birth control pills (%)
Reproductive Health - Women that have ever used Depo-Provera or injectables (%)
Reproductive Health - Women that have ever used female hormones (%)
Sexual Behavior - People 18+ that ever had sex (vaginal, anal, or oral) (%)
Sexual Behavior - Males 18+ that ever had vaginal sex with a woman (%)
Sexual Behavior - Males 18+ that ever performed oral sex on a woman (%)
Sexual Behavior - Males 18+ that ever had anal sex with a woman (%)
Sexual Behavior - Males 18+ that ever had any sex with a man (%)
Sexual Behavior - Females 18+ that ever had vaginal sex with a man (%)
Sexual Behavior - Females 18+ that ever performed oral sex on a man (%)
Sexual Behavior - Females 18+ that ever had anal sex with a man (%)
Sexual Behavior - Females 18+ that ever had any kind of sex with a woman (%)
Sexual Behavior - Average age people first had sex
Sexual Behavior - Average number of female sex partners in lifetime (males 18+)
Sexual Behavior - Average number of female vaginal sex partners in lifetime (males 18+)
Sexual Behavior - Average age people first performed oral sex on a woman (18+)
Sexual Behavior - Average number of woman performed oral sex on in lifetime (18+)
Sexual Behavior - Average number of male sex partners in lifetime (males 18+)
Sexual Behavior - Average number of male anal sex partners in lifetime (males 18+)
Sexual Behavior - Average age people first performed oral sex on a man (18+)
Sexual Behavior - Average number of male oral sex partners in lifetime (18+)
Sexual Behavior - People using protection when performing oral sex (%)
Sexual Behavior - Average number of times people have vaginal or anal sex a year
Sexual Behavior - People having sex without condom (%)
Sexual Behavior - Average number of male sex partners in lifetime (females 18+)
Sexual Behavior - Average number of male vaginal sex partners in lifetime (females 18+)
Sexual Behavior - Average number of female sex partners in lifetime (females 18+)
Sexual Behavior - Circumcised males 18+ (%)
Sleep Disorders - Average hours sleeping at night
Sleep Disorders - People that has trouble sleeping (%)
Smoking-Cigarette Use - People smoking cigarettes (%)
Taste & Smell - People 40+ having problems with smell (%)
Taste & Smell - People 40+ having problems with taste (%)
Taste & Smell - People 40+ that ever had wisdom teeth removed (%)
Taste & Smell - People 40+ that ever had tonsils teeth removed (%)
Taste & Smell - People 40+ that ever had a loss of consciousness because of a head injury (%)
Taste & Smell - People 40+ that ever had a broken nose or other serious injury to face or skull (%)
Taste & Smell - People 40+ that ever had two or more sinus infections (%)
Weight - Average height (inches)
Weight - Average weight (pounds)
Weight - Average BMI
Weight - People that are obese (%)
Weight - People that ever were obese (%)
Weight - People trying to lose weight (%)
According to our research of North Carolina and other state lists, there were 13 registered sex offenders living in Cornelius, North Carolina as of April 27, 2024 . The ratio of all residents to sex offenders in Cornelius is 2,199 to 1.The ratio of registered sex offenders to all residents in this city is much lower than the state average.
Officers per 1,000 residents here:
1.81North Carolina average:
2.27
Latest news from Cornelius, NC collected exclusively by city-data.com from local newspapers, TV, and radio stations
Cornelius, NC City Guides: Ancestries: English (14.8%), German (11.6%), American (9.6%), Irish (8.2%), Italian (7.3%), European (5.2%).
Current Local Time:
Incorporated on 03/04/1905
Land area: 8.46 square miles.
Population density: 3,819 people per square mile (average).
2,898 residents are foreign born (2.8% Asia , 2.5% Latin America , 2.4% Europe ).
This town:
9.0%North Carolina:
8.3%
Median real estate property taxes paid for housing units with mortgages in 2022: $3,440 (0.6%)Median real estate property taxes paid for housing units with no mortgage in 2022: $3,527 (0.7%)
Nearest city with pop. 50,000+: Concord, NC
Nearest city with pop. 200,000+: Charlotte, NC
Nearest city with pop. 1,000,000+: Philadelphia, PA
Nearest cities:
Latitude: 35.48 N, Longitude: 80.88 W
Daytime population change due to commuting: -2,795 (-8.7%)Workers who live and work in this town: 6,636 (39.8%)
Area code commonly used in this area: 704
Property values in Cornelius, NC
Unemployment in December 2023: Here:
2.5%North Carolina:
3.2%
Most common industries in Cornelius, NC (%)
Both Males Females
Professional, scientific, technical services (11.0%)
Finance & insurance (9.9%)
Health care (6.4%)
Construction (6.0%)
Educational services (5.8%)
Arts, entertainment, recreation (4.1%)
Accommodation & food services (3.9%)
Professional, scientific, technical services (10.6%)
Finance & insurance (9.7%)
Construction (8.5%)
Arts, entertainment, recreation (5.6%)
Accommodation & food services (4.6%)
Health care (3.6%)
Administrative & support & waste management services (3.3%)
Professional, scientific, technical services (11.4%)
Educational services (10.3%)
Health care (10.2%)
Finance & insurance (10.1%)
Real estate & rental & leasing (4.8%)
Administrative & support & waste management services (4.3%)
Accommodation & food services (2.9%)
Most common occupations in Cornelius, NC (%)
Both Males Females
Sales representatives, services, wholesale and manufacturing (7.2%)
Other management occupations, except farmers and farm managers (7.2%)
Other sales and related occupations, including supervisors (5.2%)
Top executives (4.3%)
Computer specialists (3.6%)
Retail sales workers, except cashiers (3.5%)
Operations specialties managers, except financial managers (3.2%)
Other management occupations, except farmers and farm managers (9.1%)
Sales representatives, services, wholesale and manufacturing (8.8%)
Top executives (6.7%)
Other sales and related occupations, including supervisors (4.7%)
Computer specialists (4.3%)
Building and grounds cleaning and maintenance occupations (4.3%)
Operations specialties managers, except financial managers (3.4%)
Other sales and related occupations, including supervisors (5.8%)
Secretaries and administrative assistants (5.4%)
Sales representatives, services, wholesale and manufacturing (5.1%)
Other office and administrative support workers, including supervisors (4.7%)
Retail sales workers, except cashiers (4.6%)
Other management occupations, except farmers and farm managers (4.5%)
Preschool, kindergarten, elementary, and middle school teachers (4.3%)
Tornado activity:
Cornelius-area historical tornado activity is slightly above North Carolina state average. It is 1% smaller than the overall U.S. average.
On 5/5/1989, a category F4 (max. wind speeds 207-260 mph) tornado 32.3 miles away from the Cornelius town center killed one person and injured 6 people and caused between $5,000,000 and $50,000,000 in damages.
On 5/5/1989, a category F4 tornado 33.2 miles away from the town center killed 4 people and injured 52 people and caused between $5,000,000 and $50,000,000 in damages.
Earthquake activity:
Cornelius-area historical earthquake activity is significantly above North Carolina state average. It is 19% smaller than the overall U.S. average. On 8/9/2020 at 12:07:37, a magnitude 5.1 (5.1 MW, Depth: 4.7 mi, Class: Moderate, Intensity: VI - VII) earthquake occurred 69.9 miles away from the city center On 8/23/2011 at 17:51:04, a magnitude 5.8 (5.8 MW, Depth: 3.7 mi) earthquake occurred 234.5 miles away from Cornelius center On 8/2/1974 at 08:52:09, a magnitude 4.9 (4.3 MB, 4.9 LG, Class: Light, Intensity: IV - V) earthquake occurred 143.8 miles away from the city center On 7/27/1980 at 18:52:21, a magnitude 5.2 (5.1 MB, 4.7 MS, 5.0 UK, 5.2 UK) earthquake occurred 253.4 miles away from the city center On 11/30/1973 at 07:48:41, a magnitude 4.7 (4.7 MB, 4.6 ML) earthquake occurred 174.4 miles away from Cornelius center On 11/22/1974 at 05:25:55, a magnitude 4.7 (4.7 MB) earthquake occurred 183.3 miles away from Cornelius center Magnitude types: regional Lg-wave magnitude (LG), body-wave magnitude (MB), local magnitude (ML), surface-wave magnitude (MS), moment magnitude (MW) Natural disasters: The number of natural disasters in Mecklenburg County (9) is smaller than the US average (15).Major Disasters (Presidential) Declared: 5Emergencies Declared: 3Droughts: 2, Hurricanes: 2, Blizzard: 1, Freeze: 1, Ice Storm: 1, Tropical Storm: 1, Winter Storm: 1, Other: 1 (Note: some incidents may be assigned to more than one category). Hospitals and medical centers near Cornelius: NOVANT HEALTH HUNTERSVILLE MEDICAL CENTER (about 6 miles away; HUNTERSVILLE, NC)
INDEPENDENT NEPHROLOGY SERVICES HUNTERSVILLE (Dialysis Facility, about 6 miles away; HUNTERSVILLE, NC)
HUNTERSVILLE OAKS (Nursing Home, about 7 miles away; HUNTERSVILLE, NC)
MOORESVILLE CENTER (Nursing Home, about 8 miles away; MOORESVILLE, NC)
BRIAN CENTER HEALTH AND RETIREMENT (Nursing Home, about 9 miles away; MOORESVILLE, NC)
ODELL NURSING CENTER (Nursing Home, about 9 miles away; CONCORD, NC)
NORTH CHARLOTTE (Dialysis Facility, about 12 miles away; CHARLOTTE, NC)
Amtrak stations near Cornelius: 15 miles: KANNAPOLIS (306 N. MAIN ST.) Services: enclosed waiting area, public restrooms, public payphones, free short-term parking, free long-term parking, call for car rental service, call for taxi service.
17 miles: CHARLOTTE (1914 N. TYRON ST.) Services: ticket office, partially wheelchair accessible, enclosed waiting area, public restrooms, public payphones, vending machines, free short-term parking, free long-term parking, call for car rental service, taxi stand, public transit connection.
Nuclear power plants:
McGuire 1. Westinghouse Electric Corp.Duke Power Co.Westinghouse Electric Corp.Duke Power Co.Pressurized Water Reactor (PWR). Net Output: 1129 MWe. Operable. Initial criticality: 08/1981. Commercial start: 12/1981..
McGuire 2. Westinghouse Electric Corp.Duke Power Co.Westinghouse Electric Corp.Duke Power Co.Pressurized Water Reactor (PWR). Net Output: 1129 MWe. Operable. Initial criticality: 05/1983. Commercial start: 03/1984..
Colleges/universities with over 2000 students nearest to Cornelius:
NASCAR Technical Institute (about 9 miles; Mooresville, NC ; Full-time enrollment: 2,350)
University of North Carolina at Charlotte (about 15 miles; Charlotte, NC ; FT enrollment: 22,807)
Johnson & Wales University-Charlotte (about 18 miles; Charlotte, NC ; FT enrollment: 2,518)
Central Piedmont Community College (about 19 miles; Charlotte, NC ; FT enrollment: 15,371)
Queens University of Charlotte (about 21 miles; Charlotte, NC ; FT enrollment: 2,083)
Gaston College (about 21 miles; Dallas, NC ; FT enrollment: 4,385)
Mitchell Community College (about 22 miles; Statesville, NC ; FT enrollment: 2,458)
Public high school in Cornelius:
Public elementary/middle schools in Cornelius:
Private elementary/middle school in Cornelius: GRACE COVENANT ACADEMY Students: 140, Location: 17301 STATESVILLE RD, Grades: PK-5)
See full list of schools located in Cornelius
Notable locations in Cornelius: (A) , Kings Point Marina (B) , Holiday Harbor (C) , Public Library of Charlotte and Mecklenburg County - Cornelius Branch (D) . Display/hide their locations on the map
Churches in Cornelius include: (A) , Bethel Church (B) , Mount Zion Church (C) . Display/hide their locations on the map
Cemetery: (1) . Display/hide its location on the map
Park in Cornelius: (1) . Display/hide its location on the map
Tourist attractions:
Hotels:
Birthplace of: Kevin Conway (racing driver) - Racing driver, Kevin Conway - Busch series NASCAR driver (born : Apr 15, 1978), Scot Walters - NASCAR driver, Andrea Stinson - WNBA player (Detroit Shock, born : Nov 25, 1967).
Mecklenburg County has a predicted average indoor radon screening level less than 2 pCi/L (pico curies per liter) - Low Potential Average household size: This town:
2.3 peopleNorth Carolina:
2.5 people
Percentage of family households: This town:
61.1%Whole state:
66.7%
Percentage of households with unmarried partners: This town:
6.6%Whole state:
5.9%
Likely homosexual households (counted as self-reported same-sex unmarried-partner households)
Lesbian couples: 0.4% of all households Gay men: 0.4% of all households
6 people in group homes intended for adults in 2010
Banks with most branches in Cornelius (2011 data):
Communityone Bank, National Association: Cornelius Office Branch at 8231 Magnolia Estates Dr, branch established on 2008/11/03. Info updated 2007/12/11: Bank assets: $1,666.0 mil, Deposits: $1,443.4 mil, headquarters in Asheboro, NC, negative income in the last year , 46 total offices , Holding Company: Fnb United Corp.
Bank of Granite: Cornelius Office at 18225 West Catawba Avenue, branch established on 2000/06/12. Info updated 2006/11/03: Bank assets: $753.5 mil, Deposits: $688.5 mil, headquarters in Granite Falls, NC, positive income , Commercial Lending Specialization, 18 total offices , Holding Company: Fnb United Corp.
First Community Bank: 20209 Hwy. 73 West Branch at 20209 Hwy. 73 West, branch established on 1987/06/30. Info updated 2011/07/12: Bank assets: $2,144.1 mil, Deposits: $1,561.3 mil, headquarters in Bluefield, VA, positive income , Commercial Lending Specialization, 58 total offices , Holding Company: First Community Bancshares, Inc.
Branch Banking and Trust Company: Cornelius Branch at 20400 W Catawba Ave, branch established on 1999/08/30. Info updated 2010/03/29: Bank assets: $168,867.6 mil, Deposits: $127,549.5 mil, headquarters in Winston Salem, NC, positive income , Commercial Lending Specialization, 1793 total offices , Holding Company: Bb&T Corporation
Wells Fargo Bank, National Association: North Mecklenburg Branch at 19409 Jetton Rd, branch established on 2008/07/01. Info updated 2011/04/05: Bank assets: $1,161,490.0 mil, Deposits: $905,653.0 mil, headquarters in Sioux Falls, SD, positive income , 6395 total offices , Holding Company: Wells Fargo & Company
Regions Bank: West Catawba Avenue Branch at 19430 West Catawba Avenue, branch established on 2002/03/08. Info updated 2011/02/24: Bank assets: $123,368.2 mil, Deposits: $98,301.3 mil, headquarters in Birmingham, AL, positive income , Commercial Lending Specialization, 1778 total offices , Holding Company: Regions Financial Corporation
First-Citizens Bank & Trust Company: Cornelius Branch at 2310 Catawba Avenue, branch established on 1992/07/08. Info updated 2011/10/11: Bank assets: $20,566.4 mil, Deposits: $17,596.8 mil, headquarters in Raleigh, NC, positive income , Commercial Lending Specialization, 433 total offices , Holding Company: First Citizens Bancshares, Inc.
Aquesta Bank: at 19510 Jetton Road, branch established on 2006/08/01. Info updated 2008/03/31: Bank assets: $199.1 mil, Deposits: $157.0 mil, local headquarters , negative income in the last year , Commercial Lending Specialization, 4 total offices
Yadkin Valley Bank and Trust Company: Cornelius W. Catawba Branch at 19525 W. Catawba Avenue, branch established on 2000/10/12. Info updated 2009/05/19: Bank assets: $1,991.0 mil, Deposits: $1,738.1 mil, headquarters in Elkin, NC, negative income in the last year , Commercial Lending Specialization, 39 total offices , Holding Company: Yadkin Valley Financial Corporation
4 other banks with 4 local branches
For population 15 years and over in Cornelius:
Never married: 25.4%Now married: 58.8%Separated: 0.8%Widowed: 3.9%Divorced: 11.1% For population 25 years and over in Cornelius:
High school or higher: 97.2%Bachelor's degree or higher: 58.6%Graduate or professional degree: 19.6%Unemployed: 3.0%Mean travel time to work (commute): 16.7 minutes
Education Gini index (Inequality in education) Here:
8.8North Carolina average:
11.7
Religion statistics for Cornelius, NC (based on Mecklenburg County data)
Religion Adherents Congregations Evangelical Protestant 204,287 491 Mainline Protestant 138,743 188 Catholic 78,692 15 Black Protestant 26,612 73 Other 20,979 68 Orthodox 8,724 12 None 442,262 -
Source: Clifford Grammich, Kirk Hadaway, Richard Houseal, Dale E.Jones, Alexei Krindatch, Richie Stanley and Richard H.Taylor. 2012. 2010 U.S.Religion Census: Religious Congregations & Membership Study. Association of Statisticians of American Religious Bodies. Jones, Dale E., et al. 2002. Congregations and Membership in the United States 2000. Nashville, TN: Glenmary Research Center. Graphs represent county-level data
Food Environment Statistics: Number of grocery stores : 185Here :
2.14 / 10,000 pop.State :
2.05 / 10,000 pop.
Number of supercenters and club stores : 10Mecklenburg County :
0.12 / 10,000 pop.State :
0.14 / 10,000 pop.
Number of convenience stores (no gas) : 83Mecklenburg County :
0.96 / 10,000 pop.State :
0.92 / 10,000 pop.
Number of convenience stores (with gas) : 245Mecklenburg County :
2.84 / 10,000 pop.North Carolina :
4.75 / 10,000 pop.
Number of full-service restaurants : 804Mecklenburg County :
9.31 / 10,000 pop.State :
7.57 / 10,000 pop.
Adult obesity rate : Here :
24.2%North Carolina :
28.3%
Low-income preschool obesity rate : This county :
17.4%North Carolina :
15.6%
Health and Nutrition: Healthy diet rate : This city:
50.8%North Carolina:
48.9%
Average overall health of teeth and gums : This city:
49.1%North Carolina:
46.1%
Average BMI : Cornelius:
28.6North Carolina:
28.8
People feeling badly about themselves : Here:
21.7%North Carolina:
20.7%
People not drinking alcohol at all : Cornelius:
8.7%State:
10.7%
Average hours sleeping at night : Overweight people : Cornelius:
34.4%State:
33.7%
General health condition : Cornelius:
58.3%North Carolina:
55.8%
Average condition of hearing : Cornelius:
80.2%North Carolina:
79.7%
More about Health and Nutrition of Cornelius, NC Residents
Local government employment and payroll (March 2022)
Function
Full-time employees
Monthly full-time payroll
Average yearly full-time wage
Part-time employees
Monthly part-time payroll
Police Protection - Officers
52 $267,487 $61,728 11 $11,113 Police - Other
18 $64,881 $43,254 7 $7,228 Parks and Recreation
12 $53,630 $53,630 30 $7,112 Other Government Administration
11 $72,550 $79,145 7 $10,241 Streets and Highways
8 $29,587 $44,381 1 $971 Financial Administration
7 $35,517 $60,886 2 $1,259 Firefighters
5 $29,563 $70,951 0 $0
Totals for Government
113 $553,215 $58,748 58 $37,923
Cornelius government finances - Expenditure in 2021 (per resident):
Construction - Parks and Recreation: $3,121,000 ($96.64)
Regular Highways: $1,274,000 ($39.45)Current Operations - Police Protection: $7,444,000 ($230.51)
Electric Utilities: $6,167,000 ($190.96)Parks and Recreation: $2,217,000 ($68.65)Solid Waste Management: $2,075,000 ($64.25)Financial Administration: $2,047,000 ($63.39)Local Fire Protection: $1,774,000 ($54.93)Regular Highways: $1,250,000 ($38.71)Housing and Community Development: $984,000 ($30.47)Natural Resources - Other: $238,000 ($7.37)Central Staff Services: $66,000 ($2.04)General - Interest on Debt: $538,000 ($16.66)
Other Capital Outlay - Police Protection: $984,000 ($30.47)
Parks and Recreation: $672,000 ($20.81)Local Fire Protection: $68,000 ($2.11)
Cornelius government finances - Revenue in 2021 (per resident):
Charges - Parks and Recreation: $464,000 ($14.37)
Sewerage: $432,000 ($13.38)Federal Intergovernmental - Other: $39,000 ($1.21)
Local Intergovernmental - Other: $933,000 ($28.89)
General Local Government Support: $93,000 ($2.88)Miscellaneous - General Revenue - Other: $1,279,000 ($39.60)
Sale of Property: $586,000 ($18.15)Interest Earnings: $121,000 ($3.75)Donations From Private Sources: $21,000 ($0.65)Rents: $1,000 ($0.03)Revenue - Electric Utilities: $6,494,000 ($201.09)
State Intergovernmental - General Local Government Support: $4,098,000 ($126.90)
Highways: $751,000 ($23.26)Other: $319,000 ($9.88)Tax - Property: $16,943,000 ($524.65)
General Sales and Gross Receipts: $4,209,000 ($130.33)Other Selective Sales: $675,000 ($20.90)Motor Vehicle License: $247,000 ($7.65)Other License: $24,000 ($0.74)
Cornelius government finances - Debt in 2021 (per resident):
Long Term Debt - Beginning Outstanding - Unspecified Public Purpose: $16,732,000 ($518.11)
Outstanding Unspecified Public Purpose: $14,981,000 ($463.89)Retired Unspecified Public Purpose: $1,751,000 ($54.22)
9.09% of this county's 2021 resident taxpayers lived in other counties in 2020 ($78,641 average adjusted gross income )
Here:
9.09%North Carolina average:
8.85%
0.01% of residents moved from foreign countries ($73 average AGI )Mecklenburg County:
0.01%North Carolina average:
0.04%
Top counties from which taxpayers relocated into this county between 2020 and 2021:
9.02% of this county's 2020 resident taxpayers moved to other counties in 2021 ($81,691 average adjusted gross income )
Here:
9.02%North Carolina average:
7.89%
0.02% of residents moved to foreign countries ($115 average AGI )Mecklenburg County:
0.02%North Carolina average:
0.03%
Top counties to which taxpayers relocated from this county between 2020 and 2021:
Businesses in Cornelius, NC
Name Count Name Count
Ace Hardware 1 MasterBrand Cabinets 1 Blockbuster 1 McDonald's 1 CVS 1 Microtel 1 Clarion 1 Nissan 1 Comfort Inn 1 Penske 1 Cricket Wireless 1 Pizza Hut 1 Days Inn 1 Rite Aid 2 Domino's Pizza 1 Starbucks 2 Econo Lodge 1 T-Mobile 1 FedEx 6 Taco Bell 1 Goodwill 1 U-Haul 3 H&R Block 1 UPS 10 Hilton 1 Waffle House 1 Home Depot 1 Walgreens 1 Hyundai 1 Wendy's 1 Jones New York 1 YMCA 1 KFC 1
Strongest AM radio stations in Cornelius:
WBT (1110 AM; 50 kW; CHARLOTTE, NC; Owner: JEFFERSON-PILOT COMMUNICATNS CO. OF NORTH CAROLINA)
WFNZ (610 AM; 5 kW; CHARLOTTE, NC; Owner: INFINITY RADIO SUBSIDIARY OPERATIONS INC.)
WHKY (1290 AM; 50 kW; HICKORY, NC; Owner: LONG COMMUNICATIONS, LLC.)
WGFY (1480 AM; 10 kW; CHARLOTTE, NC; Owner: ABC, INC.)
WLTC (1370 AM; 20 kW; GASTONIA, NC)
WYFQ (930 AM; 5 kW; CHARLOTTE, NC; Owner: BIBLE BROADCASTING NETWORK, INC.)
WCGC (1270 AM; 10 kW; BELMONT, NC; Owner: WHVN, INC.)
WAGL (1560 AM; daytime; 50 kW; LANCASTER, SC; Owner: PALMETTO BROADCASTING SYSTEM, INC.)
WTRU (830 AM; 50 kW; KERNERSVILLE, NC; Owner: TRUTH BROADCASTING CORPORATION)
WCXN (1170 AM; daytime; 8 kW; CLAREMONT, NC; Owner: WCXN, INC.)
WNOW (1030 AM; daytime; 9 kW; MINT HILL, NC; Owner: CHARLOTTE METRO RADIO, INC.)
WHIP (1350 AM; 1 kW; MOORESVILLE, NC; Owner: MOORESVILLE MEDIA, INC.)
WOGR (1540 AM; daytime; 2 kW; CHARLOTTE, NC; Owner: VICTORY CHRISTIAN CENTER)
Strongest FM radio stations in Cornelius:
WDAV (89.9 FM; DAVIDSON, NC; Owner: THE TRUSTEES OF DAVIDSON COLLEGE)
WXRC (95.7 FM; HICKORY, NC; Owner: PACIFIC BROADCASTING GROUP, INC.)
WLYT (102.9 FM; HICKORY, NC; Owner: CAPSTAR TX LIMITED PARTNERSHIP)
WTHZ (94.1 FM; LEXINGTON, NC; Owner: DAVIDSON COUNTY BROADCASTING CO, INC)
WPEG (97.9 FM; CONCORD, NC; Owner: INFINITY RADIO SUBSIDIARY OPERATIONS INC.)
WLNK (107.9 FM; CHARLOTTE, NC; Owner: JEFFERSON-PILOT COMMUNICATIONS COMPANY OF NORTH CAROLINA)
WNKS (95.1 FM; CHARLOTTE, NC; Owner: INFINITY RADIO SUBSIDIARY OPERATIONS INC.)
WWMG (96.1 FM; SHELBY, NC; Owner: CLEAR CHANNEL BROADCASTING LICENSES, INC.)
WSOC-FM (103.7 FM; CHARLOTTE, NC; Owner: INFINITY RADIO SUBSIDIARY OPERATIONS INC.)
WKKT (96.9 FM; STATESVILLE, NC; Owner: CAPSTAR TX LIMITED PARTNERSHIP)
WFAE (90.7 FM; CHARLOTTE, NC; Owner: UNIVERSITY RADIO FOUNDATION, INC.)
WSSS (104.7 FM; CHARLOTTE, NC; Owner: INFINITY RADIO SUBSIDIARY OPERATIONS INC.)
WRFX-FM (99.7 FM; KANNAPOLIS, NC; Owner: CAPSTAR TX LIMITED PARTNERSHIP)
WFMX (105.7 FM; STATESVILLE, NC; Owner: MERCURY BROADCASTING COMPANY, INC.)
WBAV-FM (101.9 FM; GASTONIA, NC; Owner: INFINITY RADIO SUBSIDIARY OPERATIONS INC.)
WEND (106.5 FM; SALISBURY, NC; Owner: CAPSTAR TX LIMITED PARTNERSHIP)
WSGE (91.7 FM; DALLAS, NC; Owner: GASTON COLLEGE)
WKBC-FM (97.3 FM; NORTH WILKESBORO, NC; Owner: WILKES BROADCASTING COMPANY, INC.)
WCHH (92.7 FM; HARRISBURG, NC; Owner: RADIO ONE OF NORTH CAROLINA, LLC)
WAGI-FM (105.3 FM; GAFFNEY, SC; Owner: GAFFNEY BROADCASTING, INC.)
TV broadcast stations around Cornelius:
WBTV (Channel 3; CHARLOTTE, NC; Owner: JEFFERSON-PILOT COMMUNICATIONS/WBTV, INC.)
WJZY (Channel 46; BELMONT, NC; Owner: WJZY-TV, INC.)
WWWB (Channel 55; ROCK HILL, SC; Owner: WWWB-TV, INC.)
WCNC-TV (Channel 36; CHARLOTTE, NC; Owner: WCNC-TV, INC.)
WAXN (Channel 64; KANNAPOLIS, NC; Owner: WSOC-TV HOLDINGS, INC.)
WAFF (Channel 48; HUNTSVILLE, AL; Owner: RAYCOM AMERICA, INC.)
WUNG-TV (Channel 58; CONCORD, NC; Owner: UNIVERSITY OF NORTH CAROLINA)
WSOC-TV (Channel 9; CHARLOTTE, NC; Owner: WSOC-TV HOLDINGS, INC.)
WTVI (Channel 42; CHARLOTTE, NC; Owner: CHARLOTTE-MECKLENBURG PUBLIC BROADCASTING AUTHORITY)
WCCB (Channel 18; CHARLOTTE, NC; Owner: NORTH CAROLINA BROADCASTING PARTNERS)
WGTB-LP (Channel 28; CHARLOTTE, NC; Owner: VICTORY CHRISTIAN CENTER, INC.)
W34BN (Channel 34; CHARLOTTE, NC; Owner: THREE ANGELS BROADCASTING NETWORK)
W25BR (Channel 25; CHARLOTTE, NC; Owner: WORD OF GOD FELLOWSHIP, INC.)
W52CW (Channel 52; CHARLOTTE, NC; Owner: TRINITY BROADCASTING NETWORK)
W38CN (Channel 38; CHARLOTTE, NC; Owner: NATIONAL MINORITY T.V., INC.)
W66BT (Channel 66; STATESVILLE, NC; Owner: TRINITY BROADCASTING NETWORK)
FCC Registered Cell Phone Towers: 1 (
See the full list of FCC Registered Cell Phone Towers in Cornelius )
FCC Registered Antenna Towers: 25 (
See the full list of FCC Registered Antenna Towers )
FCC Registered Broadcast Land Mobile Towers: 8 (
See the full list of FCC Registered Broadcast Land Mobile Towers in Cornelius, NC )
FCC Registered Microwave Towers: 4
CAR0625, 20401 Zion St Near Cornelius (Lat: 35.486667 Lon: -80.855833), Type: Tower, Structure height: 55.5 m, Call Sign: WQHF503, Assigned Frequencies: 11225.0 MHz, Grant Date: 07/17/2007, Expiration Date: 07/17/2017, Cancellation Date: 01/12/2009, Certifier: Joseph M Sandri Jr., Registrant: Fibertower Corporation, 1667 K Street Nw, Suite 250, Washington, DC 20006, Phone: (202) 223-1028, Fax: (202) 315-3415, Email:
NC-CLT279A, 20401 Zion Street (Lat: 35.486667 Lon: -80.855556), Type: Tower, Structure height: 55.7 m, Call Sign: WQKY698, Assigned Frequencies: 19325.0 MHz, Grant Date: 10/28/2009, Expiration Date: 10/28/2019, Cancellation Date: 10/25/2019, Certifier: Nadja S Sodos-Wallace, Registrant: Sprint Corporation, 12502 Sunrise Valley Drive, M/S: Varesa, Reston, VA 20196, Phone: (800) 572-8256, Fax: (703) 433-4483, Email:
PENINSULA, 19328 Lake Norman Cove Drive (Lat: 35.475778 Lon: -80.894861), Type: Tower, Structure height: 36.6 m, Call Sign: WQMK273, Licensee ID: L00897274, Assigned Frequencies: 11155.0 MHz, Grant Date: 08/31/2010, Expiration Date: 08/31/2020, Cancellation Date: 05/23/2019, Certifier: Chris Harris, Registrant: Conterra Ultra Broadband LLC, 2101 Rexford Rd Ste 200e, Charlotte, NC 28211, Phone: (704) 936-1777, Fax: (704) 936-1801, Email:
CR25XC022, 17205 Statesville Rd (Lat: 35.450500 Lon: -80.869306), Type: Ltower, Structure height: 57.9 m, Call Sign: WRCL388, Assigned Frequencies: 23125.0 MHz, 23175.0 MHz, 23125.0 MHz, 23175.0 MHz, 23125.0 MHz, 23175.0 MHz, 23125.0 MHz, 23175.0 MHz, 23125.0 MHz, 23175.0 MHz... (+10 more), Grant Date: 10/30/2018, Expiration Date: 10/30/2028, Cancellation Date: 05/15/2023, Certifier: David Werblow, Registrant: T-Mobile Usa, Inc., 12920 Se 38th Street, Bellevue, WA 98006, Phone: (425) 383-8401, Email:
FCC Registered Maritime Coast & Aviation Ground Towers: 2
17939 Kings Point Dr (Lat: 35.457917 Lon: -80.894250), Type: Building, Overall height: 5 m, Call Sign: WAB935, Assigned Frequencies: 156.700 MHz, 156.800 MHz, 156.450 MHz, Grant Date: 06/25/1998, Expiration Date: 09/16/2003, Cancellation Date: 11/16/2003, Registrant: Kings Point Marina Inc, 17939 Kings Point Dr, Cornelius, NC 28031 18441 Nantz Rd. (Lat: 35.464389 Lon: -80.901056), Type: Mast, Structure height: 3.6 m, Overall height: 9.1 m, Call Sign: WQFM740, Assigned Frequencies: 156.800 MHz, 156.450 MHz, 156.425 MHz, Grant Date: 09/21/2016, Expiration Date: 08/18/2026, Certifier: Stephen C Norman, Registrant: Charlotte-Mecklenburg Emergency Management, 228 East Ninth Street, Charlotte, NC 28202, Phone: (704) 336-2412, Fax: (704) 336-4204 FCC Registered Amateur Radio Licenses: 90 (
See the full list of FCC Registered Amateur Radio Licenses in Cornelius )
FAA Registered Aircraft Manufacturers and Dealers: 5 (
See the full list of FAA Registered Manufacturers and Dealers in Cornelius )
FAA Registered Aircraft: 53 (
See the full list of FAA Registered Aircraft )
Home Mortgage Disclosure Act Aggregated Statistics For Year 2009(Based on 5 partial tracts) A) FHA, FSA/RHS & VA B) Conventional C) Refinancings D) Home Improvement Loans F) Non-occupant Loans on Number Average Value Number Average Value Number Average Value Number Average Value Number Average Value
LOANS ORIGINATED 63 $177,240 111 $251,920 434 $244,162 9 $202,963 54 $197,486 APPLICATIONS APPROVED, NOT ACCEPTED 1 $247,820 7 $357,936 38 $226,430 1 $171,720 4 $165,005 APPLICATIONS DENIED 14 $186,636 16 $351,467 115 $251,810 6 $117,652 15 $191,823 APPLICATIONS WITHDRAWN 8 $153,528 16 $290,156 80 $251,319 2 $284,950 11 $225,586 FILES CLOSED FOR INCOMPLETENESS 3 $191,510 2 $356,245 25 $259,658 1 $153,200 2 $176,250
Aggregated Statistics For Year 2008(Based on 5 partial tracts) A) FHA, FSA/RHS & VA B) Conventional C) Refinancings D) Home Improvement Loans E) Loans on Dwellings For 5+ Families F) Non-occupant Loans on Number Average Value Number Average Value Number Average Value Number Average Value Number Average Value Number Average Value
LOANS ORIGINATED 51 $176,968 198 $250,956 262 $248,431 14 $112,226 2 $2,096,050 72 $189,555 APPLICATIONS APPROVED, NOT ACCEPTED 4 $153,085 23 $284,199 35 $221,933 2 $100,615 0 $0 10 $193,238 APPLICATIONS DENIED 8 $236,875 27 $273,740 109 $252,513 13 $58,842 0 $0 16 $194,382 APPLICATIONS WITHDRAWN 6 $184,653 27 $258,104 60 $310,097 4 $129,045 0 $0 11 $219,004 FILES CLOSED FOR INCOMPLETENESS 1 $124,300 4 $244,160 14 $199,338 2 $34,405 0 $0 3 $187,530
Aggregated Statistics For Year 2007(Based on 5 partial tracts) A) FHA, FSA/RHS & VA B) Conventional C) Refinancings D) Home Improvement Loans F) Non-occupant Loans on G) Loans On Manufactured Number Average Value Number Average Value Number Average Value Number Average Value Number Average Value Number Average Value
LOANS ORIGINATED 16 $151,903 462 $210,207 268 $226,540 25 $142,566 130 $191,142 0 $0 APPLICATIONS APPROVED, NOT ACCEPTED 2 $140,735 50 $229,822 49 $240,204 6 $62,632 14 $242,975 0 $0 APPLICATIONS DENIED 1 $238,080 50 $260,436 99 $237,427 20 $107,378 18 $174,829 1 $61,520 APPLICATIONS WITHDRAWN 1 $116,960 49 $246,217 58 $249,521 5 $233,584 13 $190,181 0 $0 FILES CLOSED FOR INCOMPLETENESS 0 $0 6 $331,857 19 $360,147 1 $86,210 2 $231,965 0 $0
Aggregated Statistics For Year 2006(Based on 5 partial tracts) A) FHA, FSA/RHS & VA B) Conventional C) Refinancings D) Home Improvement Loans F) Non-occupant Loans on G) Loans On Manufactured Number Average Value Number Average Value Number Average Value Number Average Value Number Average Value Number Average Value
LOANS ORIGINATED 14 $135,631 627 $172,904 238 $209,370 15 $142,703 163 $149,861 0 $0 APPLICATIONS APPROVED, NOT ACCEPTED 1 $192,970 57 $161,827 46 $176,467 5 $55,372 15 $121,109 0 $0 APPLICATIONS DENIED 3 $147,503 68 $169,906 108 $182,769 13 $92,517 16 $184,395 2 $101,375 APPLICATIONS WITHDRAWN 1 $204,190 55 $214,869 56 $227,644 4 $52,148 20 $174,976 0 $0 FILES CLOSED FOR INCOMPLETENESS 0 $0 10 $184,190 24 $193,808 1 $86,780 2 $192,650 0 $0
Aggregated Statistics For Year 2005(Based on 5 partial tracts) A) FHA, FSA/RHS & VA B) Conventional C) Refinancings D) Home Improvement Loans E) Loans on Dwellings For 5+ Families F) Non-occupant Loans on G) Loans On Manufactured Number Average Value Number Average Value Number Average Value Number Average Value Number Average Value Number Average Value Number Average Value
LOANS ORIGINATED 31 $143,643 634 $164,223 262 $220,366 19 $139,415 1 $6,102,000 128 $149,443 0 $0 APPLICATIONS APPROVED, NOT ACCEPTED 1 $150,920 47 $192,209 36 $190,535 4 $42,262 0 $0 11 $149,670 0 $0 APPLICATIONS DENIED 2 $132,040 60 $177,678 111 $181,405 13 $52,965 0 $0 16 $145,569 2 $114,755 APPLICATIONS WITHDRAWN 1 $153,040 58 $170,971 56 $185,255 5 $131,520 0 $0 14 $177,061 1 $173,630 FILES CLOSED FOR INCOMPLETENESS 0 $0 13 $157,320 23 $228,273 1 $396,180 0 $0 2 $222,090 0 $0
Aggregated Statistics For Year 2004(Based on 5 partial tracts) A) FHA, FSA/RHS & VA B) Conventional C) Refinancings D) Home Improvement Loans E) Loans on Dwellings For 5+ Families F) Non-occupant Loans on G) Loans On Manufactured Number Average Value Number Average Value Number Average Value Number Average Value Number Average Value Number Average Value Number Average Value
LOANS ORIGINATED 34 $134,929 473 $179,621 255 $207,565 8 $74,456 1 $3,843,980 104 $136,417 0 $0 APPLICATIONS APPROVED, NOT ACCEPTED 0 $0 36 $208,734 35 $174,026 4 $51,920 0 $0 9 $164,300 0 $0 APPLICATIONS DENIED 3 $113,767 54 $182,408 93 $167,817 8 $91,431 0 $0 11 $199,132 1 $76,660 APPLICATIONS WITHDRAWN 2 $124,320 49 $192,841 50 $204,598 3 $140,353 0 $0 8 $157,111 0 $0 FILES CLOSED FOR INCOMPLETENESS 1 $79,210 11 $207,867 18 $175,819 1 $64,450 0 $0 2 $138,395 0 $0
Aggregated Statistics For Year 2003(Based on 5 partial tracts) A) FHA, FSA/RHS & VA B) Conventional C) Refinancings D) Home Improvement Loans F) Non-occupant Loans on Number Average Value Number Average Value Number Average Value Number Average Value Number Average Value
LOANS ORIGINATED 35 $132,599 362 $181,897 664 $210,731 10 $59,196 75 $132,625 APPLICATIONS APPROVED, NOT ACCEPTED 1 $128,300 34 $187,858 56 $197,017 2 $100,890 8 $139,044 APPLICATIONS DENIED 3 $130,567 43 $182,230 106 $188,302 7 $77,029 9 $170,456 APPLICATIONS WITHDRAWN 6 $133,178 42 $182,583 70 $205,477 1 $67,190 9 $120,981 FILES CLOSED FOR INCOMPLETENESS 1 $101,890 7 $237,131 18 $223,292 0 $0 0 $0
Aggregated Statistics For Year 1999(Based on 3 partial tracts) A) FHA, FSA/RHS & VA B) Conventional C) Refinancings D) Home Improvement Loans F) Non-occupant Loans on Number Average Value Number Average Value Number Average Value Number Average Value Number Average Value
LOANS ORIGINATED 7 $139,737 204 $194,007 119 $219,994 9 $90,543 29 $146,746 APPLICATIONS APPROVED, NOT ACCEPTED 0 $0 15 $153,909 17 $161,937 1 $20,900 4 $121,408 APPLICATIONS DENIED 1 $79,280 25 $139,938 28 $186,809 3 $47,297 4 $163,955 APPLICATIONS WITHDRAWN 2 $147,100 17 $190,471 19 $183,577 1 $261,820 2 $152,430 FILES CLOSED FOR INCOMPLETENESS 0 $0 6 $208,787 5 $127,994 0 $0 1 $199,110
Detailed HMDA statistics for the following Tracts:
0062.03
, 0062.04 , 0062.05 , 0064.02
Private Mortgage Insurance Companies Aggregated Statistics For Year 2009(Based on 5 partial tracts) A) Conventional B) Refinancings C) Non-occupant Loans on Number Average Value Number Average Value Number Average Value
LOANS ORIGINATED 18 $216,499 15 $200,600 1 $111,760 APPLICATIONS APPROVED, NOT ACCEPTED 2 $261,510 8 $185,304 0 $0 APPLICATIONS DENIED 0 $0 5 $225,182 0 $0 APPLICATIONS WITHDRAWN 0 $0 2 $211,700 0 $0 FILES CLOSED FOR INCOMPLETENESS 1 $114,700 1 $156,620 0 $0
Aggregated Statistics For Year 2008(Based on 5 partial tracts) A) Conventional B) Refinancings C) Non-occupant Loans on Number Average Value Number Average Value Number Average Value
LOANS ORIGINATED 67 $203,951 23 $225,110 9 $157,108 APPLICATIONS APPROVED, NOT ACCEPTED 16 $222,612 8 $204,125 2 $176,245 APPLICATIONS DENIED 3 $180,757 1 $386,750 2 $174,360 APPLICATIONS WITHDRAWN 3 $283,433 1 $357,510 0 $0 FILES CLOSED FOR INCOMPLETENESS 1 $312,190 1 $209,700 0 $0
Aggregated Statistics For Year 2007(Based on 5 partial tracts) A) Conventional B) Refinancings C) Non-occupant Loans on Number Average Value Number Average Value Number Average Value
LOANS ORIGINATED 96 $199,546 25 $220,844 13 $196,065 APPLICATIONS APPROVED, NOT ACCEPTED 8 $229,425 6 $178,807 3 $252,460 APPLICATIONS DENIED 2 $246,275 1 $281,730 1 $210,450 APPLICATIONS WITHDRAWN 4 $242,642 3 $175,203 1 $134,460 FILES CLOSED FOR INCOMPLETENESS 1 $114,320 1 $138,090 0 $0
Aggregated Statistics For Year 2006(Based on 5 partial tracts) A) Conventional B) Refinancings C) Non-occupant Loans on Number Average Value Number Average Value Number Average Value
LOANS ORIGINATED 45 $176,177 14 $215,702 8 $165,164 APPLICATIONS APPROVED, NOT ACCEPTED 9 $196,399 2 $210,190 2 $164,330 APPLICATIONS DENIED 0 $0 2 $149,170 0 $0 APPLICATIONS WITHDRAWN 2 $143,025 1 $106,400 1 $111,410 FILES CLOSED FOR INCOMPLETENESS 0 $0 0 $0 0 $0
Aggregated Statistics For Year 2005(Based on 5 partial tracts) A) Conventional B) Refinancings C) Non-occupant Loans on Number Average Value Number Average Value Number Average Value
LOANS ORIGINATED 52 $164,546 16 $175,579 13 $161,382 APPLICATIONS APPROVED, NOT ACCEPTED 5 $174,042 6 $197,120 1 $228,220 APPLICATIONS DENIED 2 $122,005 1 $92,120 2 $108,500 APPLICATIONS WITHDRAWN 2 $191,380 1 $256,470 1 $192,950 FILES CLOSED FOR INCOMPLETENESS 1 $117,960 0 $0 0 $0
Aggregated Statistics For Year 2004(Based on 5 partial tracts) A) Conventional B) Refinancings C) Non-occupant Loans on Number Average Value Number Average Value Number Average Value
LOANS ORIGINATED 43 $176,723 16 $164,655 9 $146,339 APPLICATIONS APPROVED, NOT ACCEPTED 10 $180,437 5 $176,006 3 $179,197 APPLICATIONS DENIED 1 $225,260 1 $88,340 0 $0 APPLICATIONS WITHDRAWN 2 $243,565 1 $134,670 0 $0 FILES CLOSED FOR INCOMPLETENESS 0 $0 0 $0 0 $0
Aggregated Statistics For Year 2003(Based on 5 partial tracts) A) Conventional B) Refinancings C) Non-occupant Loans on Number Average Value Number Average Value Number Average Value
LOANS ORIGINATED 72 $185,912 68 $164,336 8 $128,416 APPLICATIONS APPROVED, NOT ACCEPTED 9 $179,136 16 $177,368 1 $180,030 APPLICATIONS DENIED 1 $397,630 1 $193,850 0 $0 APPLICATIONS WITHDRAWN 4 $203,468 3 $181,530 0 $0 FILES CLOSED FOR INCOMPLETENESS 0 $0 1 $147,520 0 $0
Aggregated Statistics For Year 1999(Based on 3 partial tracts) A) Conventional B) Refinancings C) Non-occupant Loans on Number Average Value Number Average Value Number Average Value
LOANS ORIGINATED 56 $174,791 9 $176,349 3 $154,777 APPLICATIONS APPROVED, NOT ACCEPTED 5 $240,672 2 $190,900 0 $0 APPLICATIONS DENIED 3 $183,187 1 $230,630 0 $0 APPLICATIONS WITHDRAWN 2 $185,940 0 $0 0 $0 FILES CLOSED FOR INCOMPLETENESS 1 $64,550 0 $0 0 $0
Detailed PMIC statistics for the following Tracts:
0062.03
, 0062.04 , 0062.05 , 0064.02
Most common first names in Cornelius, NC among deceased individuals Name Count Lived (average)
James 47 75.6 years John 39 76.3 years William 36 73.2 years Mary 35 77.5 years Robert 22 71.4 years Ruth 16 77.5 years Margaret 15 80.3 years Thomas 15 75.5 years Richard 13 70.8 years Doris 12 77.1 years
Most common last names in Cornelius, NC among deceased individuals Last name Count Lived (average)
Brown 28 78.1 years Sherrill 21 77.9 years Caldwell 18 81.3 years Washam 18 82.7 years Davis 18 71.5 years Torrence 17 77.3 years Mayhew 17 77.7 years Smith 15 78.1 years Bailey 13 78.7 years Howard 12 74.7 years
Cornelius compared to North Carolina state average:
Median household income above state average. Median house value above state average. Unemployed percentage significantly below state average. Median age below state average. Foreign-born population percentage significantly above state average. Length of stay since moving in below state average. House age significantly below state average. Number of college students above state average. Percentage of population with a bachelor's degree or higher significantly above state average.
#71 on the list of "Top 101 cities with the most residents born in Other Northern Europe (population 500+)"
#72 on the list of "Top 101 cities with the largest percentage population increase from 2000 (population 5,000+)"
#84 on the list of "Top 101 cities with largest percentage of males in industries: finance and insurance (population 5,000+)"
#84 on the list of "Top 101 cities with largest percentage of females in industries: utilities (population 5,000+)"
#47 (28036) on the list of "Top 101 zip codes with the largest percentage of Scottish first ancestries (pop 5,000+)"
#9 on the list of "Top 101 counties with the most Mainline Protestant adherents"
#24 on the list of "Top 101 counties with the most Evangelical Protestant adherents"
#26 on the list of "Top 101 counties with the most Mainline Protestant congregations"
#30 on the list of "Top 101 counties with the most Orthodox adherents"
#31 on the list of "Top 101 counties with the most Evangelical Protestant congregations"
Top Patent Applicants
Eric Mcconnell (16)
Jeffrey B. Shealy (12)
Michael W. Detwiler (9)
Joseph F. Pinzone (8)
Matthew Spalding (7)
John S. Philbrook (6)
Chanwa Nguy (6)
James M. Mcclelland, Jr. (6)
David E. Sugg (6)
Daniel R. Llop (5)
Total of 338 patent applications in 2008-2024.

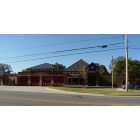


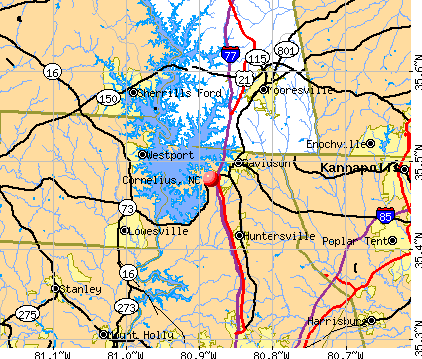


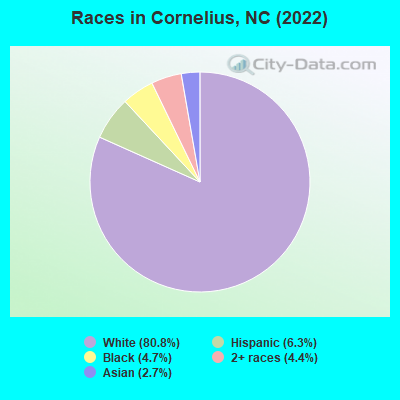
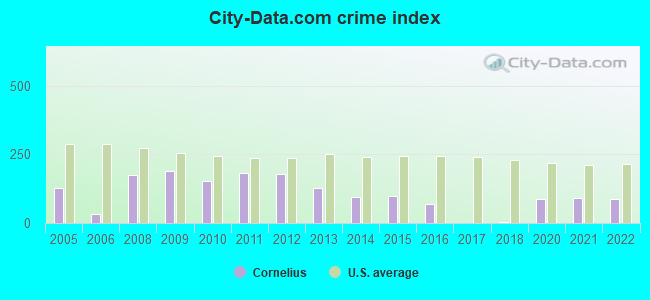
 Recent articles from our blog. Our writers, many of them Ph.D. graduates or candidates, create easy-to-read articles on a wide variety of topics.

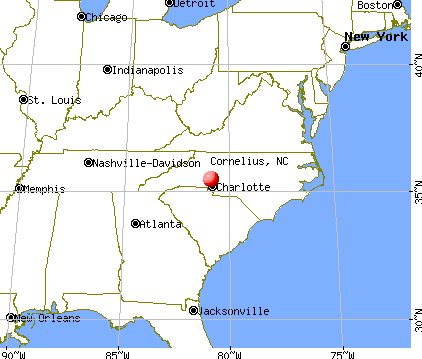
 (16.8 miles
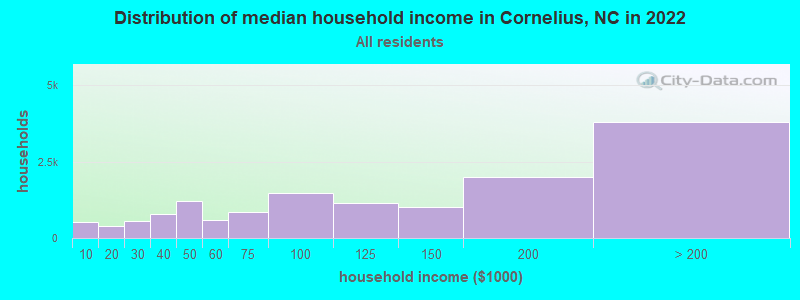
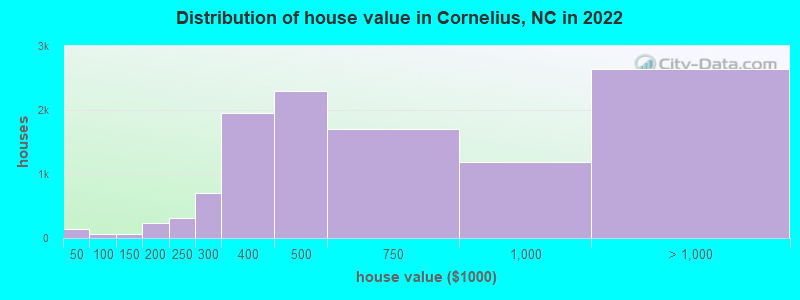
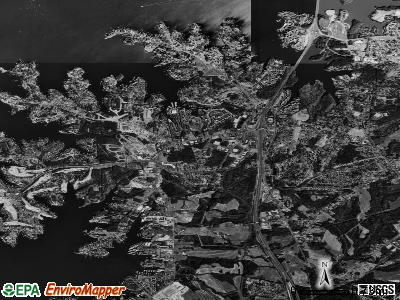
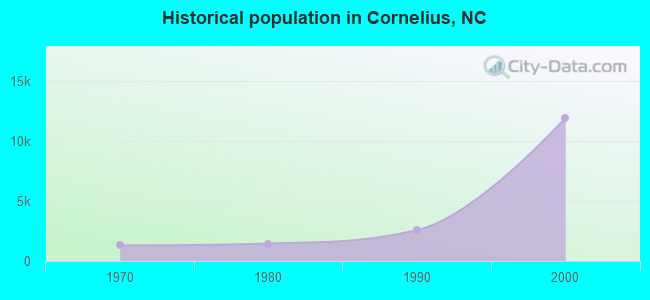
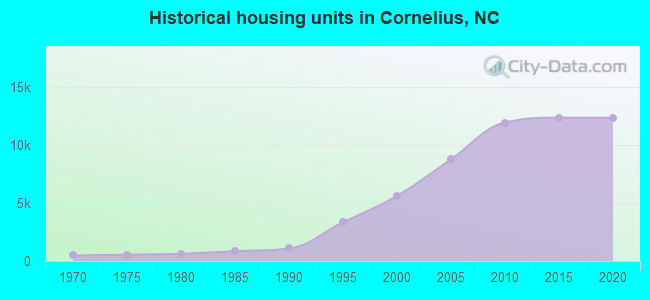
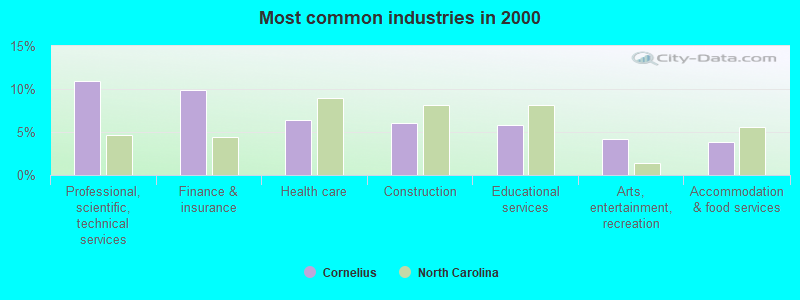
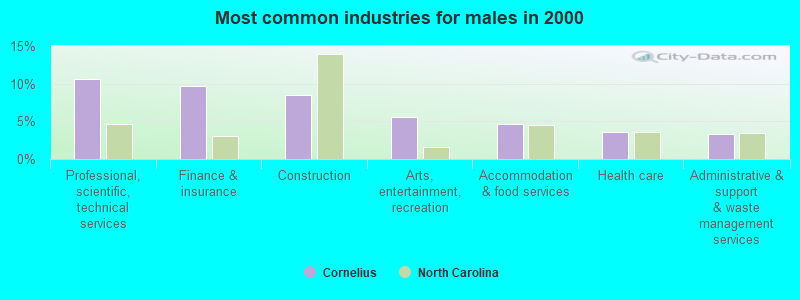
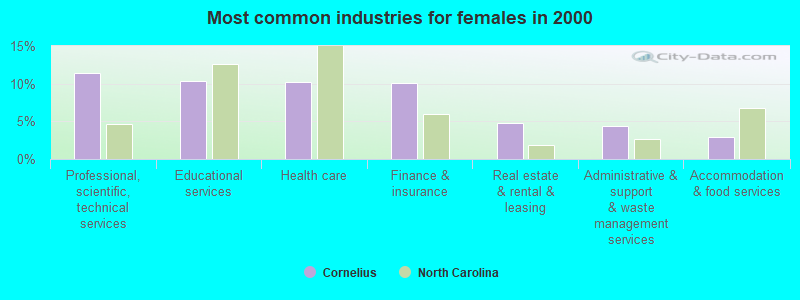
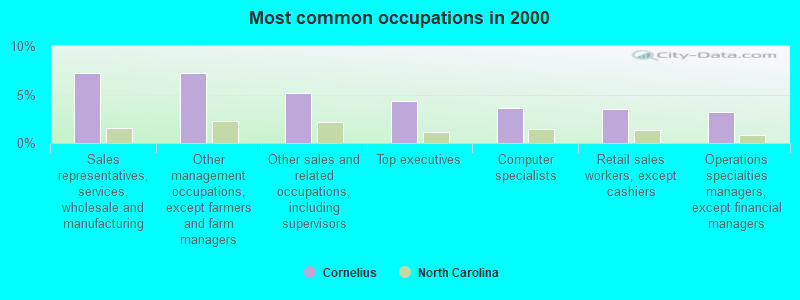
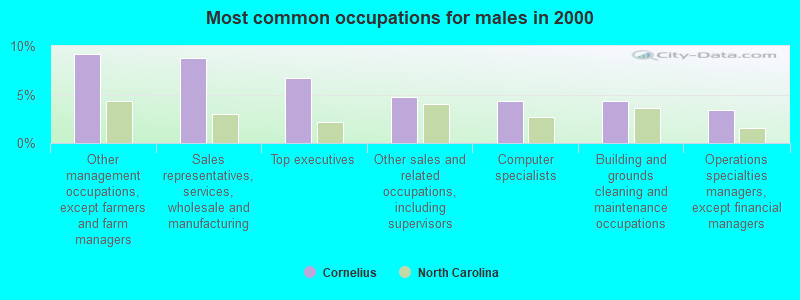
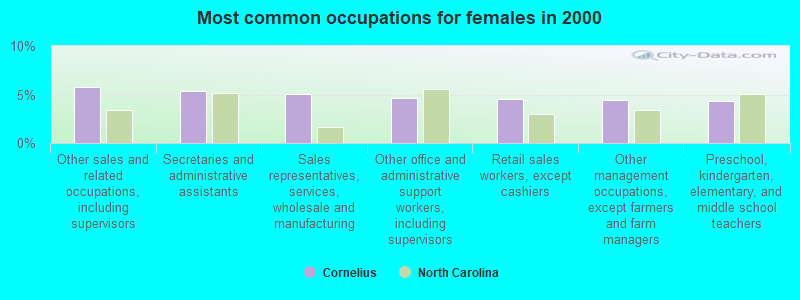
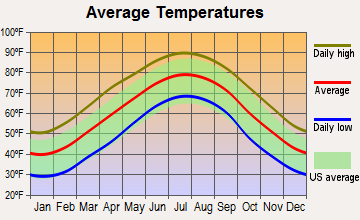
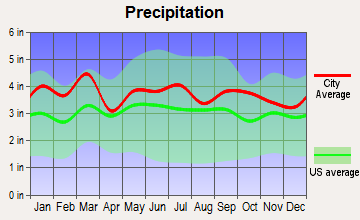
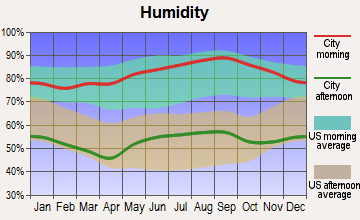
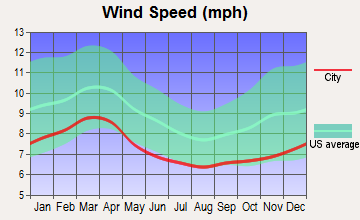

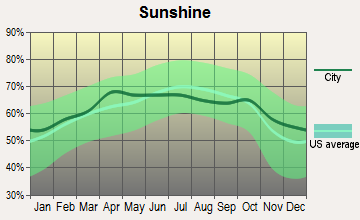
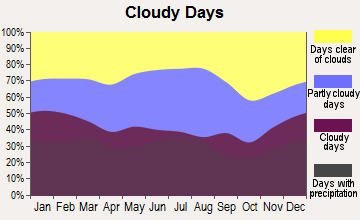
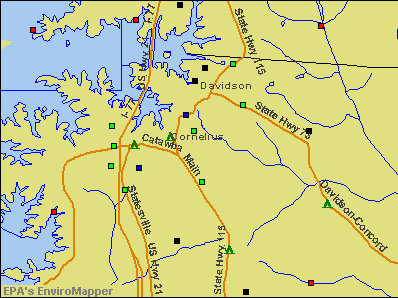

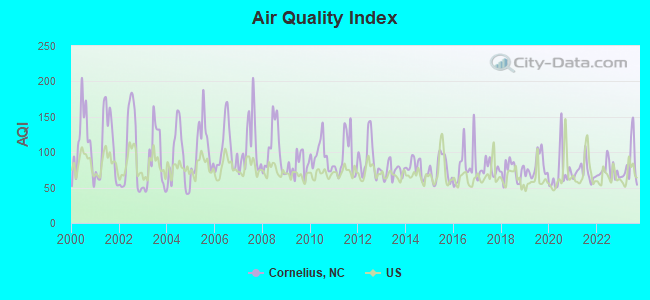
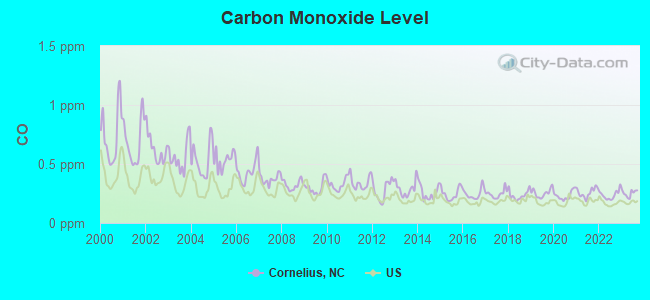
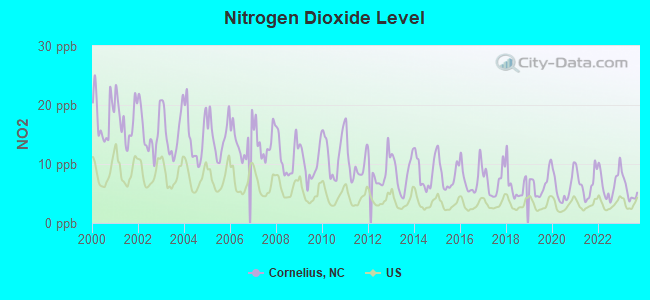
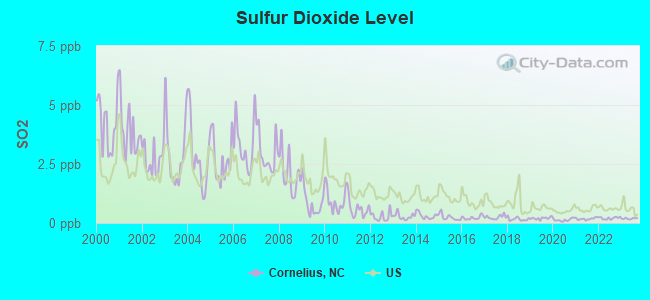
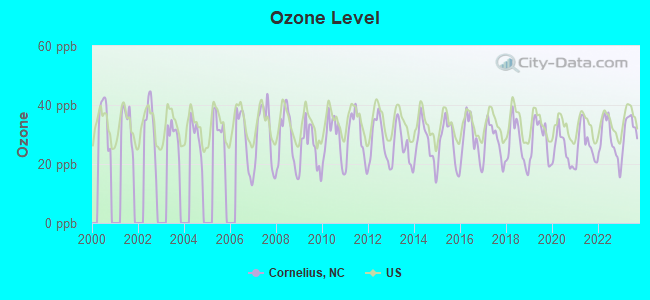
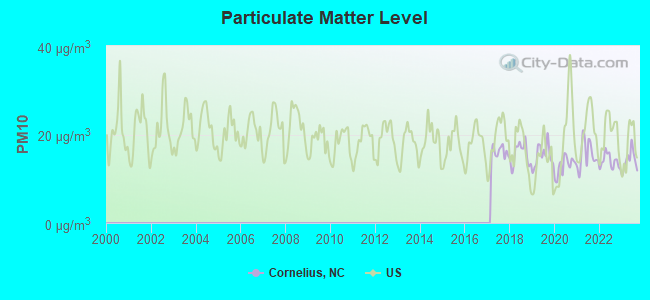
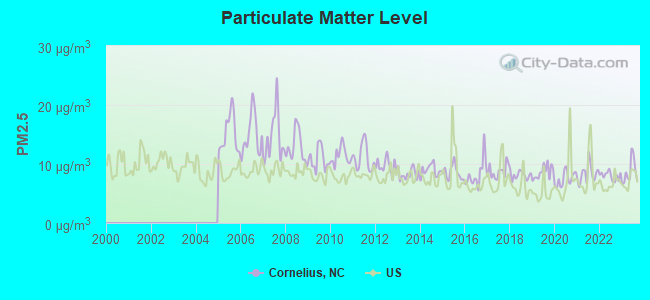
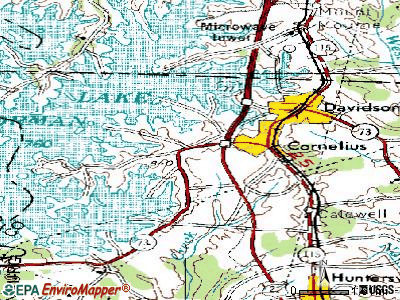
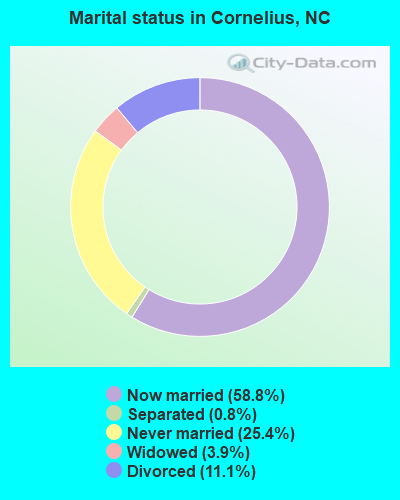
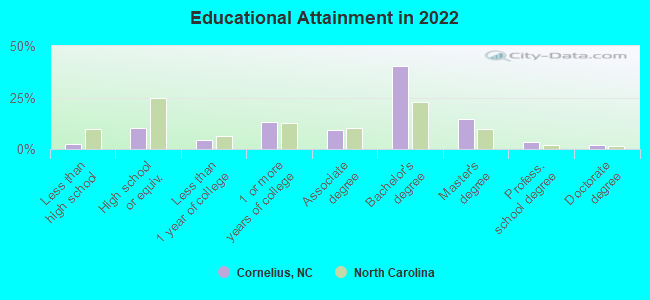
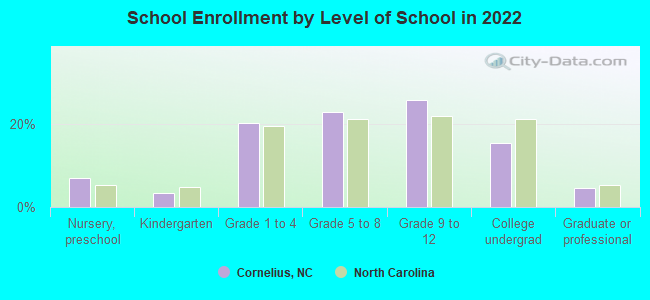
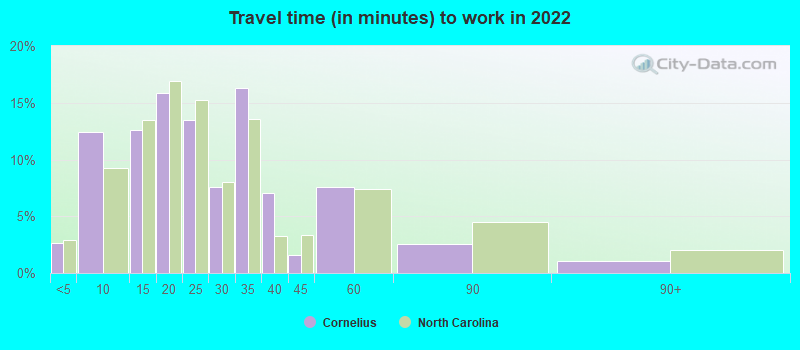
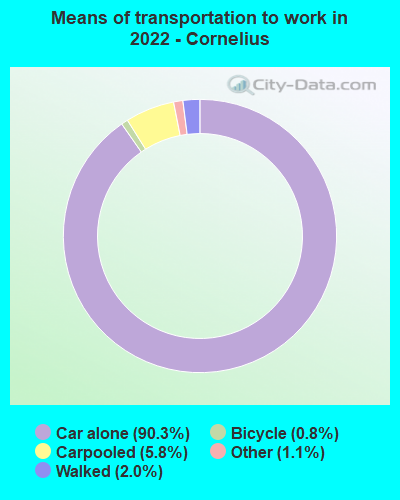
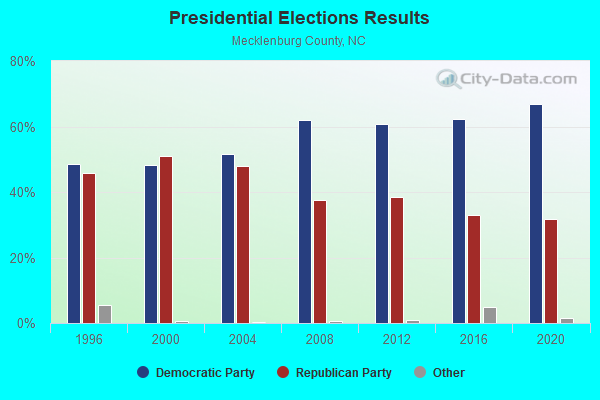
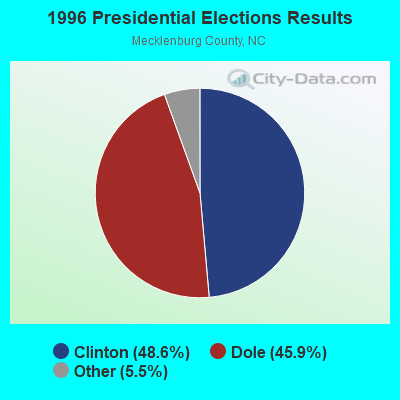
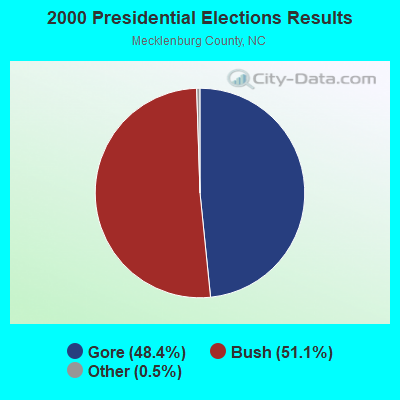
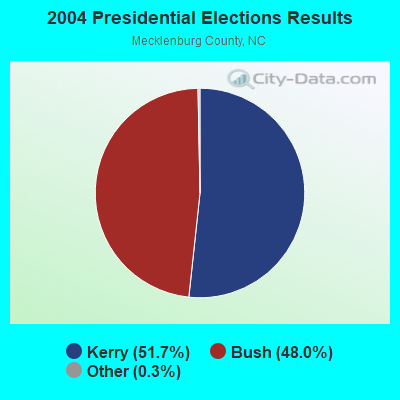
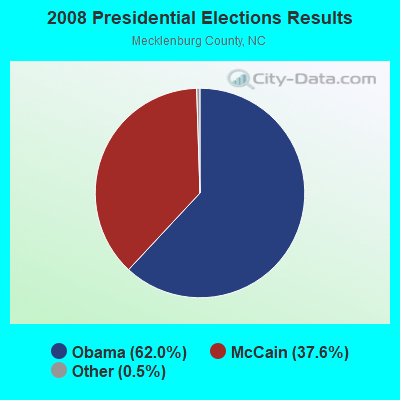
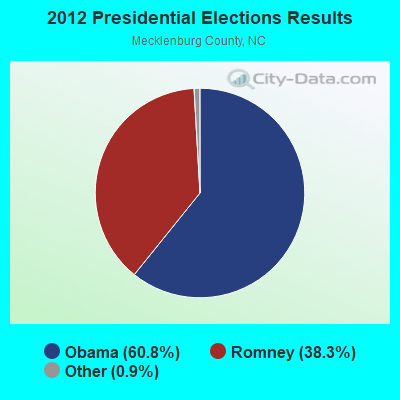
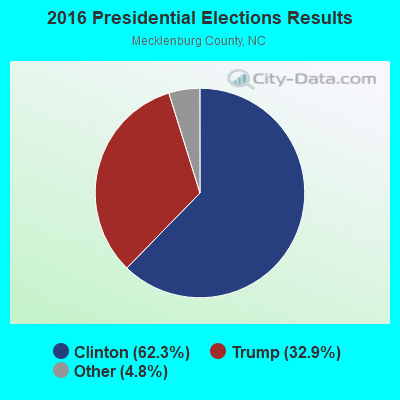
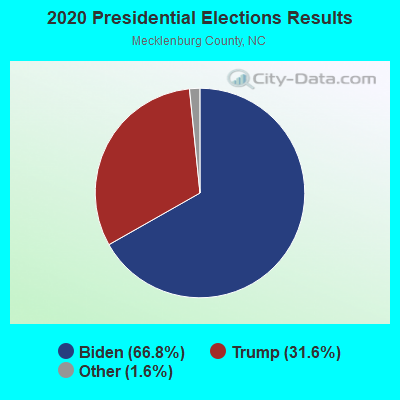
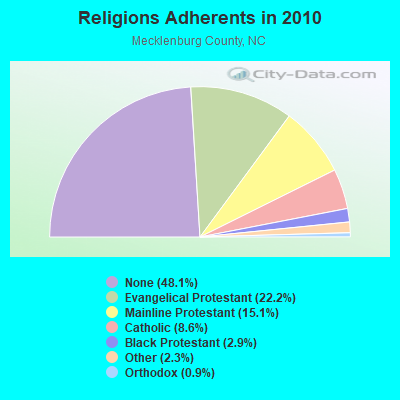
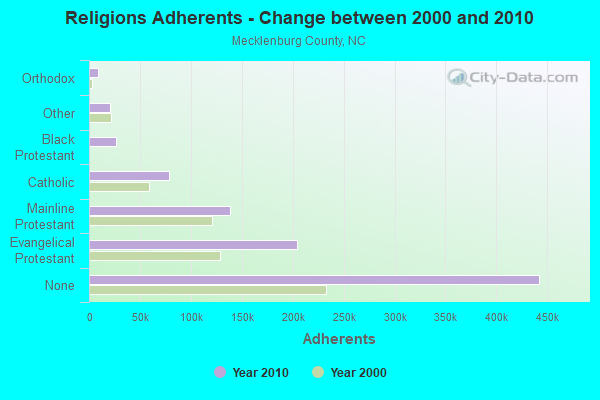
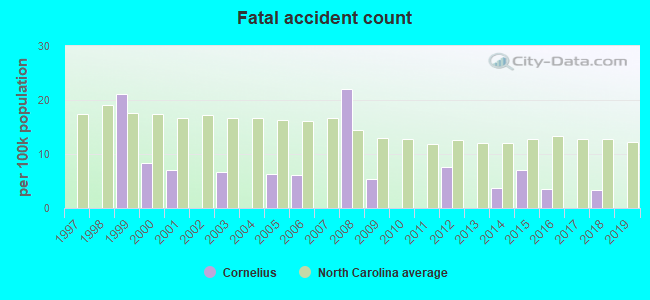
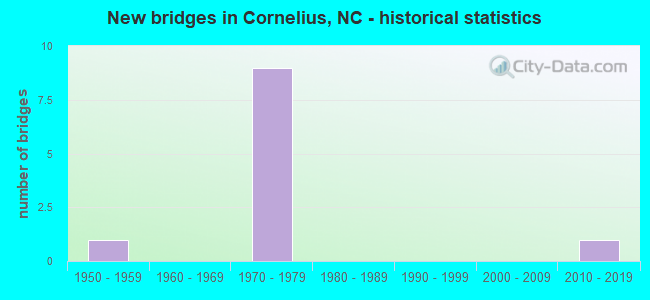
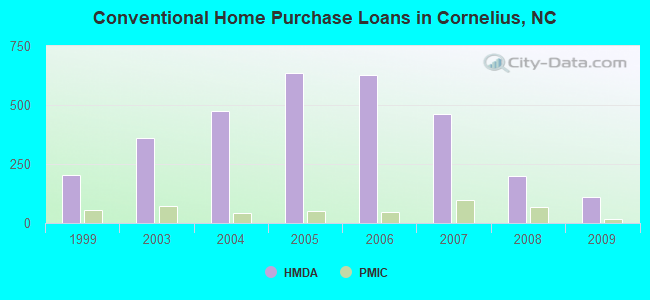
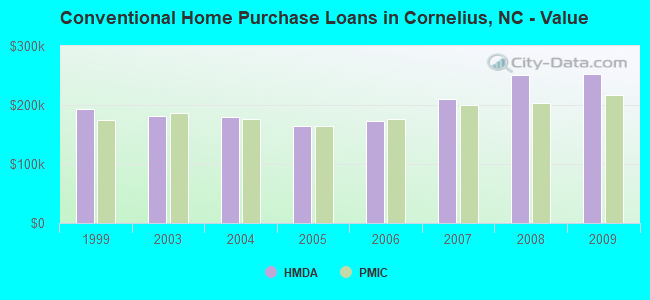
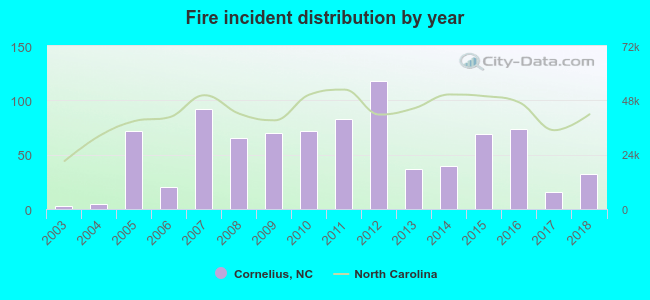 According to the data from the years 2003 - 2018 the average number of fires per year is 54. The highest number of reported fire incidents - 118 took place in 2012, and the least - 3 in 2003. The data has a growing trend.
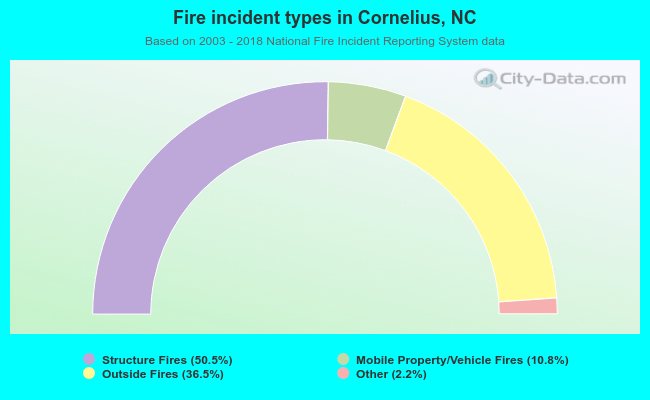 When looking into fire subcategories, the most reports belonged to: Structure Fires (50.5%), and Outside Fires (36.5%).