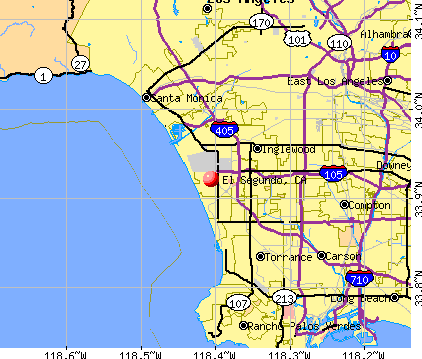
El Segundo, California
El Segundo: on photo
El Segundo: on photo
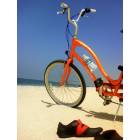
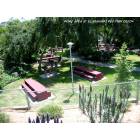
El Segundo: Biking along the coast .....Summer 08
El Segundo: on photo
El Segundo: on photo
El Segundo: on photo
El Segundo: on photo
El Segundo: on photo
El Segundo: on photo
El Segundo: on photo
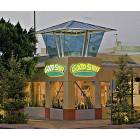
El Segundo: Good Stuff Restuarant located on the corner of Grand Ave and Richmond ST
- see
16
more - add
your
Submit your own pictures of this city and show them to the world
- OSM Map
- General Map
- Google Map
- MSN Map
Population change since 2000: +3.7%
 |
| Males: 8,421 | |
| Females: 8,201 |
| Median resident age: | 37.2 years |
| California median age: | 37.9 years |
Zip codes: 90245.
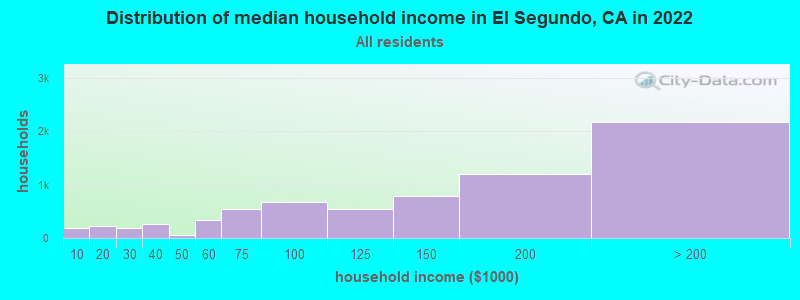
| El Segundo: | $141,066 |
| CA: | $91,551 |
Estimated per capita income in 2022: $77,241 (it was $33,996 in 2000)
El Segundo city income, earnings, and wages data
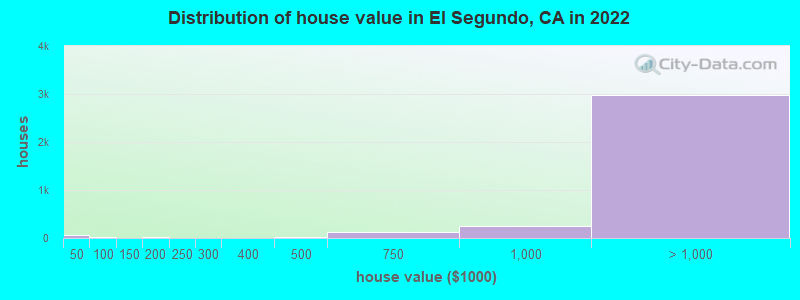
Estimated median house or condo value in 2022: over $1,000,000 (it was $357,800 in 2000)
| El Segundo: | over $1,000,000 |
| CA: | $715,900 |
Mean prices in 2022: all housing units: over $1,000,000; detached houses: over $1,000,000; townhouses or other attached units: $750,854; in 2-unit structures: over $1,000,000; in 3-to-4-unit structures: $791,642; in 5-or-more-unit structures: $738,503; mobile homes: $205,184; occupied boats, rvs, vans, etc.: $276,239
Median gross rent in 2022: $2,476.
(4.8% for White Non-Hispanic residents, 9.7% for Black residents, 4.5% for Hispanic or Latino residents, 8.6% for American Indian residents, 20.2% for other race residents, 3.4% for two or more races residents)
Detailed information about poverty and poor residents in El Segundo, CA


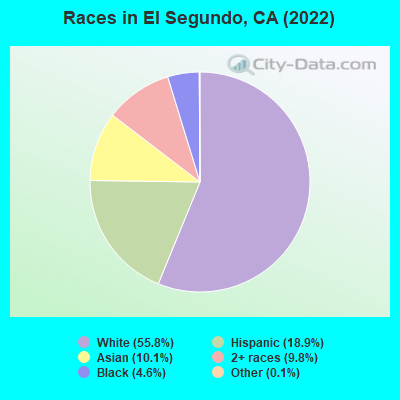
- 9,32655.8%White alone
- 3,15918.9%Hispanic
- 1,69010.1%Asian alone
- 1,6459.8%Two or more races
- 7734.6%Black alone
- 190.1%Other race alone
- 80.05%American Indian alone
According to our research of California and other state lists, there were 10 registered sex offenders living in El Segundo, California as of April 27, 2024.
The ratio of all residents to sex offenders in El Segundo is 1,704 to 1.
The ratio of registered sex offenders to all residents in this city is lower than the state average.
Type |
2009 |
2010 |
2011 |
2012 |
2013 |
2014 |
2015 |
2016 |
2017 |
2018 |
2019 |
2020 |
2021 |
2022 |
|---|---|---|---|---|---|---|---|---|---|---|---|---|---|---|
| Murders (per 100,000) | 0 (0.0) | 0 (0.0) | 0 (0.0) | 0 (0.0) | 0 (0.0) | 0 (0.0) | 1 (5.8) | 0 (0.0) | 1 (5.9) | 0 (0.0) | 0 (0.0) | 0 (0.0) | 0 (0.0) | 1 (6.0) |
| Rapes (per 100,000) | 4 (24.6) | 5 (30.0) | 4 (23.7) | 1 (5.9) | 0 (0.0) | 4 (23.5) | 1 (5.8) | 4 (23.4) | 4 (23.6) | 11 (65.2) | 5 (29.9) | 11 (66.2) | 4 (24.6) | 8 (48.3) |
| Robberies (per 100,000) | 17 (104.7) | 17 (102.1) | 15 (89.0) | 15 (88.6) | 19 (112.4) | 15 (88.3) | 22 (128.2) | 25 (146.1) | 21 (124.0) | 22 (130.3) | 30 (179.4) | 31 (186.7) | 25 (153.8) | 43 (259.8) |
| Assaults (per 100,000) | 15 (92.4) | 12 (72.1) | 19 (112.8) | 22 (129.9) | 18 (106.4) | 29 (170.7) | 17 (99.0) | 24 (140.2) | 14 (82.7) | 29 (171.8) | 47 (281.0) | 72 (433.6) | 73 (449.1) | 65 (392.7) |
| Burglaries (per 100,000) | 208 (1,281) | 141 (846.6) | 161 (955.5) | 156 (921.4) | 143 (845.6) | 161 (947.6) | 147 (856.4) | 186 (1,087) | 183 (1,081) | 202 (1,197) | 164 (980.5) | 172 (1,036) | 223 (1,372) | 293 (1,770) |
| Thefts (per 100,000) | 462 (2,846) | 360 (2,162) | 338 (2,006) | 389 (2,298) | 343 (2,028) | 305 (1,795) | 426 (2,482) | 472 (2,758) | 423 (2,498) | 448 (2,654) | 387 (2,314) | 446 (2,686) | 336 (2,067) | 460 (2,779) |
| Auto thefts (per 100,000) | 49 (301.8) | 40 (240.2) | 51 (302.7) | 50 (295.3) | 52 (307.5) | 72 (423.8) | 48 (279.7) | 73 (426.6) | 81 (478.4) | 64 (379.1) | 74 (442.4) | 157 (945.5) | 137 (842.9) | 144 (870.1) |
| Arson (per 100,000) | 1 (6.2) | 2 (12.0) | 1 (5.9) | 5 (29.5) | 6 (35.5) | 12 (70.6) | 2 (11.7) | 3 (17.5) | 0 (0.0) | 3 (17.8) | 1 (6.0) | 1 (6.0) | 7 (43.1) | 2 (12.1) |
| City-Data.com crime index | 297.3 | 234.0 | 239.6 | 237.3 | 219.9 | 251.5 | 256.2 | 311.1 | 298.3 | 345.8 | 330.5 | 451.3 | 401.8 | 512.0 |
The City-Data.com crime index weighs serious crimes and violent crimes more heavily. Higher means more crime, U.S. average is 246.1. It adjusts for the number of visitors and daily workers commuting into cities.

Crime rate in El Segundo detailed stats: murders, rapes, robberies, assaults, burglaries, thefts, arson
Full-time law enforcement employees in 2021, including police officers: 75 (56 officers - 51 male; 5 female).
| Officers per 1,000 residents here: | 3.45 |
| California average: | 2.30 |
 Recent articles from our blog. Our writers, many of them Ph.D. graduates or candidates, create easy-to-read articles on a wide variety of topics.

 | Sanford and Son and El Segundo (35 replies) |
| El Segundo Living (8 replies) |
| Why does El Segundo USD accept so many intradistrict transfer students? (7 replies) |
| Safe area between West El Segundo and South Vermont Avenue? (3 replies) |
| Possible to find a place to live if work in Alhambra & El Segundo? (2 replies) |
| Feasible Commutes To El Segundo (10 replies) |
Latest news from El Segundo, CA collected exclusively by city-data.com from local newspapers, TV, and radio stations
Ancestries: European (7.0%), Italian (6.6%), English (5.9%), American (5.6%), German (5.6%), Irish (4.7%).
Current Local Time: PST time zone
Elevation: 100 feet
Land area: 5.54 square miles.
Population density: 3,001 people per square mile (average).
1,996 residents are foreign born (5.9% Asia, 2.9% Latin America, 2.4% Europe).
| This city: | 11.9% |
| California: | 26.5% |
Median real estate property taxes paid for housing units with mortgages in 2022: $10,126 (0.6%)
Median real estate property taxes paid for housing units with no mortgage in 2022: $4,327 (0.3%)
Nearest city with pop. 50,000+: South Bay Cities, CA  (3.0 miles , pop. 131,712).
Nearest city with pop. 200,000+: Los Angeles, CA (11.5 miles , pop. 3,694,820).
Nearest cities:
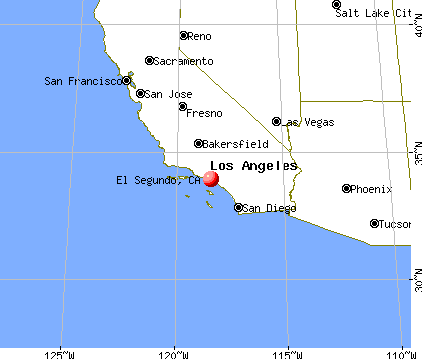
), ), Latitude: 33.92 N, Longitude: 118.41 W
Daytime population change due to commuting: +49,401 (+295.6%)
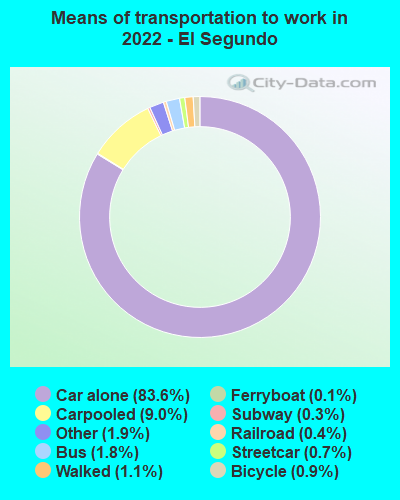
Workers who live and work in this city: 4,653 (47.2%)
Area code: 310
Property values in El Segundo, CA
El Segundo tourist attractions:
El Segundo, California accommodation & food services, waste management - Economy and Business Data
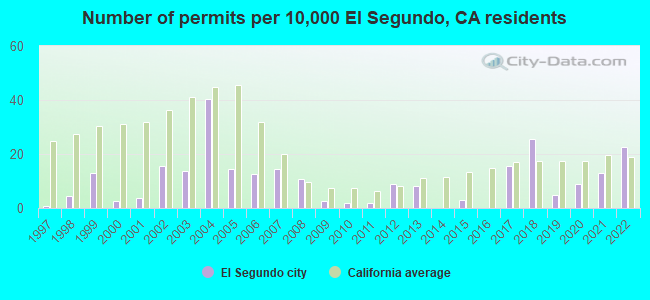
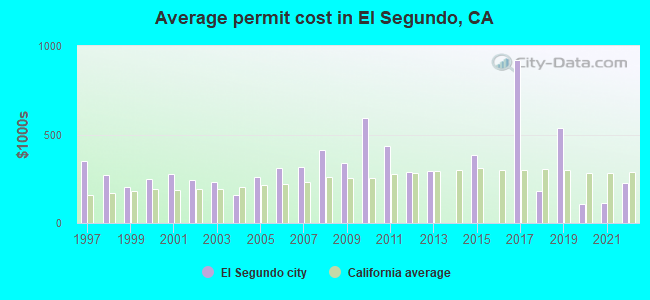
Single-family new house construction building permits:
- 2022: 36 buildings, average cost: $227,500
- 2021: 21 buildings, average cost: $114,100
- 2020: 14 buildings, average cost: $109,500
- 2019: 8 buildings, average cost: $536,300
- 2018: 41 buildings, average cost: $181,800
- 2017: 25 buildings, average cost: $918,500
- 2015: 5 buildings, average cost: $385,200
- 2013: 13 buildings, average cost: $292,300
- 2012: 14 buildings, average cost: $289,500
- 2011: 3 buildings, average cost: $433,300
- 2010: 3 buildings, average cost: $594,500
- 2009: 4 buildings, average cost: $341,000
- 2008: 17 buildings, average cost: $415,300
- 2007: 23 buildings, average cost: $316,300
- 2006: 20 buildings, average cost: $311,200
- 2005: 23 buildings, average cost: $257,900
- 2004: 65 buildings, average cost: $161,100
- 2003: 22 buildings, average cost: $228,500
- 2002: 25 buildings, average cost: $241,600
- 2001: 6 buildings, average cost: $274,500
- 2000: 4 buildings, average cost: $248,900
- 1999: 21 buildings, average cost: $203,900
- 1998: 7 buildings, average cost: $274,200
- 1997: 1 building, cost: $350,000
| Here: | 5.0% |
| California: | 5.1% |
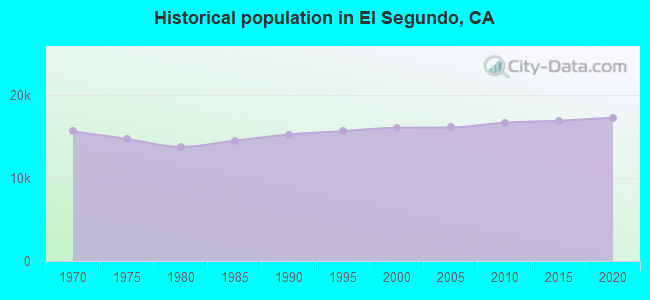

Population change in the 1990s: +398 (+2.5%).
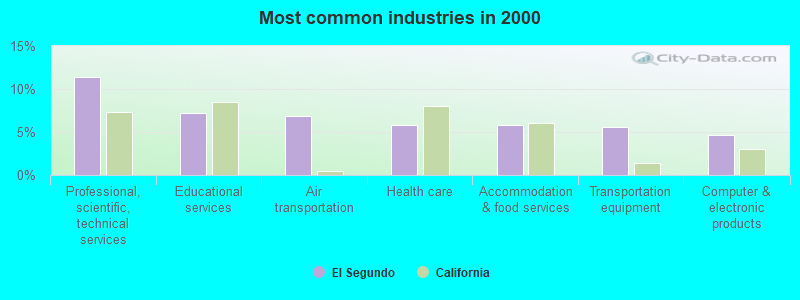
- Professional, scientific, technical services (11.4%)
- Educational services (7.2%)
- Air transportation (6.9%)
- Health care (5.8%)
- Accommodation & food services (5.8%)
- Transportation equipment (5.6%)
- Computer & electronic products (4.6%)
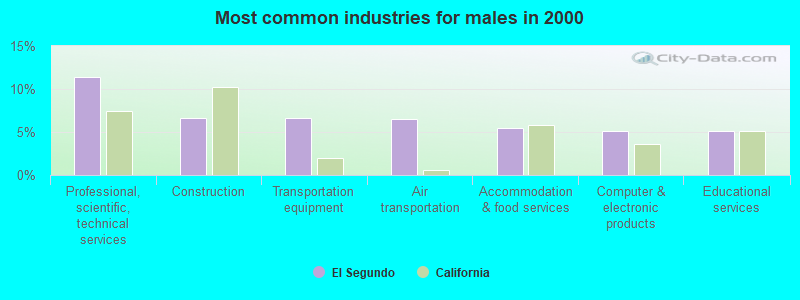
- Professional, scientific, technical services (11.4%)
- Construction (6.7%)
- Transportation equipment (6.6%)
- Air transportation (6.5%)
- Accommodation & food services (5.5%)
- Computer & electronic products (5.2%)
- Educational services (5.1%)
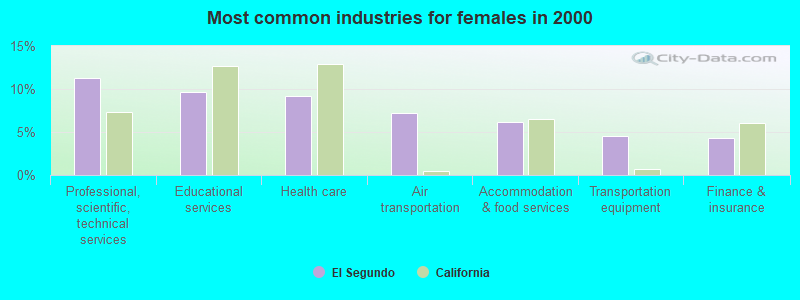
- Professional, scientific, technical services (11.3%)
- Educational services (9.6%)
- Health care (9.1%)
- Air transportation (7.2%)
- Accommodation & food services (6.1%)
- Transportation equipment (4.5%)
- Finance & insurance (4.3%)
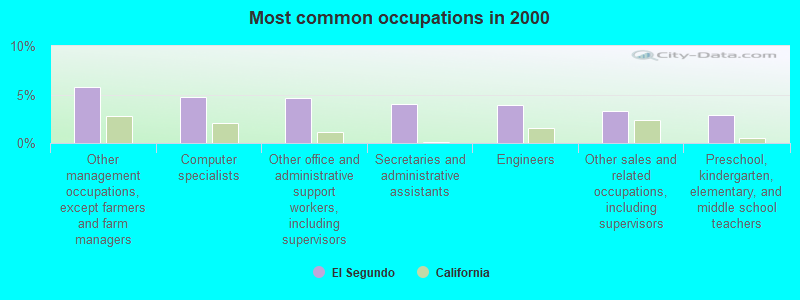
- Other management occupations, except farmers and farm managers (5.8%)
- Computer specialists (4.8%)
- Other office and administrative support workers, including supervisors (4.6%)
- Secretaries and administrative assistants (4.0%)
- Engineers (4.0%)
- Other sales and related occupations, including supervisors (3.3%)
- Preschool, kindergarten, elementary, and middle school teachers (2.9%)
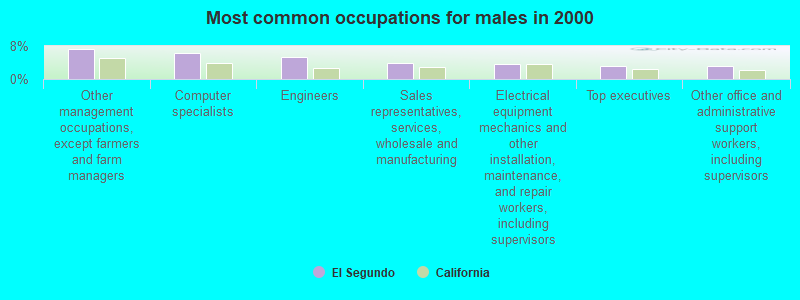
- Other management occupations, except farmers and farm managers (7.3%)
- Computer specialists (6.3%)
- Engineers (5.4%)
- Sales representatives, services, wholesale and manufacturing (3.9%)
- Electrical equipment mechanics and other installation, maintenance, and repair workers, including supervisors (3.7%)
- Top executives (3.2%)
- Other office and administrative support workers, including supervisors (3.1%)
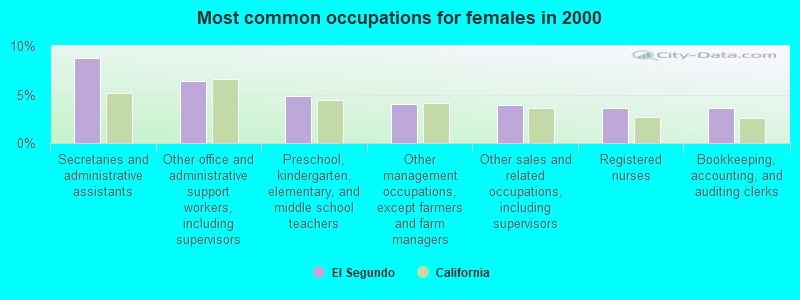
- Secretaries and administrative assistants (8.7%)
- Other office and administrative support workers, including supervisors (6.4%)
- Preschool, kindergarten, elementary, and middle school teachers (4.8%)
- Other management occupations, except farmers and farm managers (4.0%)
- Other sales and related occupations, including supervisors (3.9%)
- Registered nurses (3.6%)
- Bookkeeping, accounting, and auditing clerks (3.6%)
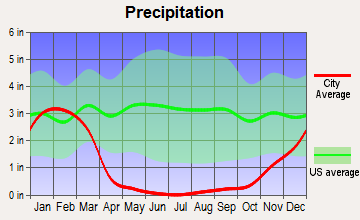
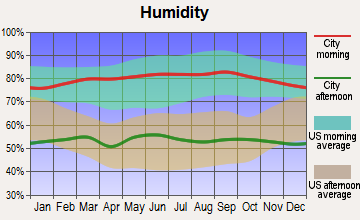
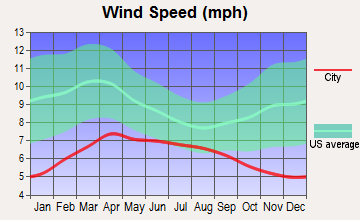
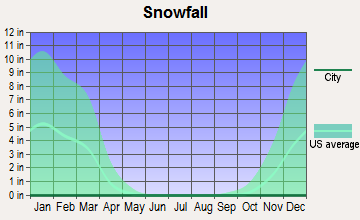
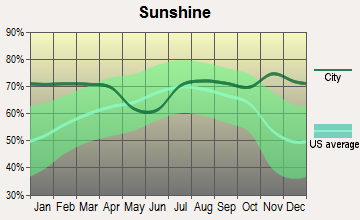
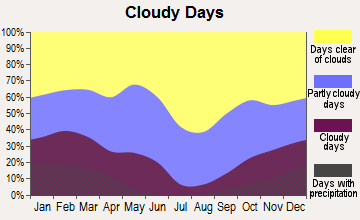
Average climate in El Segundo, California
Based on data reported by over 4,000 weather stations

|
|

(lower is better)
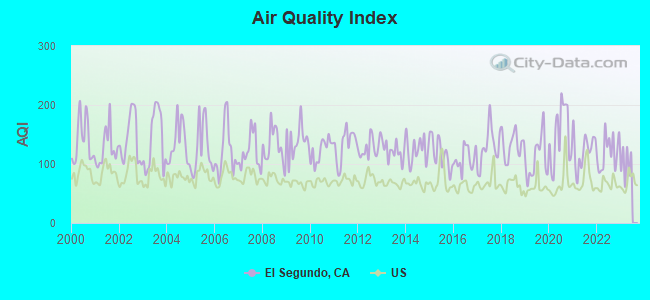
Air Quality Index (AQI) level in 2022 was 120. This is significantly worse than average.
| City: | 120 |
| U.S.: | 73 |
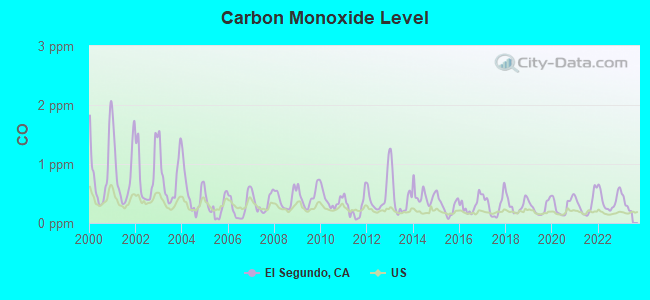
Carbon Monoxide (CO) [ppm] level in 2022 was 0.386. This is significantly worse than average. Closest monitor was 2.1 miles away from the city center.
| City: | 0.386 |
| U.S.: | 0.251 |
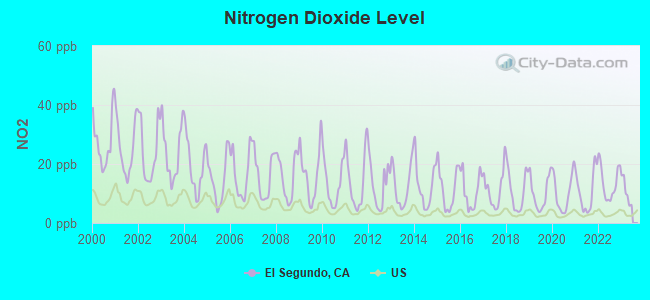
Nitrogen Dioxide (NO2) [ppb] level in 2022 was 13.6. This is significantly worse than average. Closest monitor was 2.1 miles away from the city center.
| City: | 13.6 |
| U.S.: | 5.1 |
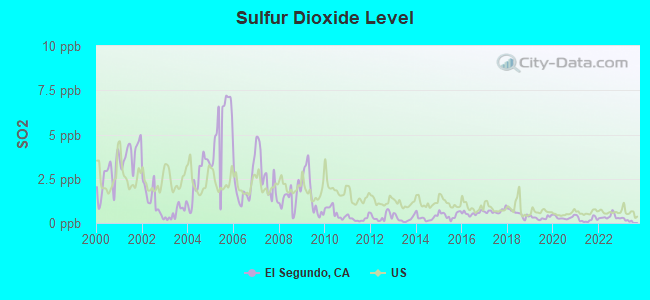
Sulfur Dioxide (SO2) [ppb] level in 2022 was 0.353. This is significantly better than average. Closest monitor was 0.1 miles away from the city center.
| City: | 0.353 |
| U.S.: | 1.515 |
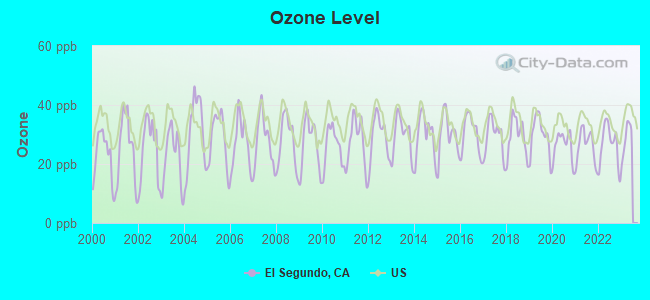
Ozone [ppb] level in 2022 was 26.5. This is better than average. Closest monitor was 2.1 miles away from the city center.
| City: | 26.5 |
| U.S.: | 33.3 |
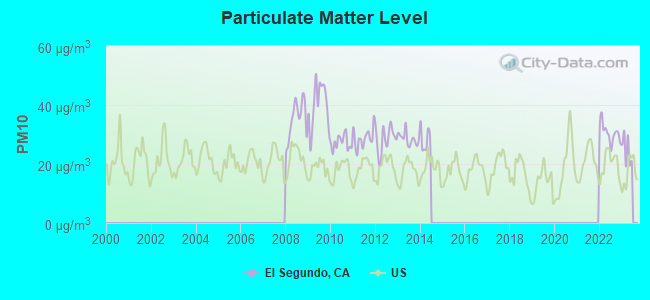
Particulate Matter (PM10) [µg/m3] level in 2022 was 30.5. This is significantly worse than average. Closest monitor was 2.1 miles away from the city center.
| City: | 30.5 |
| U.S.: | 19.2 |
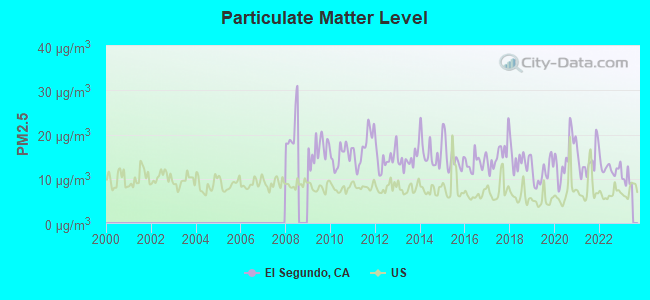
Particulate Matter (PM2.5) [µg/m3] level in 2022 was 12.5. This is significantly worse than average. Closest monitor was 11.2 miles away from the city center.
| City: | 12.5 |
| U.S.: | 8.1 |
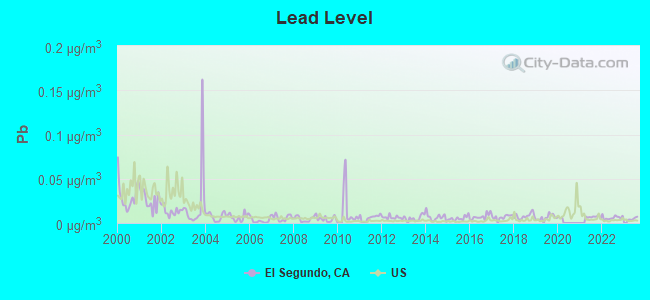
Lead (Pb) [µg/m3] level in 2022 was 0.00604. This is significantly better than average. Closest monitor was 2.1 miles away from the city center.
| City: | 0.00604 |
| U.S.: | 0.00931 |
Earthquake activity:
El Segundo-area historical earthquake activity is significantly above California state average. It is 6783% greater than the overall U.S. average.On 7/21/1952 at 11:52:14, a magnitude 7.7 (7.7 UK, Class: Major, Intensity: VIII - XII) earthquake occurred 81.9 miles away from El Segundo center, causing $50,000,000 total damage
On 6/28/1992 at 11:57:34, a magnitude 7.6 (6.2 MB, 7.6 MS, 7.3 MW, Depth: 0.7 mi) earthquake occurred 108.9 miles away from the city center, causing 3 deaths (1 shaking deaths, 2 other deaths) and 400 injuries, causing $100,000,000 total damage and $40,000,000 insured losses
On 10/16/1999 at 09:46:44, a magnitude 7.4 (6.3 MB, 7.4 MS, 7.2 MW, 7.3 ML) earthquake occurred 120.0 miles away from the city center
On 11/4/1927 at 13:51:53, a magnitude 7.5 (7.5 UK) earthquake occurred 164.8 miles away from El Segundo center
On 1/17/1994 at 12:30:55, a magnitude 6.8 (6.4 MB, 6.8 MS, 6.7 MW, Depth: 11.4 mi, Class: Strong, Intensity: VII - IX) earthquake occurred 18.9 miles away from the city center, causing 60 deaths (60 shaking deaths) and 7000 injuries
On 4/21/1918 at 22:32:30, a magnitude 6.8 (6.8 UK) earthquake occurred 56.0 miles away from El Segundo center
Magnitude types: body-wave magnitude (MB), local magnitude (ML), surface-wave magnitude (MS), moment magnitude (MW)
Natural disasters:
The number of natural disasters in Los Angeles County (57) is a lot greater than the US average (15).Major Disasters (Presidential) Declared: 27
Emergencies Declared: 3
Causes of natural disasters: Fires: 37, Floods: 16, Storms: 9, Winter Storms: 6, Landslides: 5, Mudslides: 5, Earthquakes: 3, Freeze: 1, Heavy Rain: 1, Hurricane: 1, Snow: 1, Tornado: 1, Wind: 1, Other: 1 (Note: some incidents may be assigned to more than one category).

Main business address for: UNOCAL CORP (CRUDE PETROLEUM & NATURAL GAS), BIG 5 CORP /CA/ (RETAIL-MISCELLANEOUS SHOPPING GOODS STORES), AURA SYSTEMS INC (MISCELLANEOUS ELECTRICAL MACHINERY, EQUIPMENT & SUPPLIES), BIG 5 SPORTING GOODS CORP (RETAIL-MISCELLANEOUS SHOPPING GOODS STORES), COMPUTER SCIENCES CORP (SERVICES-COMPUTER INTEGRATED SYSTEMS DESIGN), DAVITA INC (SERVICES-MISC HEALTH & ALLIED SERVICES, NEC), PEERLESS SYSTEMS CORP (SERVICES-PREPACKAGED SOFTWARE), DECRANE AIRCRAFT HOLDINGS INC (AIRCRAFT PART & AUXILIARY EQUIPMENT, NEC) and 9 other public companies.
Hospitals and medical centers in El Segundo:
Other hospitals and medical centers near El Segundo:
- HUMAN TOUCH HOME HEALTH CARE AGENCY, INC (Home Health Center, about 2 miles away; MANHATTAN BEACH, CA)
- MARINA HOME HEALTH INC (Home Health Center, about 3 miles away; LOS ANGELES, CA)
- SPIRIT HOME HEALTH CARE (Home Health Center, about 3 miles away; WESTCHESTER, CA)
- SOUTHER CALIFORNIA HOME HLTH CARE AGCY (Home Health Center, about 3 miles away; LOS ANGELES, CA)
- IMPERIAL CREST HEALTH CARE (Nursing Home, about 3 miles away; HAWTHORNE, CA)
- GUARDIAN HOME HEALTH CARE, INC (Home Health Center, about 3 miles away; INGLEWOOD, CA)
- FIVE STAR HOME HEALTH, INC (Home Health Center, about 3 miles away; LOS ANGELES, CA)
Heliports located in El Segundo:
- Airport Imperial Bldg Helistop Heliport (CN33)
- Airport Towers Nr 1 Heliport (CL03)
- Chevron Refinery Heliport (4CA6)
- Pacific Bell-2300 Imperial Hwy Heliport (32CN)
Amtrak stations near El Segundo:
- 14 miles: LOS ANGELES (800 N. ALAMEDA ST.) . Services: ticket office, fully wheelchair accessible, enclosed waiting area, public restrooms, public payphones, snack bar, free short-term parking, paid long-term parking, car rental agency, taxi stand, public transit connection.
- 15 miles: SAN PEDRO (CATALINA TERMINAL, BERTH 95) - Bus Station . Services: partially wheelchair accessible, enclosed waiting area, public restrooms, public payphones, snack bar, paid short-term parking, paid long-term parking, call for taxi service.
- 17 miles: LONG BEACH (601 N. LONG BEACH BLVD.) - Bus Station . Services: fully wheelchair accessible, public restrooms, public payphones, full-service food facilities, paid short-term parking, paid long-term parking, call for taxi service, public transit connection.
Colleges/universities with over 2000 students nearest to El Segundo:
- Loyola Marymount University (about 4 miles; Los Angeles, CA; Full-time enrollment: 7,720)
- El Camino Community College District (about 6 miles; Torrance, CA; FT enrollment: 13,952)
- Los Angeles Southwest College (about 6 miles; Los Angeles, CA; FT enrollment: 3,247)
- West Los Angeles College (about 6 miles; Culver City, CA; FT enrollment: 5,221)
- Santa Monica College (about 8 miles; Santa Monica, CA; FT enrollment: 20,311)
- California State University-Dominguez Hills (about 10 miles; Carson, CA; FT enrollment: 9,862)
- University of Southern California (about 10 miles; Los Angeles, CA; FT enrollment: 33,161)
Public high schools in El Segundo:
- EL SEGUNDO HIGH (Students: 891, Location: 640 MAIN ST., Grades: 9-12)
- ARENA HIGH (CONTINUATION) (Students: 12, Location: 630 ARENA ST., Grades: 9-12)
Private high school in El Segundo:
Public elementary/middle schools in El Segundo:
- EL SEGUNDO MIDDLE (Students: 779, Location: 332 CENTER ST., Grades: 6-8)
- CENTER STREET ELEMENTARY (Students: 447, Location: 700 CENTER ST., Grades: KG-5)
- RICHMOND STREET ELEMENTARY (Students: 352, Location: 615 RICHMOND ST., Grades: KG-5)
Private elementary/middle school in El Segundo:
Library in El Segundo:
User-submitted facts and corrections:
- One important fact to present to those interested in El Segundo is the stability of the city. I attended grade school at Richmond Street Elementary, on to E.S. Junior High and then on to E.S. High School. Graduating class of 1977. The schools I attended are all still there and have the same name. The Parks listed on this web site are (except for two) parks I played in as a child. I am willing to bet that most of the people I knew there still have ties to the town. It is definitely a place where you would want to raise the kids. Not too many towns across the U.S. can say that I bet. I owe a great debt of gratitude to the towns leadership back then for having the foresight to create a place like this. Its a wonderful thing to see that it is still the same nice little town.
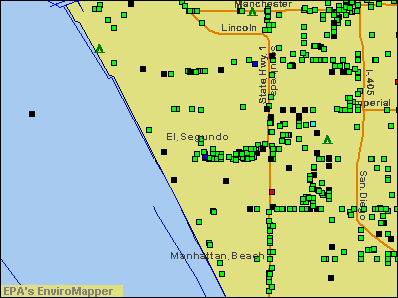
Points of interest:
Notable locations in El Segundo: El Segundo Station (A), El Segundo Golf Course (B), El Segundo Public Library (C), El Segundo City Hall (D), El Segundo Police Department (E), Chevron Fire Department (F), Northrop Grumman Corporation Fire Department (G), City of El Segundo Fire Department Station 1 Headquarters (H), City of El Segundo Fire Department Station 2 (I), El Segundo Generating Station (J). Display/hide their locations on the map
Main business address in El Segundo include: UNOCAL CORP (A), BIG 5 CORP /CA/ (B), AURA SYSTEMS INC (C), BIG 5 SPORTING GOODS CORP (D), COMPUTER SCIENCES CORP (E), DAVITA INC (F), PEERLESS SYSTEMS CORP (G), DECRANE AIRCRAFT HOLDINGS INC (H). Display/hide their locations on the map
Churches in El Segundo include: Church of Christ (A), The Church of Jesus Christ of Latter Day Saints (B), El Segundo Christian Church (C), El Segundo Foursquare Church (D), First Baptist Church (E), Kingdom Hall of Jehovahs Witnesses (F), New Mount Calvary Missionary Baptist Church (G), Pacific Baptist Church (H), Reorganized Church of Jesus Christ of Latter Day Saints (I). Display/hide their locations on the map
Parks in El Segundo include: Hilltop Park (1), Candy Cane Park (2), Kansas Park (3), Library Park (4), Recreation Park (5), Sycamore Park (6), Washington Park (7), Acacia Park (8), Constitution Park (9). Display/hide their locations on the map
Tourist attractions: ABC Tours and Transportation Inc (Po Box 3075), ABC Tours & Transportation Inc (609 East Maple Avenue), Almaca Marketing International Inc (323 Richmond Street).
Birthplace of: Christopher McCandless - An wanderer who hiked into the Alaskan wilderness with little food and equipment.
| This city: | 2.3 people |
| California: | 2.9 people |
| This city: | 57.9% |
| Whole state: | 68.7% |
| This city: | 5.8% |
| Whole state: | 7.2% |
Likely homosexual households (counted as self-reported same-sex unmarried-partner households)
- Lesbian couples: 0.4% of all households
- Gay men: 0.2% of all households
People in group quarters in El Segundo in 2010:
- 47 people in other noninstitutional facilities
- 10 people in nursing facilities/skilled-nursing facilities
- 10 people in workers' group living quarters and job corps centers
- 5 people in college/university student housing
- 4 people in group homes intended for adults
People in group quarters in El Segundo in 2000:
- 10 people in other group homes
- 6 people in homes for the mentally ill
- 4 people in homes for the mentally retarded
- 3 people in other noninstitutional group quarters
Banks with most branches in El Segundo (2011 data):
- JPMorgan Chase Bank, National Association: Sepulveda And Rosecrans Branch, 550 North Sepulveda Blvd Branch, East Grand Avenue Branch. Info updated 2011/11/10: Bank assets: $1,811,678.0 mil, Deposits: $1,190,738.0 mil, headquarters in Columbus, OH, positive income, International Specialization, 5577 total offices, Holding Company: Jpmorgan Chase & Co.
- Wells Fargo Bank, National Association: Manhattan Beach Pb Branch at 2141 Rosecrans Avenue, branch established on 2007/07/16; El Segundo Center Branch at 309 North Sepulveda Boulevard, Unit A, branch established on 1998/01/15. Info updated 2011/04/05: Bank assets: $1,161,490.0 mil, Deposits: $905,653.0 mil, headquarters in Sioux Falls, SD, positive income, 6395 total offices, Holding Company: Wells Fargo & Company
- City National Bank: Centralized Leasing Dept Branch at 831 South Douglas Street, branch established on 1990/01/16; Manhattan Beach Banking Office Branc at 2231 Rosecrans Avenue, branch established on 2007/11/08. Info updated 2011/04/11: Bank assets: $23,303.6 mil, Deposits: $20,475.9 mil, headquarters in Los Angeles, CA, positive income, Commercial Lending Specialization, 86 total offices, Holding Company: City National Corporation
- Fidelity Personal Trust Company, FSB: Fptc California Office Branch at 2361 Rosecrans Ave, Ste 730, branch established on 1996/05/30. Info updated 2011/07/21: Bank assets: $98.3 mil, Deposits: $50.5 mil, headquarters in Boston, MA, positive income, 4 total offices
- Bank of America, National Association: El Segundo Branch at 835 North Sepulveda Boulevard, branch established on 1959/09/18. Info updated 2009/11/18: Bank assets: $1,451,969.3 mil, Deposits: $1,077,176.8 mil, headquarters in Charlotte, NC, positive income, 5782 total offices, Holding Company: Bank Of America Corporation
- Comerica Bank: El Segundo Branch at 2321 Rosecrans Ave Ste 1225, branch established on 1963/07/26. Info updated 2011/07/29: Bank assets: $60,970.5 mil, Deposits: $48,300.9 mil, headquarters in Dallas, TX, positive income, Commercial Lending Specialization, 497 total offices, Holding Company: Comerica Incorporated
- Grandpoint Bank: South Bay Branch at 1960 East Grand Avenue, Suite 1200, branch established on 2010/09/07. Info updated 2012/02/01: Bank assets: $854.9 mil, Deposits: $726.6 mil, headquarters in Los Angeles, CA, negative income in the last year, Commercial Lending Specialization, 8 total offices, Holding Company: Grandpoint Capital, Inc.
- Citizens Business Bank: El Segundo Branch at 275 Main Street, branch established on 2002/10/21. Info updated 2011/03/30: Bank assets: $6,475.4 mil, Deposits: $4,625.6 mil, headquarters in Ontario, CA, positive income, Commercial Lending Specialization, 46 total offices, Holding Company: Cvb Financial Corp.
- Bank of Manhattan, N.A.: Bank Of Manhattan, N.A. at 2141 Rosecrans Avenue, Suite 1160, branch established on 2007/08/15. Info updated 2007/10/09: Bank assets: $198.7 mil, Deposits: $172.7 mil, local headquarters, negative income in the last year, Commercial Lending Specialization, 1 total offices, Holding Company: Scj, Inc.
For population 15 years and over in El Segundo:
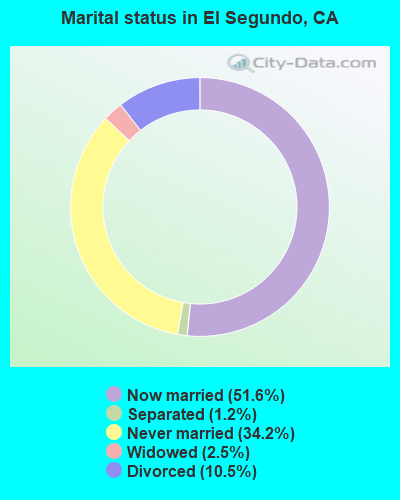
- Never married: 34.2%
- Now married: 51.6%
- Separated: 1.2%
- Widowed: 2.5%
- Divorced: 10.5%
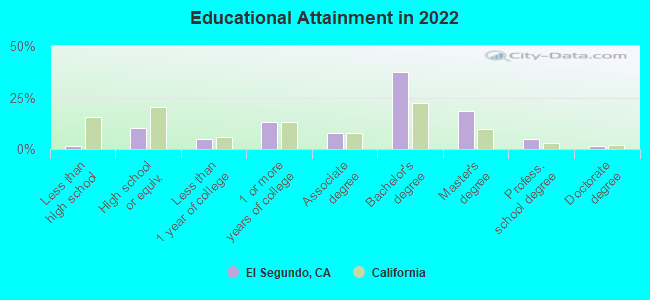
For population 25 years and over in El Segundo:
- High school or higher: 98.3%
- Bachelor's degree or higher: 61.3%
- Graduate or professional degree: 24.0%
- Unemployed: 4.0%
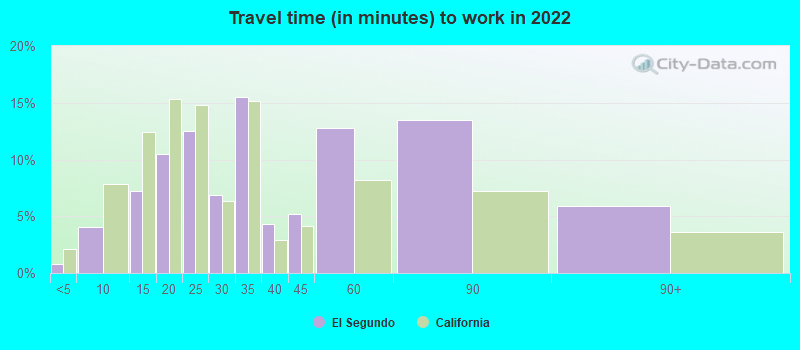
- Mean travel time to work (commute): 17.5 minutes
| Here: | 8.4 |
| California average: | 15.5 |


Graphs represent county-level data. Detailed 2008 Election Results
Religion statistics for El Segundo, CA (based on Los Angeles County data)


| Religion | Adherents | Congregations |
|---|---|---|
| Catholic | 3,542,994 | 275 |
| Evangelical Protestant | 814,611 | 3,249 |
| Other | 451,594 | 1,023 |
| Mainline Protestant | 229,056 | 860 |
| Black Protestant | 112,338 | 290 |
| Orthodox | 63,517 | 76 |
| None | 4,604,495 | - |
Food Environment Statistics:
| Los Angeles County: | 2.12 / 10,000 pop. |
| California: | 2.14 / 10,000 pop. |
| This county: | 0.03 / 10,000 pop. |
| California: | 0.04 / 10,000 pop. |
| Here: | 0.58 / 10,000 pop. |
| California: | 0.62 / 10,000 pop. |
| This county: | 1.23 / 10,000 pop. |
| State: | 1.49 / 10,000 pop. |
| Here: | 7.15 / 10,000 pop. |
| California: | 7.42 / 10,000 pop. |
| Here: | 7.5% |
| California: | 7.3% |
| Los Angeles County: | 20.4% |
| California: | 21.3% |
| This county: | 18.6% |
| California: | 17.9% |
Health and Nutrition:
| El Segundo: | 54.3% |
| California: | 49.4% |
| El Segundo: | 54.6% |
| California: | 48.0% |
| This city: | 28.0 |
| California: | 28.1 |
| This city: | 18.7% |
| California: | 20.2% |
| Here: | 8.9% |
| California: | 11.2% |
| El Segundo: | 6.9 |
| California: | 6.8 |
| El Segundo: | 33.2% |
| California: | 31.5% |
| Here: | 61.7% |
| California: | 56.4% |
| El Segundo: | 82.3% |
| California: | 80.9% |
More about Health and Nutrition of El Segundo, CA Residents
| Local government employment and payroll (March 2022) | |||||
| Function | Full-time employees | Monthly full-time payroll | Average yearly full-time wage | Part-time employees | Monthly part-time payroll |
|---|---|---|---|---|---|
| Police Protection - Officers | 54 | $746,995 | $165,999 | 0 | $0 |
| Firefighters | 39 | $634,841 | $195,336 | 0 | $0 |
| Other Government Administration | 23 | $172,270 | $89,880 | 3 | $4,535 |
| Financial Administration | 23 | $215,290 | $112,325 | 0 | $0 |
| Police - Other | 19 | $125,411 | $79,207 | 8 | $26,843 |
| Other and Unallocable | 18 | $175,719 | $117,146 | 12 | $15,897 |
| Parks and Recreation | 17 | $129,574 | $91,464 | 91 | $89,949 |
| Streets and Highways | 15 | $134,430 | $107,544 | 0 | $0 |
| Local Libraries | 12 | $82,287 | $82,287 | 17 | $45,074 |
| Fire - Other | 9 | $76,360 | $101,813 | 10 | $59,912 |
| Water Supply | 8 | $51,187 | $76,781 | 0 | $0 |
| Sewerage | 6 | $42,810 | $85,620 | 0 | $0 |
| Solid Waste Management | 1 | $13,362 | $160,344 | 0 | $0 |
| Totals for Government | 244 | $2,600,535 | $127,895 | 141 | $242,211 |
El Segundo government finances - Expenditure in 2021 (per resident):
- Construction - Regular Highways: $2,486,000 ($149.56)
Parks and Recreation: $1,518,000 ($91.32)
General - Other: $1,061,000 ($63.83)
Water Utilities: $716,000 ($43.08)
General Public Buildings: $445,000 ($26.77)
Sewerage: $236,000 ($14.20)
Police Protection: $97,000 ($5.84)
- Current Operations - Police Protection: $76,603,000 ($4608.53)
Local Fire Protection: $63,790,000 ($3837.68)
Central Staff Services: $31,565,000 ($1898.99)
Water Utilities: $18,388,000 ($1106.24)
Regular Highways: $11,340,000 ($682.23)
Libraries: $9,238,000 ($555.77)
Parks and Recreation: $6,296,000 ($378.78)
Financial Administration: $5,431,000 ($326.74)
Health - Other: $3,205,000 ($192.82)
Sewerage: $3,072,000 ($184.82)
Housing and Community Development: $1,201,000 ($72.25)
Protective Inspection and Regulation - Other: $980,000 ($58.96)
Solid Waste Management: $555,000 ($33.39)
Judicial and Legal Services: $527,000 ($31.70)
Transit Utilities: $64,000 ($3.85)
Air Transportation: $6,000 ($0.36)
- General - Interest on Debt: $382,000 ($22.98)
- Other Capital Outlay - Central Staff Services: $146,000 ($8.78)
Financial Administration: $67,000 ($4.03)
Parks and Recreation: $61,000 ($3.67)
Police Protection: $59,000 ($3.55)
General - Other: $49,000 ($2.95)
Protective Inspection and Regulation - Other: $28,000 ($1.68)
El Segundo government finances - Revenue in 2021 (per resident):
- Charges - Other: $5,976,000 ($359.52)
Sewerage: $3,267,000 ($196.55)
Parks and Recreation: $2,031,000 ($122.19)
Housing and Community Development: $943,000 ($56.73)
Parking Facilities: $2,000 ($0.12)
- Federal Intergovernmental - Other: $1,137,000 ($68.40)
- Miscellaneous - General Revenue - Other: $1,177,000 ($70.81)
Interest Earnings: $757,000 ($45.54)
Fines and Forfeits: $325,000 ($19.55)
Donations From Private Sources: $144,000 ($8.66)
Rents: $129,000 ($7.76)
- Revenue - Water Utilities: $24,627,000 ($1481.59)
- State Intergovernmental - Highways: $568,000 ($34.17)
Other: $502,000 ($30.20)
General Local Government Support: $45,000 ($2.71)
- Tax - Public Utilities Sales: $13,634,000 ($820.24)
Property: $11,992,000 ($721.45)
Occupation and Business License - Other: $11,762,000 ($707.62)
General Sales and Gross Receipts: $9,159,000 ($551.02)
Other Selective Sales: $4,893,000 ($294.37)
Other License: $3,207,000 ($192.94)
Other: $612,000 ($36.82)
Documentary and Stock Transfer: $270,000 ($16.24)
El Segundo government finances - Debt in 2021 (per resident):
- Long Term Debt - Outstanding Unspecified Public Purpose: $152,295,000 ($9162.25)
Issue, Unspecified Public Purpose: $144,135,000 ($8671.34)
Beginning Outstanding - Unspecified Public Purpose: $8,203,000 ($493.50)
Retired Unspecified Public Purpose: $43,000 ($2.59)
El Segundo government finances - Cash and Securities in 2021 (per resident):
- Bond Funds - Cash and Securities: $137,124,000 ($8249.55)
- Other Funds - Cash and Securities: $51,823,000 ($3117.74)
- Sinking Funds - Cash and Securities: $1,625,000 ($97.76)
2.98% of this county's 2021 resident taxpayers lived in other counties in 2020 ($81,235 average adjusted gross income)
| Here: | 2.98% |
| California average: | 5.19% |
0.01% of residents moved from foreign countries ($155 average AGI)
Los Angeles County: 0.01% California average: 0.03%
Top counties from which taxpayers relocated into this county between 2020 and 2021:
| from Orange County, CA | |
| from San Bernardino County, CA | |
| from Riverside County, CA |
4.68% of this county's 2020 resident taxpayers moved to other counties in 2021 ($97,324 average adjusted gross income)
| Here: | 4.68% |
| California average: | 6.14% |
0.01% of residents moved to foreign countries ($196 average AGI)
Los Angeles County: 0.01% California average: 0.02%
Top counties to which taxpayers relocated from this county between 2020 and 2021:
| to Orange County, CA | |
| to San Bernardino County, CA | |
| to Riverside County, CA |
| Businesses in El Segundo, CA | ||||
| Name | Count | Name | Count | |
|---|---|---|---|---|
| 7-Eleven | 1 | Homestead Studio Suites | 1 | |
| 99 Cents Only Stores | 1 | IHOP | 1 | |
| Banana Republic | 1 | J.Crew | 1 | |
| Bebe | 1 | JoS. A. Bank | 1 | |
| Blockbuster | 1 | Jones New York | 1 | |
| Carl\s Jr. | 1 | Kroger | 1 | |
| Chipotle | 1 | Marriott | 2 | |
| Circle K | 1 | McDonald's | 1 | |
| Cold Stone Creamery | 1 | Nike | 4 | |
| Curves | 1 | PetSmart | 1 | |
| Dennys | 1 | Quiznos | 2 | |
| Domino's Pizza | 1 | Rite Aid | 1 | |
| El Pollo Loco | 1 | Starbucks | 6 | |
| FedEx | 8 | T-Mobile | 1 | |
| GNC | 2 | UPS | 14 | |
| H&R Block | 1 | Vans | 2 | |
| Haworth | 1 | Walgreens | 1 | |
| Hilton | 3 | Whole Foods Market | 1 | |
Strongest AM radio stations in El Segundo:
- KNX (1070 AM; 50 kW; LOS ANGELES, CA; Owner: INFINITY BROADCASTING OPERATIONS, INC.)
- KSPN (710 AM; 50 kW; LOS ANGELES, CA; Owner: KABC-AM RADIO, INC.)
- KFWB (980 AM; 50 kW; LOS ANGELES, CA; Owner: INFINITY BROADCASTING OPERATIONS, INC.)
- KBLA (1580 AM; 50 kW; SANTA MONICA, CA)
- KFI (640 AM; 50 kW; LOS ANGELES, CA; Owner: CAPSTAR TX LIMITED PARTNERSHIP)
- KMPC (1540 AM; 50 kW; LOS ANGELES, CA; Owner: ROSE CITY RADIO CORPORATION)
- KLAC (570 AM; 50 kW; LOS ANGELES, CA; Owner: AMFM RADIO LICENSES, L.L.C.)
- KFOX (1650 AM; 10 kW; TORRANCE, CA; Owner: CHAGAL COMMUNICATIONS, INC.)
- KABC (790 AM; 5 kW; LOS ANGELES, CA; Owner: KABC-AM RADIO, INC.)
- KTYM (1460 AM; 5 kW; INGLEWOOD, CA)
- KXMX (1190 AM; 25 kW; ANAHEIM, CA; Owner: NEW INSPIRATION BROADCASTING COMPANY)
- KTNQ (1020 AM; 50 kW; LOS ANGELES, CA; Owner: KTNQ-AM LICENSE CORP.)
- KHJ (930 AM; 5 kW; LOS ANGELES, CA; Owner: LBI RADIO LICENSE CORP.)
Strongest FM radio stations in El Segundo:
- KKBT (100.3 FM; LOS ANGELES, CA; Owner: RADIO ONE LICENSES, LLC)
- KZLA-FM (93.9 FM; LOS ANGELES, CA; Owner: EMMIS RADIO LICENSE CORPORATION)
- KRTH-FM (101.1 FM; LOS ANGELES, CA; Owner: INFINITY BROADCASTING OPERATIONS, INC.)
- KPWR (105.9 FM; LOS ANGELES, CA; Owner: EMMIS RADIO LICENSE CORPORATION)
- KLSX (97.1 FM; LOS ANGELES, CA; Owner: INFINITY BROADCASTING OPERATIONS, INC.)
- KUSC (91.5 FM; LOS ANGELES, CA; Owner: UNIVERSITY OF SOUTHERN CALIFORNIA)
- KKLA-FM (99.5 FM; LOS ANGELES, CA; Owner: NEW INSPIRATION BROADCASTING CO., INC.)
- KCBS-FM (93.1 FM; LOS ANGELES, CA; Owner: INFINITY BROADCASTING OPERATIONS, INC.)
- KYSR (98.7 FM; LOS ANGELES, CA; Owner: AMFM RADIO LICENSES, L.L.C.)
- KSCA (101.9 FM; GLENDALE, CA; Owner: HBC LICENSE CORPORATION)
- K212FA (90.3 FM; TEMPLE CITY, CA; Owner: EDUCATIONAL MEDIA FOUNDATION)
- KLOS (95.5 FM; LOS ANGELES, CA; Owner: KLOS-FM RADIO, INC.)
- KOST (103.5 FM; LOS ANGELES, CA; Owner: CAPSTAR TX LIMITED PARTNERSHIP)
- KLVE (107.5 FM; LOS ANGELES, CA; Owner: KLVE-FM LICENSE CORP.)
- KCRW (89.9 FM; SANTA MONICA, CA; Owner: SANTA MONICA COMM. COLLEGE DISTRICT)
- KIIS-FM (102.7 FM; LOS ANGELES, CA; Owner: CITICASTERS LICENSES, L.P.)
- KPCC (89.3 FM; PASADENA, CA; Owner: PASADENA AREA COMMUNITY COLLEGE DISTRICT)
- KHHT (92.3 FM; LOS ANGELES, CA; Owner: AMFM RADIO LICENSES, L.L.C.)
- KBIG-FM (104.3 FM; LOS ANGELES, CA; Owner: AMFM RADIO LICENSES, L.L.C.)
- KRCD (103.9 FM; INGLEWOOD, CA; Owner: HBC LICENSE CORPORATION)
TV broadcast stations around El Segundo:
- KTRO-LP (Channel 50; LANCASTER, CA; Owner: ROBERT D. ADELMAN)
- KCBS-TV (Channel 2; LOS ANGELES, CA; Owner: CBS BROADCASTING INC.)
- KTLA-TV (Channel 5; LOS ANGELES, CA; Owner: KTLA INC.)
- KABC-TV (Channel 7; LOS ANGELES, CA; Owner: ABC HOLDING COMPANY, INC.)
- KCAL-TV (Channel 9; LOS ANGELES, CA; Owner: VIACOM TELEVISION STATIONS GROUP OF LOS ANGELES LLC)
- KNBC (Channel 4; LOS ANGELES, CA; Owner: NBC SUBSIDIARY (KNBC-TV), INC.)
- National Bridge Inventory (NBI) Statistics
- 11Number of bridges
- 72ft / 21.6mTotal length
- 301,198Total average daily traffic
- 4,852Total average daily truck traffic
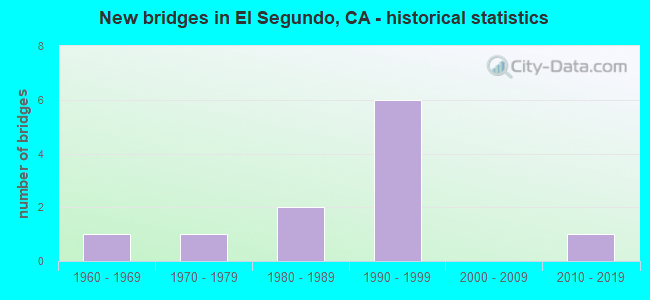
- New bridges - historical statistics
- 11960-1969
- 11970-1979
- 21980-1989
- 61990-1999
- 12010-2019
FCC Registered Broadcast Land Mobile Towers: 86 (See the full list of FCC Registered Broadcast Land Mobile Towers in El Segundo, CA)
FCC Registered Microwave Towers: 66 (See the full list of FCC Registered Microwave Towers in this town)
FCC Registered Paging Towers: 2 (See the full list of FCC Registered Paging Towers)
FCC Registered Maritime Coast & Aviation Ground Towers: 11 (See the full list of FCC Registered Maritime Coast & Aviation Ground Towers)
FCC Registered Amateur Radio Licenses: 207 (See the full list of FCC Registered Amateur Radio Licenses in El Segundo)
FAA Registered Aircraft Manufacturers and Dealers: 2 (See the full list of FAA Registered Manufacturers and Dealers in El Segundo)
FAA Registered Aircraft: 90 (See the full list of FAA Registered Aircraft)
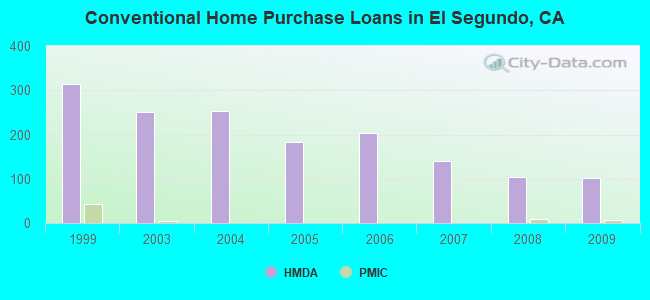
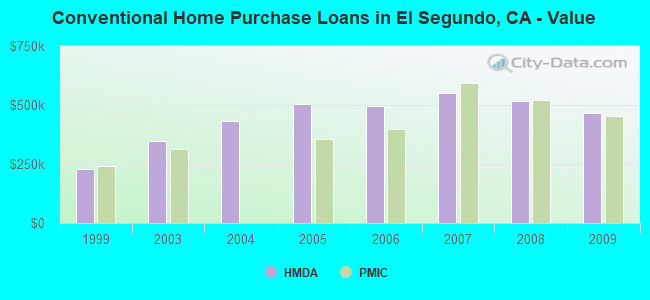
| Home Mortgage Disclosure Act Aggregated Statistics For Year 2009 (Based on 5 full tracts) | ||||||||||||
| A) FHA, FSA/RHS & VA Home Purchase Loans | B) Conventional Home Purchase Loans | C) Refinancings | D) Home Improvement Loans | E) Loans on Dwellings For 5+ Families | F) Non-occupant Loans on < 5 Family Dwellings (A B C & D) | |||||||
|---|---|---|---|---|---|---|---|---|---|---|---|---|
| Number | Average Value | Number | Average Value | Number | Average Value | Number | Average Value | Number | Average Value | Number | Average Value | |
| LOANS ORIGINATED | 20 | $599,250 | 101 | $466,525 | 477 | $389,379 | 16 | $389,375 | 0 | $0 | 31 | $373,613 |
| APPLICATIONS APPROVED, NOT ACCEPTED | 0 | $0 | 10 | $511,800 | 63 | $447,381 | 2 | $408,500 | 0 | $0 | 4 | $439,000 |
| APPLICATIONS DENIED | 3 | $459,000 | 18 | $390,444 | 131 | $445,885 | 2 | $278,000 | 2 | $1,210,000 | 9 | $330,778 |
| APPLICATIONS WITHDRAWN | 1 | $589,000 | 19 | $390,789 | 65 | $391,769 | 6 | $288,167 | 0 | $0 | 3 | $269,667 |
| FILES CLOSED FOR INCOMPLETENESS | 0 | $0 | 2 | $809,000 | 26 | $449,231 | 0 | $0 | 0 | $0 | 1 | $256,000 |
Detailed HMDA statistics for the following Tracts: 6200.01 , 6200.02, 6200.03, 6201.01, 6201.02
| Private Mortgage Insurance Companies Aggregated Statistics For Year 2009 (Based on 4 full tracts) | ||||
| A) Conventional Home Purchase Loans | B) Refinancings | |||
|---|---|---|---|---|
| Number | Average Value | Number | Average Value | |
| LOANS ORIGINATED | 7 | $451,286 | 0 | $0 |
| APPLICATIONS APPROVED, NOT ACCEPTED | 4 | $433,500 | 1 | $391,000 |
| APPLICATIONS DENIED | 0 | $0 | 2 | $593,500 |
| APPLICATIONS WITHDRAWN | 1 | $398,000 | 1 | $612,000 |
| FILES CLOSED FOR INCOMPLETENESS | 0 | $0 | 0 | $0 |
Detailed PMIC statistics for the following Tracts: 6200.01 , 6200.02, 6201.01, 6201.02
2005 - 2018 National Fire Incident Reporting System (NFIRS) incidents
- Fire incident types reported to NFIRS in El Segundo, CA
- 28341.1%Outside Fires
- 28140.8%Structure Fires
- 11216.3%Mobile Property/Vehicle Fires
- 121.7%Other
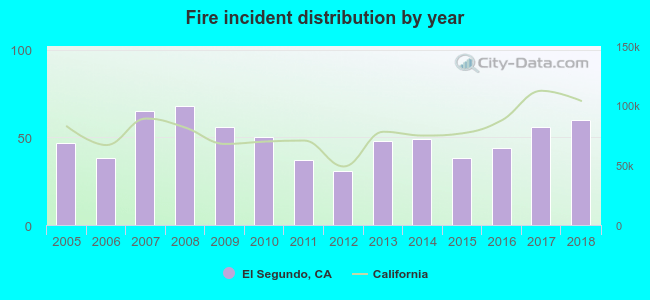 Based on the data from the years 2005 - 2018 the average number of fire incidents per year is 49. The highest number of fire incidents - 68 took place in 2008, and the least - 31 in 2012. The data has a growing trend.
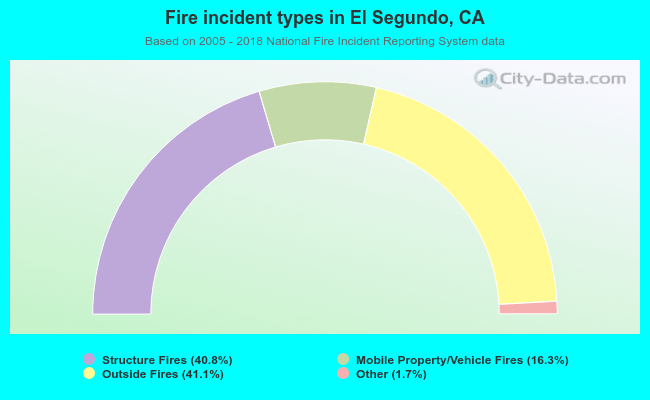 When looking into fire subcategories, the most incidents belonged to: Outside Fires (41.1%), and Structure Fires (40.8%).
Fire-safe hotels and motels in El Segundo, California:
- Hyatt Summerfield Suites, 810 S Douglas St, El Segundo, California 90245 , Phone: (310) 725-0100
- Extended Stay America - Los Angeles - Lax Airport - El Segundo, 1910 E Mariposa Ave, El Segundo, California 90245 , Phone: (310) 607-4000, Fax: (310) 607-4600
- Hilton Garden Inn Lax/El Segundo, 2100 E Mariposa Ave, El Segundo, California 90245 , Phone: (310) 726-0100, Fax: (310) 726-9606
- Hyatt Place Los Angeles / Lax / El Segundo, 750 N Nash St, El Segundo, California 90245 , Phone: (310) 322-2880, Fax: (310) 322-2840
- Aloft El Segundo - Los Angeles Airport, 475 N Sepulveda Blvd, El segundo, California 90245 , Phone: (424) 290-5555
- Fairfield Inn & Suites LAX / El Segundo, 525 N Sepulveda Blvd, El Segundo, California 90245 , Phone: (424) 290-5000
- Hampton Inn & Suites LAX/El Segundo, 888 N Sepulveda Blvd, El segundo, California 90245 , Phone: (310) 322-2900, Fax: (310) 322-2901
- Cambria LAX, 199 Continental Blvd, El segundo, California 90245 , Phone: (310) 965-0555, Fax: (310) 366-5930
| Most common first names in El Segundo, CA among deceased individuals | ||
| Name | Count | Lived (average) |
|---|---|---|
| John | 80 | 72.2 years |
| Mary | 78 | 81.3 years |
| James | 69 | 69.8 years |
| William | 66 | 73.8 years |
| Robert | 56 | 69.8 years |
| George | 42 | 77.5 years |
| Charles | 40 | 72.8 years |
| Helen | 39 | 78.8 years |
| Dorothy | 37 | 78.4 years |
| Margaret | 35 | 77.2 years |
| Most common last names in El Segundo, CA among deceased individuals | ||
| Last name | Count | Lived (average) |
|---|---|---|
| Smith | 28 | 78.7 years |
| Johnson | 25 | 76.0 years |
| Brown | 17 | 73.3 years |
| Peterson | 14 | 74.4 years |
| Williams | 13 | 76.5 years |
| Martin | 12 | 73.4 years |
| Clark | 11 | 76.8 years |
| Jones | 11 | 75.7 years |
| Miller | 11 | 78.0 years |
| Wood | 10 | 79.4 years |
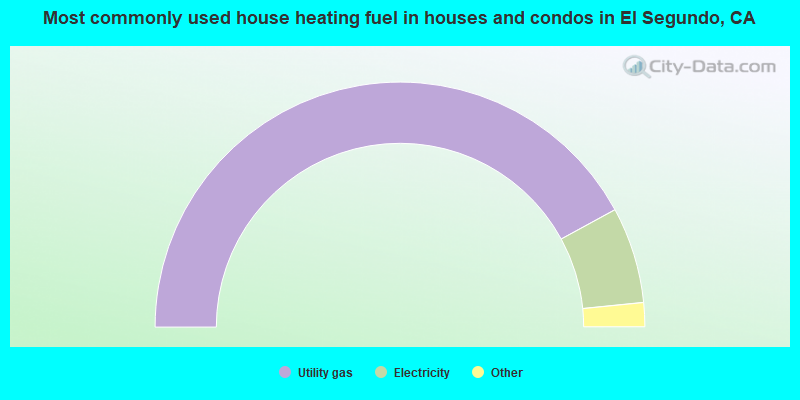
- 84.2%Utility gas
- 12.7%Electricity
- 1.2%Bottled, tank, or LP gas
- 1.2%No fuel used
- 0.5%Wood
- 0.2%Solar energy
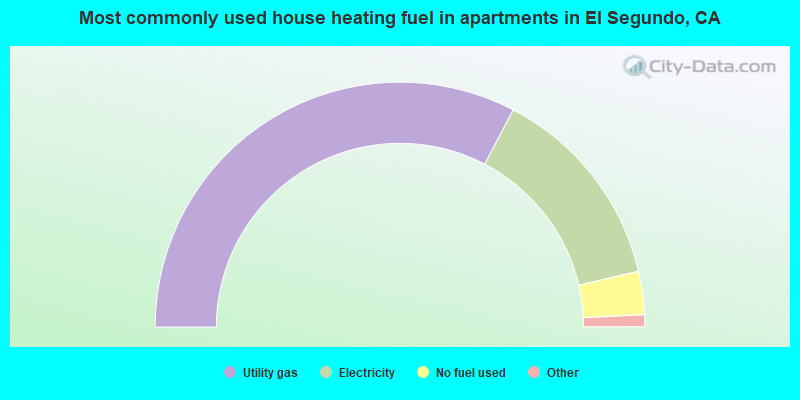
- 65.3%Utility gas
- 27.4%Electricity
- 5.7%No fuel used
- 1.3%Bottled, tank, or LP gas
- 0.3%Solar energy
El Segundo compared to California state average:
- Median household income above state average.
- Median house value significantly above state average.
- Unemployed percentage significantly below state average.
- Hispanic race population percentage below state average.
- Median age above state average.
- Foreign-born population percentage below state average.
- Length of stay since moving in significantly above state average.
- Percentage of population with a bachelor's degree or higher significantly above state average.
El Segundo on our top lists:
- #7 on the list of "Top 101 cities that people commute into (largest positive percentage daily daytime population change due to commuting) (population 5,000+)"
- #17 on the list of "Top 101 cities with the most local government spending on current operations of parks and recreation per resident (population 10,000+)"
- #23 on the list of "Top 101 cities with largest percentage of females in industries: information (population 5,000+)"
- #24 on the list of "Top 101 cities with largest percentage of females in occupations: arts, design, entertainment, sports, and media occupations (population 5,000+)"
- #29 on the list of "Top 101 cities with the most local government spending on current operations of libraries per resident (population 10,000+)"
- #93 on the list of "Top 101 cities with largest percentage of males in occupations: arts, design, entertainment, sports, and media occupations (population 5,000+)"
- #95 on the list of "Top 101 cities with largest percentage of males in industries: information (population 5,000+)"
- #101 on the list of "Top 101 cities with the most residents born in Argentina (population 500+)"
- #48 (90245) on the list of "Top 101 zip codes with the most Internet business establishments in 2005"
- #93 (90245) on the list of "Top 101 zip codes with the most medium-big companies in 2005 (at least 100 employees)"
- #1 on the list of "Top 101 counties with the most Evangelical Protestant congregations"
- #1 on the list of "Top 101 counties with the most Mainline Protestant congregations"
- #1 on the list of "Top 101 counties with the most Orthodox adherents"
- #1 on the list of "Top 101 counties with the highest ground withdrawal of fresh water for public supply (pop. 50,000+)"
- #1 on the list of "Top 101 counties with the most Catholic adherents (pop. 50,000+)"

|
|
Total of 529 patent applications in 2008-2024.