Encinitas, California Submit your own pictures of this city and show them to the world
OSM Map
General Map
Google Map
MSN Map
OSM Map
General Map
Google Map
MSN Map
OSM Map
General Map
Google Map
MSN Map
OSM Map
General Map
Google Map
MSN Map
Please wait while loading the map...
Population in 2022: 61,369 (100% urban, 0% rural). Population change since 2000: +5.8%Males: 30,179 Females: 31,190
March 2022 cost of living index in Encinitas: 130.1 (high, U.S. average is 100) Percentage of residents living in poverty in 2022: 7.1%for White Non-Hispanic residents , 22.7% for Black residents , 19.6% for Hispanic or Latino residents , 7.2% for American Indian residents , 12.5% for other race residents , 21.1% for two or more races residents )
Profiles of local businesses
Business Search - 14 Million verified businesses
Data:
Median household income ($)
Median household income (% change since 2000)
Household income diversity
Ratio of average income to average house value (%)
Ratio of average income to average rent
Median household income ($) - White
Median household income ($) - Black or African American
Median household income ($) - Asian
Median household income ($) - Hispanic or Latino
Median household income ($) - American Indian and Alaska Native
Median household income ($) - Multirace
Median household income ($) - Other Race
Median household income for houses/condos with a mortgage ($)
Median household income for apartments without a mortgage ($)
Races - White alone (%)
Races - White alone (% change since 2000)
Races - Black alone (%)
Races - Black alone (% change since 2000)
Races - American Indian alone (%)
Races - American Indian alone (% change since 2000)
Races - Asian alone (%)
Races - Asian alone (% change since 2000)
Races - Hispanic (%)
Races - Hispanic (% change since 2000)
Races - Native Hawaiian and Other Pacific Islander alone (%)
Races - Native Hawaiian and Other Pacific Islander alone (% change since 2000)
Races - Two or more races (%)
Races - Two or more races (% change since 2000)
Races - Other race alone (%)
Races - Other race alone (% change since 2000)
Racial diversity
Unemployment (%)
Unemployment (% change since 2000)
Unemployment (%) - White
Unemployment (%) - Black or African American
Unemployment (%) - Asian
Unemployment (%) - Hispanic or Latino
Unemployment (%) - American Indian and Alaska Native
Unemployment (%) - Multirace
Unemployment (%) - Other Race
Population density (people per square mile)
Population - Males (%)
Population - Females (%)
Population - Males (%) - White
Population - Males (%) - Black or African American
Population - Males (%) - Asian
Population - Males (%) - Hispanic or Latino
Population - Males (%) - American Indian and Alaska Native
Population - Males (%) - Multirace
Population - Males (%) - Other Race
Population - Females (%) - White
Population - Females (%) - Black or African American
Population - Females (%) - Asian
Population - Females (%) - Hispanic or Latino
Population - Females (%) - American Indian and Alaska Native
Population - Females (%) - Multirace
Population - Females (%) - Other Race
Coronavirus confirmed cases (Apr 27, 2024)
Deaths caused by coronavirus (Apr 27, 2024)
Coronavirus confirmed cases (per 100k population) (Apr 27, 2024)
Deaths caused by coronavirus (per 100k population) (Apr 27, 2024)
Daily increase in number of cases (Apr 27, 2024)
Weekly increase in number of cases (Apr 27, 2024)
Cases doubled (in days) (Apr 27, 2024)
Hospitalized patients (Apr 18, 2022)
Negative test results (Apr 18, 2022)
Total test results (Apr 18, 2022)
COVID Vaccine doses distributed (per 100k population) (Sep 19, 2023)
COVID Vaccine doses administered (per 100k population) (Sep 19, 2023)
COVID Vaccine doses distributed (Sep 19, 2023)
COVID Vaccine doses administered (Sep 19, 2023)
Likely homosexual households (%)
Likely homosexual households (% change since 2000)
Likely homosexual households - Lesbian couples (%)
Likely homosexual households - Lesbian couples (% change since 2000)
Likely homosexual households - Gay men (%)
Likely homosexual households - Gay men (% change since 2000)
Cost of living index
Median gross rent ($)
Median contract rent ($)
Median monthly housing costs ($)
Median house or condo value ($)
Median house or condo value ($ change since 2000)
Mean house or condo value by units in structure - 1, detached ($)
Mean house or condo value by units in structure - 1, attached ($)
Mean house or condo value by units in structure - 2 ($)
Mean house or condo value by units in structure by units in structure - 3 or 4 ($)
Mean house or condo value by units in structure - 5 or more ($)
Mean house or condo value by units in structure - Boat, RV, van, etc. ($)
Mean house or condo value by units in structure - Mobile home ($)
Median house or condo value ($) - White
Median house or condo value ($) - Black or African American
Median house or condo value ($) - Asian
Median house or condo value ($) - Hispanic or Latino
Median house or condo value ($) - American Indian and Alaska Native
Median house or condo value ($) - Multirace
Median house or condo value ($) - Other Race
Median resident age
Resident age diversity
Median resident age - Males
Median resident age - Females
Median resident age - White
Median resident age - Black or African American
Median resident age - Asian
Median resident age - Hispanic or Latino
Median resident age - American Indian and Alaska Native
Median resident age - Multirace
Median resident age - Other Race
Median resident age - Males - White
Median resident age - Males - Black or African American
Median resident age - Males - Asian
Median resident age - Males - Hispanic or Latino
Median resident age - Males - American Indian and Alaska Native
Median resident age - Males - Multirace
Median resident age - Males - Other Race
Median resident age - Females - White
Median resident age - Females - Black or African American
Median resident age - Females - Asian
Median resident age - Females - Hispanic or Latino
Median resident age - Females - American Indian and Alaska Native
Median resident age - Females - Multirace
Median resident age - Females - Other Race
Commute - mean travel time to work (minutes)
Travel time to work - Less than 5 minutes (%)
Travel time to work - Less than 5 minutes (% change since 2000)
Travel time to work - 5 to 9 minutes (%)
Travel time to work - 5 to 9 minutes (% change since 2000)
Travel time to work - 10 to 19 minutes (%)
Travel time to work - 10 to 19 minutes (% change since 2000)
Travel time to work - 20 to 29 minutes (%)
Travel time to work - 20 to 29 minutes (% change since 2000)
Travel time to work - 30 to 39 minutes (%)
Travel time to work - 30 to 39 minutes (% change since 2000)
Travel time to work - 40 to 59 minutes (%)
Travel time to work - 40 to 59 minutes (% change since 2000)
Travel time to work - 60 to 89 minutes (%)
Travel time to work - 60 to 89 minutes (% change since 2000)
Travel time to work - 90 or more minutes (%)
Travel time to work - 90 or more minutes (% change since 2000)
Marital status - Never married (%)
Marital status - Now married (%)
Marital status - Separated (%)
Marital status - Widowed (%)
Marital status - Divorced (%)
Median family income ($)
Median family income (% change since 2000)
Median non-family income ($)
Median non-family income (% change since 2000)
Median per capita income ($)
Median per capita income (% change since 2000)
Median family income ($) - White
Median family income ($) - Black or African American
Median family income ($) - Asian
Median family income ($) - Hispanic or Latino
Median family income ($) - American Indian and Alaska Native
Median family income ($) - Multirace
Median family income ($) - Other Race
Median year house/condo built
Median year apartment built
Year house built - Built 2005 or later (%)
Year house built - Built 2000 to 2004 (%)
Year house built - Built 1990 to 1999 (%)
Year house built - Built 1980 to 1989 (%)
Year house built - Built 1970 to 1979 (%)
Year house built - Built 1960 to 1969 (%)
Year house built - Built 1950 to 1959 (%)
Year house built - Built 1940 to 1949 (%)
Year house built - Built 1939 or earlier (%)
Average household size
Household density (households per square mile)
Average household size - White
Average household size - Black or African American
Average household size - Asian
Average household size - Hispanic or Latino
Average household size - American Indian and Alaska Native
Average household size - Multirace
Average household size - Other Race
Occupied housing units (%)
Vacant housing units (%)
Owner occupied housing units (%)
Renter occupied housing units (%)
Vacancy status - For rent (%)
Vacancy status - For sale only (%)
Vacancy status - Rented or sold, not occupied (%)
Vacancy status - For seasonal, recreational, or occasional use (%)
Vacancy status - For migrant workers (%)
Vacancy status - Other vacant (%)
Residents with income below the poverty level (%)
Residents with income below 50% of the poverty level (%)
Children below poverty level (%)
Poor families by family type - Married-couple family (%)
Poor families by family type - Male, no wife present (%)
Poor families by family type - Female, no husband present (%)
Poverty status for native-born residents (%)
Poverty status for foreign-born residents (%)
Poverty among high school graduates not in families (%)
Poverty among people who did not graduate high school not in families (%)
Residents with income below the poverty level (%) - White
Residents with income below the poverty level (%) - Black or African American
Residents with income below the poverty level (%) - Asian
Residents with income below the poverty level (%) - Hispanic or Latino
Residents with income below the poverty level (%) - American Indian and Alaska Native
Residents with income below the poverty level (%) - Multirace
Residents with income below the poverty level (%) - Other Race
Air pollution - Air Quality Index (AQI)
Air pollution - CO
Air pollution - NO2
Air pollution - SO2
Air pollution - Ozone
Air pollution - PM10
Air pollution - PM25
Air pollution - Pb
Crime - Murders per 100,000 population
Crime - Rapes per 100,000 population
Crime - Robberies per 100,000 population
Crime - Assaults per 100,000 population
Crime - Burglaries per 100,000 population
Crime - Thefts per 100,000 population
Crime - Auto thefts per 100,000 population
Crime - Arson per 100,000 population
Crime - City-data.com crime index
Crime - Violent crime index
Crime - Property crime index
Crime - Murders per 100,000 population (5 year average)
Crime - Rapes per 100,000 population (5 year average)
Crime - Robberies per 100,000 population (5 year average)
Crime - Assaults per 100,000 population (5 year average)
Crime - Burglaries per 100,000 population (5 year average)
Crime - Thefts per 100,000 population (5 year average)
Crime - Auto thefts per 100,000 population (5 year average)
Crime - Arson per 100,000 population (5 year average)
Crime - City-data.com crime index (5 year average)
Crime - Violent crime index (5 year average)
Crime - Property crime index (5 year average)
1996 Presidential Elections Results (%) - Democratic Party (Clinton)
1996 Presidential Elections Results (%) - Republican Party (Dole)
1996 Presidential Elections Results (%) - Other
2000 Presidential Elections Results (%) - Democratic Party (Gore)
2000 Presidential Elections Results (%) - Republican Party (Bush)
2000 Presidential Elections Results (%) - Other
2004 Presidential Elections Results (%) - Democratic Party (Kerry)
2004 Presidential Elections Results (%) - Republican Party (Bush)
2004 Presidential Elections Results (%) - Other
2008 Presidential Elections Results (%) - Democratic Party (Obama)
2008 Presidential Elections Results (%) - Republican Party (McCain)
2008 Presidential Elections Results (%) - Other
2012 Presidential Elections Results (%) - Democratic Party (Obama)
2012 Presidential Elections Results (%) - Republican Party (Romney)
2012 Presidential Elections Results (%) - Other
2016 Presidential Elections Results (%) - Democratic Party (Clinton)
2016 Presidential Elections Results (%) - Republican Party (Trump)
2016 Presidential Elections Results (%) - Other
2020 Presidential Elections Results (%) - Democratic Party (Biden)
2020 Presidential Elections Results (%) - Republican Party (Trump)
2020 Presidential Elections Results (%) - Other
Ancestries Reported - Arab (%)
Ancestries Reported - Czech (%)
Ancestries Reported - Danish (%)
Ancestries Reported - Dutch (%)
Ancestries Reported - English (%)
Ancestries Reported - French (%)
Ancestries Reported - French Canadian (%)
Ancestries Reported - German (%)
Ancestries Reported - Greek (%)
Ancestries Reported - Hungarian (%)
Ancestries Reported - Irish (%)
Ancestries Reported - Italian (%)
Ancestries Reported - Lithuanian (%)
Ancestries Reported - Norwegian (%)
Ancestries Reported - Polish (%)
Ancestries Reported - Portuguese (%)
Ancestries Reported - Russian (%)
Ancestries Reported - Scotch-Irish (%)
Ancestries Reported - Scottish (%)
Ancestries Reported - Slovak (%)
Ancestries Reported - Subsaharan African (%)
Ancestries Reported - Swedish (%)
Ancestries Reported - Swiss (%)
Ancestries Reported - Ukrainian (%)
Ancestries Reported - United States (%)
Ancestries Reported - Welsh (%)
Ancestries Reported - West Indian (%)
Ancestries Reported - Other (%)
Educational Attainment - No schooling completed (%)
Educational Attainment - Less than high school (%)
Educational Attainment - High school or equivalent (%)
Educational Attainment - Less than 1 year of college (%)
Educational Attainment - 1 or more years of college (%)
Educational Attainment - Associate degree (%)
Educational Attainment - Bachelor's degree (%)
Educational Attainment - Master's degree (%)
Educational Attainment - Professional school degree (%)
Educational Attainment - Doctorate degree (%)
School Enrollment - Nursery, preschool (%)
School Enrollment - Kindergarten (%)
School Enrollment - Grade 1 to 4 (%)
School Enrollment - Grade 5 to 8 (%)
School Enrollment - Grade 9 to 12 (%)
School Enrollment - College undergrad (%)
School Enrollment - Graduate or professional (%)
School Enrollment - Not enrolled in school (%)
School enrollment - Public schools (%)
School enrollment - Private schools (%)
School enrollment - Not enrolled (%)
Median number of rooms in houses and condos
Median number of rooms in apartments
Housing units lacking complete plumbing facilities (%)
Housing units lacking complete kitchen facilities (%)
Density of houses
Urban houses (%)
Rural houses (%)
Households with people 60 years and over (%)
Households with people 65 years and over (%)
Households with people 75 years and over (%)
Households with one or more nonrelatives (%)
Households with no nonrelatives (%)
Population in households (%)
Family households (%)
Nonfamily households (%)
Population in families (%)
Family households with own children (%)
Median number of bedrooms in owner occupied houses
Mean number of bedrooms in owner occupied houses
Median number of bedrooms in renter occupied houses
Mean number of bedrooms in renter occupied houses
Median number of vehichles in owner occupied houses
Mean number of vehichles in owner occupied houses
Median number of vehichles in renter occupied houses
Mean number of vehichles in renter occupied houses
Mortgage status - with mortgage (%)
Mortgage status - with second mortgage (%)
Mortgage status - with home equity loan (%)
Mortgage status - with both second mortgage and home equity loan (%)
Mortgage status - without a mortgage (%)
Average family size
Average family size - White
Average family size - Black or African American
Average family size - Asian
Average family size - Hispanic or Latino
Average family size - American Indian and Alaska Native
Average family size - Multirace
Average family size - Other Race
Geographical mobility - Same house 1 year ago (%)
Geographical mobility - Moved within same county (%)
Geographical mobility - Moved from different county within same state (%)
Geographical mobility - Moved from different state (%)
Geographical mobility - Moved from abroad (%)
Place of birth - Born in state of residence (%)
Place of birth - Born in other state (%)
Place of birth - Native, outside of US (%)
Place of birth - Foreign born (%)
Housing units in structures - 1, detached (%)
Housing units in structures - 1, attached (%)
Housing units in structures - 2 (%)
Housing units in structures - 3 or 4 (%)
Housing units in structures - 5 to 9 (%)
Housing units in structures - 10 to 19 (%)
Housing units in structures - 20 to 49 (%)
Housing units in structures - 50 or more (%)
Housing units in structures - Mobile home (%)
Housing units in structures - Boat, RV, van, etc. (%)
House/condo owner moved in on average (years ago)
Renter moved in on average (years ago)
Year householder moved into unit - Moved in 1999 to March 2000 (%)
Year householder moved into unit - Moved in 1995 to 1998 (%)
Year householder moved into unit - Moved in 1990 to 1994 (%)
Year householder moved into unit - Moved in 1980 to 1989 (%)
Year householder moved into unit - Moved in 1970 to 1979 (%)
Year householder moved into unit - Moved in 1969 or earlier (%)
Means of transportation to work - Drove car alone (%)
Means of transportation to work - Carpooled (%)
Means of transportation to work - Public transportation (%)
Means of transportation to work - Bus or trolley bus (%)
Means of transportation to work - Streetcar or trolley car (%)
Means of transportation to work - Subway or elevated (%)
Means of transportation to work - Railroad (%)
Means of transportation to work - Ferryboat (%)
Means of transportation to work - Taxicab (%)
Means of transportation to work - Motorcycle (%)
Means of transportation to work - Bicycle (%)
Means of transportation to work - Walked (%)
Means of transportation to work - Other means (%)
Working at home (%)
Industry diversity
Most Common Industries - Agriculture, forestry, fishing and hunting, and mining (%)
Most Common Industries - Agriculture, forestry, fishing and hunting (%)
Most Common Industries - Mining, quarrying, and oil and gas extraction (%)
Most Common Industries - Construction (%)
Most Common Industries - Manufacturing (%)
Most Common Industries - Wholesale trade (%)
Most Common Industries - Retail trade (%)
Most Common Industries - Transportation and warehousing, and utilities (%)
Most Common Industries - Transportation and warehousing (%)
Most Common Industries - Utilities (%)
Most Common Industries - Information (%)
Most Common Industries - Finance and insurance, and real estate and rental and leasing (%)
Most Common Industries - Finance and insurance (%)
Most Common Industries - Real estate and rental and leasing (%)
Most Common Industries - Professional, scientific, and management, and administrative and waste management services (%)
Most Common Industries - Professional, scientific, and technical services (%)
Most Common Industries - Management of companies and enterprises (%)
Most Common Industries - Administrative and support and waste management services (%)
Most Common Industries - Educational services, and health care and social assistance (%)
Most Common Industries - Educational services (%)
Most Common Industries - Health care and social assistance (%)
Most Common Industries - Arts, entertainment, and recreation, and accommodation and food services (%)
Most Common Industries - Arts, entertainment, and recreation (%)
Most Common Industries - Accommodation and food services (%)
Most Common Industries - Other services, except public administration (%)
Most Common Industries - Public administration (%)
Occupation diversity
Most Common Occupations - Management, business, science, and arts occupations (%)
Most Common Occupations - Management, business, and financial occupations (%)
Most Common Occupations - Management occupations (%)
Most Common Occupations - Business and financial operations occupations (%)
Most Common Occupations - Computer, engineering, and science occupations (%)
Most Common Occupations - Computer and mathematical occupations (%)
Most Common Occupations - Architecture and engineering occupations (%)
Most Common Occupations - Life, physical, and social science occupations (%)
Most Common Occupations - Education, legal, community service, arts, and media occupations (%)
Most Common Occupations - Community and social service occupations (%)
Most Common Occupations - Legal occupations (%)
Most Common Occupations - Education, training, and library occupations (%)
Most Common Occupations - Arts, design, entertainment, sports, and media occupations (%)
Most Common Occupations - Healthcare practitioners and technical occupations (%)
Most Common Occupations - Health diagnosing and treating practitioners and other technical occupations (%)
Most Common Occupations - Health technologists and technicians (%)
Most Common Occupations - Service occupations (%)
Most Common Occupations - Healthcare support occupations (%)
Most Common Occupations - Protective service occupations (%)
Most Common Occupations - Fire fighting and prevention, and other protective service workers including supervisors (%)
Most Common Occupations - Law enforcement workers including supervisors (%)
Most Common Occupations - Food preparation and serving related occupations (%)
Most Common Occupations - Building and grounds cleaning and maintenance occupations (%)
Most Common Occupations - Personal care and service occupations (%)
Most Common Occupations - Sales and office occupations (%)
Most Common Occupations - Sales and related occupations (%)
Most Common Occupations - Office and administrative support occupations (%)
Most Common Occupations - Natural resources, construction, and maintenance occupations (%)
Most Common Occupations - Farming, fishing, and forestry occupations (%)
Most Common Occupations - Construction and extraction occupations (%)
Most Common Occupations - Installation, maintenance, and repair occupations (%)
Most Common Occupations - Production, transportation, and material moving occupations (%)
Most Common Occupations - Production occupations (%)
Most Common Occupations - Transportation occupations (%)
Most Common Occupations - Material moving occupations (%)
People in Group quarters - Institutionalized population (%)
People in Group quarters - Correctional institutions (%)
People in Group quarters - Federal prisons and detention centers (%)
People in Group quarters - Halfway houses (%)
People in Group quarters - Local jails and other confinement facilities (including police lockups) (%)
People in Group quarters - Military disciplinary barracks (%)
People in Group quarters - State prisons (%)
People in Group quarters - Other types of correctional institutions (%)
People in Group quarters - Nursing homes (%)
People in Group quarters - Hospitals/wards, hospices, and schools for the handicapped (%)
People in Group quarters - Hospitals/wards and hospices for chronically ill (%)
People in Group quarters - Hospices or homes for chronically ill (%)
People in Group quarters - Military hospitals or wards for chronically ill (%)
People in Group quarters - Other hospitals or wards for chronically ill (%)
People in Group quarters - Hospitals or wards for drug/alcohol abuse (%)
People in Group quarters - Mental (Psychiatric) hospitals or wards (%)
People in Group quarters - Schools, hospitals, or wards for the mentally retarded (%)
People in Group quarters - Schools, hospitals, or wards for the physically handicapped (%)
People in Group quarters - Institutions for the deaf (%)
People in Group quarters - Institutions for the blind (%)
People in Group quarters - Orthopedic wards and institutions for the physically handicapped (%)
People in Group quarters - Wards in general hospitals for patients who have no usual home elsewhere (%)
People in Group quarters - Wards in military hospitals for patients who have no usual home elsewhere (%)
People in Group quarters - Juvenile institutions (%)
People in Group quarters - Long-term care (%)
People in Group quarters - Homes for abused, dependent, and neglected children (%)
People in Group quarters - Residential treatment centers for emotionally disturbed children (%)
People in Group quarters - Training schools for juvenile delinquents (%)
People in Group quarters - Short-term care, detention or diagnostic centers for delinquent children (%)
People in Group quarters - Type of juvenile institution unknown (%)
People in Group quarters - Noninstitutionalized population (%)
People in Group quarters - College dormitories (includes college quarters off campus) (%)
People in Group quarters - Military quarters (%)
People in Group quarters - On base (%)
People in Group quarters - Barracks, unaccompanied personnel housing (UPH), (Enlisted/Officer), ;and similar group living quarters for military personnel (%)
People in Group quarters - Transient quarters for temporary residents (%)
People in Group quarters - Military ships (%)
People in Group quarters - Group homes (%)
People in Group quarters - Homes or halfway houses for drug/alcohol abuse (%)
People in Group quarters - Homes for the mentally ill (%)
People in Group quarters - Homes for the mentally retarded (%)
People in Group quarters - Homes for the physically handicapped (%)
People in Group quarters - Other group homes (%)
People in Group quarters - Religious group quarters (%)
People in Group quarters - Dormitories (%)
People in Group quarters - Agriculture workers' dormitories on farms (%)
People in Group quarters - Job Corps and vocational training facilities (%)
People in Group quarters - Other workers' dormitories (%)
People in Group quarters - Crews of maritime vessels (%)
People in Group quarters - Other nonhousehold living situations (%)
People in Group quarters - Other noninstitutional group quarters (%)
Residents speaking English at home (%)
Residents speaking English at home - Born in the United States (%)
Residents speaking English at home - Native, born elsewhere (%)
Residents speaking English at home - Foreign born (%)
Residents speaking Spanish at home (%)
Residents speaking Spanish at home - Born in the United States (%)
Residents speaking Spanish at home - Native, born elsewhere (%)
Residents speaking Spanish at home - Foreign born (%)
Residents speaking other language at home (%)
Residents speaking other language at home - Born in the United States (%)
Residents speaking other language at home - Native, born elsewhere (%)
Residents speaking other language at home - Foreign born (%)
Class of Workers - Employee of private company (%)
Class of Workers - Self-employed in own incorporated business (%)
Class of Workers - Private not-for-profit wage and salary workers (%)
Class of Workers - Local government workers (%)
Class of Workers - State government workers (%)
Class of Workers - Federal government workers (%)
Class of Workers - Self-employed workers in own not incorporated business and Unpaid family workers (%)
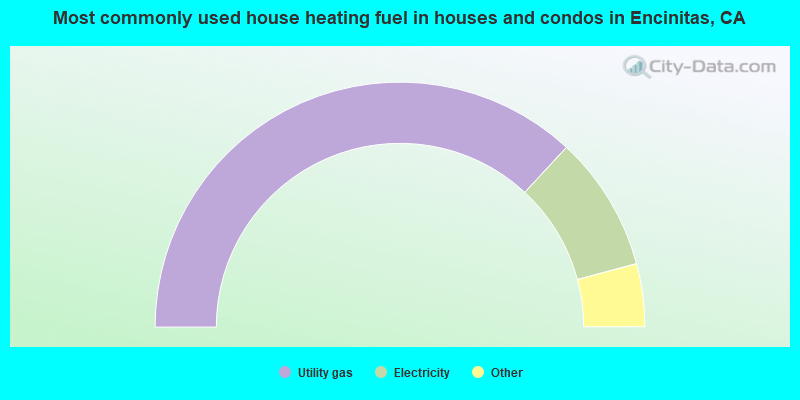
House heating fuel used in houses and condos - Utility gas (%)
House heating fuel used in houses and condos - Bottled, tank, or LP gas (%)
House heating fuel used in houses and condos - Electricity (%)
House heating fuel used in houses and condos - Fuel oil, kerosene, etc. (%)
House heating fuel used in houses and condos - Coal or coke (%)
House heating fuel used in houses and condos - Wood (%)
House heating fuel used in houses and condos - Solar energy (%)
House heating fuel used in houses and condos - Other fuel (%)
House heating fuel used in houses and condos - No fuel used (%)
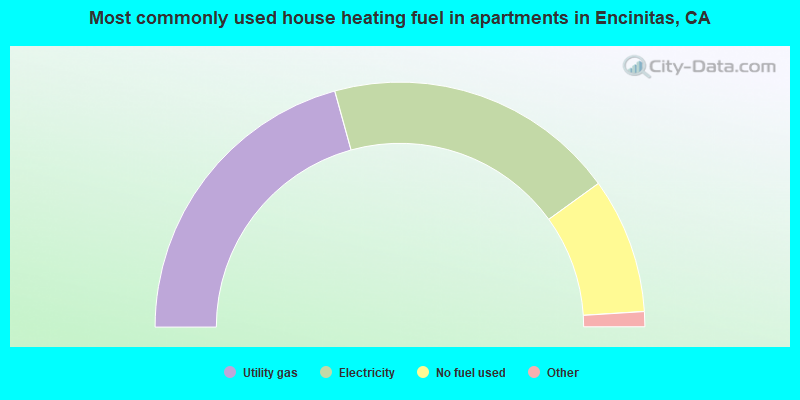
House heating fuel used in apartments - Utility gas (%)
House heating fuel used in apartments - Bottled, tank, or LP gas (%)
House heating fuel used in apartments - Electricity (%)
House heating fuel used in apartments - Fuel oil, kerosene, etc. (%)
House heating fuel used in apartments - Coal or coke (%)
House heating fuel used in apartments - Wood (%)
House heating fuel used in apartments - Solar energy (%)
House heating fuel used in apartments - Other fuel (%)
House heating fuel used in apartments - No fuel used (%)
Armed forces status - In Armed Forces (%)
Armed forces status - Civilian (%)
Armed forces status - Civilian - Veteran (%)
Armed forces status - Civilian - Nonveteran (%)
Fatal accidents locations in years 2005-2021
Fatal accidents locations in 2005
Fatal accidents locations in 2006
Fatal accidents locations in 2007
Fatal accidents locations in 2008
Fatal accidents locations in 2009
Fatal accidents locations in 2010
Fatal accidents locations in 2011
Fatal accidents locations in 2012
Fatal accidents locations in 2013
Fatal accidents locations in 2014
Fatal accidents locations in 2015
Fatal accidents locations in 2016
Fatal accidents locations in 2017
Fatal accidents locations in 2018
Fatal accidents locations in 2019
Fatal accidents locations in 2020
Fatal accidents locations in 2021
Alcohol use - People drinking some alcohol every month (%)
Alcohol use - People not drinking at all (%)
Alcohol use - Average days/month drinking alcohol
Alcohol use - Average drinks/week
Alcohol use - Average days/year people drink much
Audiometry - Average condition of hearing (%)
Audiometry - People that can hear a whisper from across a quiet room (%)
Audiometry - People that can hear normal voice from across a quiet room (%)
Audiometry - Ears ringing, roaring, buzzing (%)
Audiometry - Had a job exposure to loud noise (%)
Audiometry - Had off-work exposure to loud noise (%)
Blood Pressure & Cholesterol - Has high blood pressure (%)
Blood Pressure & Cholesterol - Checking blood pressure at home (%)
Blood Pressure & Cholesterol - Frequently checking blood cholesterol (%)
Blood Pressure & Cholesterol - Has high cholesterol level (%)
Consumer Behavior - Money monthly spent on food at supermarket/grocery store
Consumer Behavior - Money monthly spent on food at other stores
Consumer Behavior - Money monthly spent on eating out
Consumer Behavior - Money monthly spent on carryout/delivered foods
Consumer Behavior - Income spent on food at supermarket/grocery store (%)
Consumer Behavior - Income spent on food at other stores (%)
Consumer Behavior - Income spent on eating out (%)
Consumer Behavior - Income spent on carryout/delivered foods (%)
Current Health Status - General health condition (%)
Current Health Status - Blood donors (%)
Current Health Status - Has blood ever tested for HIV virus (%)
Current Health Status - Left-handed people (%)
Dermatology - People using sunscreen (%)
Diabetes - Diabetics (%)
Diabetes - Had a blood test for high blood sugar (%)
Diabetes - People taking insulin (%)
Diet Behavior & Nutrition - Diet health (%)
Diet Behavior & Nutrition - Milk product consumption (# of products/month)
Diet Behavior & Nutrition - Meals not home prepared (#/week)
Diet Behavior & Nutrition - Meals from fast food or pizza place (#/week)
Diet Behavior & Nutrition - Ready-to-eat foods (#/month)
Diet Behavior & Nutrition - Frozen meals/pizza (#/month)
Drug Use - People that ever used marijuana or hashish (%)
Drug Use - Ever used hard drugs (%)
Drug Use - Ever used any form of cocaine (%)
Drug Use - Ever used heroin (%)
Drug Use - Ever used methamphetamine (%)
Health Insurance - People covered by health insurance (%)
Kidney Conditions-Urology - Avg. # of times urinating at night
Medical Conditions - People with asthma (%)
Medical Conditions - People with anemia (%)
Medical Conditions - People with psoriasis (%)
Medical Conditions - People with overweight (%)
Medical Conditions - Elderly people having difficulties in thinking or remembering (%)
Medical Conditions - People who ever received blood transfusion (%)
Medical Conditions - People having trouble seeing even with glass/contacts (%)
Medical Conditions - People with arthritis (%)
Medical Conditions - People with gout (%)
Medical Conditions - People with congestive heart failure (%)
Medical Conditions - People with coronary heart disease (%)
Medical Conditions - People with angina pectoris (%)
Medical Conditions - People who ever had heart attack (%)
Medical Conditions - People who ever had stroke (%)
Medical Conditions - People with emphysema (%)
Medical Conditions - People with thyroid problem (%)
Medical Conditions - People with chronic bronchitis (%)
Medical Conditions - People with any liver condition (%)
Medical Conditions - People who ever had cancer or malignancy (%)
Mental Health - People who have little interest in doing things (%)
Mental Health - People feeling down, depressed, or hopeless (%)
Mental Health - People who have trouble sleeping or sleeping too much (%)
Mental Health - People feeling tired or having little energy (%)
Mental Health - People with poor appetite or overeating (%)
Mental Health - People feeling bad about themself (%)
Mental Health - People who have trouble concentrating on things (%)
Mental Health - People moving or speaking slowly or too fast (%)
Mental Health - People having thoughts they would be better off dead (%)
Oral Health - Average years since last visit a dentist
Oral Health - People embarrassed because of mouth (%)
Oral Health - People with gum disease (%)
Oral Health - General health of teeth and gums (%)
Oral Health - Average days a week using dental floss/device
Oral Health - Average days a week using mouthwash for dental problem
Oral Health - Average number of teeth
Pesticide Use - Households using pesticides to control insects (%)
Pesticide Use - Households using pesticides to kill weeds (%)
Physical Activity - People doing vigorous-intensity work activities (%)
Physical Activity - People doing moderate-intensity work activities (%)
Physical Activity - People walking or bicycling (%)
Physical Activity - People doing vigorous-intensity recreational activities (%)
Physical Activity - People doing moderate-intensity recreational activities (%)
Physical Activity - Average hours a day doing sedentary activities
Physical Activity - Average hours a day watching TV or videos
Physical Activity - Average hours a day using computer
Physical Functioning - People having limitations keeping them from working (%)
Physical Functioning - People limited in amount of work they can do (%)
Physical Functioning - People that need special equipment to walk (%)
Physical Functioning - People experiencing confusion/memory problems (%)
Physical Functioning - People requiring special healthcare equipment (%)
Prescription Medications - Average number of prescription medicines taking
Preventive Aspirin Use - Adults 40+ taking low-dose aspirin (%)
Reproductive Health - Vaginal deliveries (%)
Reproductive Health - Cesarean deliveries (%)
Reproductive Health - Deliveries resulted in a live birth (%)
Reproductive Health - Pregnancies resulted in a delivery (%)
Reproductive Health - Women breastfeeding newborns (%)
Reproductive Health - Women that had a hysterectomy (%)
Reproductive Health - Women that had both ovaries removed (%)
Reproductive Health - Women that have ever taken birth control pills (%)
Reproductive Health - Women taking birth control pills (%)
Reproductive Health - Women that have ever used Depo-Provera or injectables (%)
Reproductive Health - Women that have ever used female hormones (%)
Sexual Behavior - People 18+ that ever had sex (vaginal, anal, or oral) (%)
Sexual Behavior - Males 18+ that ever had vaginal sex with a woman (%)
Sexual Behavior - Males 18+ that ever performed oral sex on a woman (%)
Sexual Behavior - Males 18+ that ever had anal sex with a woman (%)
Sexual Behavior - Males 18+ that ever had any sex with a man (%)
Sexual Behavior - Females 18+ that ever had vaginal sex with a man (%)
Sexual Behavior - Females 18+ that ever performed oral sex on a man (%)
Sexual Behavior - Females 18+ that ever had anal sex with a man (%)
Sexual Behavior - Females 18+ that ever had any kind of sex with a woman (%)
Sexual Behavior - Average age people first had sex
Sexual Behavior - Average number of female sex partners in lifetime (males 18+)
Sexual Behavior - Average number of female vaginal sex partners in lifetime (males 18+)
Sexual Behavior - Average age people first performed oral sex on a woman (18+)
Sexual Behavior - Average number of woman performed oral sex on in lifetime (18+)
Sexual Behavior - Average number of male sex partners in lifetime (males 18+)
Sexual Behavior - Average number of male anal sex partners in lifetime (males 18+)
Sexual Behavior - Average age people first performed oral sex on a man (18+)
Sexual Behavior - Average number of male oral sex partners in lifetime (18+)
Sexual Behavior - People using protection when performing oral sex (%)
Sexual Behavior - Average number of times people have vaginal or anal sex a year
Sexual Behavior - People having sex without condom (%)
Sexual Behavior - Average number of male sex partners in lifetime (females 18+)
Sexual Behavior - Average number of male vaginal sex partners in lifetime (females 18+)
Sexual Behavior - Average number of female sex partners in lifetime (females 18+)
Sexual Behavior - Circumcised males 18+ (%)
Sleep Disorders - Average hours sleeping at night
Sleep Disorders - People that has trouble sleeping (%)
Smoking-Cigarette Use - People smoking cigarettes (%)
Taste & Smell - People 40+ having problems with smell (%)
Taste & Smell - People 40+ having problems with taste (%)
Taste & Smell - People 40+ that ever had wisdom teeth removed (%)
Taste & Smell - People 40+ that ever had tonsils teeth removed (%)
Taste & Smell - People 40+ that ever had a loss of consciousness because of a head injury (%)
Taste & Smell - People 40+ that ever had a broken nose or other serious injury to face or skull (%)
Taste & Smell - People 40+ that ever had two or more sinus infections (%)
Weight - Average height (inches)
Weight - Average weight (pounds)
Weight - Average BMI
Weight - People that are obese (%)
Weight - People that ever were obese (%)
Weight - People trying to lose weight (%)
45,370 73.5% White alone 9,323 15.1% Hispanic 2,935 4.8% Two or more races 2,633 4.3% Asian alone 269 0.4% Black alone 131 0.2% Other race alone 92 0.1% American Indian alone 43 0.07% Native Hawaiian and Other
According to our research of California and other state lists, there were 9 registered sex offenders living in Encinitas, California as of April 27, 2024 . The ratio of all residents to sex offenders in Encinitas is 7,043 to 1.The ratio of registered sex offenders to all residents in this city is much lower than the state average.
Officers per 1,000 residents here:
0.02California average:
1.98
Latest news from Encinitas, CA collected exclusively by city-data.com from local newspapers, TV, and radio stations
Encinitas, CA City Guides: Ancestries: English (9.9%), Irish (8.3%), European (7.6%), German (7.6%), American (5.3%), Italian (3.0%).
Current Local Time:
Land area: 19.1 square miles.
Population density: 3,211 people per square mile (average).
7,589 residents are foreign born (3.8% Europe , 3.7% Latin America , 3.5% Asia ).
This city:
12.3%California:
26.5%
Median real estate property taxes paid for housing units with mortgages in 2022: $9,419 (0.6%)Median real estate property taxes paid for housing units with no mortgage in 2022: $5,754 (0.4%)
Nearest city with pop. 200,000+: San Diego, CA
Nearest cities:
Latitude: 33.04 N, Longitude: 117.27 W
Daytime population change due to commuting: +1,446 (+2.3%)Workers who live and work in this city: 14,226 (45.4%)
Encinitas tourist attractions:
Single-family new house construction building permits:
2022: 159 buildings , average cost: $328,2002021: 132 buildings , average cost: $197,7002020: 107 buildings , average cost: $215,4002019: 185 buildings , average cost: $197,3002018: 157 buildings , average cost: $237,5002017: 115 buildings , average cost: $280,1002016: 85 buildings , average cost: $221,3002015: 142 buildings , average cost: $281,2002014: 157 buildings , average cost: $297,3002013: 87 buildings , average cost: $280,5002012: 79 buildings , average cost: $325,1002011: 89 buildings , average cost: $274,7002010: 35 buildings , average cost: $209,4002009: 42 buildings , average cost: $212,1002008: 82 buildings , average cost: $195,1002007: 109 buildings , average cost: $298,5002006: 117 buildings , average cost: $236,2002005: 142 buildings , average cost: $259,1002004: 184 buildings , average cost: $234,8002003: 187 buildings , average cost: $274,2002002: 414 buildings , average cost: $276,3002001: 228 buildings , average cost: $274,3002000: 259 buildings , average cost: $255,8001999: 283 buildings , average cost: $261,4001998: 306 buildings , average cost: $223,6001997: 297 buildings , average cost: $200,900Unemployment in December 2023: Population change in the 1990s: +1,848 (+3.3%).
Most common occupations in Encinitas, CA (%)
Both Males Females
Other management occupations, except farmers and farm managers (6.9%)
Sales representatives, services, wholesale and manufacturing (5.0%)
Other sales and related occupations, including supervisors (4.8%)
Retail sales workers, except cashiers (3.6%)
Building and grounds cleaning and maintenance occupations (3.5%)
Computer specialists (3.5%)
Preschool, kindergarten, elementary, and middle school teachers (3.3%)
Other management occupations, except farmers and farm managers (8.2%)
Sales representatives, services, wholesale and manufacturing (5.4%)
Other sales and related occupations, including supervisors (5.4%)
Top executives (4.6%)
Computer specialists (4.6%)
Building and grounds cleaning and maintenance occupations (4.1%)
Engineers (3.8%)
Preschool, kindergarten, elementary, and middle school teachers (5.9%)
Other management occupations, except farmers and farm managers (5.4%)
Sales representatives, services, wholesale and manufacturing (4.4%)
Secretaries and administrative assistants (4.1%)
Other sales and related occupations, including supervisors (4.0%)
Registered nurses (3.9%)
Other office and administrative support workers, including supervisors (3.7%)
Earthquake activity:
Encinitas-area historical earthquake activity is significantly above California state average. It is 6107% greater than the overall U.S. average. On 6/28/1992 at 11:57:34, a magnitude 7.6 (6.2 MB, 7.6 MS, 7.3 MW, Depth: 0.7 mi, Class: Major, Intensity: VIII - XII) earthquake occurred 89.6 miles away from the city center, causing 3 deaths ( 1 shaking deaths, 2 other deaths) and 400 injuries, causing $100,000,000 total damage and $40,000,000 insured lossesOn 7/21/1952 at 11:52:14, a magnitude 7.7 (7.7 UK) earthquake occurred 167.7 miles away from the city center, causing $50,000,000 total damage On 10/16/1999 at 09:46:44, a magnitude 7.4 (6.3 MB, 7.4 MS, 7.2 MW, 7.3 ML) earthquake occurred 112.5 miles away from the city center On 5/19/1940 at 04:36:40, a magnitude 7.2 (7.2 UK) earthquake occurred 92.0 miles away from Encinitas center, causing $33,000,000 total damage On 12/31/1934 at 18:45:56, a magnitude 7.1 (7.1 UK) earthquake occurred 91.2 miles away from the city center On 10/15/1979 at 23:16:54, a magnitude 7.0 (5.7 MB, 6.9 MS, 7.0 ML, 6.4 MW) earthquake occurred 96.1 miles away from Encinitas center Magnitude types: body-wave magnitude (MB), local magnitude (ML), surface-wave magnitude (MS), moment magnitude (MW) Natural disasters: The number of natural disasters in San Diego County (39) is a lot greater than the US average (15).Major Disasters (Presidential) Declared: 21Emergencies Declared: 2Fires: 21, Floods: 17, Storms: 9, Winter Storms: 6, Landslides: 5, Mudslides: 4, Freeze: 1, Heavy Rain: 1, Hurricane: 1, Tornado: 1, Other: 1 (Note: some incidents may be assigned to more than one category). Hospitals and medical centers in Encinitas: CENTER FOR SURGERY OF ENCINITAS (477 N EL CAMINO REAL SUITE C-100) SCRIPPS MEMORIAL HOSPITAL - ENCINITAS (Voluntary non-profit - Private, 354 SANTA FE DRIVE) AVIARA HEALTHCARE CENTER (944 REGAL ROAD)
ENCINITAS NURSING AND REHABILITATION CENTER (900 SANTA FE DRIVE)
SANTA FE CONVALESCENT HOSP (944 REGAL ROAD)
SCRIPPS MEM HOSP CONTINUING CARE UNIT (354 SANTA FE DRIVE)
THE DOROTHY AND JOSEPH GOLDBERG HEALTHCARE CENTER (211 SAXONY ROAD)
ENCINITAS DIALYSIS (332 SANTA FE DRIVE, SUITE 100)
SAN DIEGO HOME HEALTHCARE SERVICES INC (511 ENCINITAS BLVD, STE 100)
Heliports located in Encinitas: Amtrak stations near Encinitas: 4 miles: SOLANA BEACH (105 S. CEDROS AVE.) Services: ticket office, fully wheelchair accessible, enclosed waiting area, public restrooms, public payphones, full-service food facilities, free short-term parking, free long-term parking, call for car rental service, taxi stand, public transit connection.
12 miles: OCEANSIDE (235 S. TREMONT ST.) Services: ticket office, fully wheelchair accessible, enclosed waiting area, public restrooms, public payphones, snack bar, free short-term parking, free long-term parking, call for car rental service, taxi stand, intercity bus service, public transit connection.
Colleges/universities with over 2000 students nearest to Encinitas:
California State University-San Marcos (about 9 miles; San Marcos, CA ; Full-time enrollment: 8,070)
Palomar College (about 9 miles; San Marcos, CA ; FT enrollment: 15,037)
National University (about 10 miles; La Jolla, CA ; FT enrollment: 24,215)
MiraCosta College (about 11 miles; Oceanside, CA ; FT enrollment: 11,189)
University of California-San Diego (about 12 miles; La Jolla, CA ; FT enrollment: 29,297)
San Diego Miramar College (about 13 miles; San Diego, CA ; FT enrollment: 5,128)
Alliant International University (about 15 miles; San Diego, CA ; FT enrollment: 3,155)
Public high schools in Encinitas: LA COSTA CANYON HIGH Students: 1,795, Location: 1 MAVERICK WAY, Grades: 9-12)SAN DIEGUITO HIGH ACADEMY Students: 1,084, Location: 800 SANTA FE DR., Grades: 9-12)SUNSET HIGH (CONTINUATION) Students: 37, Location: 684 REQUEZA ST., Grades: 9-12)NORTH COAST ALTERNATIVE HIGH Students: 21, Location: 684 REQUEZA, Grades: 7-12)Private high schools in Encinitas: THE GRAUER SCHOOL Students: 152, Location: 1500 S EL CAMINO REAL, Grades: 6-12)
PACIFIC ACADEMY Students: 16, Location: 679 ENCINITAS BLVD STE 205, Grades: 8-12)
Public elementary/middle schools in Encinitas: OAK CREST MIDDLE Students: 984, Location: 675 BALOUR DR., Grades: 7-8)DIEGUENO MIDDLE Students: 834, Location: 2150 VILLAGE PARK WAY, Grades: 7-8)PARK DALE LANE ELEMENTARY Students: 432, Location: 2050 PARK DALE LN., Grades: KG-6)CAPRI ELEMENTARY Students: 431, Location: 941 CAPRI RD., Grades: KG-6)FLORA VISTA ELEMENTARY Students: 346, Location: 1690 WANDERING RD., Grades: KG-6)PAUL ECKE-CENTRAL ELEMENTARY Students: 342, Location: 185 UNION ST., Grades: KG-6)OCEAN KNOLL ELEMENTARY Students: 292, Location: 910 MELBA RD., Grades: KG-6)Private elementary/middle schools in Encinitas: ST JOHN CATHOLIC SCHOOL Students: 534, Location: 1003 ENCINITAS BLVD, Grades: PK-8)
ENCINITAS COUNTRY DAY SCHOOL Students: 300, Location: 3616 MANCHESTER AVE, Grades: PK-8)
SANDERLING WALDORF SCHOOL Students: 180, Location: 1578 S EL CAMINO REAL, Grades: PK-6)
RANCHO ENCINITAS ACADEMY Students: 45, Location: 910 ENCINITAS BLVD, Grades: 1-8)
VILLAGE GATE CHILDREN'S ACADEMY Students: 36, Location: 1613 LAKE DR, Grades: KG-6)
EDISON ACADEMY Students: 23, Location: 910 ENCINITAS BLVD, Grades: 3-7)
See full list of schools located in Encinitas
Notable locations in Encinitas: (A) , San Dieguito Tennis Club (B) , Encinitas City Hall (C) , Encinitas Branch San Diego County Library (D) , Cardiff Branch San Diego County Library (E) , Encinitas Fire Station 3 (F) , Encinitas Fire Station 2 (G) , Encinitas Fire Station 4 (H) , Encinitas Fire Station 5 (I) , Encinitas Fire and Marine Safety Station 1 (J) . Display/hide their locations on the map
Shopping Centers: (1) , West Village Shopping Center (2) , Weigand Plaza Shopping Center (3) , Village Square Shopping Center (4) , Santa Fe Plaza Shopping Center (5) , Encinitas Village Shopping Center (6) , De la Plaza Encinitas Shopping Center (7) , Camino Real Shopping Center (8) , Cardiff-By-The-Sea Towne Centre Shopping Center (9) . Display/hide their locations on the map
Cemetery: (1) . Display/hide its location on the map
Reservoirs and swamps: (A) , San Elijo Lagoon (B) . Display/hide their locations on the map
Creek: (A) . Display/hide its location on the map
Parks in Encinitas include: (1) , Ecke Park (2) , Encinitas Beach County Park (3) , Glen Park (4) , Leucadia Park (5) , Moonlight State Beach (6) , Ponto State Beach (7) , Quail Park Botanical Garden (8) , San Elijo State Beach (9) . Display/hide their locations on the map
Tourist attractions: (1) , Encinitas Historical Society (Historical Places & Services; 650 3rd Street) (2) . Display/hide their approximate locations on the map
Hotels: (1) , Best Western Encinitas Inn (85 Encinitas Boulevard) (2) , Best Western Encinitas Inn & Suites At M (85 Encinitas Blvd) (3) . Display/hide their approximate locations on the map
Birthplace of: Chase Budinger - Basketball player, Jon Hess (fighter) - Martial artist, Aaron Goldberg (golfer) - Professional golfer, Corey Cameron - College football player (Columbia Lions), Kenny Stills - College Football player.
San Diego County has a predicted average indoor radon screening level less than 2 pCi/L (pico curies per liter) - Low Potential Average household size: This city:
2.5 peopleCalifornia:
2.9 people
Percentage of family households: This city:
62.5%Whole state:
68.7%
Percentage of households with unmarried partners: This city:
6.3%Whole state:
7.2%
Likely homosexual households (counted as self-reported same-sex unmarried-partner households)
Lesbian couples: 0.4% of all households Gay men: 0.3% of all households
People in group quarters in Encinitas in 2010:
405 people in nursing facilities/skilled-nursing facilities
93 people in other noninstitutional facilities
30 people in workers' group living quarters and job corps centers
People in group quarters in Encinitas in 2000:
393 people in nursing homes
141 people in other noninstitutional group quarters
22 people in orthopedic wards and institutions for the physically handicapped
2 people in religious group quarters
Banks with most branches in Encinitas (2011 data):
Wells Fargo Bank, National Association: Mountain Vista Branch, Encinitas Branch, North El Camino Real, Encinitas Vons Branch. Info updated 2011/04/05: Bank assets: $1,161,490.0 mil, Deposits: $905,653.0 mil, headquarters in Sioux Falls, SD, positive income , 6395 total offices , Holding Company: Wells Fargo & Company
U.S. Bank National Association: Encinitas Branch, Encinitas Santa Fe Drive Branch, Encinitas - 131 North El Camino Real. Info updated 2012/01/30: Bank assets: $330,470.8 mil, Deposits: $236,091.5 mil, headquarters in Cincinnati, OH, positive income , 3121 total offices , Holding Company: U.S. Bancorp
Union Bank, National Association: East Encinitas Branch at 247 North El Camino Real, branch established on 1986/08/14; Encinitas Branch at 200 W D Street, branch established on 1959/12/28. Info updated 2011/09/01: Bank assets: $88,967.5 mil, Deposits: $65,286.4 mil, headquarters in San Francisco, CA, positive income , Commercial Lending Specialization, 403 total offices , Holding Company: Mitsubishi Ufj Financial Group, Inc.
Bank of America, National Association: Rancho Encinitas Branch at 1340 Encinitas Boulevard, branch established on 1976/09/15. Info updated 2009/11/18: Bank assets: $1,451,969.3 mil, Deposits: $1,077,176.8 mil, headquarters in Charlotte, NC, positive income , 5782 total offices , Holding Company: Bank Of America Corporation
Sunwest Bank: Encinitas Office Branch at 499 N. El Camino Real, Suite C-100, branch established on 2005/05/18. Info updated 2011/10/24: Bank assets: $609.2 mil, Deposits: $512.4 mil, headquarters in Irvine, CA, positive income , Commercial Lending Specialization, 11 total offices , Holding Company: Western Acquisitions, L.L.c.
California Community Bank: Encinitas Office Branch at 851 S Coast Highway 101 Ste 300, branch established on 2008/06/16. Info updated 2007/05/30: Bank assets: $243.8 mil, Deposits: $217.1 mil, headquarters in Escondido, CA, positive income , Commercial Lending Specialization, 5 total offices
California Bank & Trust: Encinitas Branch at 135 Saxony Road, branch established on 1980/12/22. Info updated 2009/07/20: Bank assets: $10,894.1 mil, Deposits: $9,193.9 mil, headquarters in San Diego, CA, positive income , Commercial Lending Specialization, 109 total offices , Holding Company: Zions Bancorporation
First California Bank: Encinitas Branch at 191 N El Camino Real, Suite 202, branch established on 2005/12/05. Info updated 2011/02/22: Bank assets: $1,813.2 mil, Deposits: $1,428.5 mil, headquarters in Westlake Village, CA, positive income , Commercial Lending Specialization, 22 total offices , Holding Company: First California Financial Group, Inc.
Citibank, National Association: El Camino Real Branch at 113-A North El Camino Real, branch established on 1934/10/01. Info updated 2012/01/10: Bank assets: $1,288,658.0 mil, Deposits: $882,541.0 mil, headquarters in Sioux Falls, SD, positive income , International Specialization, 1048 total offices , Holding Company: Citigroup Inc.
3 other banks with 3 local branches
For population 15 years and over in Encinitas:
Never married: 29.0%Now married: 55.5%Separated: 1.0%Widowed: 4.3%Divorced: 10.1% For population 25 years and over in Encinitas:
High school or higher: 95.5%Bachelor's degree or higher: 64.7%Graduate or professional degree: 27.4%Unemployed: 3.0%Mean travel time to work (commute): 16.9 minutes
Education Gini index (Inequality in education) Here:
10.4California average:
15.5
Religion statistics for Encinitas, CA (based on San Diego County data)
Religion Adherents Congregations Catholic 801,850 115 Evangelical Protestant 302,320 974 Other 161,530 349 Mainline Protestant 74,992 211 Black Protestant 10,857 52 Orthodox 7,828 19 None 1,735,936 -
Source: Clifford Grammich, Kirk Hadaway, Richard Houseal, Dale E.Jones, Alexei Krindatch, Richie Stanley and Richard H.Taylor. 2012. 2010 U.S.Religion Census: Religious Congregations & Membership Study. Association of Statisticians of American Religious Bodies. Jones, Dale E., et al. 2002. Congregations and Membership in the United States 2000. Nashville, TN: Glenmary Research Center. Graphs represent county-level data
Food Environment Statistics: Number of grocery stores : 574Here :
1.94 / 10,000 pop.State :
2.14 / 10,000 pop.
Number of supercenters and club stores : 17San Diego County :
0.06 / 10,000 pop.California :
0.04 / 10,000 pop.
Number of convenience stores (no gas) : 227Here :
0.77 / 10,000 pop.California :
0.62 / 10,000 pop.
Number of convenience stores (with gas) : 487Here :
1.65 / 10,000 pop.California :
1.49 / 10,000 pop.
Number of full-service restaurants : 2,238San Diego County :
7.56 / 10,000 pop.California :
7.42 / 10,000 pop.
Adult diabetes rate : This county :
6.5%California :
7.3%
Adult obesity rate : San Diego County :
22.2%California :
21.3%
Low-income preschool obesity rate : San Diego County :
16.0%California :
17.9%
Health and Nutrition: Healthy diet rate : Encinitas:
51.9%California:
49.4%
Average overall health of teeth and gums : Encinitas:
51.4%California:
48.0%
People feeling badly about themselves : This city:
20.0%California:
20.2%
People not drinking alcohol at all : This city:
8.4%State:
11.2%
Average hours sleeping at night : This city:
6.8California:
6.8
Overweight people : Encinitas:
33.4%California:
31.5%
General health condition : This city:
59.3%State:
56.4%
Average condition of hearing : Encinitas:
80.9%California:
80.9%
More about Health and Nutrition of Encinitas, CA Residents
Local government employment and payroll (March 2022)
Function
Full-time employees
Monthly full-time payroll
Average yearly full-time wage
Part-time employees
Monthly part-time payroll
Firefighters
49 $611,030 $149,640 0 $0 Other and Unallocable
40 $368,683 $110,605 7 $9,738 Financial Administration
26 $232,730 $107,414 4 $17,894 Parks and Recreation
25 $220,740 $105,955 34 $47,623 Water Supply
20 $181,733 $109,040 0 $0 Sewerage
14 $114,306 $97,977 0 $0 Other Government Administration
14 $88,232 $75,627 10 $36,505 Housing and Community Development (Local)
13 $155,461 $143,502 2 $1,397 Streets and Highways
11 $81,103 $88,476 0 $0 Fire - Other
10 $106,509 $127,811 0 $0
Totals for Government
222 $2,160,526 $116,785 57 $113,157
Encinitas government finances - Expenditure in 2017 (per resident):
Construction - Central Staff Services: $17,308,000 ($282.03)
Regular Highways: $3,868,000 ($63.03)Parks and Recreation: $797,000 ($12.99)Housing and Community Development: $422,000 ($6.88)Current Operations - Police Protection: $13,567,000 ($221.07)
Water Utilities: $12,894,000 ($210.11)Central Staff Services: $12,569,000 ($204.81)Local Fire Protection: $12,528,000 ($204.14)Parks and Recreation: $8,295,000 ($135.17)Regular Highways: $5,398,000 ($87.96)Protective Inspection and Regulation - Other: $5,044,000 ($82.19)Sewerage: $3,755,000 ($61.19)Financial Administration: $3,528,000 ($57.49)Housing and Community Development: $1,657,000 ($27.00)Health - Other: $1,369,000 ($22.31)Solid Waste Management: $440,000 ($7.17)General - Other: $147,000 ($2.40)General - Interest on Debt: $3,450,000 ($56.22)
Intergovernmental to Local - Other - Police Protection: $12,583,000 ($205.04)
Other - Water Utilities: $8,274,000 ($134.82)Other - Sewerage: $6,229,000 ($101.50)Other - Health - Other: $390,000 ($6.36)Other - Local Fire Protection: $256,000 ($4.17)Other - General - Other: $254,000 ($4.14)Other - Central Staff Services: $239,000 ($3.89)Other Capital Outlay - Parks and Recreation: $1,887,000 ($30.75)
General - Other: $875,000 ($14.26)General Public Building: $584,000 ($9.52)Local Fire Protection: $371,000 ($6.05)Libraries: $216,000 ($3.52)Health - Other: $48,000 ($0.78)Regular Highways: $47,000 ($0.77)Protective Inspection and Regulation - Other: $6,000 ($0.10)Central Staff Services: $2,000 ($0.03)Total Salaries and Wages: $3,238,000 ($52.76)
Water Utilities - Interest on Debt: $367,000 ($5.98)
Encinitas government finances - Revenue in 2017 (per resident):
Charges - Sewerage: $7,648,000 ($124.62)
Other: $6,149,000 ($100.20)Parks and Recreation: $1,340,000 ($21.84)Regular Highways: $1,129,000 ($18.40)Solid Waste Management: $445,000 ($7.25)Housing and Community Development: $220,000 ($3.58)Federal Intergovernmental - Housing and Community Development: $1,470,000 ($23.95)
Other: $71,000 ($1.16)Local Intergovernmental - Other: $1,942,000 ($31.64)
Housing and Community Development: $106,000 ($1.73)Miscellaneous - General Revenue - Other: $1,633,000 ($26.61)
Interest Earnings: $1,509,000 ($24.59)Fines and Forfeits: $850,000 ($13.85)Special Assessments: $575,000 ($9.37)Donations From Private Sources: $145,000 ($2.36)Sale of Property: $7,000 ($0.11)Revenue - Water Utilities: $14,800,000 ($241.16)
Transit Utilities: $1,670,000 ($27.21)State Intergovernmental - Highways: $1,194,000 ($19.46)
General Local Government Support: $260,000 ($4.24)Other: $193,000 ($3.14)Water Utilities: $7,000 ($0.11)Tax - Property: $43,675,000 ($711.68)
General Sales and Gross Receipts: $12,550,000 ($204.50)Public Utilities Sales: $2,546,000 ($41.49)Other Selective Sales: $2,208,000 ($35.98)Documentary and Stock Transfer: $520,000 ($8.47)Other License: $251,000 ($4.09)
Encinitas government finances - Debt in 2017 (per resident):
Long Term Debt - Beginning Outstanding - Unspecified Public Purpose: $64,931,000 ($1058.04)
Outstanding Unspecified Public Purpose: $60,800,000 ($990.73)Retired Unspecified Public Purpose: $4,131,000 ($67.31)
Encinitas government finances - Cash and Securities in 2017 (per resident):
Bond Funds - Cash and Securities: $28,450,000 ($463.59)
Other Funds - Cash and Securities: $122,543,000 ($1996.82)
Sinking Funds - Cash and Securities: $794,000 ($12.94)
5.18% of this county's 2021 resident taxpayers lived in other counties in 2020 ($90,734 average adjusted gross income )
Here:
5.18%California average:
5.19%
0.14% of residents moved from foreign countries ($1,493 average AGI )San Diego County:
0.14%California average:
0.03%
Top counties from which taxpayers relocated into this county between 2020 and 2021:
5.71% of this county's 2020 resident taxpayers moved to other counties in 2021 ($83,556 average adjusted gross income )
Here:
5.71%California average:
6.14%
0.09% of residents moved to foreign countries ($1,067 average AGI )San Diego County:
0.09%California average:
0.02%
Top counties to which taxpayers relocated from this county between 2020 and 2021:
Businesses in Encinitas, CA
Name Count Name Count
24 Hour Fitness 1 Little Caesars Pizza 1 7-Eleven 5 MasterBrand Cabinets 2 99 Cents Only Stores 1 McDonald's 2 AT&T 1 Men's Wearhouse 1 Ace Hardware 1 New Balance 3 AutoZone 1 Nike 12 BMW 1 Office Depot 1 Barnes & Noble 1 Panda Express 1 Best Western 1 Papa John's Pizza 1 Blockbuster 2 Payless 1 Burger King 1 PetSmart 1 CVS 2 Pier 1 Imports 1 Carl\s Jr. 1 Pizza Hut 1 Chipotle 1 Quiznos 2 Cricket Wireless 1 RadioShack 1 Curves 1 Rite Aid 2 DHL 1 Safeway 1 Dairy Queen 1 Sprint Nextel 1 Days Inn 1 Staples 1 Dennys 1 Starbucks 5 Discount Tire 1 Subway 6 Econo Lodge 1 T-Mobile 3 El Pollo Loco 1 T.J.Maxx 1 Famous Footwear 1 Taco Bell 1 FedEx 11 Target 1 GNC 1 The Athlete's Foot 1 GameStop 1 Trader Joe's 1 H&R Block 1 U-Haul 1 Home Depot 1 UPS 11 Howard Johnson 1 Vans 5 Jack In The Box 1 Verizon Wireless 2 Jamba Juice 1 Volkswagen 1 Jones New York 2 Vons 2 KFC 1 Walgreens 1 Kroger 1 Wendy's 1 LA Fitness 1 YMCA 1
Strongest AM radio stations in Encinitas:
KPRZ (1210 AM; 20 kW; SAN MARCOS, CA; Owner: RADIO 1210, INC.)
KFMB (760 AM; 50 kW; SAN DIEGO, CA; Owner: MIDWEST TELEVISION, INC.)
KCBQ (1170 AM; 50 kW; SAN DIEGO, CA; Owner: RADIO 1210, INC.)
KSDO (1130 AM; 10 kW; SAN DIEGO, CA; Owner: HI-FAVOR BROADCASTING, LLC)
KCEO (1000 AM; 2 kW; VISTA, CA; Owner: NORTH COUNTY BROADCASTING CORPORATIO)
KFI (640 AM; 50 kW; LOS ANGELES, CA; Owner: CAPSTAR TX LIMITED PARTNERSHIP)
KPLS (830 AM; 50 kW; ORANGE, CA; Owner: CRN LICENSES, LLC)
KOGO (600 AM; 5 kW; SAN DIEGO, CA; Owner: CITICASTERS LICENSES, L.P.)
KLAC (570 AM; 50 kW; LOS ANGELES, CA; Owner: AMFM RADIO LICENSES, L.L.C.)
KECR (910 AM; 5 kW; EL CAJON, CA; Owner: FAMILY STATIONS, INC.)
KTNQ (1020 AM; 50 kW; LOS ANGELES, CA; Owner: KTNQ-AM LICENSE CORP.)
KURS (1040 AM; 5 kW; SAN DIEGO, CA; Owner: QUETZAL BILINGUAL COMMUNICATIONS INC)
KXTA (1150 AM; 50 kW; LOS ANGELES, CA; Owner: CITICASTERS LICENSES, L.P.)
Strongest FM radio stations in Encinitas:
KPRI (102.1 FM; ENCINITAS, CA; Owner: COMPASS RADIO OF SAN DIEGO, INC.)
KFSD-FM (92.1 FM; ESCONDIDO, CA; Owner: NORTH COUNTY BROADCASTING CORP.)
KLQV (102.9 FM; SAN DIEGO, CA; Owner: HBC LICENSE CORPORATION)
KWVE (107.9 FM; SAN CLEMENTE, CA; Owner: CALVARY CHAPEL OF COSTA MESA)
KPBS-FM (89.5 FM; SAN DIEGO, CA; Owner: THE BD. OF TRUSTEES, CALIFORNIA STATE UNIVERSITY)
KRTM (88.9 FM; TEMECULA, CA; Owner: PENFOLD COMMUNICATIONS, INC.)
KBZT (94.9 FM; SAN DIEGO, CA; Owner: JEFFERSON-PILOT COMMUNICATIONS COMPANY OF CALIFORNIA)
KYXY (96.5 FM; SAN DIEGO, CA; Owner: INFINITY RADIO OPERATIONS INC.)
KIFM (98.1 FM; SAN DIEGO, CA; Owner: JEFFERSON-PILOT COMMUNICATIONS COMPANY OF CALIFORNIA)
KHTS-FM (93.3 FM; EL CAJON, CA; Owner: CITICASTERS LICENSES, L.P.)
KGB-FM (101.5 FM; SAN DIEGO, CA; Owner: CITICASTERS LICENSES, L.P.)
KOCL (95.7 FM; CARLSBAD, CA; Owner: CITICASTERS LICENSES, L.P.)
KSON-FM (97.3 FM; SAN DIEGO, CA; Owner: JEFFERSON-PILOT COMMUNICATIONS COMPANY OF CALIFORNIA)
KMYI (94.1 FM; SAN DIEGO, CA; Owner: CITICASTERS LICENSES, L.P.)
KFMB-FM (100.7 FM; SAN DIEGO, CA; Owner: MIDWEST TELEVISION, INC.)
K210CL (89.9 FM; LEMON GROVE, CA; Owner: SANTA MONICA COMMUNITY COLLEGE DISTRICT)
KLVJ (100.1 FM; JULIAN, CA; Owner: EDUCATIONAL MEDIA FOUNDATION)
KPLN (103.7 FM; SAN DIEGO, CA; Owner: INFINITY RADIO OPERATIONS INC.)
KLNV (106.5 FM; SAN DIEGO, CA; Owner: HBC LICENSE CORPORATION)
KLRD (90.1 FM; YUCAIPA, CA; Owner: EDUCATIONAL MEDIA FOUNDATION)
TV broadcast stations around Encinitas:
K26FA (Channel 26; VISTA, CA; Owner: RICK D'AMICO)
KBOP-LP (Channel 25; SAN DIEGO, CA; Owner: COMMERCIAL BROADCASTING CORP.)
K63EN (Channel 63; SAN DIEGO, CA; Owner: CIVIC LIGHT, INC.)
KFMB-TV (Channel 8; SAN DIEGO, CA; Owner: MIDWEST TELEVISION, INC.)
K59AL (Channel 59; LA JOLLA, CA; Owner: BOARD OF TRUSTEES FOR SAN DIEGO UNIVERSITY)
KGTV (Channel 10; SAN DIEGO, CA; Owner: MCGRAW-HILL BROADCASTING COMPANY, INC.)
K61GH (Channel 61; NATIONAL CITY, CA; Owner: TV-61 SAN DIEGO, INC.)
KBNT-CA (Channel 17; SAN DIEGO, CA; Owner: ENTRAVISION HOLDINGS, L.L.C.)
K35DG (Channel 35; LA JOLLA, CA; Owner: THE REGENTS OF THE UNIV. OF CALIFORNIA)
KNSD-LP (Channel 62; LA JOLLA, CA; Owner: STATION VENTURE OPERATIONS, LP)
Home Mortgage Disclosure Act Aggregated Statistics For Year 2009(Based on 10 full and 6 partial tracts) A) FHA, FSA/RHS & VA B) Conventional C) Refinancings D) Home Improvement Loans E) Loans on Dwellings For 5+ Families F) Non-occupant Loans on G) Loans On Manufactured Number Average Value Number Average Value Number Average Value Number Average Value Number Average Value Number Average Value Number Average Value
LOANS ORIGINATED 98 $470,041 414 $488,949 2,159 $383,843 68 $345,513 1 $1,194,900 181 $391,889 5 $468,680 APPLICATIONS APPROVED, NOT ACCEPTED 6 $425,908 52 $519,454 228 $415,860 6 $179,123 0 $0 25 $315,572 1 $250,000 APPLICATIONS DENIED 17 $446,644 66 $551,122 512 $478,236 29 $303,237 1 $16,577,000 62 $420,220 2 $240,000 APPLICATIONS WITHDRAWN 20 $479,127 69 $502,604 328 $427,154 15 $202,937 2 $907,620 37 $395,186 2 $279,000 FILES CLOSED FOR INCOMPLETENESS 3 $320,187 15 $556,046 105 $421,192 5 $224,866 0 $0 5 $487,588 0 $0
Aggregated Statistics For Year 2008(Based on 10 full and 6 partial tracts) A) FHA, FSA/RHS & VA B) Conventional C) Refinancings D) Home Improvement Loans E) Loans on Dwellings For 5+ Families F) Non-occupant Loans on G) Loans On Manufactured Number Average Value Number Average Value Number Average Value Number Average Value Number Average Value Number Average Value Number Average Value
LOANS ORIGINATED 22 $427,810 436 $523,606 829 $445,108 45 $362,757 5 $8,417,410 151 $471,841 3 $104,000 APPLICATIONS APPROVED, NOT ACCEPTED 4 $564,542 92 $562,836 168 $477,593 9 $155,540 0 $0 30 $377,803 5 $55,468 APPLICATIONS DENIED 7 $471,966 115 $625,939 355 $531,803 35 $321,935 2 $591,565 62 $508,079 3 $56,513 APPLICATIONS WITHDRAWN 7 $412,560 81 $604,201 196 $462,055 23 $489,362 1 $772,700 55 $499,348 2 $175,490 FILES CLOSED FOR INCOMPLETENESS 2 $393,000 24 $641,943 65 $478,930 8 $437,154 0 $0 7 $480,203 0 $0
Aggregated Statistics For Year 2007(Based on 10 full and 6 partial tracts) B) Conventional C) Refinancings D) Home Improvement Loans E) Loans on Dwellings For 5+ Families F) Non-occupant Loans on G) Loans On Manufactured Number Average Value Number Average Value Number Average Value Number Average Value Number Average Value Number Average Value
LOANS ORIGINATED 817 $530,279 1,205 $505,076 88 $408,304 5 $1,167,882 271 $530,574 6 $185,007 APPLICATIONS APPROVED, NOT ACCEPTED 129 $590,089 267 $539,091 24 $401,306 0 $0 41 $572,637 5 $64,962 APPLICATIONS DENIED 196 $538,038 536 $587,729 44 $304,643 0 $0 85 $485,082 9 $83,984 APPLICATIONS WITHDRAWN 105 $660,450 233 $540,527 20 $406,584 0 $0 36 $545,848 2 $254,500 FILES CLOSED FOR INCOMPLETENESS 19 $647,158 77 $493,116 7 $595,451 0 $0 9 $472,464 0 $0
Aggregated Statistics For Year 2006(Based on 10 full and 6 partial tracts) A) FHA, FSA/RHS & VA B) Conventional C) Refinancings D) Home Improvement Loans E) Loans on Dwellings For 5+ Families F) Non-occupant Loans on G) Loans On Manufactured Number Average Value Number Average Value Number Average Value Number Average Value Number Average Value Number Average Value Number Average Value
LOANS ORIGINATED 1 $266,000 953 $547,766 1,699 $492,930 143 $371,085 11 $1,197,977 293 $513,065 7 $186,046 APPLICATIONS APPROVED, NOT ACCEPTED 0 $0 187 $566,127 287 $500,703 28 $262,602 0 $0 44 $550,796 7 $100,429 APPLICATIONS DENIED 1 $152,000 264 $552,053 489 $569,266 64 $298,802 0 $0 76 $682,410 6 $79,285 APPLICATIONS WITHDRAWN 0 $0 144 $557,403 334 $479,162 20 $371,152 2 $2,017,500 40 $474,367 0 $0 FILES CLOSED FOR INCOMPLETENESS 0 $0 30 $459,446 74 $574,292 8 $468,365 1 $451,000 9 $447,460 0 $0
Aggregated Statistics For Year 2005(Based on 10 full and 6 partial tracts) B) Conventional C) Refinancings D) Home Improvement Loans E) Loans on Dwellings For 5+ Families F) Non-occupant Loans on G) Loans On Manufactured Number Average Value Number Average Value Number Average Value Number Average Value Number Average Value Number Average Value
LOANS ORIGINATED 1,198 $545,360 2,215 $461,631 220 $378,227 17 $1,800,346 383 $457,996 6 $163,098 APPLICATIONS APPROVED, NOT ACCEPTED 207 $552,067 321 $474,666 26 $314,141 0 $0 55 $491,193 9 $90,106 APPLICATIONS DENIED 270 $528,285 478 $503,149 59 $289,916 2 $775,000 82 $523,831 5 $87,400 APPLICATIONS WITHDRAWN 198 $551,706 403 $477,357 46 $397,780 1 $560,000 58 $514,681 3 $218,020 FILES CLOSED FOR INCOMPLETENESS 49 $567,514 152 $521,121 5 $398,502 0 $0 18 $450,856 0 $0
Aggregated Statistics For Year 2004(Based on 10 full and 6 partial tracts) A) FHA, FSA/RHS & VA B) Conventional C) Refinancings D) Home Improvement Loans E) Loans on Dwellings For 5+ Families F) Non-occupant Loans on G) Loans On Manufactured Number Average Value Number Average Value Number Average Value Number Average Value Number Average Value Number Average Value Number Average Value
LOANS ORIGINATED 1 $205,000 1,278 $498,653 3,038 $392,510 163 $291,796 16 $1,187,065 508 $388,872 7 $94,293 APPLICATIONS APPROVED, NOT ACCEPTED 0 $0 237 $492,130 374 $378,104 26 $268,163 2 $775,000 62 $377,398 9 $129,759 APPLICATIONS DENIED 1 $207,540 275 $538,066 536 $437,635 56 $226,774 1 $719,000 85 $479,394 10 $72,062 APPLICATIONS WITHDRAWN 0 $0 224 $521,784 497 $380,797 42 $246,617 1 $1,970,000 48 $387,427 3 $136,667 FILES CLOSED FOR INCOMPLETENESS 0 $0 37 $468,465 146 $380,533 7 $155,194 0 $0 12 $493,627 1 $59,170
Aggregated Statistics For Year 2003(Based on 10 full and 6 partial tracts) A) FHA, FSA/RHS & VA B) Conventional C) Refinancings D) Home Improvement Loans E) Loans on Dwellings For 5+ Families F) Non-occupant Loans on Number Average Value Number Average Value Number Average Value Number Average Value Number Average Value Number Average Value
LOANS ORIGINATED 16 $215,625 1,630 $409,701 6,858 $306,941 89 $156,744 10 $2,318,963 780 $301,479 APPLICATIONS APPROVED, NOT ACCEPTED 2 $143,000 243 $385,774 769 $305,647 12 $70,482 1 $517,790 93 $312,808 APPLICATIONS DENIED 1 $280,000 248 $413,174 788 $352,265 39 $84,051 1 $533,000 109 $332,038 APPLICATIONS WITHDRAWN 2 $263,500 209 $424,747 848 $304,912 28 $177,541 2 $6,967,285 67 $308,620 FILES CLOSED FOR INCOMPLETENESS 1 $100,000 56 $436,142 204 $344,236 4 $71,402 0 $0 27 $283,393
Aggregated Statistics For Year 2002(Based on 4 full and 3 partial tracts) A) FHA, FSA/RHS & VA B) Conventional C) Refinancings D) Home Improvement Loans E) Loans on Dwellings For 5+ Families F) Non-occupant Loans on Number Average Value Number Average Value Number Average Value Number Average Value Number Average Value Number Average Value
LOANS ORIGINATED 9 $208,889 665 $401,767 2,657 $311,702 29 $152,239 1 $430,000 230 $366,748 APPLICATIONS APPROVED, NOT ACCEPTED 1 $246,150 76 $398,361 350 $309,221 16 $62,709 0 $0 21 $290,534 APPLICATIONS DENIED 2 $158,000 79 $346,264 304 $341,169 22 $120,220 0 $0 30 $269,032 APPLICATIONS WITHDRAWN 0 $0 79 $390,716 301 $302,167 10 $77,281 1 $3,600,000 21 $263,456 FILES CLOSED FOR INCOMPLETENESS 0 $0 25 $384,637 124 $316,064 1 $300,000 0 $0 2 $235,355
Aggregated Statistics For Year 2001(Based on 4 full and 3 partial tracts) A) FHA, FSA/RHS & VA B) Conventional C) Refinancings D) Home Improvement Loans E) Loans on Dwellings For 5+ Families F) Non-occupant Loans on Number Average Value Number Average Value Number Average Value Number Average Value Number Average Value Number Average Value
LOANS ORIGINATED 11 $213,660 551 $305,967 1,665 $291,827 62 $94,351 1 $750,000 135 $227,835 APPLICATIONS APPROVED, NOT ACCEPTED 1 $215,000 77 $309,873 286 $283,874 15 $80,212 0 $0 14 $238,355 APPLICATIONS DENIED 1 $208,000 75 $343,293 284 $308,638 24 $74,935 0 $0 14 $296,992 APPLICATIONS WITHDRAWN 3 $255,527 54 $277,543 232 $264,712 14 $115,404 1 $1,800,000 10 $195,787 FILES CLOSED FOR INCOMPLETENESS 0 $0 15 $332,535 94 $321,236 1 $141,820 1 $941,010 2 $241,000
Aggregated Statistics For Year 2000(Based on 4 full and 3 partial tracts) A) FHA, FSA/RHS & VA B) Conventional C) Refinancings D) Home Improvement Loans E) Loans on Dwellings For 5+ Families F) Non-occupant Loans on Number Average Value Number Average Value Number Average Value Number Average Value Number Average Value Number Average Value
LOANS ORIGINATED 15 $163,133 638 $318,409 370 $238,169 74 $69,572 0 $0 83 $259,602 APPLICATIONS APPROVED, NOT ACCEPTED 2 $159,500 98 $326,173 70 $222,528 21 $55,218 0 $0 10 $241,291 APPLICATIONS DENIED 0 $0 105 $313,538 146 $257,804 23 $40,189 1 $13,626,690 4 $472,325 APPLICATIONS WITHDRAWN 2 $142,495 80 $355,544 98 $173,339 15 $81,571 0 $0 14 $345,957 FILES CLOSED FOR INCOMPLETENESS 0 $0 34 $288,969 44 $277,780 1 $102,420 0 $0 6 $305,725
Aggregated Statistics For Year 1999(Based on 6 full and 5 partial tracts) A) FHA, FSA/RHS & VA B) Conventional C) Refinancings D) Home Improvement Loans E) Loans on Dwellings For 5+ Families F) Non-occupant Loans on Number Average Value Number Average Value Number Average Value Number Average Value Number Average Value Number Average Value
LOANS ORIGINATED 51 $167,601 1,499 $242,069 1,899 $219,108 116 $77,651 11 $879,121 277 $193,502 APPLICATIONS APPROVED, NOT ACCEPTED 3 $152,650 202 $250,194 381 $209,464 24 $45,745 0 $0 50 $171,849 APPLICATIONS DENIED 4 $133,710 255 $254,868 482 $230,943 49 $55,871 3 $1,695,907 64 $206,441 APPLICATIONS WITHDRAWN 7 $138,980 232 $237,755 337 $209,469 15 $99,000 2 $1,459,000 34 $182,118 FILES CLOSED FOR INCOMPLETENESS 1 $205,000 50 $276,128 108 $236,685 3 $32,410 3 $342,093 15 $223,470
Detailed mortgage data for all 16 tracts in Encinitas, CA
Private Mortgage Insurance Companies Aggregated Statistics For Year 2009(Based on 9 full and 3 partial tracts) A) Conventional B) Refinancings C) Non-occupant Loans on Number Average Value Number Average Value Number Average Value
LOANS ORIGINATED 30 $398,775 5 $439,196 0 $0 APPLICATIONS APPROVED, NOT ACCEPTED 8 $370,529 4 $482,418 2 $162,000 APPLICATIONS DENIED 9 $323,111 9 $452,718 0 $0 APPLICATIONS WITHDRAWN 1 $485,000 3 $468,000 0 $0 FILES CLOSED FOR INCOMPLETENESS 2 $457,555 1 $301,000 0 $0
Aggregated Statistics For Year 2008(Based on 9 full and 4 partial tracts) A) Conventional B) Refinancings C) Non-occupant Loans on Number Average Value Number Average Value Number Average Value
LOANS ORIGINATED 35 $454,253 6 $314,187 2 $375,000 APPLICATIONS APPROVED, NOT ACCEPTED 13 $379,440 6 $414,245 1 $408,000 APPLICATIONS DENIED 14 $558,551 1 $745,000 1 $255,000 APPLICATIONS WITHDRAWN 5 $459,582 0 $0 0 $0 FILES CLOSED FOR INCOMPLETENESS 0 $0 0 $0 0 $0
Aggregated Statistics For Year 2007(Based on 9 full and 3 partial tracts) A) Conventional B) Refinancings C) Non-occupant Loans on Number Average Value Number Average Value Number Average Value
LOANS ORIGINATED 17 $439,276 7 $430,913 4 $420,150 APPLICATIONS APPROVED, NOT ACCEPTED 0 $0 1 $667,000 0 $0 APPLICATIONS DENIED 0 $0 1 $365,000 0 $0 APPLICATIONS WITHDRAWN 1 $595,600 0 $0 1 $595,600 FILES CLOSED FOR INCOMPLETENESS 0 $0 0 $0 0 $0
Aggregated Statistics For Year 2006(Based on 7 full and 2 partial tracts) A) Conventional B) Refinancings C) Non-occupant Loans on D) Loans On Manufactured Number Average Value Number Average Value Number Average Value Number Average Value
LOANS ORIGINATED 9 $459,029 5 $418,244 0 $0 1 $295,000 APPLICATIONS APPROVED, NOT ACCEPTED 0 $0 1 $402,470 0 $0 1 $295,000 APPLICATIONS DENIED 1 $428,920 0 $0 1 $428,920 0 $0 APPLICATIONS WITHDRAWN 0 $0 2 $491,500 0 $0 0 $0 FILES CLOSED FOR INCOMPLETENESS 0 $0 0 $0 0 $0 0 $0
Aggregated Statistics For Year 2005(Based on 6 full and 5 partial tracts) A) Conventional B) Refinancings C) Non-occupant Loans on Number Average Value Number Average Value Number Average Value
LOANS ORIGINATED 4 $410,418 3 $539,723 1 $240,750 APPLICATIONS APPROVED, NOT ACCEPTED 2 $570,500 4 $283,055 0 $0 APPLICATIONS DENIED 0 $0 0 $0 0 $0 APPLICATIONS WITHDRAWN 1 $338,000 1 $404,000 0 $0 FILES CLOSED FOR INCOMPLETENESS 0 $0 0 $0 0 $0
Aggregated Statistics For Year 2004(Based on 10 full and 3 partial tracts) A) Conventional B) Refinancings C) Non-occupant Loans on Number Average Value Number Average Value Number Average Value
LOANS ORIGINATED 13 $430,625 6 $423,050 4 $348,028 APPLICATIONS APPROVED, NOT ACCEPTED 7 $322,389 1 $345,610 1 $155,870 APPLICATIONS DENIED 2 $993,000 0 $0 0 $0 APPLICATIONS WITHDRAWN 1 $338,000 0 $0 1 $338,000 FILES CLOSED FOR INCOMPLETENESS 1 $465,000 0 $0 0 $0
Aggregated Statistics For Year 2003(Based on 10 full and 6 partial tracts) A) Conventional B) Refinancings C) Non-occupant Loans on Number Average Value Number Average Value Number Average Value
LOANS ORIGINATED 40 $323,896 21 $322,502 5 $264,600 APPLICATIONS APPROVED, NOT ACCEPTED 11 $319,419 12 $335,499 1 $351,000 APPLICATIONS DENIED 0 $0 0 $0 0 $0 APPLICATIONS WITHDRAWN 6 $300,133 1 $277,990 0 $0 FILES CLOSED FOR INCOMPLETENESS 0 $0 0 $0 0 $0
Aggregated Statistics For Year 2002(Based on 4 full and 3 partial tracts) A) Conventional B) Refinancings C) Non-occupant Loans on Number Average Value Number Average Value Number Average Value
LOANS ORIGINATED 33 $300,567 11 $335,316 1 $252,230 APPLICATIONS APPROVED, NOT ACCEPTED 10 $368,362 10 $356,180 0 $0 APPLICATIONS DENIED 0 $0 0 $0 0 $0 APPLICATIONS WITHDRAWN 4 $367,735 2 $401,165 2 $385,000 FILES CLOSED FOR INCOMPLETENESS 0 $0 0 $0 0 $0
Aggregated Statistics For Year 2001(Based on 4 full and 3 partial tracts) A) Conventional B) Refinancings C) Non-occupant Loans on Number Average Value Number Average Value Number Average Value
LOANS ORIGINATED 43 $276,326 20 $255,548 3 $256,867 APPLICATIONS APPROVED, NOT ACCEPTED 9 $284,352 3 $286,357 0 $0 APPLICATIONS DENIED 3 $337,333 1 $343,540 0 $0 APPLICATIONS WITHDRAWN 1 $455,390 5 $303,690 0 $0 FILES CLOSED FOR INCOMPLETENESS 0 $0 0 $0 0 $0
Aggregated Statistics For Year 2000(Based on 4 full and 3 partial tracts) A) Conventional B) Refinancings C) Non-occupant Loans on Number Average Value Number Average Value Number Average Value
LOANS ORIGINATED 55 $262,475 14 $241,778 2 $195,230 APPLICATIONS APPROVED, NOT ACCEPTED 8 $220,846 1 $329,450 0 $0 APPLICATIONS DENIED 5 $282,532 1 $414,880 0 $0 APPLICATIONS WITHDRAWN 0 $0 0 $0 0 $0 FILES CLOSED FOR INCOMPLETENESS 0 $0 0 $0 0 $0
Aggregated Statistics For Year 1999(Based on 6 full and 5 partial tracts) A) Conventional B) Refinancings C) Non-occupant Loans on Number Average Value Number Average Value Number Average Value
LOANS ORIGINATED 199 $229,807 47 $196,951 6 $176,288 APPLICATIONS APPROVED, NOT ACCEPTED 30 $249,624 22 $247,115 3 $154,397 APPLICATIONS DENIED 13 $247,976 8 $215,348 2 $278,285 APPLICATIONS WITHDRAWN 11 $245,014 4 $337,848 0 $0 FILES CLOSED FOR INCOMPLETENESS 4 $212,802 0 $0 0 $0
Fire-safe hotels and motels in Encinitas, California:
Econo Lodge Encinitas, 410 N Coast Hwy 101, Encinitas, California 92024 Phone: (760) 436-4999, Fax: (760) 943-9321
Leucadia Beach Motel, 1322 N Hwy 101, Encinitas, California 92024 Phone: (760) 943-7461
Quality Inn Encinitas, 607 Leucadia Blvd, Encinitas, California 92024 Phone: (760) 944-3800, Fax: (760) 944-6217
Portofino Inn, 186 N Hwy 101, Encinitas, California 92024 Phone: (760) 944-0301, Fax: (760) 944-0642
All 4 fire-safe hotels and motels in Encinitas, California
Most common first names in Encinitas, CA among deceased individuals Name Count Lived (average)
John 207 76.5 years Mary 158 81.0 years Robert 153 73.5 years William 152 76.9 years James 133 72.6 years Helen 112 82.2 years Charles 100 75.8 years Margaret 93 83.1 years Dorothy 90 82.3 years Ruth 86 80.5 years
Most common last names in Encinitas, CA among deceased individuals Last name Count Lived (average)
Smith 58 78.7 years Miller 54 78.5 years Johnson 44 79.7 years Brown 35 78.8 years Wilson 32 78.3 years Jones 32 81.1 years Williams 31 77.5 years Davis 31 79.1 years Anderson 31 80.5 years Taylor 27 75.5 years
Encinitas compared to California state average:
Median household income above state average. Median house value above state average. Unemployed percentage significantly below state average. Black race population percentage significantly below state average. Hispanic race population percentage below state average. Median age significantly above state average. Foreign-born population percentage below state average. Length of stay since moving in significantly above state average. Percentage of population with a bachelor's degree or higher significantly above state average.
#5 on the list of "Top 101 cities with largest percentage of males in occupations: sales and related occupations (population 50,000+)"
#6 on the list of "Top 101 cities with the highest percentage of workers working at home, population 50,000+"
#18 on the list of "Top 101 cities with largest percentage of males in occupations: arts, design, entertainment, sports, and media occupations (population 50,000+)"
#23 on the list of "Top 100 cities with highest median house value (pop. 50,000+)"
#24 on the list of "Top 101 cities with largest percentage of males in industries: real estate and rental and leasing (population 50,000+)"
#25 on the list of "Top 101 cities with largest percentage of females in industries: arts, entertainment, and recreation (population 50,000+)"
#30 on the list of "Top 101 cities with the smallest differences between morning and afternoon humidity (population 50,000+)"
#30 on the list of "Top 101 cities with the smallest humidity differences during a year (population 50,000+)"
#30 on the list of "Top 101 cities with the largest city-data.com crime index increase from 2011 to 2012 (population 50,000+)"
#36 on the list of "Top 101 cities with largest percentage of males in occupations: health diagnosing and treating practitioners and other technical occupations (population 50,000+)"
#36 on the list of "Top 101 cities with largest percentage of males in occupations: legal occupations (population 50,000+)"
#40 on the list of "Top 101 cities with the lowest average snowfall in a year (population 50,000+)"
#40 on the list of "Top 101 cities with largest percentage of males in occupations: life, physical, and social science occupations (population 50,000+)"
#41 on the list of "Top 101 cities with the most people having professional degrees (population 50,000+)"
#41 on the list of "Top 101 cities with largest percentage of females in industries: professional, scientific, and technical services (population 50,000+)"
#43 on the list of "Top 100 cities with highest ratio of median house value to median household income (pop. 50,000+)"
#47 on the list of "Top 101 cities with largest percentage of females in occupations: arts, design, entertainment, sports, and media occupations (population 50,000+)"
#48 on the list of "Top 101 cities with largest percentage of females in industries: wholesale trade (population 50,000+)"
#50 on the list of "Top 101 cities with largest percentage of males in industries: professional, scientific, and technical services (population 50,000+)"
#51 on the list of "Top 101 cities with the most people having Doctorate degrees (population 50,000+)"
#16 (92091) on the list of "Top 101 zip codes with the largest percentage of taxpayers reporting taxable interest in 2012 (pop 1,000+)"
#18 (92091) on the list of "Top 101 zip codes with the largest percentage of taxpayers reporting net capital gain/loss in 2012 (pop 1,000+)"
#29 (92091) on the list of "Top 101 zip codes with the largest percentage of taxpayers using charity contributions deductions in 2012 (pop 1,000+)"
#97 (92091) on the list of "Top 101 zip codes with the smallest percentage of returns reporting salary or wage in 2012 (pop 1,000+)"
#4 on the list of "Top 101 counties with the most Catholic adherents"
#4 on the list of "Top 101 counties with the highest lead air pollution readings in 2012 (µg/m3 )"
#7 on the list of "Top 101 counties with the most Evangelical Protestant congregations"
#7 on the list of "Top 101 counties with the most Catholic congregations"
#7 on the list of "Top 101 counties with the highest surface withdrawal of fresh water for public supply (pop. 50,000+)"
Top Patent Applicants
Eric E. Swayze (117)
Gwendolyn Denise Barriac (107)
Peter C. Simpson (103)
Charles E. Golden (101)
Timothy Gallagher (93)
Todd P. Beach (74)
Mark Brister (69)
David J. Ecker (67)
Jason Blain (60)
Paul Mcpherson (58)
Total of 4616 patent applications in 2008-2024.
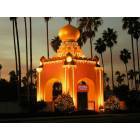

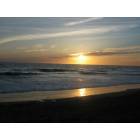


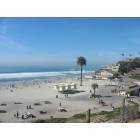

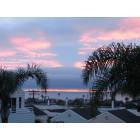
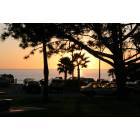

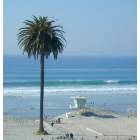
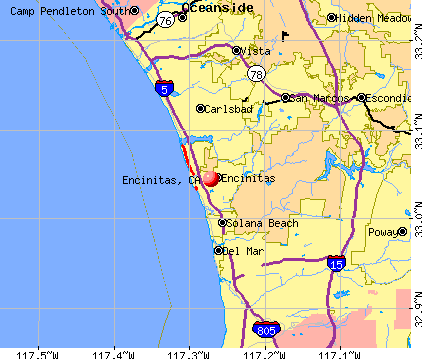


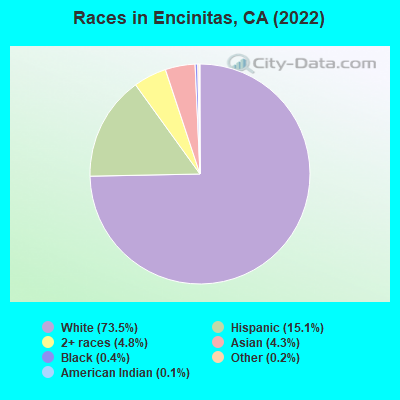
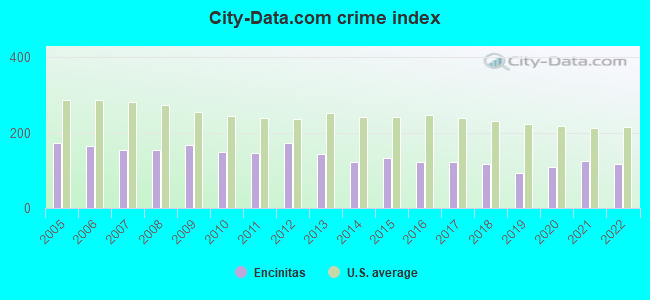
 Recent articles from our blog. Our writers, many of them Ph.D. graduates or candidates, create easy-to-read articles on a wide variety of topics.

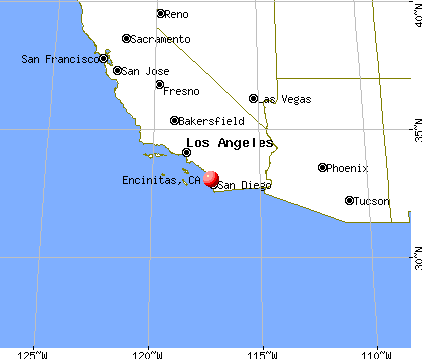
 (19.7 miles
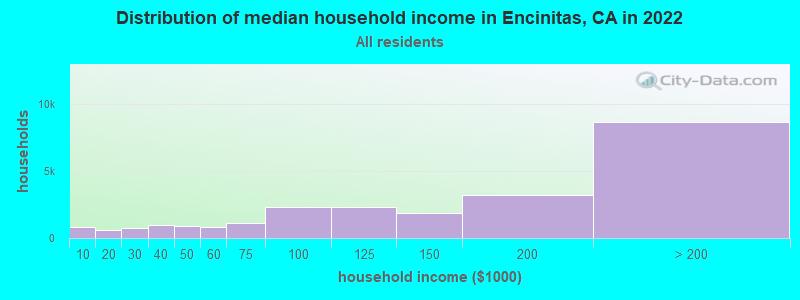
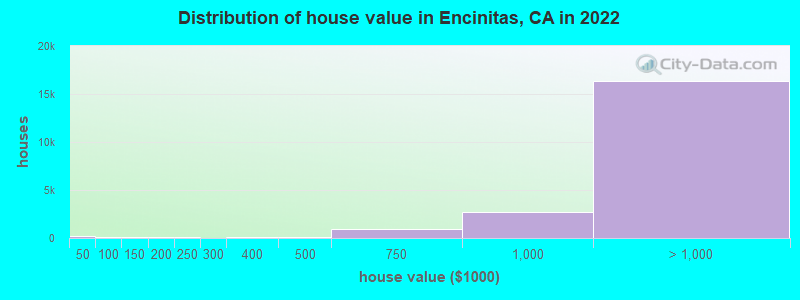
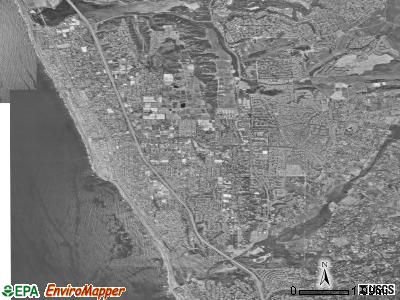
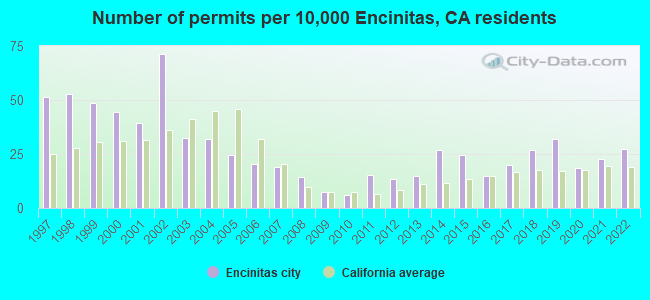
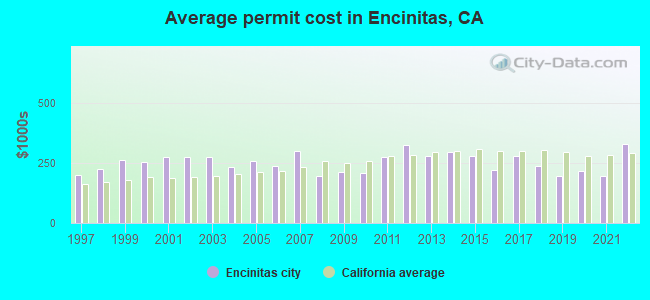
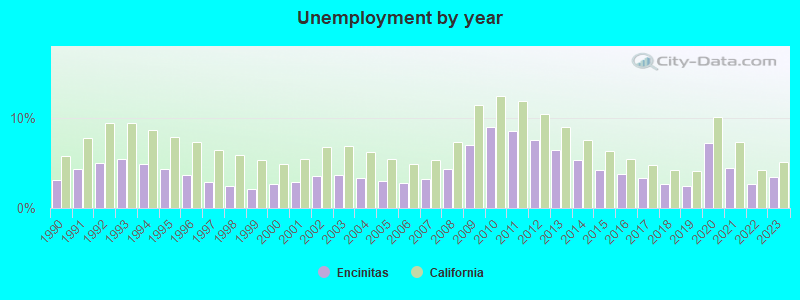
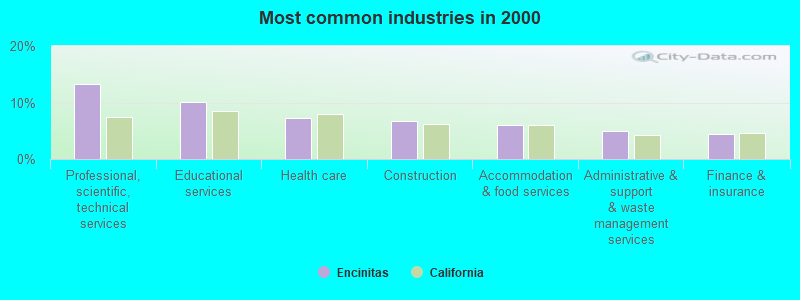
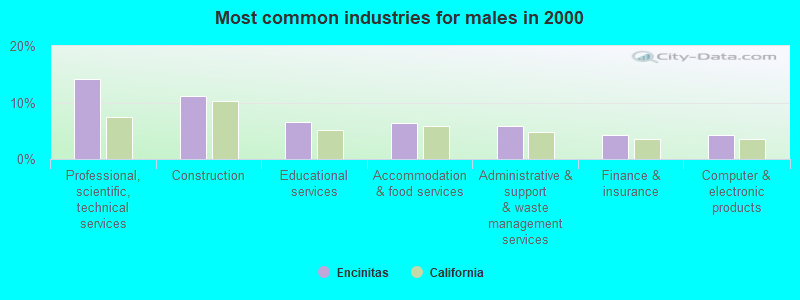
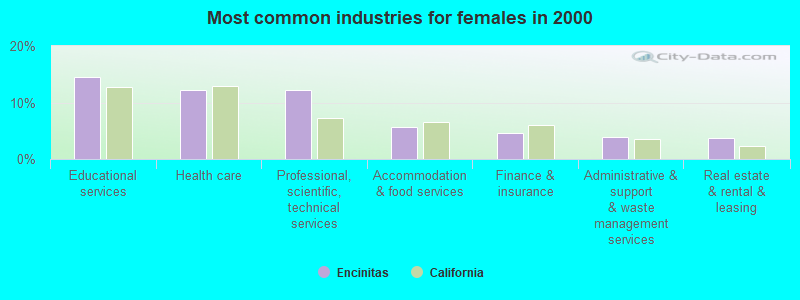
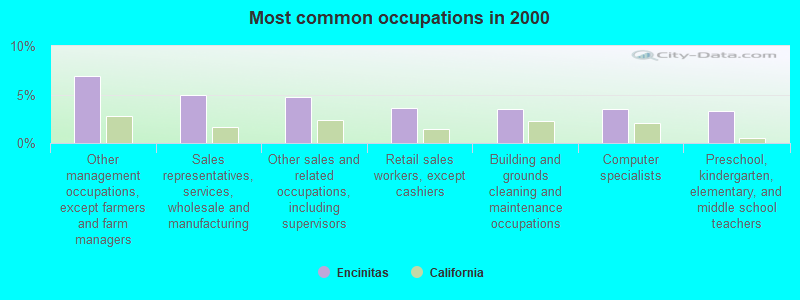
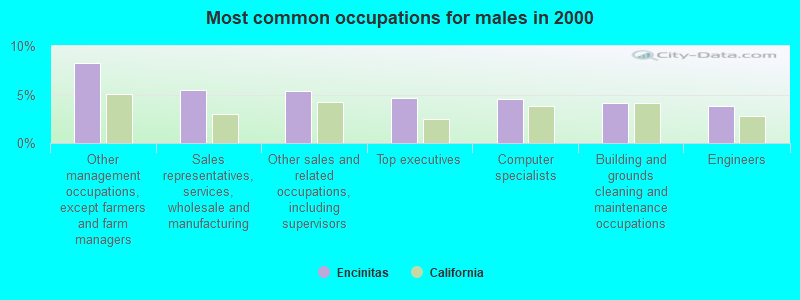
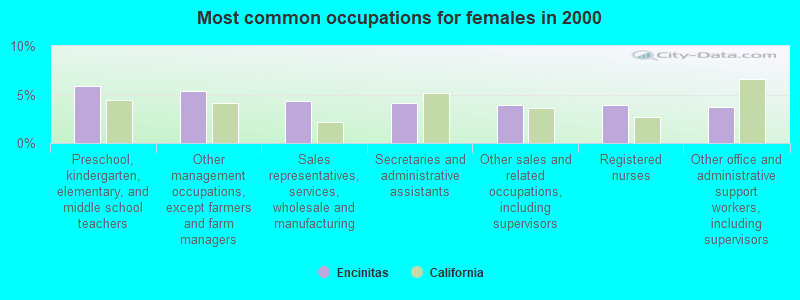
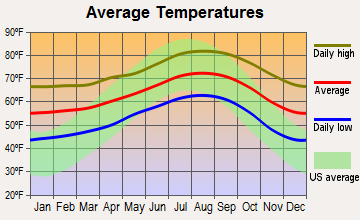
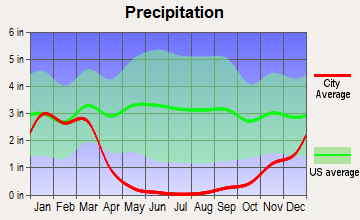
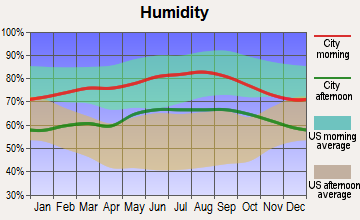
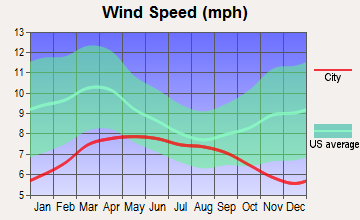
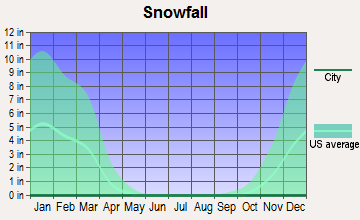
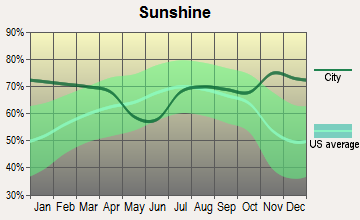
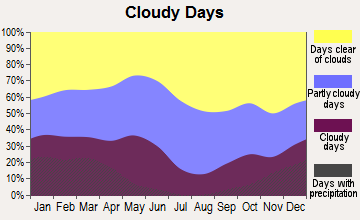
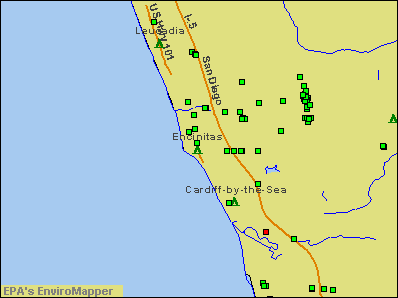

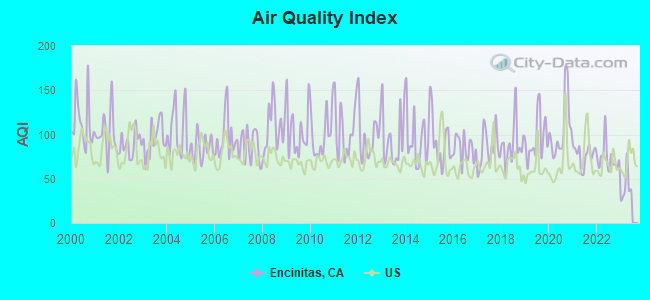
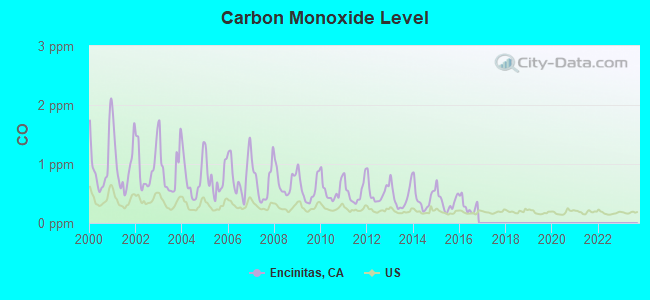
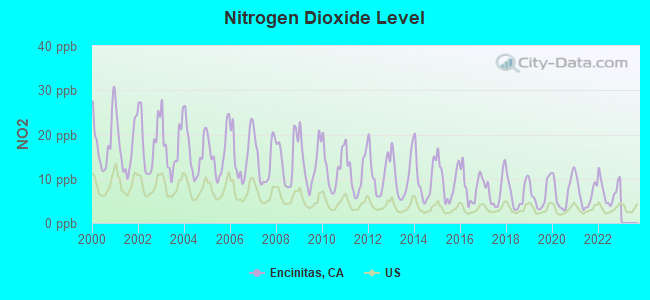
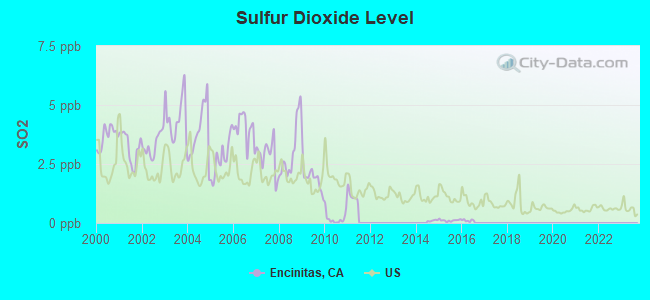
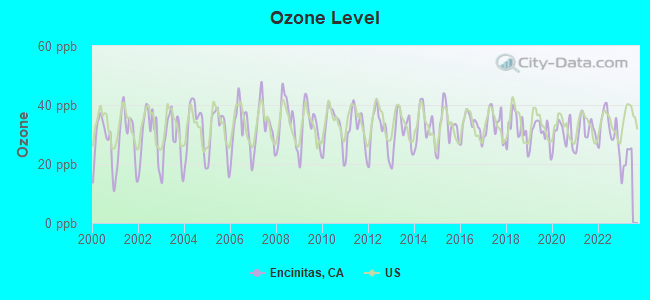
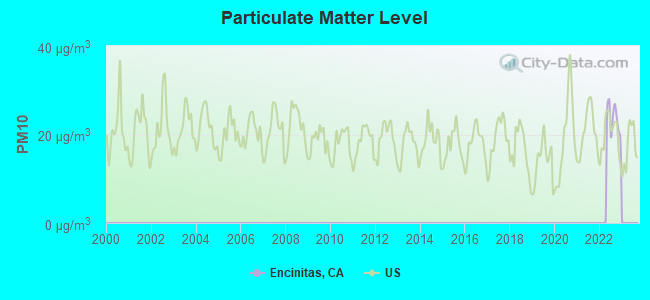
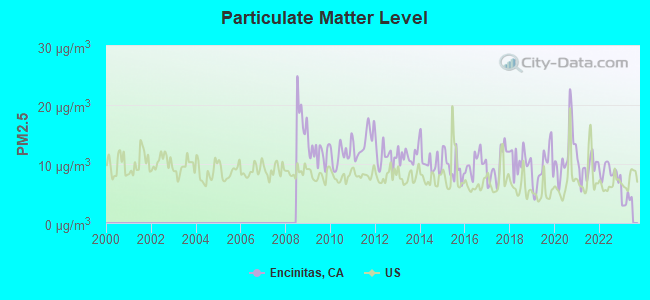
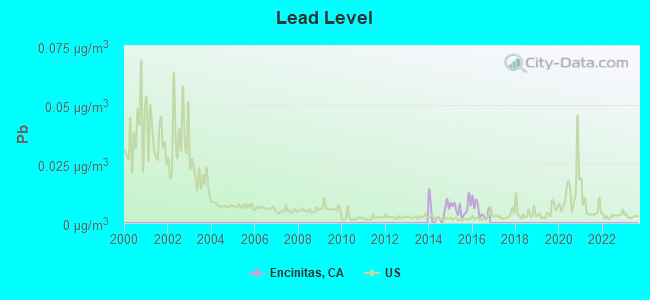

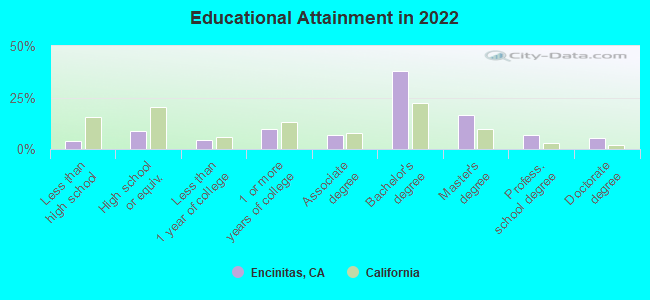
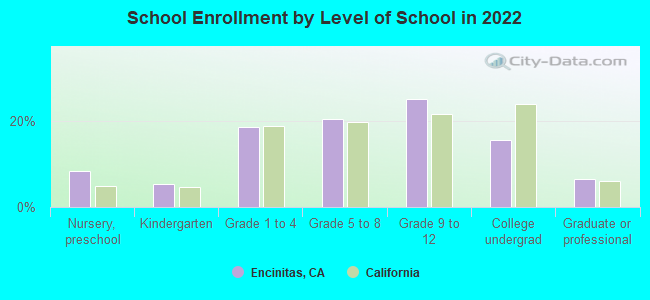
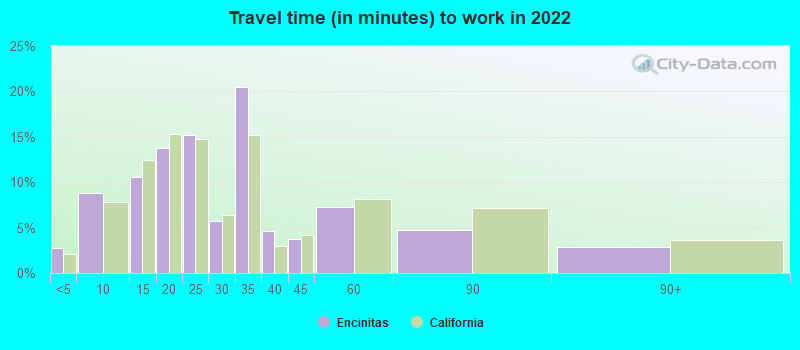
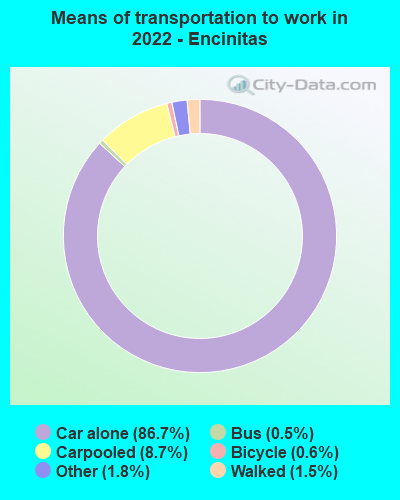
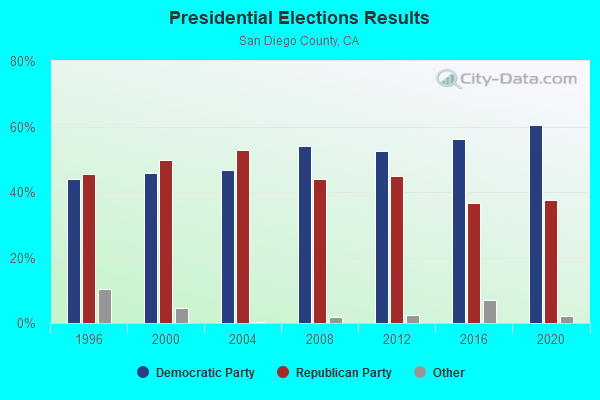
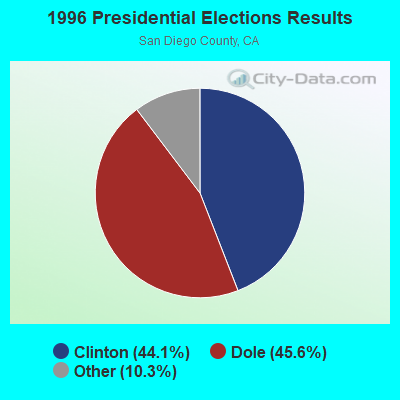
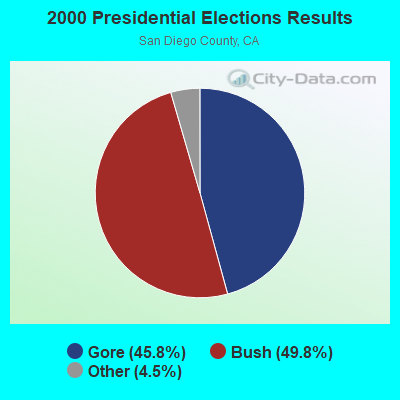
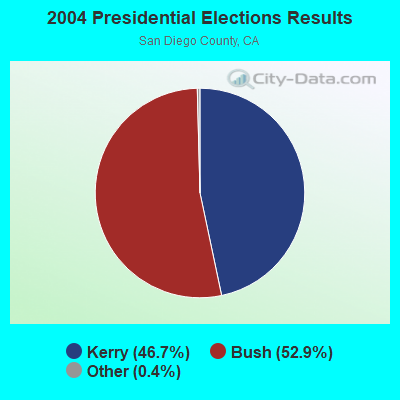
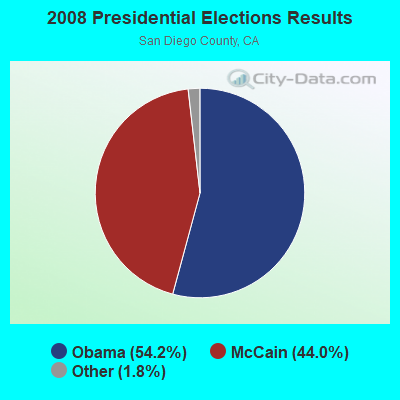
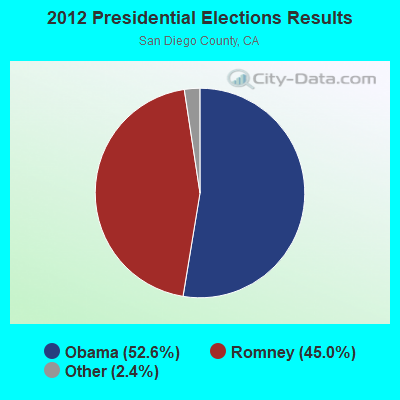
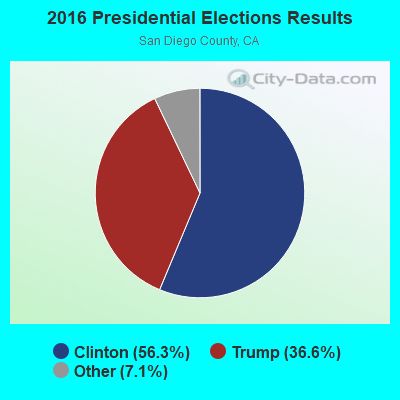
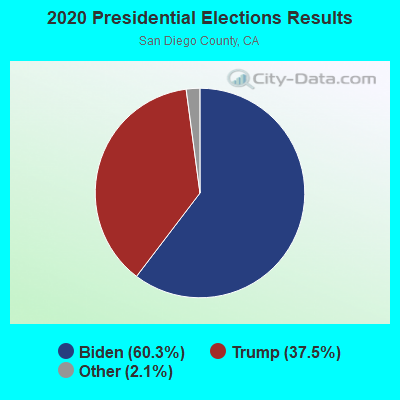
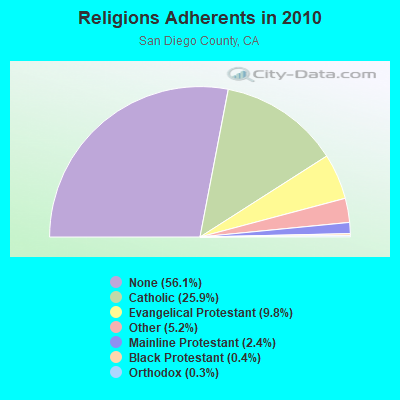
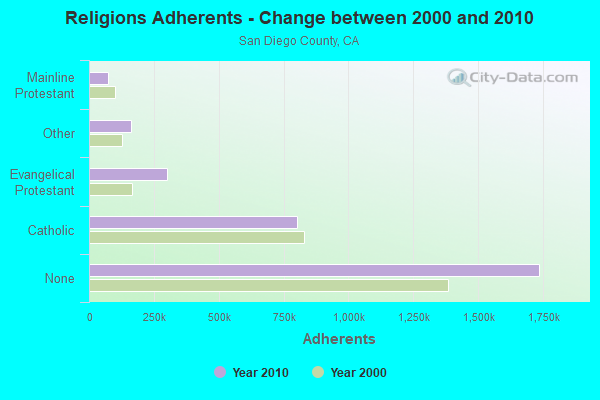
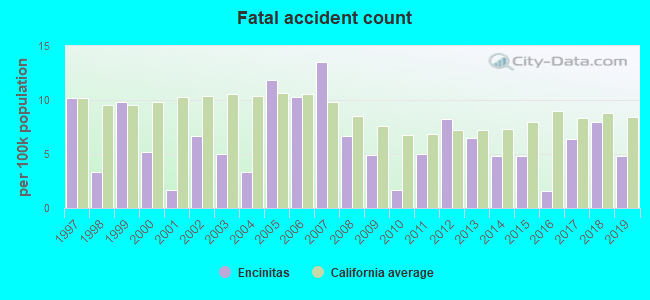
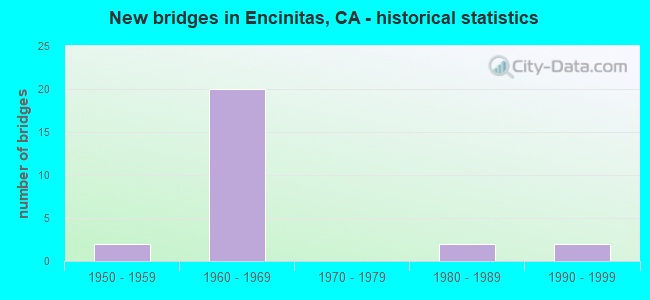
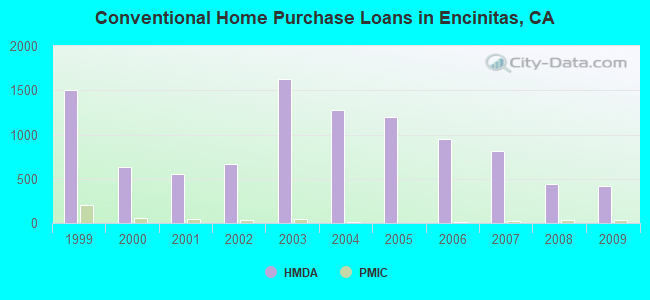
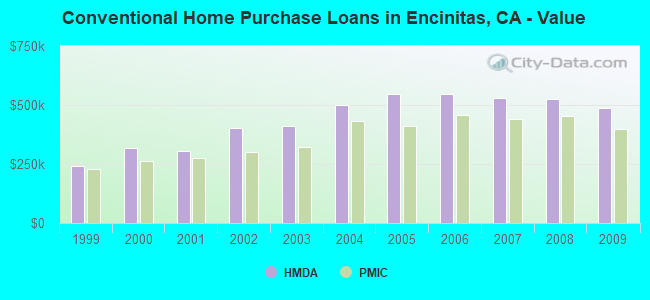
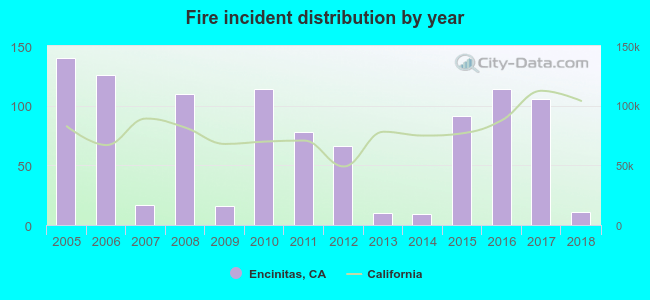 According to the data from the years 2005 - 2018 the average number of fire incidents per year is 72. The highest number of reported fires - 140 took place in 2005, and the least - 9 in 2014. The data has a declining trend.
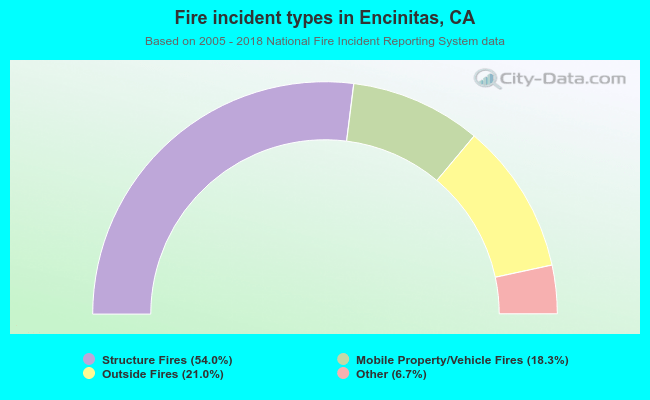 When looking into fire subcategories, the most incidents belonged to: Structure Fires (54.0%), and Outside Fires (21.0%).