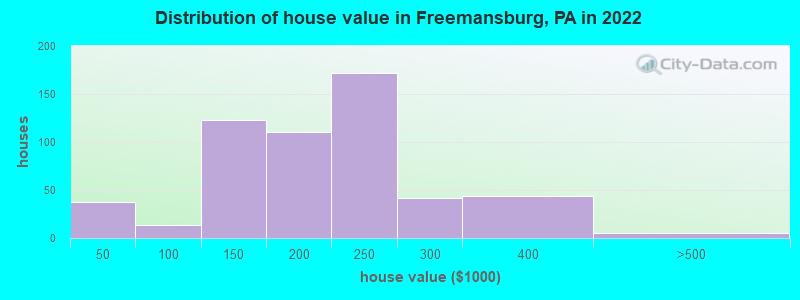
Estimated median house or condo value in 2022: $216,033 (it was $92,100 in 2000)
Freemansburg:
$216,033
PA:
$245,500
Mean prices in 2022:all housing units: $211,827; detached houses: $217,115; townhouses or other attached units: $204,797; in 3-to-4-unit structures: $283,205
Median gross rent in 2022: $2,073.
March 2022 cost of living index in Freemansburg: 102.1 (near average, U.S. average is 100)
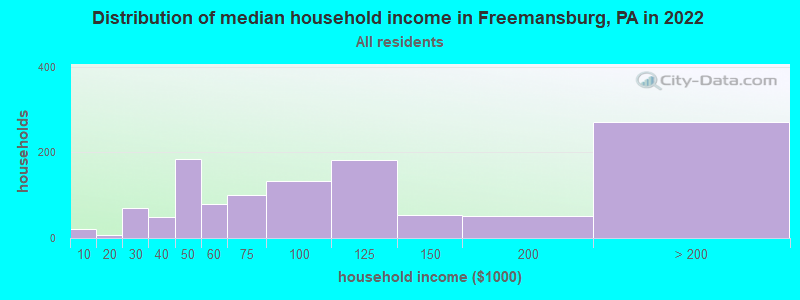
Percentage of residents living in poverty in 2022: 5.1%
(5.9% for White Non-Hispanic residents, 8.8% for Black residents, 4.1% for Hispanic or Latino residents, 5.1% for other race residents)
According to our research of Pennsylvania and other state lists, there were 5 registered sex offenders living in Freemansburg, Pennsylvania as of April 27, 2024. The ratio of all residents to sex offenders in Freemansburg is 530 to 1. The ratio of registered sex offenders to all residents in this city is near the state average.
Crime rates in Freemansburg by year
Type
2009
2010
2011
2012
2013
2014
2015
2016
2017
2018
2019
2020
2022
Murders (per 100,000)
0 (0.0)
0 (0.0)
0 (0.0)
0 (0.0)
0 (0.0)
0 (0.0)
0 (0.0)
0 (0.0)
0 (0.0)
0 (0.0)
0 (0.0)
0 (0.0)
0 (0.0)
Rapes (per 100,000)
1 (49.1)
0 (0.0)
0 (0.0)
2 (75.6)
1 (38.1)
2 (76.4)
0 (0.0)
0 (0.0)
3 (114.5)
0 (0.0)
0 (0.0)
0 (0.0)
0 (0.0)
Robberies (per 100,000)
0 (0.0)
1 (37.9)
1 (37.8)
1 (37.8)
0 (0.0)
0 (0.0)
0 (0.0)
0 (0.0)
0 (0.0)
0 (0.0)
0 (0.0)
0 (0.0)
0 (0.0)
Assaults (per 100,000)
0 (0.0)
1 (37.9)
0 (0.0)
1 (37.8)
2 (76.2)
1 (38.2)
2 (76.3)
2 (76.6)
1 (38.2)
0 (0.0)
3 (114.0)
0 (0.0)
0 (0.0)
Burglaries (per 100,000)
12 (589.1)
10 (379.4)
10 (378.2)
16 (605.1)
18 (686.0)
6 (229.3)
9 (343.5)
3 (114.9)
1 (38.2)
2 (76.3)
0 (0.0)
2 (76.1)
1 (35.1)
Thefts (per 100,000)
35 (1,718)
42 (1,593)
45 (1,702)
63 (2,383)
64 (2,439)
35 (1,337)
21 (801.5)
13 (497.9)
19 (725.5)
8 (305.3)
3 (114.0)
7 (266.5)
5 (175.4)
Auto thefts (per 100,000)
2 (98.2)
1 (37.9)
1 (37.8)
3 (113.5)
1 (38.1)
3 (114.6)
4 (152.7)
1 (38.3)
2 (76.4)
1 (38.2)
0 (0.0)
0 (0.0)
2 (70.2)
Arson (per 100,000)
0 (0.0)
0 (0.0)
0 (0.0)
0 (0.0)
0 (0.0)
0 (0.0)
0 (0.0)
0 (0.0)
0 (0.0)
0 (0.0)
0 (0.0)
0 (0.0)
0 (0.0)
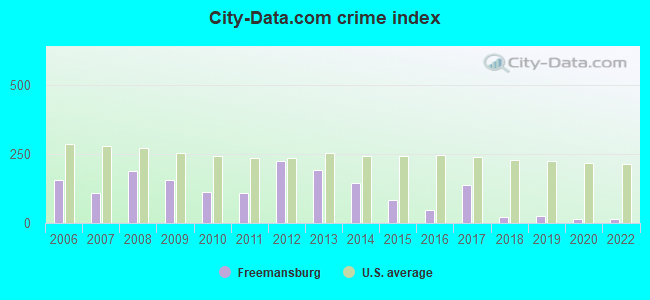
City-Data.com crime index
157.1
112.3
108.9
226.2
194.4
147.5
83.6
46.3
137.1
20.6
27.4
16.0
15.1
The City-Data.com crime index weighs serious crimes and violent crimes more heavily. Higher means more crime, U.S. average is 246.1. It adjusts for the number of visitors and daily workers commuting into cities.
Latest news from Freemansburg, PA collected exclusively by city-data.com from local newspapers, TV, and radio stations
Ancestries: German (19.0%), American (3.7%), Italian (3.2%), Haitian (3.2%), African (2.7%), Pennsylvania German (2.2%).
Current Local Time: EST time zone
Incorporated on 01/24/1856
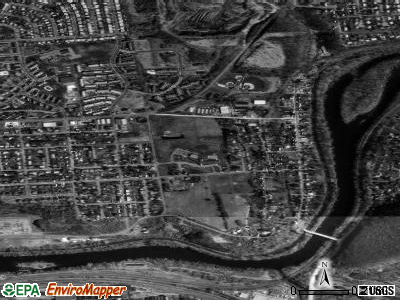
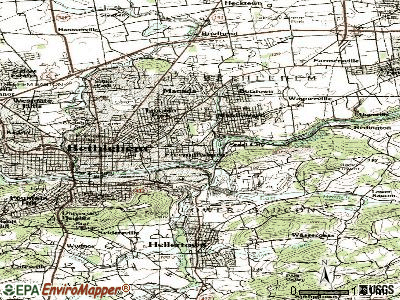
Elevation: 310 feet
Land area: 0.73 square miles.
Population density: 3,895 people per square mile (average).
425 residents are foreign born (8.5% Latin America, 3.8% Asia, 1.6% Africa).
This borough:
14.7%
Pennsylvania:
7.3%
Median real estate property taxes paid for housing units with mortgages in 2022: $4,204 (1.8%) Median real estate property taxes paid for housing units with no mortgage in 2022: $3,873 (2.5%)
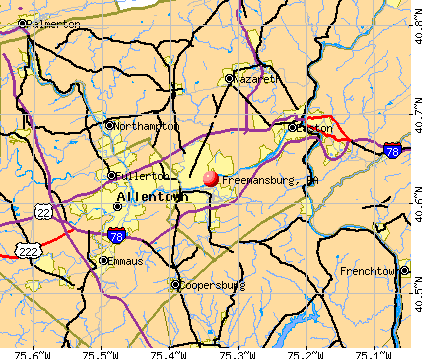
Nearest city with pop. 50,000+: Bethlehem, PA (1.9 miles , pop. 71,329).
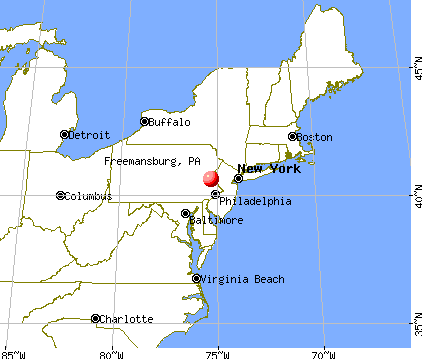
Nearest city with pop. 200,000+: Philadelphia, PA (44.7 miles , pop. 1,517,550).
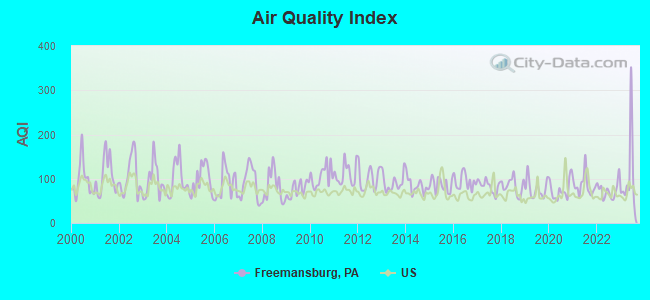
Air Quality Index (AQI) level in 2023 was 105. This is significantly worse than average.
City:
105
U.S.:
73
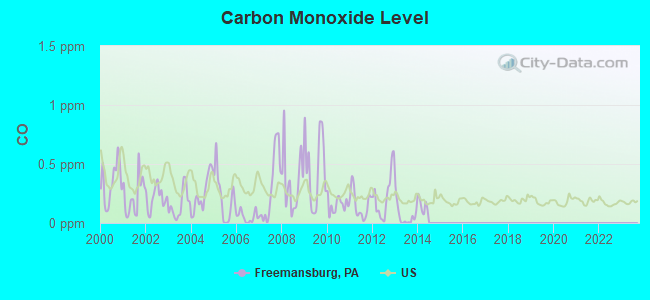
Carbon Monoxide (CO) [ppm] level in 2013 was 0.0642. This is significantly better than average.Closest monitor was 0.1 miles away from the city center.
City:
0.0642
U.S.:
0.2513
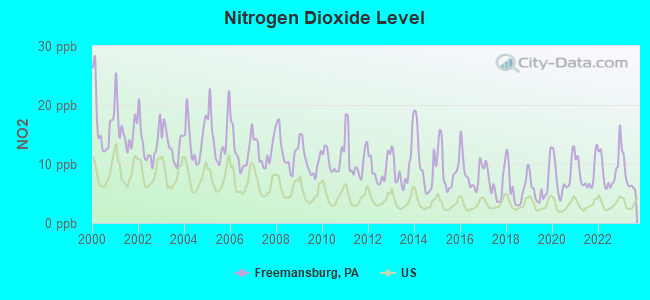
Nitrogen Dioxide (NO2) [ppb] level in 2023 was 7.85. This is significantly worse than average.Closest monitor was 0.1 miles away from the city center.
City:
7.85
U.S.:
5.11
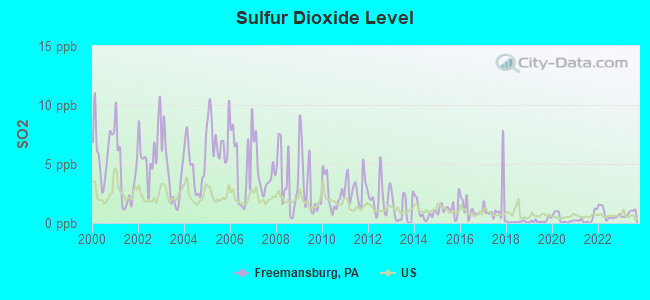
Sulfur Dioxide (SO2) [ppb] level in 2023 was 0.803. This is significantly better than average.Closest monitor was 0.1 miles away from the city center.
City:
0.803
U.S.:
1.515
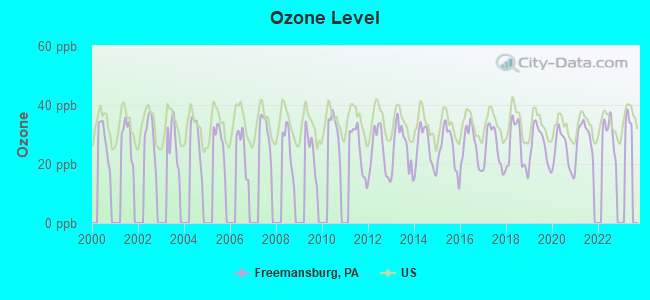
Ozone [ppb] level in 2022 was 30.3. This is about average.Closest monitor was 0.1 miles away from the city center.
City:
30.3
U.S.:
33.3
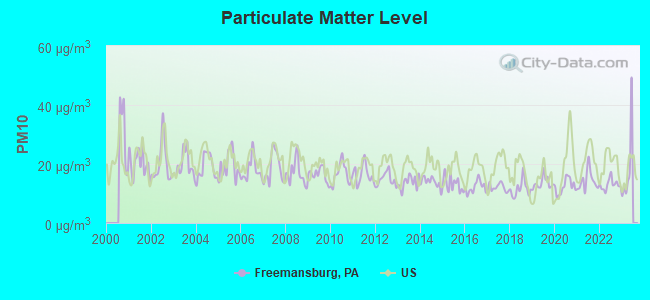
Particulate Matter (PM10) [µg/m3] level in 2022 was 13.0. This is significantly better than average.Closest monitor was 0.1 miles away from the city center.
City:
13.0
U.S.:
19.2
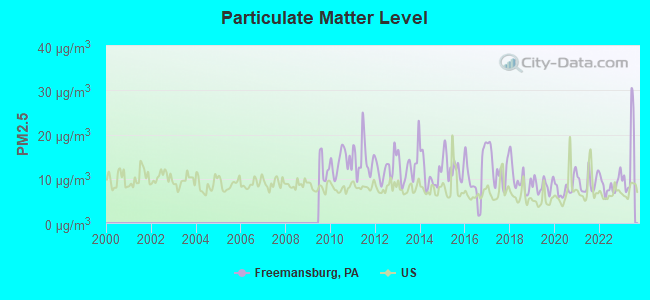
Particulate Matter (PM2.5) [µg/m3] level in 2023 was 14.3. This is significantly worse than average.Closest monitor was 0.1 miles away from the city center.
City:
14.3
U.S.:
8.1
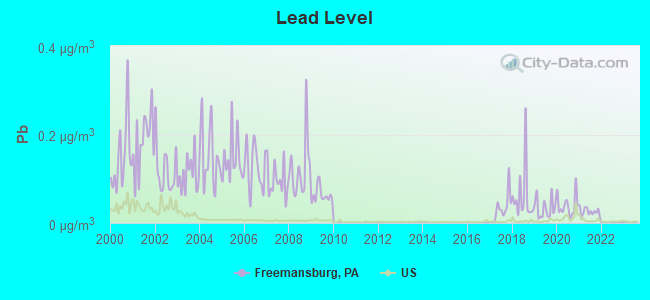
Lead (Pb) [µg/m3] level in 2021 was 0.0255. This is significantly worse than average.Closest monitor was 0.8 miles away from the city center.
City:
0.0255
U.S.:
0.0093
Tornado activity:
Freemansburg-area historical tornado activity is slightly above Pennsylvania state average. It is 2% smaller than the overall U.S. average.
On 7/26/1981, a category F3 (max. wind speeds 158-206 mph) tornado 15.2 miles away from the Freemansburg borough center injured 2 peopleand causedbetween $50,000 and $500,000 in damages.
On 5/31/1998, a category F3 tornado 22.9 miles away from the borough center injured 7 peopleand caused $1 million in damages.
Earthquake activity:
Freemansburg-area historical earthquake activity is significantly above Pennsylvania state average. It is 66% smaller than the overall U.S. average.
On 8/23/2011 at 17:51:04, a magnitude 5.8 (5.8 MW, Depth: 3.7 mi, Class: Moderate, Intensity: VI - VII) earthquake occurred 233.8 miles away from the city center On 1/16/1994 at 01:49:16, a magnitude 4.6 (4.6 MB, 4.6 LG, Depth: 3.1 mi, Class: Light, Intensity: IV - V) earthquake occurred 42.1 miles away from the city center On 10/7/1983 at 10:18:46, a magnitude 5.3 (5.1 MB, 5.3 LG, 5.1 ML) earthquake occurred 235.6 miles away from Freemansburg center On 1/16/1994 at 00:42:43, a magnitude 4.2 (4.2 MB, 4.0 LG, Depth: 3.1 mi) earthquake occurred 40.8 miles away from Freemansburg center On 4/20/2002 at 10:50:47, a magnitude 5.3 (5.3 ML, Depth: 3.0 mi) earthquake occurred 281.4 miles away from the city center On 9/25/1998 at 19:52:52, a magnitude 5.2 (4.8 MB, 4.3 MS, 5.2 LG, 4.5 MW, Depth: 3.1 mi) earthquake occurred 270.3 miles away from Freemansburg center Magnitude types: regional Lg-wave magnitude (LG), body-wave magnitude (MB), local magnitude (ML), surface-wave magnitude (MS), moment magnitude (MW)
Natural disasters:
The number of natural disasters in Northampton County (21) is greater than the US average (15). Major Disasters (Presidential) Declared: 15 Emergencies Declared: 5
Causes of natural disasters: Floods: 5, Hurricanes: 5, Storms: 5, Tropical Storms: 3, Winter Storms: 3, Snowstorms: 2, Blizzard: 1, Mudslide: 1, Snowfall: 1, Tropical Depression: 1, Water Shortage: 1, Other: 1 (Note: some incidents may be assigned to more than one category).
Hospitals and medical centers near Freemansburg:
MORAVIAN VILLAGE OF BETHLEHEM (Nursing Home, about 2 miles away; BETHLEHEM, PA)
BLOUGH HEALTH CARE CENTER INC (Nursing Home, about 2 miles away; BETHLEHEM, PA)
KIRKLAND VILLAGE (Nursing Home, about 2 miles away; BETHLEHEM, PA)
RX HOME CARE INC (Home Health Center, about 3 miles away; BETHLEHEM, PA)
LEHIGH CO HOME FOUNTAIN HILL ANNEX (Nursing Home, about 3 miles away; BETHLEHEM, PA)
ST. LUKES OUTPATIENT DIALYSIS (Dialysis Facility, about 3 miles away; BETHLEHEM, PA)
ST LUKE'S HOSPITAL BETHLEHEM Acute Care Hospitals (about 4 miles away; BETHLEHEM, PA)
Colleges/universities with over 2000 students nearest to Freemansburg:
Lehigh University (about 3 miles; Bethlehem, PA; Full-time enrollment: 6,565)
Northampton County Area Community College (about 4 miles; Bethlehem, PA; FT enrollment: 7,195)
DeSales University (about 7 miles; Center Valley, PA; FT enrollment: 2,862)
Lafayette College (about 9 miles; Easton, PA; FT enrollment: 2,562)
Muhlenberg College (about 10 miles; Allentown, PA; FT enrollment: 2,792)
Lehigh Carbon Community College (about 15 miles; Schnecksville, PA; FT enrollment: 4,391)
Kutztown University of Pennsylvania (about 25 miles; Kutztown, PA; FT enrollment: 9,099)
Northampton County has a predicted average indoor radon screening level greater than 4 pCi/L (pico curies per liter) - Highest Potential
Average household size:
This borough:
2.7 people
Pennsylvania:
2.5 people
Percentage of family households:
This borough:
70.5%
Whole state:
65.0%
Percentage of households with unmarried partners:
This borough:
9.6%
Whole state:
6.6%
Likely homosexual households (counted as self-reported same-sex unmarried-partner households)
Lesbian couples: 0.3% of all households
Gay men: 0.2% of all households
26 people in residential treatment centers for adults in 2010
7 people in group homes intended for adults in 2010
77 people in homes or halfway houses for drug/alcohol abuse in 2000
7 people in homes for the mentally retarded in 2000
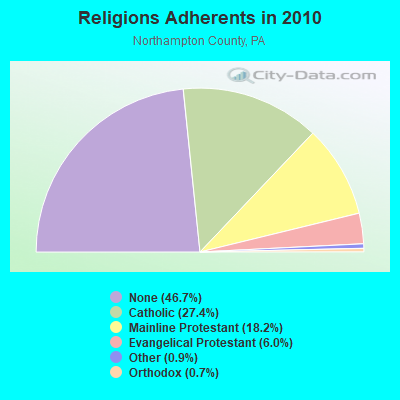
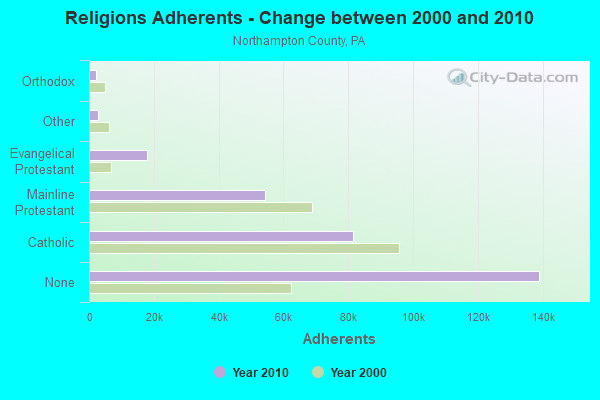
Religion statistics for Freemansburg, PA (based on Northampton County data)
Religion
Adherents
Congregations
Catholic
81,456
26
Mainline Protestant
54,336
120
Evangelical Protestant
17,794
83
Other
2,817
19
Orthodox
2,200
5
Black Protestant
156
2
None
138,976
-
Source: Clifford Grammich, Kirk Hadaway, Richard Houseal, Dale E.Jones, Alexei Krindatch, Richie Stanley and Richard H.Taylor. 2012. 2010 U.S.Religion Census: Religious Congregations & Membership Study. Association of Statisticians of American Religious Bodies. Jones, Dale E., et al. 2002. Congregations and Membership in the United States 2000. Nashville, TN: Glenmary Research Center. Graphs represent county-level data
25,145Total future (year 2032) average daily traffic
FCC Registered Broadcast Land Mobile Towers:
1
Lat: 40.625750 Lon: -75.340917, Call Sign: WQHW529, Assigned Frequencies: 458.850 MHz, Grant Date: 11/23/2017, Expiration Date: 11/26/2027, Certifier: Michael Micholochick Iii, Registrant: Lao/Ewa 20727608, 102 East Middle Street, Gettysburg, PA 17325, Phone: (800) 886-4222, Fax: (717) 337-9157, Email:
FCC Registered Amateur Radio Licenses:
4
Call Sign: KA3ZXH, Grant Date: 03/31/1992, Expiration Date: 03/31/2002, Cancellation Date: 04/01/2004, Registrant: Carlos A Aponte, 632b Ramblewood Ln, Freemansburg, PA 18017
Call Sign: AB3BS, Previous Call Sign: KB3KQG, Licensee ID: L00786269, Grant Date: 10/18/2013, Expiration Date: 12/24/2023, Certifier: Willie T Robertson Jr, Registrant: Willie T Robertson Jr, 416 New Street, Freemansburg, PA 18017
Call Sign: KC3CWY, Licensee ID: L01868147, Grant Date: 05/22/2014, Expiration Date: 05/22/2024, Certifier: Todd M Mandell, Registrant: Todd M Mandell, 415 New St, Freemansburg, PA 18017
Call Sign: KC3EVM, Licensee ID: L01937629, Grant Date: 04/20/2015, Expiration Date: 04/20/2025, Certifier: Jose A Maldonado, Registrant: Jose A Maldonado, 938 Tolstoy St, Freemansburg, PA 18017
Home Mortgage Disclosure Act Aggregated Statistics For Year 2009 (Based on 1 full tract)
A) FHA, FSA/RHS & VA Home Purchase Loans
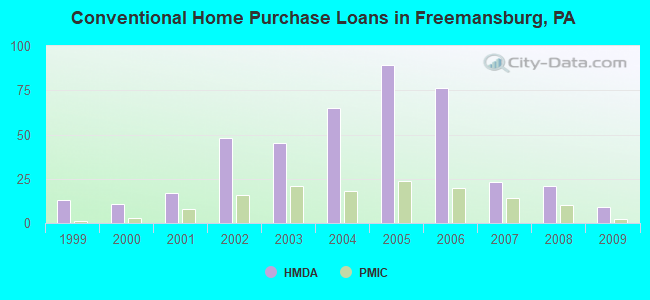
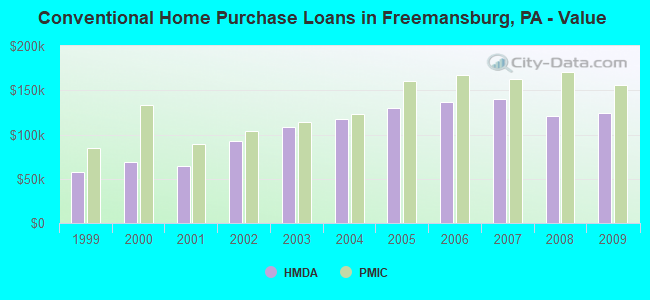
B) Conventional Home Purchase Loans
C) Refinancings
D) Home Improvement Loans
F) Non-occupant Loans on < 5 Family Dwellings (A B C & D)
Number
Average Value
Number
Average Value
Number
Average Value
Number
Average Value
Number
Average Value
LOANS ORIGINATED
21
$145,190
9
$124,222
34
$120,618
4
$42,000
6
$99,667
APPLICATIONS APPROVED, NOT ACCEPTED
1
$122,000
0
$0
4
$118,000
0
$0
1
$50,000
APPLICATIONS DENIED
3
$142,333
2
$153,500
22
$160,455
6
$55,000
2
$149,500
APPLICATIONS WITHDRAWN
3
$151,667
0
$0
19
$140,316
0
$0
1
$164,000
FILES CLOSED FOR INCOMPLETENESS
0
$0
0
$0
1
$219,000
1
$10,000
0
$0
Aggregated Statistics For Year 2008 (Based on 1 full tract)
A) FHA, FSA/RHS & VA Home Purchase Loans
B) Conventional Home Purchase Loans
C) Refinancings
D) Home Improvement Loans
F) Non-occupant Loans on < 5 Family Dwellings (A B C & D)
Number
Average Value
Number
Average Value
Number
Average Value
Number
Average Value
Number
Average Value
LOANS ORIGINATED
15
$174,200
21
$120,667
41
$119,561
12
$40,500
15
$91,600
APPLICATIONS APPROVED, NOT ACCEPTED
1
$184,000
3
$147,000
13
$117,615
1
$20,000
0
$0
APPLICATIONS DENIED
6
$157,167
4
$187,250
32
$140,375
10
$71,500
1
$146,000
APPLICATIONS WITHDRAWN
2
$177,000
5
$163,600
9
$125,778
1
$220,000
1
$115,000
FILES CLOSED FOR INCOMPLETENESS
1
$215,000
2
$162,000
4
$124,750
1
$20,000
1
$157,000
Aggregated Statistics For Year 2007 (Based on 1 full tract)
A) FHA, FSA/RHS & VA Home Purchase Loans
B) Conventional Home Purchase Loans
C) Refinancings
D) Home Improvement Loans
E) Loans on Dwellings For 5+ Families
F) Non-occupant Loans on < 5 Family Dwellings (A B C & D)
G) Loans On Manufactured Home Dwelling (A B C & D)
Number
Average Value
Number
Average Value
Number
Average Value
Number
Average Value
Number
Average Value
Number
Average Value
Number
Average Value
LOANS ORIGINATED
8
$154,750
23
$140,609
61
$111,115
15
$39,733
0
$0
12
$95,917
0
$0
APPLICATIONS APPROVED, NOT ACCEPTED
0
$0
4
$78,750
15
$158,533
2
$40,000
0
$0
3
$122,667
0
$0
APPLICATIONS DENIED
2
$159,000
6
$112,833
61
$130,049
13
$26,923
3
$111,333
2
$91,000
1
$16,000
APPLICATIONS WITHDRAWN
0
$0
7
$153,714
30
$132,367
3
$19,000
0
$0
1
$127,000
0
$0
FILES CLOSED FOR INCOMPLETENESS
0
$0
0
$0
11
$163,091
0
$0
0
$0
0
$0
0
$0
Aggregated Statistics For Year 2006 (Based on 1 full tract)
A) FHA, FSA/RHS & VA Home Purchase Loans
B) Conventional Home Purchase Loans
C) Refinancings
D) Home Improvement Loans
F) Non-occupant Loans on < 5 Family Dwellings (A B C & D)
Number
Average Value
Number
Average Value
Number
Average Value
Number
Average Value
Number
Average Value
LOANS ORIGINATED
10
$172,000
76
$137,118
77
$112,844
23
$41,435
10
$123,100
APPLICATIONS APPROVED, NOT ACCEPTED
0
$0
8
$128,500
18
$120,389
3
$24,000
1
$130,000
APPLICATIONS DENIED
3
$214,000
17
$109,471
61
$141,033
17
$50,471
5
$115,800
APPLICATIONS WITHDRAWN
1
$290,000
11
$134,000
38
$134,737
4
$87,500
3
$64,667
FILES CLOSED FOR INCOMPLETENESS
0
$0
1
$143,000
14
$151,857
1
$25,000
0
$0
Aggregated Statistics For Year 2005 (Based on 1 full tract)
A) FHA, FSA/RHS & VA Home Purchase Loans
B) Conventional Home Purchase Loans
C) Refinancings
D) Home Improvement Loans
F) Non-occupant Loans on < 5 Family Dwellings (A B C & D)
G) Loans On Manufactured Home Dwelling (A B C & D)
Number
Average Value
Number
Average Value
Number
Average Value
Number
Average Value
Number
Average Value
Number
Average Value
LOANS ORIGINATED
17
$173,471
89
$130,483
124
$110,081
18
$49,667
12
$132,750
0
$0
APPLICATIONS APPROVED, NOT ACCEPTED
0
$0
3
$129,000
23
$113,348
4
$24,750
0
$0
1
$8,000
APPLICATIONS DENIED
3
$217,667
16
$102,750
87
$111,644
22
$53,773
1
$18,000
0
$0
APPLICATIONS WITHDRAWN
0
$0
9
$132,222
58
$132,810
10
$89,400
3
$179,333
0
$0
FILES CLOSED FOR INCOMPLETENESS
0
$0
3
$105,000
12
$130,833
0
$0
3
$97,333
0
$0
Aggregated Statistics For Year 2004 (Based on 1 full tract)
A) FHA, FSA/RHS & VA Home Purchase Loans
B) Conventional Home Purchase Loans
C) Refinancings
D) Home Improvement Loans
F) Non-occupant Loans on < 5 Family Dwellings (A B C & D)
Number
Average Value
Number
Average Value
Number
Average Value
Number
Average Value
Number
Average Value
LOANS ORIGINATED
14
$135,714
65
$117,323
82
$100,024
18
$36,278
13
$94,769
APPLICATIONS APPROVED, NOT ACCEPTED
0
$0
9
$119,778
13
$105,308
7
$53,714
1
$50,000
APPLICATIONS DENIED
0
$0
7
$125,000
57
$110,825
3
$62,667
4
$101,750
APPLICATIONS WITHDRAWN
1
$194,000
5
$108,200
38
$107,263
1
$8,000
0
$0
FILES CLOSED FOR INCOMPLETENESS
0
$0
7
$103,000
9
$82,444
1
$37,000
2
$45,000
Aggregated Statistics For Year 2003 (Based on 1 full tract)
A) FHA, FSA/RHS & VA Home Purchase Loans
B) Conventional Home Purchase Loans
C) Refinancings
D) Home Improvement Loans
F) Non-occupant Loans on < 5 Family Dwellings (A B C & D)
Number
Average Value
Number
Average Value
Number
Average Value
Number
Average Value
Number
Average Value
LOANS ORIGINATED
14
$116,643
45
$108,822
98
$92,388
4
$49,750
7
$105,286
APPLICATIONS APPROVED, NOT ACCEPTED
1
$141,000
7
$91,714
14
$88,071
4
$14,750
1
$131,000
APPLICATIONS DENIED
0
$0
4
$123,000
48
$81,417
8
$16,250
3
$87,333
APPLICATIONS WITHDRAWN
0
$0
4
$160,500
30
$101,733
1
$25,000
1
$92,000
FILES CLOSED FOR INCOMPLETENESS
0
$0
3
$104,667
6
$100,500
1
$27,000
0
$0
Aggregated Statistics For Year 2002 (Based on 1 full tract)
A) FHA, FSA/RHS & VA Home Purchase Loans
B) Conventional Home Purchase Loans
C) Refinancings
D) Home Improvement Loans
F) Non-occupant Loans on < 5 Family Dwellings (A B C & D)
Number
Average Value
Number
Average Value
Number
Average Value
Number
Average Value
Number
Average Value
LOANS ORIGINATED
50
$112,160
48
$92,354
50
$93,540
15
$18,933
1
$66,000
APPLICATIONS APPROVED, NOT ACCEPTED
1
$117,000
2
$48,000
18
$88,444
2
$11,500
1
$84,000
APPLICATIONS DENIED
4
$98,000
3
$103,000
38
$70,526
5
$9,600
2
$27,500
APPLICATIONS WITHDRAWN
2
$125,000
3
$100,000
27
$74,889
1
$28,000
1
$71,000
FILES CLOSED FOR INCOMPLETENESS
0
$0
1
$12,000
4
$62,250
0
$0
0
$0
Aggregated Statistics For Year 2001 (Based on 1 full tract)
A) FHA, FSA/RHS & VA Home Purchase Loans
B) Conventional Home Purchase Loans
C) Refinancings
D) Home Improvement Loans
F) Non-occupant Loans on < 5 Family Dwellings (A B C & D)
Number
Average Value
Number
Average Value
Number
Average Value
Number
Average Value
Number
Average Value
LOANS ORIGINATED
16
$91,375
17
$64,176
53
$79,245
7
$30,429
5
$61,000
APPLICATIONS APPROVED, NOT ACCEPTED
1
$94,000
3
$60,000
15
$53,467
0
$0
1
$60,000
APPLICATIONS DENIED
0
$0
6
$59,000
45
$71,467
9
$28,222
2
$109,500
APPLICATIONS WITHDRAWN
0
$0
3
$66,000
35
$85,429
1
$6,000
2
$61,000
FILES CLOSED FOR INCOMPLETENESS
0
$0
0
$0
5
$55,800
0
$0
0
$0
Aggregated Statistics For Year 2000 (Based on 1 full tract)
A) FHA, FSA/RHS & VA Home Purchase Loans
B) Conventional Home Purchase Loans
C) Refinancings
D) Home Improvement Loans
F) Non-occupant Loans on < 5 Family Dwellings (A B C & D)
Number
Average Value
Number
Average Value
Number
Average Value
Number
Average Value
Number
Average Value
LOANS ORIGINATED
13
$79,077
11
$68,818
24
$58,583
10
$19,100
3
$48,333
APPLICATIONS APPROVED, NOT ACCEPTED
0
$0
1
$73,000
10
$64,000
5
$30,600
0
$0
APPLICATIONS DENIED
0
$0
6
$62,500
21
$66,476
9
$20,444
1
$113,000
APPLICATIONS WITHDRAWN
0
$0
1
$100,000
5
$93,000
1
$20,000
0
$0
FILES CLOSED FOR INCOMPLETENESS
0
$0
2
$97,000
11
$70,182
0
$0
0
$0
Aggregated Statistics For Year 1999 (Based on 1 full tract)
A) FHA, FSA/RHS & VA Home Purchase Loans
B) Conventional Home Purchase Loans
C) Refinancings
D) Home Improvement Loans
E) Loans on Dwellings For 5+ Families
F) Non-occupant Loans on < 5 Family Dwellings (A B C & D)
#3 on the list of "Top 101 cities with the largest percentage of people in homes or halfway houses for drug/alcohol abuse (population 1,000+)"
#9 on the list of "Top 101 cities with the most residents born in Turkey (population 500+)"
#73 on the list of "Top 101 cities with the most residents born in Trinidad and Tobago (population 500+)"
#86 on the list of "Top 101 cities with the most residents born in Ecuador (population 500+)"
#33 on the list of "Top 101 counties with the highest Particulate Matter (PM2.5) Annual air pollution readings in 2012 (µg/m3)"
#36 on the list of "Top 101 counties with the highest Sulfur Oxides Annual air pollution readings in 2012 (µg/m3)"
#48 on the list of "Top 101 counties with the lowest Ozone (1-hour) air pollution readings in 2012 (ppm)"
#51 on the list of "Top 101 counties with the largest increase in the number of infant deaths per 1000 residents 2000-2006 to 2007-2013 (pop. 50,000+)"
#65 on the list of "Top 101 counties with the lowest number of births per 1000 residents 2007-2013"


 Recent articles from our blog. Our writers, many of them Ph.D. graduates or candidates, create easy-to-read articles on a wide variety of topics.

 (1.9 miles