Hanover, Pennsylvania Submit your own pictures of this borough and show them to the world
OSM Map
General Map
Google Map
MSN Map
OSM Map
General Map
Google Map
MSN Map
OSM Map
General Map
Google Map
MSN Map
OSM Map
General Map
Google Map
MSN Map
Please wait while loading the map...
Population in 2022: 16,548 (100% urban, 0% rural). Population change since 2000: +13.8%Males: 8,126 Females: 8,422
March 2022 cost of living index in Hanover: 94.2 (less than average, U.S. average is 100) Percentage of residents living in poverty in 2022: 12.5%for White Non-Hispanic residents , 8.3% for Black residents , 3.2% for Hispanic or Latino residents , 18.3% for American Indian residents , 1.5% for other race residents , 19.4% for two or more races residents )
Profiles of local businesses
Business Search - 14 Million verified businesses
Data:
Median household income ($)
Median household income (% change since 2000)
Household income diversity
Ratio of average income to average house value (%)
Ratio of average income to average rent
Median household income ($) - White
Median household income ($) - Black or African American
Median household income ($) - Asian
Median household income ($) - Hispanic or Latino
Median household income ($) - American Indian and Alaska Native
Median household income ($) - Multirace
Median household income ($) - Other Race
Median household income for houses/condos with a mortgage ($)
Median household income for apartments without a mortgage ($)
Races - White alone (%)
Races - White alone (% change since 2000)
Races - Black alone (%)
Races - Black alone (% change since 2000)
Races - American Indian alone (%)
Races - American Indian alone (% change since 2000)
Races - Asian alone (%)
Races - Asian alone (% change since 2000)
Races - Hispanic (%)
Races - Hispanic (% change since 2000)
Races - Native Hawaiian and Other Pacific Islander alone (%)
Races - Native Hawaiian and Other Pacific Islander alone (% change since 2000)
Races - Two or more races (%)
Races - Two or more races (% change since 2000)
Races - Other race alone (%)
Races - Other race alone (% change since 2000)
Racial diversity
Unemployment (%)
Unemployment (% change since 2000)
Unemployment (%) - White
Unemployment (%) - Black or African American
Unemployment (%) - Asian
Unemployment (%) - Hispanic or Latino
Unemployment (%) - American Indian and Alaska Native
Unemployment (%) - Multirace
Unemployment (%) - Other Race
Population density (people per square mile)
Population - Males (%)
Population - Females (%)
Population - Males (%) - White
Population - Males (%) - Black or African American
Population - Males (%) - Asian
Population - Males (%) - Hispanic or Latino
Population - Males (%) - American Indian and Alaska Native
Population - Males (%) - Multirace
Population - Males (%) - Other Race
Population - Females (%) - White
Population - Females (%) - Black or African American
Population - Females (%) - Asian
Population - Females (%) - Hispanic or Latino
Population - Females (%) - American Indian and Alaska Native
Population - Females (%) - Multirace
Population - Females (%) - Other Race
Coronavirus confirmed cases (Apr 27, 2024)
Deaths caused by coronavirus (Apr 27, 2024)
Coronavirus confirmed cases (per 100k population) (Apr 27, 2024)
Deaths caused by coronavirus (per 100k population) (Apr 27, 2024)
Daily increase in number of cases (Apr 27, 2024)
Weekly increase in number of cases (Apr 27, 2024)
Cases doubled (in days) (Apr 27, 2024)
Hospitalized patients (Apr 18, 2022)
Negative test results (Apr 18, 2022)
Total test results (Apr 18, 2022)
COVID Vaccine doses distributed (per 100k population) (Sep 19, 2023)
COVID Vaccine doses administered (per 100k population) (Sep 19, 2023)
COVID Vaccine doses distributed (Sep 19, 2023)
COVID Vaccine doses administered (Sep 19, 2023)
Likely homosexual households (%)
Likely homosexual households (% change since 2000)
Likely homosexual households - Lesbian couples (%)
Likely homosexual households - Lesbian couples (% change since 2000)
Likely homosexual households - Gay men (%)
Likely homosexual households - Gay men (% change since 2000)
Cost of living index
Median gross rent ($)
Median contract rent ($)
Median monthly housing costs ($)
Median house or condo value ($)
Median house or condo value ($ change since 2000)
Mean house or condo value by units in structure - 1, detached ($)
Mean house or condo value by units in structure - 1, attached ($)
Mean house or condo value by units in structure - 2 ($)
Mean house or condo value by units in structure by units in structure - 3 or 4 ($)
Mean house or condo value by units in structure - 5 or more ($)
Mean house or condo value by units in structure - Boat, RV, van, etc. ($)
Mean house or condo value by units in structure - Mobile home ($)
Median house or condo value ($) - White
Median house or condo value ($) - Black or African American
Median house or condo value ($) - Asian
Median house or condo value ($) - Hispanic or Latino
Median house or condo value ($) - American Indian and Alaska Native
Median house or condo value ($) - Multirace
Median house or condo value ($) - Other Race
Median resident age
Resident age diversity
Median resident age - Males
Median resident age - Females
Median resident age - White
Median resident age - Black or African American
Median resident age - Asian
Median resident age - Hispanic or Latino
Median resident age - American Indian and Alaska Native
Median resident age - Multirace
Median resident age - Other Race
Median resident age - Males - White
Median resident age - Males - Black or African American
Median resident age - Males - Asian
Median resident age - Males - Hispanic or Latino
Median resident age - Males - American Indian and Alaska Native
Median resident age - Males - Multirace
Median resident age - Males - Other Race
Median resident age - Females - White
Median resident age - Females - Black or African American
Median resident age - Females - Asian
Median resident age - Females - Hispanic or Latino
Median resident age - Females - American Indian and Alaska Native
Median resident age - Females - Multirace
Median resident age - Females - Other Race
Commute - mean travel time to work (minutes)
Travel time to work - Less than 5 minutes (%)
Travel time to work - Less than 5 minutes (% change since 2000)
Travel time to work - 5 to 9 minutes (%)
Travel time to work - 5 to 9 minutes (% change since 2000)
Travel time to work - 10 to 19 minutes (%)
Travel time to work - 10 to 19 minutes (% change since 2000)
Travel time to work - 20 to 29 minutes (%)
Travel time to work - 20 to 29 minutes (% change since 2000)
Travel time to work - 30 to 39 minutes (%)
Travel time to work - 30 to 39 minutes (% change since 2000)
Travel time to work - 40 to 59 minutes (%)
Travel time to work - 40 to 59 minutes (% change since 2000)
Travel time to work - 60 to 89 minutes (%)
Travel time to work - 60 to 89 minutes (% change since 2000)
Travel time to work - 90 or more minutes (%)
Travel time to work - 90 or more minutes (% change since 2000)
Marital status - Never married (%)
Marital status - Now married (%)
Marital status - Separated (%)
Marital status - Widowed (%)
Marital status - Divorced (%)
Median family income ($)
Median family income (% change since 2000)
Median non-family income ($)
Median non-family income (% change since 2000)
Median per capita income ($)
Median per capita income (% change since 2000)
Median family income ($) - White
Median family income ($) - Black or African American
Median family income ($) - Asian
Median family income ($) - Hispanic or Latino
Median family income ($) - American Indian and Alaska Native
Median family income ($) - Multirace
Median family income ($) - Other Race
Median year house/condo built
Median year apartment built
Year house built - Built 2005 or later (%)
Year house built - Built 2000 to 2004 (%)
Year house built - Built 1990 to 1999 (%)
Year house built - Built 1980 to 1989 (%)
Year house built - Built 1970 to 1979 (%)
Year house built - Built 1960 to 1969 (%)
Year house built - Built 1950 to 1959 (%)
Year house built - Built 1940 to 1949 (%)
Year house built - Built 1939 or earlier (%)
Average household size
Household density (households per square mile)
Average household size - White
Average household size - Black or African American
Average household size - Asian
Average household size - Hispanic or Latino
Average household size - American Indian and Alaska Native
Average household size - Multirace
Average household size - Other Race
Occupied housing units (%)
Vacant housing units (%)
Owner occupied housing units (%)
Renter occupied housing units (%)
Vacancy status - For rent (%)
Vacancy status - For sale only (%)
Vacancy status - Rented or sold, not occupied (%)
Vacancy status - For seasonal, recreational, or occasional use (%)
Vacancy status - For migrant workers (%)
Vacancy status - Other vacant (%)
Residents with income below the poverty level (%)
Residents with income below 50% of the poverty level (%)
Children below poverty level (%)
Poor families by family type - Married-couple family (%)
Poor families by family type - Male, no wife present (%)
Poor families by family type - Female, no husband present (%)
Poverty status for native-born residents (%)
Poverty status for foreign-born residents (%)
Poverty among high school graduates not in families (%)
Poverty among people who did not graduate high school not in families (%)
Residents with income below the poverty level (%) - White
Residents with income below the poverty level (%) - Black or African American
Residents with income below the poverty level (%) - Asian
Residents with income below the poverty level (%) - Hispanic or Latino
Residents with income below the poverty level (%) - American Indian and Alaska Native
Residents with income below the poverty level (%) - Multirace
Residents with income below the poverty level (%) - Other Race
Air pollution - Air Quality Index (AQI)
Air pollution - CO
Air pollution - NO2
Air pollution - SO2
Air pollution - Ozone
Air pollution - PM10
Air pollution - PM25
Air pollution - Pb
Crime - Murders per 100,000 population
Crime - Rapes per 100,000 population
Crime - Robberies per 100,000 population
Crime - Assaults per 100,000 population
Crime - Burglaries per 100,000 population
Crime - Thefts per 100,000 population
Crime - Auto thefts per 100,000 population
Crime - Arson per 100,000 population
Crime - City-data.com crime index
Crime - Violent crime index
Crime - Property crime index
Crime - Murders per 100,000 population (5 year average)
Crime - Rapes per 100,000 population (5 year average)
Crime - Robberies per 100,000 population (5 year average)
Crime - Assaults per 100,000 population (5 year average)
Crime - Burglaries per 100,000 population (5 year average)
Crime - Thefts per 100,000 population (5 year average)
Crime - Auto thefts per 100,000 population (5 year average)
Crime - Arson per 100,000 population (5 year average)
Crime - City-data.com crime index (5 year average)
Crime - Violent crime index (5 year average)
Crime - Property crime index (5 year average)
1996 Presidential Elections Results (%) - Democratic Party (Clinton)
1996 Presidential Elections Results (%) - Republican Party (Dole)
1996 Presidential Elections Results (%) - Other
2000 Presidential Elections Results (%) - Democratic Party (Gore)
2000 Presidential Elections Results (%) - Republican Party (Bush)
2000 Presidential Elections Results (%) - Other
2004 Presidential Elections Results (%) - Democratic Party (Kerry)
2004 Presidential Elections Results (%) - Republican Party (Bush)
2004 Presidential Elections Results (%) - Other
2008 Presidential Elections Results (%) - Democratic Party (Obama)
2008 Presidential Elections Results (%) - Republican Party (McCain)
2008 Presidential Elections Results (%) - Other
2012 Presidential Elections Results (%) - Democratic Party (Obama)
2012 Presidential Elections Results (%) - Republican Party (Romney)
2012 Presidential Elections Results (%) - Other
2016 Presidential Elections Results (%) - Democratic Party (Clinton)
2016 Presidential Elections Results (%) - Republican Party (Trump)
2016 Presidential Elections Results (%) - Other
2020 Presidential Elections Results (%) - Democratic Party (Biden)
2020 Presidential Elections Results (%) - Republican Party (Trump)
2020 Presidential Elections Results (%) - Other
Ancestries Reported - Arab (%)
Ancestries Reported - Czech (%)
Ancestries Reported - Danish (%)
Ancestries Reported - Dutch (%)
Ancestries Reported - English (%)
Ancestries Reported - French (%)
Ancestries Reported - French Canadian (%)
Ancestries Reported - German (%)
Ancestries Reported - Greek (%)
Ancestries Reported - Hungarian (%)
Ancestries Reported - Irish (%)
Ancestries Reported - Italian (%)
Ancestries Reported - Lithuanian (%)
Ancestries Reported - Norwegian (%)
Ancestries Reported - Polish (%)
Ancestries Reported - Portuguese (%)
Ancestries Reported - Russian (%)
Ancestries Reported - Scotch-Irish (%)
Ancestries Reported - Scottish (%)
Ancestries Reported - Slovak (%)
Ancestries Reported - Subsaharan African (%)
Ancestries Reported - Swedish (%)
Ancestries Reported - Swiss (%)
Ancestries Reported - Ukrainian (%)
Ancestries Reported - United States (%)
Ancestries Reported - Welsh (%)
Ancestries Reported - West Indian (%)
Ancestries Reported - Other (%)
Educational Attainment - No schooling completed (%)
Educational Attainment - Less than high school (%)
Educational Attainment - High school or equivalent (%)
Educational Attainment - Less than 1 year of college (%)
Educational Attainment - 1 or more years of college (%)
Educational Attainment - Associate degree (%)
Educational Attainment - Bachelor's degree (%)
Educational Attainment - Master's degree (%)
Educational Attainment - Professional school degree (%)
Educational Attainment - Doctorate degree (%)
School Enrollment - Nursery, preschool (%)
School Enrollment - Kindergarten (%)
School Enrollment - Grade 1 to 4 (%)
School Enrollment - Grade 5 to 8 (%)
School Enrollment - Grade 9 to 12 (%)
School Enrollment - College undergrad (%)
School Enrollment - Graduate or professional (%)
School Enrollment - Not enrolled in school (%)
School enrollment - Public schools (%)
School enrollment - Private schools (%)
School enrollment - Not enrolled (%)
Median number of rooms in houses and condos
Median number of rooms in apartments
Housing units lacking complete plumbing facilities (%)
Housing units lacking complete kitchen facilities (%)
Density of houses
Urban houses (%)
Rural houses (%)
Households with people 60 years and over (%)
Households with people 65 years and over (%)
Households with people 75 years and over (%)
Households with one or more nonrelatives (%)
Households with no nonrelatives (%)
Population in households (%)
Family households (%)
Nonfamily households (%)
Population in families (%)
Family households with own children (%)
Median number of bedrooms in owner occupied houses
Mean number of bedrooms in owner occupied houses
Median number of bedrooms in renter occupied houses
Mean number of bedrooms in renter occupied houses
Median number of vehichles in owner occupied houses
Mean number of vehichles in owner occupied houses
Median number of vehichles in renter occupied houses
Mean number of vehichles in renter occupied houses
Mortgage status - with mortgage (%)
Mortgage status - with second mortgage (%)
Mortgage status - with home equity loan (%)
Mortgage status - with both second mortgage and home equity loan (%)
Mortgage status - without a mortgage (%)
Average family size
Average family size - White
Average family size - Black or African American
Average family size - Asian
Average family size - Hispanic or Latino
Average family size - American Indian and Alaska Native
Average family size - Multirace
Average family size - Other Race
Geographical mobility - Same house 1 year ago (%)
Geographical mobility - Moved within same county (%)
Geographical mobility - Moved from different county within same state (%)
Geographical mobility - Moved from different state (%)
Geographical mobility - Moved from abroad (%)
Place of birth - Born in state of residence (%)
Place of birth - Born in other state (%)
Place of birth - Native, outside of US (%)
Place of birth - Foreign born (%)
Housing units in structures - 1, detached (%)
Housing units in structures - 1, attached (%)
Housing units in structures - 2 (%)
Housing units in structures - 3 or 4 (%)
Housing units in structures - 5 to 9 (%)
Housing units in structures - 10 to 19 (%)
Housing units in structures - 20 to 49 (%)
Housing units in structures - 50 or more (%)
Housing units in structures - Mobile home (%)
Housing units in structures - Boat, RV, van, etc. (%)
House/condo owner moved in on average (years ago)
Renter moved in on average (years ago)
Year householder moved into unit - Moved in 1999 to March 2000 (%)
Year householder moved into unit - Moved in 1995 to 1998 (%)
Year householder moved into unit - Moved in 1990 to 1994 (%)
Year householder moved into unit - Moved in 1980 to 1989 (%)
Year householder moved into unit - Moved in 1970 to 1979 (%)
Year householder moved into unit - Moved in 1969 or earlier (%)
Means of transportation to work - Drove car alone (%)
Means of transportation to work - Carpooled (%)
Means of transportation to work - Public transportation (%)
Means of transportation to work - Bus or trolley bus (%)
Means of transportation to work - Streetcar or trolley car (%)
Means of transportation to work - Subway or elevated (%)
Means of transportation to work - Railroad (%)
Means of transportation to work - Ferryboat (%)
Means of transportation to work - Taxicab (%)
Means of transportation to work - Motorcycle (%)
Means of transportation to work - Bicycle (%)
Means of transportation to work - Walked (%)
Means of transportation to work - Other means (%)
Working at home (%)
Industry diversity
Most Common Industries - Agriculture, forestry, fishing and hunting, and mining (%)
Most Common Industries - Agriculture, forestry, fishing and hunting (%)
Most Common Industries - Mining, quarrying, and oil and gas extraction (%)
Most Common Industries - Construction (%)
Most Common Industries - Manufacturing (%)
Most Common Industries - Wholesale trade (%)
Most Common Industries - Retail trade (%)
Most Common Industries - Transportation and warehousing, and utilities (%)
Most Common Industries - Transportation and warehousing (%)
Most Common Industries - Utilities (%)
Most Common Industries - Information (%)
Most Common Industries - Finance and insurance, and real estate and rental and leasing (%)
Most Common Industries - Finance and insurance (%)
Most Common Industries - Real estate and rental and leasing (%)
Most Common Industries - Professional, scientific, and management, and administrative and waste management services (%)
Most Common Industries - Professional, scientific, and technical services (%)
Most Common Industries - Management of companies and enterprises (%)
Most Common Industries - Administrative and support and waste management services (%)
Most Common Industries - Educational services, and health care and social assistance (%)
Most Common Industries - Educational services (%)
Most Common Industries - Health care and social assistance (%)
Most Common Industries - Arts, entertainment, and recreation, and accommodation and food services (%)
Most Common Industries - Arts, entertainment, and recreation (%)
Most Common Industries - Accommodation and food services (%)
Most Common Industries - Other services, except public administration (%)
Most Common Industries - Public administration (%)
Occupation diversity
Most Common Occupations - Management, business, science, and arts occupations (%)
Most Common Occupations - Management, business, and financial occupations (%)
Most Common Occupations - Management occupations (%)
Most Common Occupations - Business and financial operations occupations (%)
Most Common Occupations - Computer, engineering, and science occupations (%)
Most Common Occupations - Computer and mathematical occupations (%)
Most Common Occupations - Architecture and engineering occupations (%)
Most Common Occupations - Life, physical, and social science occupations (%)
Most Common Occupations - Education, legal, community service, arts, and media occupations (%)
Most Common Occupations - Community and social service occupations (%)
Most Common Occupations - Legal occupations (%)
Most Common Occupations - Education, training, and library occupations (%)
Most Common Occupations - Arts, design, entertainment, sports, and media occupations (%)
Most Common Occupations - Healthcare practitioners and technical occupations (%)
Most Common Occupations - Health diagnosing and treating practitioners and other technical occupations (%)
Most Common Occupations - Health technologists and technicians (%)
Most Common Occupations - Service occupations (%)
Most Common Occupations - Healthcare support occupations (%)
Most Common Occupations - Protective service occupations (%)
Most Common Occupations - Fire fighting and prevention, and other protective service workers including supervisors (%)
Most Common Occupations - Law enforcement workers including supervisors (%)
Most Common Occupations - Food preparation and serving related occupations (%)
Most Common Occupations - Building and grounds cleaning and maintenance occupations (%)
Most Common Occupations - Personal care and service occupations (%)
Most Common Occupations - Sales and office occupations (%)
Most Common Occupations - Sales and related occupations (%)
Most Common Occupations - Office and administrative support occupations (%)
Most Common Occupations - Natural resources, construction, and maintenance occupations (%)
Most Common Occupations - Farming, fishing, and forestry occupations (%)
Most Common Occupations - Construction and extraction occupations (%)
Most Common Occupations - Installation, maintenance, and repair occupations (%)
Most Common Occupations - Production, transportation, and material moving occupations (%)
Most Common Occupations - Production occupations (%)
Most Common Occupations - Transportation occupations (%)
Most Common Occupations - Material moving occupations (%)
People in Group quarters - Institutionalized population (%)
People in Group quarters - Correctional institutions (%)
People in Group quarters - Federal prisons and detention centers (%)
People in Group quarters - Halfway houses (%)
People in Group quarters - Local jails and other confinement facilities (including police lockups) (%)
People in Group quarters - Military disciplinary barracks (%)
People in Group quarters - State prisons (%)
People in Group quarters - Other types of correctional institutions (%)
People in Group quarters - Nursing homes (%)
People in Group quarters - Hospitals/wards, hospices, and schools for the handicapped (%)
People in Group quarters - Hospitals/wards and hospices for chronically ill (%)
People in Group quarters - Hospices or homes for chronically ill (%)
People in Group quarters - Military hospitals or wards for chronically ill (%)
People in Group quarters - Other hospitals or wards for chronically ill (%)
People in Group quarters - Hospitals or wards for drug/alcohol abuse (%)
People in Group quarters - Mental (Psychiatric) hospitals or wards (%)
People in Group quarters - Schools, hospitals, or wards for the mentally retarded (%)
People in Group quarters - Schools, hospitals, or wards for the physically handicapped (%)
People in Group quarters - Institutions for the deaf (%)
People in Group quarters - Institutions for the blind (%)
People in Group quarters - Orthopedic wards and institutions for the physically handicapped (%)
People in Group quarters - Wards in general hospitals for patients who have no usual home elsewhere (%)
People in Group quarters - Wards in military hospitals for patients who have no usual home elsewhere (%)
People in Group quarters - Juvenile institutions (%)
People in Group quarters - Long-term care (%)
People in Group quarters - Homes for abused, dependent, and neglected children (%)
People in Group quarters - Residential treatment centers for emotionally disturbed children (%)
People in Group quarters - Training schools for juvenile delinquents (%)
People in Group quarters - Short-term care, detention or diagnostic centers for delinquent children (%)
People in Group quarters - Type of juvenile institution unknown (%)
People in Group quarters - Noninstitutionalized population (%)
People in Group quarters - College dormitories (includes college quarters off campus) (%)
People in Group quarters - Military quarters (%)
People in Group quarters - On base (%)
People in Group quarters - Barracks, unaccompanied personnel housing (UPH), (Enlisted/Officer), ;and similar group living quarters for military personnel (%)
People in Group quarters - Transient quarters for temporary residents (%)
People in Group quarters - Military ships (%)
People in Group quarters - Group homes (%)
People in Group quarters - Homes or halfway houses for drug/alcohol abuse (%)
People in Group quarters - Homes for the mentally ill (%)
People in Group quarters - Homes for the mentally retarded (%)
People in Group quarters - Homes for the physically handicapped (%)
People in Group quarters - Other group homes (%)
People in Group quarters - Religious group quarters (%)
People in Group quarters - Dormitories (%)
People in Group quarters - Agriculture workers' dormitories on farms (%)
People in Group quarters - Job Corps and vocational training facilities (%)
People in Group quarters - Other workers' dormitories (%)
People in Group quarters - Crews of maritime vessels (%)
People in Group quarters - Other nonhousehold living situations (%)
People in Group quarters - Other noninstitutional group quarters (%)
Residents speaking English at home (%)
Residents speaking English at home - Born in the United States (%)
Residents speaking English at home - Native, born elsewhere (%)
Residents speaking English at home - Foreign born (%)
Residents speaking Spanish at home (%)
Residents speaking Spanish at home - Born in the United States (%)
Residents speaking Spanish at home - Native, born elsewhere (%)
Residents speaking Spanish at home - Foreign born (%)
Residents speaking other language at home (%)
Residents speaking other language at home - Born in the United States (%)
Residents speaking other language at home - Native, born elsewhere (%)
Residents speaking other language at home - Foreign born (%)
Class of Workers - Employee of private company (%)
Class of Workers - Self-employed in own incorporated business (%)
Class of Workers - Private not-for-profit wage and salary workers (%)
Class of Workers - Local government workers (%)
Class of Workers - State government workers (%)
Class of Workers - Federal government workers (%)
Class of Workers - Self-employed workers in own not incorporated business and Unpaid family workers (%)
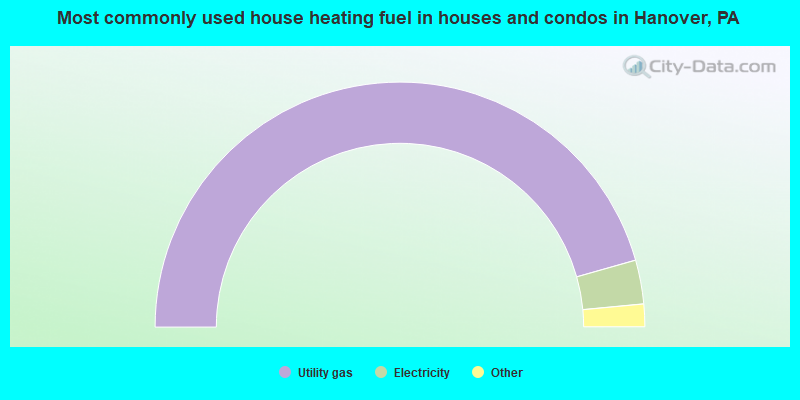
House heating fuel used in houses and condos - Utility gas (%)
House heating fuel used in houses and condos - Bottled, tank, or LP gas (%)
House heating fuel used in houses and condos - Electricity (%)
House heating fuel used in houses and condos - Fuel oil, kerosene, etc. (%)
House heating fuel used in houses and condos - Coal or coke (%)
House heating fuel used in houses and condos - Wood (%)
House heating fuel used in houses and condos - Solar energy (%)
House heating fuel used in houses and condos - Other fuel (%)
House heating fuel used in houses and condos - No fuel used (%)
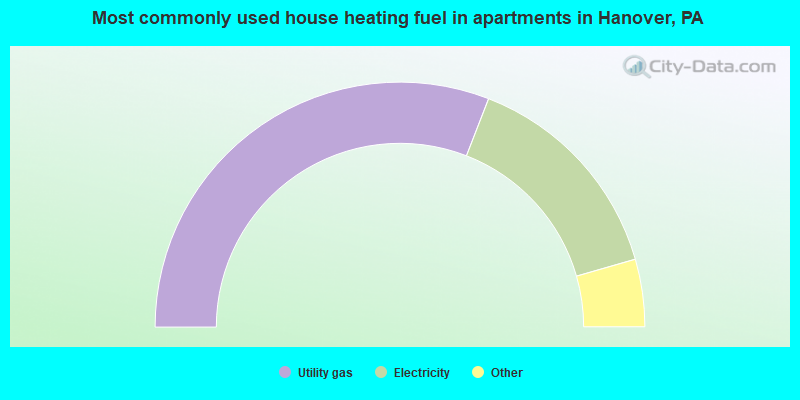
House heating fuel used in apartments - Utility gas (%)
House heating fuel used in apartments - Bottled, tank, or LP gas (%)
House heating fuel used in apartments - Electricity (%)
House heating fuel used in apartments - Fuel oil, kerosene, etc. (%)
House heating fuel used in apartments - Coal or coke (%)
House heating fuel used in apartments - Wood (%)
House heating fuel used in apartments - Solar energy (%)
House heating fuel used in apartments - Other fuel (%)
House heating fuel used in apartments - No fuel used (%)
Armed forces status - In Armed Forces (%)
Armed forces status - Civilian (%)
Armed forces status - Civilian - Veteran (%)
Armed forces status - Civilian - Nonveteran (%)
Fatal accidents locations in years 2005-2021
Fatal accidents locations in 2005
Fatal accidents locations in 2006
Fatal accidents locations in 2007
Fatal accidents locations in 2008
Fatal accidents locations in 2009
Fatal accidents locations in 2010
Fatal accidents locations in 2011
Fatal accidents locations in 2012
Fatal accidents locations in 2013
Fatal accidents locations in 2014
Fatal accidents locations in 2015
Fatal accidents locations in 2016
Fatal accidents locations in 2017
Fatal accidents locations in 2018
Fatal accidents locations in 2019
Fatal accidents locations in 2020
Fatal accidents locations in 2021
Alcohol use - People drinking some alcohol every month (%)
Alcohol use - People not drinking at all (%)
Alcohol use - Average days/month drinking alcohol
Alcohol use - Average drinks/week
Alcohol use - Average days/year people drink much
Audiometry - Average condition of hearing (%)
Audiometry - People that can hear a whisper from across a quiet room (%)
Audiometry - People that can hear normal voice from across a quiet room (%)
Audiometry - Ears ringing, roaring, buzzing (%)
Audiometry - Had a job exposure to loud noise (%)
Audiometry - Had off-work exposure to loud noise (%)
Blood Pressure & Cholesterol - Has high blood pressure (%)
Blood Pressure & Cholesterol - Checking blood pressure at home (%)
Blood Pressure & Cholesterol - Frequently checking blood cholesterol (%)
Blood Pressure & Cholesterol - Has high cholesterol level (%)
Consumer Behavior - Money monthly spent on food at supermarket/grocery store
Consumer Behavior - Money monthly spent on food at other stores
Consumer Behavior - Money monthly spent on eating out
Consumer Behavior - Money monthly spent on carryout/delivered foods
Consumer Behavior - Income spent on food at supermarket/grocery store (%)
Consumer Behavior - Income spent on food at other stores (%)
Consumer Behavior - Income spent on eating out (%)
Consumer Behavior - Income spent on carryout/delivered foods (%)
Current Health Status - General health condition (%)
Current Health Status - Blood donors (%)
Current Health Status - Has blood ever tested for HIV virus (%)
Current Health Status - Left-handed people (%)
Dermatology - People using sunscreen (%)
Diabetes - Diabetics (%)
Diabetes - Had a blood test for high blood sugar (%)
Diabetes - People taking insulin (%)
Diet Behavior & Nutrition - Diet health (%)
Diet Behavior & Nutrition - Milk product consumption (# of products/month)
Diet Behavior & Nutrition - Meals not home prepared (#/week)
Diet Behavior & Nutrition - Meals from fast food or pizza place (#/week)
Diet Behavior & Nutrition - Ready-to-eat foods (#/month)
Diet Behavior & Nutrition - Frozen meals/pizza (#/month)
Drug Use - People that ever used marijuana or hashish (%)
Drug Use - Ever used hard drugs (%)
Drug Use - Ever used any form of cocaine (%)
Drug Use - Ever used heroin (%)
Drug Use - Ever used methamphetamine (%)
Health Insurance - People covered by health insurance (%)
Kidney Conditions-Urology - Avg. # of times urinating at night
Medical Conditions - People with asthma (%)
Medical Conditions - People with anemia (%)
Medical Conditions - People with psoriasis (%)
Medical Conditions - People with overweight (%)
Medical Conditions - Elderly people having difficulties in thinking or remembering (%)
Medical Conditions - People who ever received blood transfusion (%)
Medical Conditions - People having trouble seeing even with glass/contacts (%)
Medical Conditions - People with arthritis (%)
Medical Conditions - People with gout (%)
Medical Conditions - People with congestive heart failure (%)
Medical Conditions - People with coronary heart disease (%)
Medical Conditions - People with angina pectoris (%)
Medical Conditions - People who ever had heart attack (%)
Medical Conditions - People who ever had stroke (%)
Medical Conditions - People with emphysema (%)
Medical Conditions - People with thyroid problem (%)
Medical Conditions - People with chronic bronchitis (%)
Medical Conditions - People with any liver condition (%)
Medical Conditions - People who ever had cancer or malignancy (%)
Mental Health - People who have little interest in doing things (%)
Mental Health - People feeling down, depressed, or hopeless (%)
Mental Health - People who have trouble sleeping or sleeping too much (%)
Mental Health - People feeling tired or having little energy (%)
Mental Health - People with poor appetite or overeating (%)
Mental Health - People feeling bad about themself (%)
Mental Health - People who have trouble concentrating on things (%)
Mental Health - People moving or speaking slowly or too fast (%)
Mental Health - People having thoughts they would be better off dead (%)
Oral Health - Average years since last visit a dentist
Oral Health - People embarrassed because of mouth (%)
Oral Health - People with gum disease (%)
Oral Health - General health of teeth and gums (%)
Oral Health - Average days a week using dental floss/device
Oral Health - Average days a week using mouthwash for dental problem
Oral Health - Average number of teeth
Pesticide Use - Households using pesticides to control insects (%)
Pesticide Use - Households using pesticides to kill weeds (%)
Physical Activity - People doing vigorous-intensity work activities (%)
Physical Activity - People doing moderate-intensity work activities (%)
Physical Activity - People walking or bicycling (%)
Physical Activity - People doing vigorous-intensity recreational activities (%)
Physical Activity - People doing moderate-intensity recreational activities (%)
Physical Activity - Average hours a day doing sedentary activities
Physical Activity - Average hours a day watching TV or videos
Physical Activity - Average hours a day using computer
Physical Functioning - People having limitations keeping them from working (%)
Physical Functioning - People limited in amount of work they can do (%)
Physical Functioning - People that need special equipment to walk (%)
Physical Functioning - People experiencing confusion/memory problems (%)
Physical Functioning - People requiring special healthcare equipment (%)
Prescription Medications - Average number of prescription medicines taking
Preventive Aspirin Use - Adults 40+ taking low-dose aspirin (%)
Reproductive Health - Vaginal deliveries (%)
Reproductive Health - Cesarean deliveries (%)
Reproductive Health - Deliveries resulted in a live birth (%)
Reproductive Health - Pregnancies resulted in a delivery (%)
Reproductive Health - Women breastfeeding newborns (%)
Reproductive Health - Women that had a hysterectomy (%)
Reproductive Health - Women that had both ovaries removed (%)
Reproductive Health - Women that have ever taken birth control pills (%)
Reproductive Health - Women taking birth control pills (%)
Reproductive Health - Women that have ever used Depo-Provera or injectables (%)
Reproductive Health - Women that have ever used female hormones (%)
Sexual Behavior - People 18+ that ever had sex (vaginal, anal, or oral) (%)
Sexual Behavior - Males 18+ that ever had vaginal sex with a woman (%)
Sexual Behavior - Males 18+ that ever performed oral sex on a woman (%)
Sexual Behavior - Males 18+ that ever had anal sex with a woman (%)
Sexual Behavior - Males 18+ that ever had any sex with a man (%)
Sexual Behavior - Females 18+ that ever had vaginal sex with a man (%)
Sexual Behavior - Females 18+ that ever performed oral sex on a man (%)
Sexual Behavior - Females 18+ that ever had anal sex with a man (%)
Sexual Behavior - Females 18+ that ever had any kind of sex with a woman (%)
Sexual Behavior - Average age people first had sex
Sexual Behavior - Average number of female sex partners in lifetime (males 18+)
Sexual Behavior - Average number of female vaginal sex partners in lifetime (males 18+)
Sexual Behavior - Average age people first performed oral sex on a woman (18+)
Sexual Behavior - Average number of woman performed oral sex on in lifetime (18+)
Sexual Behavior - Average number of male sex partners in lifetime (males 18+)
Sexual Behavior - Average number of male anal sex partners in lifetime (males 18+)
Sexual Behavior - Average age people first performed oral sex on a man (18+)
Sexual Behavior - Average number of male oral sex partners in lifetime (18+)
Sexual Behavior - People using protection when performing oral sex (%)
Sexual Behavior - Average number of times people have vaginal or anal sex a year
Sexual Behavior - People having sex without condom (%)
Sexual Behavior - Average number of male sex partners in lifetime (females 18+)
Sexual Behavior - Average number of male vaginal sex partners in lifetime (females 18+)
Sexual Behavior - Average number of female sex partners in lifetime (females 18+)
Sexual Behavior - Circumcised males 18+ (%)
Sleep Disorders - Average hours sleeping at night
Sleep Disorders - People that has trouble sleeping (%)
Smoking-Cigarette Use - People smoking cigarettes (%)
Taste & Smell - People 40+ having problems with smell (%)
Taste & Smell - People 40+ having problems with taste (%)
Taste & Smell - People 40+ that ever had wisdom teeth removed (%)
Taste & Smell - People 40+ that ever had tonsils teeth removed (%)
Taste & Smell - People 40+ that ever had a loss of consciousness because of a head injury (%)
Taste & Smell - People 40+ that ever had a broken nose or other serious injury to face or skull (%)
Taste & Smell - People 40+ that ever had two or more sinus infections (%)
Weight - Average height (inches)
Weight - Average weight (pounds)
Weight - Average BMI
Weight - People that are obese (%)
Weight - People that ever were obese (%)
Weight - People trying to lose weight (%)
Officers per 1,000 residents here:
1.52Pennsylvania average:
2.70
Latest news from Hanover, PA collected exclusively by city-data.com from local newspapers, TV, and radio stations
Ancestries: German (33.8%), American (14.1%), Irish (7.1%), English (6.2%), Italian (3.1%), European (2.7%).
Current Local Time:
Incorporated on 03/04/1815
Land area: 3.65 square miles.
Population density: 4,533 people per square mile (average).
981 residents are foreign born (4.3% Latin America , 0.7% Asia , 0.7% Europe ).
This borough:
5.9%Pennsylvania:
7.3%
Median real estate property taxes paid for housing units with mortgages in 2022: $3,634 (1.8%)Median real estate property taxes paid for housing units with no mortgage in 2022: $3,940 (2.1%)
Nearest city with pop. 50,000+: Towson, MD
Nearest city with pop. 200,000+: Baltimore, MD
Nearest city with pop. 1,000,000+: Philadelphia, PA
Nearest cities:
Latitude: 39.81 N, Longitude: 76.98 W
Nickname or alias (official or unofficial): Snack Capital of the World
Daytime population change due to commuting: +6,397 (+38.6%)Workers who live and work in this borough: 3,099 (38.2%)
Area code commonly used in this area: 717
Property values in Hanover, PA
Hanover tourist attractions:
Unemployment in December 2023: Here:
2.5%Pennsylvania:
2.9%
Most common occupations in Hanover, PA (%)
Both Males Females
Other production occupations, including supervisors (8.5%)
Laborers and material movers, hand (5.1%)
Other sales and related occupations, including supervisors (4.7%)
Material recording, scheduling, dispatching, and distributing workers (4.2%)
Other office and administrative support workers, including supervisors (4.2%)
Retail sales workers, except cashiers (3.9%)
Building and grounds cleaning and maintenance occupations (3.6%)
Other production occupations, including supervisors (11.9%)
Driver/sales workers and truck drivers (6.7%)
Laborers and material movers, hand (6.0%)
Metal workers and plastic workers (5.1%)
Other management occupations, except farmers and farm managers (4.8%)
Other sales and related occupations, including supervisors (4.5%)
Electrical equipment mechanics and other installation, maintenance, and repair workers, including supervisors (4.2%)
Other office and administrative support workers, including supervisors (7.0%)
Other sales and related occupations, including supervisors (4.9%)
Other production occupations, including supervisors (4.8%)
Retail sales workers, except cashiers (4.4%)
Building and grounds cleaning and maintenance occupations (4.3%)
Material recording, scheduling, dispatching, and distributing workers (4.3%)
Laborers and material movers, hand (4.0%)
Tornado activity:
Hanover-area historical tornado activity is slightly above Pennsylvania state average. It is 14% greater than the overall U.S. average.
On 4/5/1952, a category F3 (max. wind speeds 158-206 mph) tornado 0.6 miles away from the Hanover borough center injured 4 people and caused between $500,000 and $5,000,000 in damages.
On 6/7/1980, a category F3 tornado 8.7 miles away from the borough center caused between $50,000 and $500,000 in damages.
Earthquake activity:
Hanover-area historical earthquake activity is significantly above Pennsylvania state average. It is 58% smaller than the overall U.S. average. On 8/23/2011 at 17:51:04, a magnitude 5.8 (5.8 MW, Depth: 3.7 mi, Class: Moderate, Intensity: VI - VII) earthquake occurred 140.9 miles away from Hanover center On 1/16/1994 at 01:49:16, a magnitude 4.6 (4.6 MB, 4.6 LG, Depth: 3.1 mi, Class: Light, Intensity: IV - V) earthquake occurred 61.8 miles away from the city center On 9/25/1998 at 19:52:52, a magnitude 5.2 (4.8 MB, 4.3 MS, 5.2 LG, 4.5 MW, Depth: 3.1 mi) earthquake occurred 213.5 miles away from Hanover center On 1/16/1994 at 00:42:43, a magnitude 4.2 (4.2 MB, 4.0 LG, Depth: 3.1 mi) earthquake occurred 63.0 miles away from Hanover center On 8/25/2011 at 05:07:52, a magnitude 4.5 (4.5 ML, Depth: 4.2 mi) earthquake occurred 139.1 miles away from Hanover center On 12/9/2003 at 20:59:18, a magnitude 4.5 (4.5 ML, Depth: 6.2 mi) earthquake occurred 152.9 miles away from Hanover center Magnitude types: regional Lg-wave magnitude (LG), body-wave magnitude (MB), local magnitude (ML), surface-wave magnitude (MS), moment magnitude (MW) Natural disasters: The number of natural disasters in York County (18) is near the US average (15).Major Disasters (Presidential) Declared: 13Emergencies Declared: 5Winter Storms: 5, Floods: 3, Hurricanes: 3, Snowstorms: 3, Storms: 3, Tropical Storms: 3, Blizzard: 1, Heavy Rain: 1, Snowfall: 1, Tropical Depression: 1, Other: 1 (Note: some incidents may be assigned to more than one category). Main business address for: HANOVER FOODS CORP /PA/ CANNED, FRUITS, VEG & PRESERVES, JAMS & JELLIES ).
Hospitals and medical centers in Hanover: HANOVER HOSPITAL (Voluntary non-profit - Private, provides emergency services, 300 HIGHLAND AVE) SKILLS OF CENTRAL PENNSYLVANIA INC - ALLEGHENY (276 ALLEGHENY AVENUE) KEYSTONE HOME CARE, INC (401 ALLEGHENY AVENUE)
VNA OF HANOVER SPRING GROVE (440 NORTH MADISON ST)
HANOVER HALL (267 FREDERICK STREET)
HOMEWOOD AT PLUM CREEK (425 WESTMINSTER AVENUE)
SKILLED CARE CENTER AT UTZ TERRACE (2100 UTZ TERRACE)
Heliports located in Hanover:
Colleges/Universities in Hanover: Empire Beauty School-Hanover Full-time enrollment: 113; Location: Clearview Shp Ctr., 1000 Carlisle St; Private, for-profit; Website: www.empire.edu)
Hanover Public School District Practical Nursing Program Full-time enrollment: 66; Location: 403 Moul Ave; Public; Website: www.hpsd.k12.pa.us/?q=node/2193)
Colleges/universities with over 2000 students nearest to Hanover:
Gettysburg College (about 14 miles; Gettysburg, PA ; Full-time enrollment: 2,772)
McDaniel College (about 16 miles; Westminster, MD ; FT enrollment: 2,558)
York College Pennsylvania (about 17 miles; York, PA ; FT enrollment: 5,140)
Carroll Community College (about 20 miles; Westminster, MD ; FT enrollment: 2,682)
Mount St Mary's University (about 22 miles; Emmitsburg, MD ; FT enrollment: 2,313)
YTI Career Institute-York (about 22 miles; York, PA ; FT enrollment: 2,212)
Messiah College (about 25 miles; Mechanicsburg, PA ; FT enrollment: 3,035)
Public high schools in Hanover: SOUTH WESTERN SHS Students: 1,374, Location: 200 BOWMAN RD, Grades: 9-12)HANOVER SHS Students: 989, Location: 401 MOUL AVE, Grades: 8-12)Private high schools in Hanover: HOPE CHRISTIAN SCHOOL OF HANOVER Students: 71, Location: 6450 HOPE WAY, Grades: KG-12)
HANOVER MENNONITE SCHOOL Students: 32, Location: HIGH ST, Grades: 2-9)
MISSIONARY BIBLE BAPTIST ACADEMY Students: 10, Location: 920 BECK MILL RD, Grades: 5-10)
Public elementary/middle schools in Hanover: MARKLE INTRMD SCH Students: 988, Location: 225 BOWMAN RD, Grades: 6-8)WEST MANHEIM EL SCH Students: 562, Location: 2000 BALTIMORE PIKE, Grades: KG-5)CONEWAGO TWP EL SCH Students: 554, Location: 1189 W ELM AVE, Grades: KG-3)HANOVER MS Students: 536, Location: 300 KEAGY AVE, Grades: 5-8)PARK HILLS EL SCH Students: 520, Location: 137 W GRANGER ST, Grades: KG-5)BARESVILLE EL SCH Students: 495, Location: 135 SANFORD AVE, Grades: KG-5)HANOVER STREET EL SCH Students: 151, Location: 101 EAST HANOVER STREET, Grades: KG-4)CLEARVIEW EL SCH Location: 801 RANDOLPH ST, Grades: KG-4)WASHINGTON EL SCH Location: 301 MOUL AVENUE, Grades: KG-4)Private elementary/middle schools in Hanover: SACRED HEART OF JESUS SCHOOL Students: 262, Location: 55 BASILICA DR, Grades: KG-8)
ST JOSEPH SCHOOL Students: 227, Location: 236 BALTIMORE ST, Grades: PK-8)
See full list of schools located in Hanover Library in Hanover: GUTHRIE MEMORIAL LIBRARY - HANOVER'S PUBLIC L Operating income: $1,073,638; Location: 2 LIBRARY PLACE; 94,447 books ; 6,471 audio materials ; 2,838 video materials ; 41 state licensed databases ; 184 print serial subscriptions )
Birthplace of: David Holmes (politician) - Politician, Jim Spencer - Baseball player, John P. Sanderson - Politician, Rita Mae Brown - Novelist, Terry Wentz - Pennsylvania State parks manager, Al Bemiller - Football player, Sarah Dreher - Writer, Dick Alban - Football player, Frederick Ernst Melsheimer - Entomologist, John Milton Miller - Electrical engineer.
York County has a predicted average indoor radon screening level greater than 4 pCi/L (pico curies per liter) - Highest Potential Drinking water stations with addresses in Hanover and their reported violations in the past:
SPEEDWAY 94 (Population served: 500, Groundwater):
Past health violations:
MCL, Monthly (TCR) - Between OCT-2011 and DEC-2011, Contaminant: Coliform. Follow-up actions: St Formal NOV issued (DEC-02-2011), St Public Notif requested (DEC-02-2011), St Compliance achieved (DEC-02-2011), St Violation/Reminder Notice (DEC-02-2011)
MCL, Monthly (TCR) - Between JUL-2011 and SEP-2011, Contaminant: Coliform. Follow-up actions: St Formal NOV issued (SEP-27-2011), St Violation/Reminder Notice (SEP-27-2011), St Public Notif requested (SEP-27-2011), St Compliance achieved (NOV-28-2012)
MCL, Monthly (TCR) - Between JUL-2010 and SEP-2010, Contaminant: Coliform. Follow-up actions: St Public Notif requested (OCT-01-2010), St Violation/Reminder Notice (OCT-01-2010), St Formal NOV issued (OCT-01-2010), St Compliance achieved (FEB-23-2011)
MCL, Monthly (TCR) - Between APR-2008 and JUN-2008, Contaminant: Coliform. Follow-up actions: St Formal NOV issued (JUL-28-2008), St Violation/Reminder Notice (JUL-28-2008), St Public Notif requested (JUL-28-2008), St Compliance achieved (NOV-19-2008)
Past monitoring violations:
Monitoring, Source Water (GWR) - Between NOV-02-2011 and DEC-02-2011, Contaminant: E. COLI. Follow-up actions: St Formal NOV issued (DEC-02-2011), St Violation/Reminder Notice (DEC-02-2011), St Public Notif requested (DEC-02-2011), St Compliance achieved (FEB-24-2012)
Monitoring, Repeat Major (TCR) - Between OCT-2011 and DEC-2011, Contaminant: Coliform (TCR). Follow-up actions: St Formal NOV issued (DEC-02-2011), St Violation/Reminder Notice (DEC-02-2011), St Public Notif requested (DEC-02-2011), St Compliance achieved (FEB-24-2012)
Monitoring, Source Water (GWR) - Between SEP-24-2011 and OCT-24-2011, Contaminant: E. COLI. Follow-up actions: St Formal NOV issued (NOV-08-2011), St Violation/Reminder Notice (NOV-08-2011), St Public Notif requested (NOV-08-2011), St Compliance achieved (JAN-09-2012)
Monitoring, Source Water (GWR) - In AUG-2010, Contaminant: E. COLI. Follow-up actions: St Violation/Reminder Notice (OCT-01-2010), St Compliance achieved (OCT-01-2010)
2 routine major monitoring violations
One minor monitoring violation
Population served: 250, Groundwater):
Past monitoring violations:
Monitoring, Source Water (GWR) - Between JUL-15-2013 and AUG-15-2013, Contaminant: E. COLI. Follow-up actions: St Violation/Reminder Notice (SEP-19-2013), St Compliance achieved (SEP-19-2013)
Monitoring, Repeat Major (TCR) - In JUL-2006, Contaminant: Coliform (TCR). Follow-up actions: St Violation/Reminder Notice (JAN-12-2007), St Compliance achieved (MAY-08-2007), St Public Notif requested (MAY-08-2007)
4 routine major monitoring violations
One minor monitoring violation
5 regular monitoring violations
Population served: 200, Groundwater):
Past health violations:
MCL, Average - Between APR-2006 and MAR-2007, Contaminant: Nitrite. Follow-up actions: St Compliance Meeting conducted (MAY-10-2007), St Violation/Reminder Notice (MAY-10-2007), St Public Notif requested (MAY-10-2007), St Compliance achieved (JUN-26-2007)
Population served: 200, Groundwater):
Past monitoring violations:
One routine major monitoring violation
3 regular monitoring violations
Population served: 200, Groundwater):
Past monitoring violations:
Monitoring, Source Water (GWR) - Between MAY-28-2013 and JUN-28-2013, Contaminant: E. COLI. Follow-up actions: St Violation/Reminder Notice (JUL-11-2013), St Compliance achieved (JUL-11-2013)
One routine major monitoring violation
Population served: 150, Groundwater):
Past monitoring violations:
One routine major monitoring violation
Population served: 100, Groundwater):
Past health violations:
MCL, Average - Between APR-2006 and MAR-2007, Contaminant: Nitrate. Follow-up actions: St Compliance Meeting conducted (MAY-10-2007), St Violation/Reminder Notice (MAY-10-2007), St Public Notif requested (MAY-10-2007), St Compliance achieved (JUN-26-2007)
Population served: 100, Groundwater):
Past health violations:
MCL, Single Sample - Between APR-2012 and JUN-2012, Contaminant: Nitrate. Follow-up actions: St Public Notif requested (AUG-09-2012), St Public Notif received (AUG-09-2012), St Compliance achieved (AUG-09-2012), St Formal NOV issued (AUG-09-2012), St Violation/Reminder Notice (AUG-09-2012)
MCL, Single Sample - Between JAN-2012 and MAR-2012, Contaminant: Nitrate. Follow-up actions: St Violation/Reminder Notice (MAY-16-2012), St Public Notif requested (MAY-16-2012), St Formal NOV issued (MAY-16-2012), St Compliance achieved (JUL-10-2012)
MCL, Single Sample - Between OCT-2011 and DEC-2011, Contaminant: Nitrate. Follow-up actions: St Public Notif requested (FEB-06-2012), St Violation/Reminder Notice (FEB-06-2012), St Public Notif received (FEB-06-2012), St Formal NOV issued (FEB-06-2012), St Compliance achieved (JUL-10-2012)
MCL, Average - Between JUL-2011 and SEP-2011, Contaminant: Nitrate. Follow-up actions: St Formal NOV issued (NOV-10-2011), St Public Notif requested (NOV-10-2011), St Public Notif received (NOV-10-2011), St Violation/Reminder Notice (NOV-10-2011), St Compliance achieved (NOV-10-2011)
MCL, Monthly (TCR) - In MAR-2011, Contaminant: Coliform. Follow-up actions: St Public Notif requested (MAY-10-2011), St Public Notif received (MAY-10-2011), St Compliance achieved (MAY-10-2011), St Formal NOV issued (MAY-10-2011)
Past monitoring violations:
Monitoring of Treatment (SWTR-Unfilt/GWR) - In MAY-2014, Contaminant: GROUNDWATER RULE. Follow-up actions: St Violation/Reminder Notice (JUL-16-2014), St Formal NOV issued (JUL-16-2014)
Monitoring of Treatment (SWTR-Unfilt/GWR) - In APR-2014, Contaminant: GROUNDWATER RULE. Follow-up actions: St Violation/Reminder Notice (JUL-16-2014), St Formal NOV issued (JUL-16-2014)
Monitoring of Treatment (SWTR-Unfilt/GWR) - In MAR-2014, Contaminant: GROUNDWATER RULE. Follow-up actions: St Violation/Reminder Notice (MAY-15-2014), St Public Notif requested (MAY-15-2014)
Monitoring of Treatment (SWTR-Unfilt/GWR) - In FEB-2014, Contaminant: GROUNDWATER RULE. Follow-up actions: St Violation/Reminder Notice (APR-10-2014)
Monitoring of Treatment (SWTR-Unfilt/GWR) - In DEC-2013, Contaminant: GROUNDWATER RULE. Follow-up actions: St Violation/Reminder Notice (FEB-06-2014), St Compliance achieved (MAR-18-2014)
14 other older monitoring violations
Drinking water stations with addresses in Hanover that have no violations reported:
FELLOWSHIP CAMP GROVE (Population served: 100, Primary Water Source Type: Groundwater)
Average household size: This borough:
2.2 peoplePennsylvania:
2.5 people
Percentage of family households: This borough:
57.6%Whole state:
65.0%
Percentage of households with unmarried partners: This borough:
9.0%Whole state:
6.6%
Likely homosexual households (counted as self-reported same-sex unmarried-partner households)
Lesbian couples: 0.4% of all households Gay men: 0.2% of all households
People in group quarters in Hanover in 2010:
144 people in nursing facilities/skilled-nursing facilities
28 people in group homes intended for adults
8 people in residential treatment centers for adults
People in group quarters in Hanover in 2000:
193 people in nursing homes
64 people in other noninstitutional group quarters
18 people in homes for the mentally ill
5 people in homes for the mentally retarded
4 people in religious group quarters
Banks with most branches in Hanover (2011 data):
Manufacturers and Traders Trust Company: 7 branches. Info updated 2011/08/08: Bank assets: $76,887.1 mil, Deposits: $60,064.2 mil, headquarters in Buffalo, NY, positive income , Commercial Lending Specialization, 808 total offices , Holding Company: M&T Bank Corporation
Susquehanna Bank: Hanover Eisenhower Drive Branch, Hanover Branch, South Hanover Branch, Wetzel Drive Branch, North Hanover Branch, Hanover Branch. Info updated 2012/02/28: Bank assets: $14,849.0 mil, Deposits: $10,294.4 mil, headquarters in Lititz, PA, positive income , Commercial Lending Specialization, 308 total offices , Holding Company: Susquehanna Bancshares, Inc.
PNC Bank, National Association: Plaza Office, Downtown Hanover, Baltimore Street Branch, Eisenhower Drive Branch. Info updated 2012/03/20: Bank assets: $263,309.6 mil, Deposits: $197,343.0 mil, headquarters in Wilmington, DE, positive income , Commercial Lending Specialization, 3085 total offices , Holding Company: Pnc Financial Services Group, Inc., The
Woodforest National Bank: Hanover Walmart Branch at 1881 Baltimore Pike, branch established on 2008/02/23; Hanover Walmart Branch at 495 Eisenhower Drive, branch established on 2007/06/16. Info updated 2011/05/10: Bank assets: $3,488.9 mil, Deposits: $3,097.6 mil, headquarters in Houston, TX, positive income , Commercial Lending Specialization, 766 total offices , Holding Company: Woodforest Financial Group Employee Stock Ownership Plan (With 401(K) Provisions)
ACNB Bank: Hanover Branch at 1127 Eichelberger Street, branch established on 1991/06/12; South Hanover Branch at 865 Baltimore Street, branch established on 2006/04/10. Info updated 2011/02/07: Bank assets: $988.9 mil, Deposits: $785.0 mil, headquarters in Gettysburg, PA, positive income , Commercial Lending Specialization, 18 total offices , Holding Company: Acnb Corporation
Sovereign Bank, National Association: Hanover Branch at 1700 Baltimore Pike, branch established on 1992/11/15; 201 Dart Drive Branch at 201 Dart Drive, branch established on 1955/11/17. Info updated 2012/01/31: Bank assets: $78,146.9 mil, Deposits: $48,042.9 mil, headquarters in Wilmington, DE, positive income , Commercial Lending Specialization, 718 total offices , Holding Company: Banco Santander, S.A.
PeoplesBank, a Codorus Valley Company: South Hanover Branch at 1400 Baltimore Street, branch established on 2001/02/01; North Hanover Financial Center at 65 Eisenhower Drive, branch established on 2008/09/02. Info updated 2006/11/03: Bank assets: $1,009.1 mil, Deposits: $855.8 mil, headquarters in Glen Rock, PA, positive income , Commercial Lending Specialization, 24 total offices , Holding Company: Codorus Valley Bancorp, Inc.
Northwest Savings Bank: Hanover Branch at 1091 Eichelberger Street, branch established on 1997/06/04; 1055 Baltimore Street Branch at 1055 Baltimore Street, branch established on 2004/05/27. Info updated 2009/11/23: Bank assets: $7,975.9 mil, Deposits: $5,985.6 mil, headquarters in Warren, PA, positive income , Mortgage Lending Specialization, 172 total offices
Wells Fargo Bank, National Association: North Hanover Branch at 1153 Carlisle Street, branch established on 1959/01/05. Info updated 2011/04/05: Bank assets: $1,161,490.0 mil, Deposits: $905,653.0 mil, headquarters in Sioux Falls, SD, positive income , 6395 total offices , Holding Company: Wells Fargo & Company
For population 15 years and over in Hanover:
Never married: 30.9%Now married: 45.5%Separated: 2.4%Widowed: 8.9%Divorced: 12.3% For population 25 years and over in Hanover:
High school or higher: 86.0%Bachelor's degree or higher: 17.1%Graduate or professional degree: 6.5%Unemployed: 3.6%Mean travel time to work (commute): 21.2 minutes
Education Gini index (Inequality in education) Here:
9.9Pennsylvania average:
11.4
Religion statistics for Hanover, PA (based on York County data)
Religion Adherents Congregations Mainline Protestant 79,653 217 Evangelical Protestant 47,150 222 Catholic 35,605 13 Other 4,815 24 Black Protestant 1,339 10 Orthodox 400 2 None 266,010 -
Source: Clifford Grammich, Kirk Hadaway, Richard Houseal, Dale E.Jones, Alexei Krindatch, Richie Stanley and Richard H.Taylor. 2012. 2010 U.S.Religion Census: Religious Congregations & Membership Study. Association of Statisticians of American Religious Bodies. Jones, Dale E., et al. 2002. Congregations and Membership in the United States 2000. Nashville, TN: Glenmary Research Center. Graphs represent county-level data
Food Environment Statistics: Number of grocery stores : 62Here :
1.47 / 10,000 pop.Pennsylvania :
2.04 / 10,000 pop.
Number of supercenters and club stores : 5This county :
0.12 / 10,000 pop.State :
0.09 / 10,000 pop.
Number of convenience stores (no gas) : 17Here :
0.40 / 10,000 pop.Pennsylvania :
0.88 / 10,000 pop.
Number of convenience stores (with gas) : 113Here :
2.69 / 10,000 pop.Pennsylvania :
2.52 / 10,000 pop.
Number of full-service restaurants : 231York County :
5.49 / 10,000 pop.Pennsylvania :
7.12 / 10,000 pop.
Adult diabetes rate : York County :
8.7%Pennsylvania :
9.1%
Adult obesity rate : York County :
28.7%Pennsylvania :
27.2%
Low-income preschool obesity rate : York County :
11.9%Pennsylvania :
11.5%
Health and Nutrition: Healthy diet rate : This city:
48.4%State:
50.2%
Average overall health of teeth and gums : This city:
43.4%Pennsylvania:
47.1%
Average BMI : Here:
28.9Pennsylvania:
28.7
People feeling badly about themselves : Hanover:
22.0%Pennsylvania:
20.8%
People not drinking alcohol at all : Average hours sleeping at night : Overweight people : This city:
34.3%Pennsylvania:
34.3%
General health condition : Hanover:
53.5%Pennsylvania:
56.2%
Average condition of hearing : This city:
75.5%State:
78.3%
More about Health and Nutrition of Hanover, PA Residents
Local government employment and payroll (March 2022)
Function
Full-time employees
Monthly full-time payroll
Average yearly full-time wage
Part-time employees
Monthly part-time payroll
Water Supply
27 $162,550 $72,244 0 $0 Solid Waste Management
25 $140,343 $67,365 1 $950 Police Protection - Officers
23 $191,691 $100,013 0 $0 Sewerage
18 $100,805 $67,203 0 $0 Firefighters
14 $101,340 $86,863 0 $0 Streets and Highways
7 $42,199 $72,341 0 $0 Local Libraries
7 $21,462 $36,792 11 $12,214 Other Government Administration
6 $40,793 $81,586 0 $0 Financial Administration
4 $12,366 $37,098 0 $0 Natural Resources
3 $15,685 $62,740 0 $0 Police - Other
2 $7,103 $42,618 1 $1,810 Fire - Other
2 $14,230 $85,380 0 $0 Parks and Recreation
0 $0 1 $567
Totals for Government
138 $850,567 $73,962 14 $15,540
Hanover government finances - Expenditure in 2018 (per resident):
Construction - Water Utilities: $6,455,000 ($390.08)
Regular Highways: $401,000 ($24.23)Parks and Recreation: $149,000 ($9.00)Sewerage: $63,000 ($3.81)Local Fire Protection: $38,000 ($2.30)Current Operations - Sewerage: $6,090,000 ($368.02)
Water Utilities: $4,728,000 ($285.71)Solid Waste Management: $3,906,000 ($236.04)Police Protection: $3,563,000 ($215.31)Health - Other: $2,079,000 ($125.63)Local Fire Protection: $1,951,000 ($117.90)Regular Highways: $1,547,000 ($93.49)Libraries: $987,000 ($59.64)General - Other: $707,000 ($42.72)Central Staff Services: $521,000 ($31.48)Parks and Recreation: $503,000 ($30.40)Housing and Community Development: $185,000 ($11.18)Financial Administration: $128,000 ($7.74)General Public Buildings: $127,000 ($7.67)Protective Inspection and Regulation - Other: $45,000 ($2.72)Miscellaneous Commercial Activities - Other: $40,000 ($2.42)Judicial and Legal Services: $35,000 ($2.12)General - Interest on Debt: $1,438,000 ($86.90)
Other Capital Outlay - Solid Waste Management: $274,000 ($16.56)
Water Utilities: $168,000 ($10.15)Police Protection: $96,000 ($5.80)Regular Highways: $25,000 ($1.51)Sewerage: $11,000 ($0.66)Total Salaries and Wages: $9,205,000 ($556.26)
Hanover government finances - Revenue in 2018 (per resident):
Charges - Sewerage: $6,451,000 ($389.84)
Solid Waste Management: $4,404,000 ($266.13)Parks and Recreation: $109,000 ($6.59)Parking Facilities: $107,000 ($6.47)Other: $40,000 ($2.42)Federal Intergovernmental - Housing and Community Development: $553,000 ($33.42)
Other: $4,000 ($0.24)Local Intergovernmental - Other: $270,000 ($16.32)
Miscellaneous - Donations From Private Sources: $530,000 ($32.03)
Rents: $283,000 ($17.10)Interest Earnings: $274,000 ($16.56)Sale of Property: $259,000 ($15.65)Fines and Forfeits: $183,000 ($11.06)General Revenue - Other: $4,000 ($0.24)Revenue - Water Utilities: $7,417,000 ($448.21)
State Intergovernmental - Other: $3,154,000 ($190.60)
Highways: $461,000 ($27.86)Housing and Community Development: $189,000 ($11.42)General Local Government Support: $15,000 ($0.91)Tax - Property: $5,388,000 ($325.60)
Individual Income: $1,685,000 ($101.82)Occupation and Business License - Other: $1,114,000 ($67.32)Documentary and Stock Transfer: $307,000 ($18.55)
Hanover government finances - Debt in 2018 (per resident):
Long Term Debt - Beginning Outstanding - Unspecified Public Purpose: $51,810,000 ($3130.89)
Outstanding Unspecified Public Purpose: $50,325,000 ($3041.15)Retired Unspecified Public Purpose: $11,065,000 ($668.66)Issue, Unspecified Public Purpose: $9,580,000 ($578.92)
Hanover government finances - Cash and Securities in 2018 (per resident):
Bond Funds - Cash and Securities: $198,000 ($11.97)
Other Funds - Cash and Securities: $20,277,000 ($1225.34)
5.22% of this county's 2021 resident taxpayers lived in other counties in 2020 ($59,504 average adjusted gross income )
Here:
5.22%Pennsylvania average:
5.27%
0.03% of residents moved from foreign countries ($236 average AGI )York County:
0.03%Pennsylvania average:
0.01%
Top counties from which taxpayers relocated into this county between 2020 and 2021:
4.60% of this county's 2020 resident taxpayers moved to other counties in 2021 ($64,703 average adjusted gross income )
Here:
4.60%Pennsylvania average:
5.44%
0.02% of residents moved to foreign countries ($241 average AGI )York County:
0.02%Pennsylvania average:
0.01%
Top counties to which taxpayers relocated from this county between 2020 and 2021:
Businesses in Hanover, PA
Name Count Name Count
ALDI 1 Lowe's 1 AT&T 2 MasterBrand Cabinets 3 Advance Auto Parts 1 Mazda 1 Aeropostale 1 McDonald's 3 American Eagle Outfitters 1 New Balance 2 Arby's 2 Nike 5 AutoZone 1 Nissan 1 Bath & Body Works 1 Olive Garden 1 Blockbuster 1 Pac Sun 1 Burger King 1 Panera Bread 1 CVS 1 Papa John's Pizza 1 Carson Pirie Scott 1 Payless 1 Clarks 1 Penske 1 ColorTyme 1 Pier 1 Imports 1 Curves 1 Pizza Hut 2 DHL 3 RadioShack 2 Deb 1 Red Lobster 1 Domino's Pizza 2 Rite Aid 2 Dunkin Donuts 3 Ruby Tuesday 1 Fashion Bug 1 Ryan's Grill 1 FedEx 6 SONIC Drive-In 1 Finish Line 1 Sears 2 Firestone Complete Auto Care 1 Shoe Carnival 1 Ford 1 Spencer Gifts 1 GNC 2 Sprint Nextel 4 GameStop 2 Staples 1 Giant 2 Starbucks 1 Goodwill 1 Subaru 1 H&R Block 3 Subway 6 Hilton 1 Super 8 1 Hobby Lobby 1 T-Mobile 4 Holiday Inn 1 T.J.Maxx 1 Home Depot 1 Taco Bell 1 Honda 1 The Room Place 1 Hyundai 1 Toyota 1 JCPenney 1 U-Haul 1 Jones New York 3 UPS 8 KFC 1 Vans 1 Kincaid 1 Verizon Wireless 3 Kohl's 1 Walmart 2 Kroger 5 Wendy's 2 La-Z-Boy 1 YMCA 2 Little Caesars Pizza 1
Strongest AM radio stations in Hanover:
WHVR (1280 AM; 5 kW; HANOVER, PA)
WCBM (680 AM; 50 kW; BALTIMORE, MD; Owner: WCBM MARYLAND, INC.)
WBAL (1090 AM; 50 kW; BALTIMORE, MD; Owner: HEARST RADIO, INC.)
WGOP (700 AM; daytime; 25 kW; WALKERSVILLE, MD; Owner: BIRACH BROADCASTING CORPORATION)
WOYK (1350 AM; 5 kW; YORK, PA; Owner: WOYK, INC.)
WMET (1150 AM; 50 kW; GAITHERSBURG, MD; Owner: BELTWAY ACQUISITION CORPORATION)
WWLG (1370 AM; 50 kW; BALTIMORE, MD; Owner: M-10 BROADCASTING, INC.)
WSBA (910 AM; 5 kW; YORK, PA; Owner: WSBA LICO, INC.)
WTEM (980 AM; 50 kW; WASHINGTON, DC; Owner: AMFM RADIO LICENSES, L.L.C.)
WTOP (1500 AM; 50 kW; WASHINGTON, DC; Owner: BONNEVILLE HOLDING COMPANY)
WBIS (1190 AM; 50 kW; ANNAPOLIS, MD; Owner: NATIONS RADIO, LLC)
WCAO (600 AM; 5 kW; BALTIMORE, MD; Owner: CITICASTERS LICENSES, L.P.)
WVCH (740 AM; 50 kW; CHESTER, PA; Owner: WVCH COMMUNICATIONS, INC.)
Strongest FM radio stations in Hanover:
WYCR (98.5 FM; YORK-HANOVER, PA; Owner: RADIO HANOVER, INC.)
WGTY (107.7 FM; GETTYSBURG, PA; Owner: TIMES AND NEWS PUBLISHING COMPANY)
WROZ (101.3 FM; LANCASTER, PA; Owner: HALL COMMUNICATIONS, INC.)
WARM-FM (103.3 FM; YORK, PA; Owner: WSBA LICO, INC.)
WHBO (92.7 FM; STARVIEW, PA; Owner: HALL COMMUNICATIONS, INC.)
WAYZ-FM (104.7 FM; HAGERSTOWN, MD; Owner: HJV LIMITED PARTNERSHIP)
WSOX (96.1 FM; RED LION, PA; Owner: LANCASTER-YORK BROADCASTING, LLC)
WETH (89.1 FM; HAGERSTOWN, MD; Owner: GREATER WASHINGTON EDUCATIONAL TELECOMMUNICATIONS ASSN.)
WQXA-FM (105.7 FM; YORK, PA; Owner: CITADEL BROADCASTING COMPANY)
WZBT (91.1 FM; GETTYSBURG, PA; Owner: GETTYSBURG COLLEGE)
WITF-FM (89.5 FM; HARRISBURG, PA; Owner: WITF, INC.)
WZBA (100.7 FM; WESTMINSTER, MD; Owner: SHAMROCK COMMUNICATIONS, INC.)
WFRE (99.9 FM; FREDERICK, MD; Owner: CAPSTAR TX LIMITED PARTNERSHIP)
W219BX (91.7 FM; FREDERICK, MD; Owner: CEDAR RIDGE CHILDREN'S HOME & SCHOOL, INC)
WWMX (106.5 FM; BALTIMORE, MD; Owner: INFINITY RADIO OPERATIONS INC.)
WTPA (93.5 FM; MECHANICSBURG, PA; Owner: CUMULUS LICENSING CORP.)
W219BE (91.7 FM; WAYNESBORO, PA; Owner: MARANATHA BIBLE INSTITUTE, NDBA)
WCAT-FM (106.7 FM; HERSHEY, PA; Owner: CITADEL BROADCASTING COMPANY)
WLIF (101.9 FM; BALTIMORE, MD; Owner: INFINITY WLIF, INC.)
W220BX (91.9 FM; MARIETTA, PA; Owner: CALVARY CHAPEL OF TWIN FALLS, INC.)
TV broadcast stations around Hanover:
WMPB (Channel 67; BALTIMORE, MD; Owner: MARYLAND PUBLIC BROADCASTING COMMISSION)
WPMT (Channel 43; YORK, PA; Owner: TRIBUNE TELEVISION COMPANY)
WGAL (Channel 8; LANCASTER, PA; Owner: WGAL HEARST-ARGYLE TELEVISION, INC.)
WBAL-TV (Channel 11; BALTIMORE, MD; Owner: WBAL HEARST-ARGYLE TV, INC. (CA CORP.))
WMAR-TV (Channel 2; BALTIMORE, MD; Owner: SCRIPPS HOWARD BROADCASTING COMPANY)
WBFF (Channel 45; BALTIMORE, MD; Owner: CHESAPEAKE TELEVISION LICENSEE, LLC)
WNUV (Channel 54; BALTIMORE, MD; Owner: BALTIMORE (WNUV-TV) LICENSEE, INC.)
WJZ-TV (Channel 13; BALTIMORE, MD; Owner: VIACOM INC.)
WLYH-TV (Channel 15; LANCASTER, PA; Owner: TELEVISION STATION GROUP LICENSE SUBSIDIARY, LLC)
WUTB (Channel 24; BALTIMORE, MD; Owner: FOX TELEVISION STATIONS, INC.)
WGCB-TV (Channel 49; RED LION, PA; Owner: RED LION BROADCASTING CO., INC.)
W23AY (Channel 23; YORK, PA; Owner: WIRELESS CABLE TV OF PA, INC.)
National Bridge Inventory (NBI) Statistics 7 Number of bridges30ft / 9.4m Total length $62,000 Total costs43,698 Total average daily traffic5,494 Total average daily truck traffic94,049 Total future (year 2032) average daily traffic
Home Mortgage Disclosure Act Aggregated Statistics For Year 2009(Based on 4 full tracts) A) FHA, FSA/RHS & VA B) Conventional C) Refinancings D) Home Improvement Loans E) Loans on Dwellings For 5+ Families F) Non-occupant Loans on G) Loans On Manufactured Number Average Value Number Average Value Number Average Value Number Average Value Number Average Value Number Average Value Number Average Value
LOANS ORIGINATED 95 $144,968 69 $135,710 259 $135,259 30 $51,933 1 $260,000 33 $108,424 1 $76,000 APPLICATIONS APPROVED, NOT ACCEPTED 4 $160,000 3 $91,667 17 $158,588 2 $11,000 0 $0 1 $50,000 0 $0 APPLICATIONS DENIED 13 $130,769 8 $94,375 102 $143,275 15 $48,200 0 $0 7 $103,286 0 $0 APPLICATIONS WITHDRAWN 11 $136,909 6 $117,000 60 $167,583 5 $61,600 0 $0 5 $91,600 0 $0 FILES CLOSED FOR INCOMPLETENESS 4 $141,000 1 $50,000 10 $142,900 1 $52,000 0 $0 2 $51,000 0 $0
Aggregated Statistics For Year 2008(Based on 4 full tracts) A) FHA, FSA/RHS & VA B) Conventional C) Refinancings D) Home Improvement Loans E) Loans on Dwellings For 5+ Families F) Non-occupant Loans on G) Loans On Manufactured Number Average Value Number Average Value Number Average Value Number Average Value Number Average Value Number Average Value Number Average Value
LOANS ORIGINATED 61 $154,180 113 $128,496 219 $136,699 46 $44,848 6 $855,667 44 $128,955 0 $0 APPLICATIONS APPROVED, NOT ACCEPTED 2 $202,000 7 $140,143 32 $136,062 1 $193,000 0 $0 3 $99,667 1 $30,000 APPLICATIONS DENIED 6 $125,000 14 $101,500 122 $143,139 47 $62,021 0 $0 10 $97,900 3 $76,667 APPLICATIONS WITHDRAWN 3 $106,667 7 $138,000 55 $154,218 9 $109,778 0 $0 5 $135,400 0 $0 FILES CLOSED FOR INCOMPLETENESS 0 $0 4 $120,000 7 $154,571 3 $93,333 0 $0 3 $124,667 0 $0
Aggregated Statistics For Year 2007(Based on 4 full tracts) A) FHA, FSA/RHS & VA B) Conventional C) Refinancings D) Home Improvement Loans E) Loans on Dwellings For 5+ Families F) Non-occupant Loans on G) Loans On Manufactured Number Average Value Number Average Value Number Average Value Number Average Value Number Average Value Number Average Value Number Average Value
LOANS ORIGINATED 13 $144,615 217 $126,535 259 $120,355 85 $58,871 1 $305,000 53 $119,962 2 $50,500 APPLICATIONS APPROVED, NOT ACCEPTED 1 $220,000 23 $105,261 42 $117,262 12 $53,167 1 $230,000 6 $87,500 4 $45,500 APPLICATIONS DENIED 2 $166,500 36 $112,806 159 $123,258 45 $68,178 2 $135,500 12 $104,583 9 $51,222 APPLICATIONS WITHDRAWN 3 $183,000 20 $134,500 86 $134,826 12 $66,583 0 $0 9 $113,778 0 $0 FILES CLOSED FOR INCOMPLETENESS 0 $0 10 $110,400 14 $158,786 2 $132,000 0 $0 0 $0 0 $0
Aggregated Statistics For Year 2006(Based on 4 full tracts) A) FHA, FSA/RHS & VA B) Conventional C) Refinancings D) Home Improvement Loans E) Loans on Dwellings For 5+ Families F) Non-occupant Loans on G) Loans On Manufactured Number Average Value Number Average Value Number Average Value Number Average Value Number Average Value Number Average Value Number Average Value
LOANS ORIGINATED 13 $159,846 309 $124,068 326 $108,871 109 $40,000 11 $1,562,364 98 $110,582 0 $0 APPLICATIONS APPROVED, NOT ACCEPTED 0 $0 22 $106,182 39 $120,615 14 $48,214 1 $20,000 9 $84,556 2 $64,500 APPLICATIONS DENIED 5 $189,600 47 $107,255 211 $123,787 57 $57,596 0 $0 18 $108,500 4 $46,250 APPLICATIONS WITHDRAWN 1 $123,000 27 $129,259 113 $128,814 8 $48,625 1 $224,000 8 $90,000 0 $0 FILES CLOSED FOR INCOMPLETENESS 0 $0 14 $107,500 19 $110,684 2 $112,500 1 $245,000 5 $83,800 1 $30,000
Aggregated Statistics For Year 2005(Based on 4 full tracts) A) FHA, FSA/RHS & VA B) Conventional C) Refinancings D) Home Improvement Loans E) Loans on Dwellings For 5+ Families F) Non-occupant Loans on G) Loans On Manufactured Number Average Value Number Average Value Number Average Value Number Average Value Number Average Value Number Average Value Number Average Value
LOANS ORIGINATED 16 $153,125 390 $108,654 352 $105,330 82 $48,671 4 $276,750 116 $108,681 2 $92,500 APPLICATIONS APPROVED, NOT ACCEPTED 4 $99,250 31 $75,387 52 $97,096 10 $24,100 0 $0 14 $69,857 5 $36,600 APPLICATIONS DENIED 4 $119,500 39 $104,436 189 $105,190 46 $38,326 0 $0 9 $81,222 10 $52,700 APPLICATIONS WITHDRAWN 1 $161,000 25 $124,560 148 $116,946 26 $121,385 0 $0 14 $117,500 1 $93,000 FILES CLOSED FOR INCOMPLETENESS 1 $83,000 12 $124,750 20 $121,750 4 $56,500 1 $245,000 1 $312,000 0 $0
Aggregated Statistics For Year 2004(Based on 4 full tracts) A) FHA, FSA/RHS & VA B) Conventional C) Refinancings D) Home Improvement Loans E) Loans on Dwellings For 5+ Families F) Non-occupant Loans on G) Loans On Manufactured Number Average Value Number Average Value Number Average Value Number Average Value Number Average Value Number Average Value Number Average Value
LOANS ORIGINATED 27 $128,704 349 $106,837 348 $98,365 76 $34,408 5 $400,000 93 $94,194 3 $82,000 APPLICATIONS APPROVED, NOT ACCEPTED 3 $160,333 36 $103,806 55 $89,327 10 $40,900 1 $280,000 8 $78,250 4 $46,750 APPLICATIONS DENIED 5 $125,800 57 $92,088 184 $92,016 37 $27,919 0 $0 20 $77,550 5 $38,600 APPLICATIONS WITHDRAWN 3 $139,000 38 $152,447 103 $107,117 10 $37,900 0 $0 5 $186,600 1 $26,000 FILES CLOSED FOR INCOMPLETENESS 1 $141,000 10 $81,700 49 $114,286 3 $83,333 0 $0 4 $101,250 0 $0
Aggregated Statistics For Year 2003(Based on 4 full tracts) A) FHA, FSA/RHS & VA B) Conventional C) Refinancings D) Home Improvement Loans E) Loans on Dwellings For 5+ Families F) Non-occupant Loans on Number Average Value Number Average Value Number Average Value Number Average Value Number Average Value Number Average Value
LOANS ORIGINATED 63 $109,714 295 $96,139 606 $91,388 59 $19,661 5 $255,000 84 $88,536 APPLICATIONS APPROVED, NOT ACCEPTED 4 $113,500 21 $89,190 77 $92,766 5 $18,600 0 $0 3 $61,667 APPLICATIONS DENIED 7 $101,000 36 $74,028 208 $96,173 17 $17,588 0 $0 16 $105,938 APPLICATIONS WITHDRAWN 7 $110,000 26 $109,500 82 $102,963 6 $27,500 0 $0 5 $87,600 FILES CLOSED FOR INCOMPLETENESS 3 $134,333 12 $108,917 22 $105,045 2 $53,500 0 $0 3 $109,000
Aggregated Statistics For Year 2002(Based on 4 full tracts) A) FHA, FSA/RHS & VA B) Conventional C) Refinancings D) Home Improvement Loans E) Loans on Dwellings For 5+ Families F) Non-occupant Loans on Number Average Value Number Average Value Number Average Value Number Average Value Number Average Value Number Average Value
LOANS ORIGINATED 69 $98,855 295 $94,898 384 $82,047 61 $21,787 7 $333,571 65 $71,662 APPLICATIONS APPROVED, NOT ACCEPTED 1 $137,000 17 $94,824 49 $88,388 9 $18,111 0 $0 1 $90,000 APPLICATIONS DENIED 2 $116,000 33 $84,364 126 $76,722 20 $13,350 0 $0 9 $68,111 APPLICATIONS WITHDRAWN 8 $117,125 22 $103,000 70 $93,471 5 $17,400 0 $0 3 $65,000 FILES CLOSED FOR INCOMPLETENESS 1 $99,000 7 $107,429 31 $100,742 0 $0 0 $0 1 $90,000
Aggregated Statistics For Year 2001(Based on 4 full tracts) A) FHA, FSA/RHS & VA B) Conventional C) Refinancings D) Home Improvement Loans E) Loans on Dwellings For 5+ Families F) Non-occupant Loans on Number Average Value Number Average Value Number Average Value Number Average Value Number Average Value Number Average Value
LOANS ORIGINATED 63 $95,587 165 $79,800 273 $80,418 56 $18,196 8 $107,250 53 $69,245 APPLICATIONS APPROVED, NOT ACCEPTED 4 $92,500 13 $100,615 41 $77,220 8 $38,000 0 $0 3 $102,333 APPLICATIONS DENIED 6 $75,500 37 $61,162 120 $78,483 31 $14,226 0 $0 7 $70,286 APPLICATIONS WITHDRAWN 1 $61,000 9 $78,222 50 $79,360 9 $16,778 0 $0 9 $53,444 FILES CLOSED FOR INCOMPLETENESS 0 $0 1 $42,000 11 $63,636 1 $26,000 0 $0 2 $48,000
Aggregated Statistics For Year 2000(Based on 4 full tracts) A) FHA, FSA/RHS & VA B) Conventional C) Refinancings D) Home Improvement Loans E) Loans on Dwellings For 5+ Families F) Non-occupant Loans on Number Average Value Number Average Value Number Average Value Number Average Value Number Average Value Number Average Value
LOANS ORIGINATED 57 $90,316 147 $79,986 94 $63,000 80 $19,125 2 $107,000 34 $75,265 APPLICATIONS APPROVED, NOT ACCEPTED 5 $120,000 16 $74,500 41 $59,049 8 $17,750 0 $0 4 $65,500 APPLICATIONS DENIED 5 $110,800 38 $58,763 72 $49,611 24 $18,917 0 $0 8 $50,500 APPLICATIONS WITHDRAWN 8 $109,000 22 $64,636 43 $49,744 9 $34,889 0 $0 9 $57,333 FILES CLOSED FOR INCOMPLETENESS 1 $125,000 1 $80,000 11 $67,545 1 $25,000 0 $0 1 $80,000
Aggregated Statistics For Year 1999(Based on 4 full and 1 partial tracts) A) FHA, FSA/RHS & VA B) Conventional C) Refinancings D) Home Improvement Loans E) Loans on Dwellings For 5+ Families F) Non-occupant Loans on Number Average Value Number Average Value Number Average Value Number Average Value Number Average Value Number Average Value
LOANS ORIGINATED 61 $86,138 173 $84,532 254 $76,519 68 $19,964 4 $491,965 34 $87,581 APPLICATIONS APPROVED, NOT ACCEPTED 1 $90,670 8 $91,255 45 $67,353 8 $20,016 0 $0 2 $46,430 APPLICATIONS DENIED 4 $104,855 20 $63,195 116 $71,526 23 $20,095 1 $237,530 7 $61,229 APPLICATIONS WITHDRAWN 2 $74,165 17 $80,327 63 $71,033 9 $38,256 0 $0 4 $62,325 FILES CLOSED FOR INCOMPLETENESS 0 $0 2 $124,705 17 $82,046 0 $0 0 $0 2 $65,615
Detailed HMDA statistics for the following Tracts:
0220.00
, 0221.00 , 0222.00 , 0223.00
Private Mortgage Insurance Companies Aggregated Statistics For Year 2009(Based on 4 full tracts) A) Conventional B) Refinancings C) Non-occupant Loans on Number Average Value Number Average Value Number Average Value
LOANS ORIGINATED 14 $147,571 11 $161,545 1 $180,000 APPLICATIONS APPROVED, NOT ACCEPTED 1 $158,000 5 $258,000 1 $158,000 APPLICATIONS DENIED 1 $138,000 8 $172,000 0 $0 APPLICATIONS WITHDRAWN 2 $152,000 1 $121,000 0 $0 FILES CLOSED FOR INCOMPLETENESS 0 $0 0 $0 0 $0
Aggregated Statistics For Year 2008(Based on 4 full tracts) A) Conventional B) Refinancings C) Non-occupant Loans on Number Average Value Number Average Value Number Average Value
LOANS ORIGINATED 39 $132,128 14 $193,571 1 $121,000 APPLICATIONS APPROVED, NOT ACCEPTED 10 $142,500 7 $191,143 1 $90,000 APPLICATIONS DENIED 2 $155,500 1 $128,000 0 $0 APPLICATIONS WITHDRAWN 2 $50,000 0 $0 2 $50,000 FILES CLOSED FOR INCOMPLETENESS 1 $130,000 1 $116,000 0 $0
Aggregated Statistics For Year 2007(Based on 4 full tracts) A) Conventional B) Refinancings C) Non-occupant Loans on Number Average Value Number Average Value Number Average Value
LOANS ORIGINATED 60 $153,950 28 $165,036 6 $111,167 APPLICATIONS APPROVED, NOT ACCEPTED 11 $160,091 7 $175,286 2 $140,000 APPLICATIONS DENIED 2 $144,500 1 $175,000 1 $130,000 APPLICATIONS WITHDRAWN 2 $158,000 0 $0 2 $158,000 FILES CLOSED FOR INCOMPLETENESS 0 $0 0 $0 0 $0
Aggregated Statistics For Year 2006(Based on 4 full tracts) A) Conventional B) Refinancings C) Non-occupant Loans on Number Average Value Number Average Value Number Average Value
LOANS ORIGINATED 41 $142,195 12 $163,000 5 $116,000 APPLICATIONS APPROVED, NOT ACCEPTED 5 $164,600 5 $134,800 0 $0 APPLICATIONS DENIED 0 $0 0 $0 0 $0 APPLICATIONS WITHDRAWN 0 $0 1 $162,000 0 $0 FILES CLOSED FOR INCOMPLETENESS 0 $0 0 $0 0 $0
Aggregated Statistics For Year 2005(Based on 4 full tracts) A) Conventional B) Refinancings C) Non-occupant Loans on Number Average Value Number Average Value Number Average Value
LOANS ORIGINATED 61 $123,639 17 $108,471 7 $102,286 APPLICATIONS APPROVED, NOT ACCEPTED 5 $111,200 4 $129,500 1 $99,000 APPLICATIONS DENIED 1 $225,000 0 $0 1 $225,000 APPLICATIONS WITHDRAWN 6 $105,333 2 $120,000 2 $91,500 FILES CLOSED FOR INCOMPLETENESS 1 $105,000 0 $0 0 $0
Aggregated Statistics For Year 2004(Based on 4 full tracts) A) Conventional B) Refinancings C) Non-occupant Loans on Number Average Value Number Average Value Number Average Value
LOANS ORIGINATED 78 $109,436 21 $111,810 11 $82,455 APPLICATIONS APPROVED, NOT ACCEPTED 6 $102,500 4 $130,500 1 $77,000 APPLICATIONS DENIED 0 $0 0 $0 0 $0 APPLICATIONS WITHDRAWN 4 $120,500 2 $130,000 1 $156,000 FILES CLOSED FOR INCOMPLETENESS 0 $0 0 $0 0 $0
Aggregated Statistics For Year 2003(Based on 4 full tracts) A) Conventional B) Refinancings C) Non-occupant Loans on Number Average Value Number Average Value Number Average Value
LOANS ORIGINATED 75 $126,573 72 $108,139 7 $84,714 APPLICATIONS APPROVED, NOT ACCEPTED 9 $83,222 14 $109,714 2 $61,000 APPLICATIONS DENIED 0 $0 1 $84,000 0 $0 APPLICATIONS WITHDRAWN 3 $126,000 1 $121,000 0 $0 FILES CLOSED FOR INCOMPLETENESS 1 $85,000 0 $0 0 $0
Aggregated Statistics For Year 2002(Based on 4 full tracts) A) Conventional B) Refinancings C) Non-occupant Loans on Number Average Value Number Average Value Number Average Value
LOANS ORIGINATED 93 $107,505 42 $113,381 12 $72,417 APPLICATIONS APPROVED, NOT ACCEPTED 9 $120,778 12 $90,333 1 $77,000 APPLICATIONS DENIED 2 $85,000 2 $104,000 0 $0 APPLICATIONS WITHDRAWN 9 $113,778 4 $136,750 1 $90,000 FILES CLOSED FOR INCOMPLETENESS 1 $56,000 0 $0 1 $56,000
Aggregated Statistics For Year 2001(Based on 4 full tracts) A) Conventional B) Refinancings C) Non-occupant Loans on Number Average Value Number Average Value Number Average Value
LOANS ORIGINATED 80 $92,350 26 $97,038 10 $86,800 APPLICATIONS APPROVED, NOT ACCEPTED 5 $82,600 0 $0 1 $42,000 APPLICATIONS DENIED 0 $0 2 $128,000 1 $128,000 APPLICATIONS WITHDRAWN 0 $0 0 $0 0 $0 FILES CLOSED FOR INCOMPLETENESS 2 $155,000 0 $0 0 $0
Aggregated Statistics For Year 2000(Based on 4 full tracts) A) Conventional B) Refinancings C) Non-occupant Loans on Number Average Value Number Average Value Number Average Value
LOANS ORIGINATED 39 $92,128 5 $117,800 3 $57,333 APPLICATIONS APPROVED, NOT ACCEPTED 5 $80,800 1 $63,000 1 $63,000 APPLICATIONS DENIED 2 $57,000 0 $0 0 $0 APPLICATIONS WITHDRAWN 0 $0 0 $0 0 $0 FILES CLOSED FOR INCOMPLETENESS 0 $0 0 $0 0 $0
Aggregated Statistics For Year 1999(Based on 4 full and 1 partial tracts) A) Conventional B) Refinancings C) Non-occupant Loans on Number Average Value Number Average Value Number Average Value
LOANS ORIGINATED 53 $84,471 19 $92,051 2 $46,550 APPLICATIONS APPROVED, NOT ACCEPTED 2 $95,975 9 $77,500 1 $60,130 APPLICATIONS DENIED 0 $0 2 $98,590 0 $0 APPLICATIONS WITHDRAWN 0 $0 1 $114,170 0 $0 FILES CLOSED FOR INCOMPLETENESS 1 $96,690 0 $0 0 $0
Detailed PMIC statistics for the following Tracts:
0220.00
, 0221.00 , 0222.00 , 0223.00
Most common first names in Hanover, PA among deceased individuals Name Count Lived (average)
Mary 423 81.6 years John 365 76.5 years Charles 275 77.5 years William 265 75.7 years Robert 250 72.2 years George 200 77.6 years Paul 174 77.1 years Helen 174 80.5 years Anna 168 80.2 years Ruth 148 80.1 years
Most common last names in Hanover, PA among deceased individuals Last name Count Lived (average)
Miller 202 77.6 years Smith 197 74.3 years Myers 144 80.0 years Wildasin 96 76.4 years Sterner 92 76.6 years Brown 85 76.8 years Mummert 84 76.0 years Rohrbaugh 82 79.6 years Markle 80 79.3 years Fuhrman 79 75.5 years
Hanover compared to Pennsylvania state average:
Unemployed percentage significantly below state average. Black race population percentage significantly below state average. Hispanic race population percentage above state average. Length of stay since moving in significantly above state average.
#72 on the list of "Top 101 cities with largest percentage of females in occupations: material moving occupations (population 5,000+)"
#95 on the list of "Top 101 cities with the highest number of arson incidents per 100,000 residents, excludes tourist destinations and others with a lot of outsiders visiting based on city industries data (population 5,000+)"
#87 (17331) on the list of "Top 101 zip codes with the most beauty salons in 2005"
#16 on the list of "Top 101 counties with the most Mainline Protestant congregations"
#29 on the list of "Top 101 counties with the most Mainline Protestant adherents"
#81 on the list of "Top 101 counties with the lowest percentage of residents relocating to other counties in 2011"
#95 on the list of "Top 101 counties with the lowest number of infant deaths per 1000 residents 2007-2013 (pop. 50,000+)"
Top Patent Applicants
William E. Denk, Jr. (6)
Richard J. Heavel (5)
Michael Tryson (5)
John Repasky (4)
John G. Rutty (3)
Thomas L. Fort (3)
Craig Graham (3)
Susan M. Kircher (3)
Edward Stephen Seguine (2)
Navaid Baqai (2)
Total of 81 patent applications in 2008-2024.
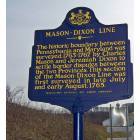


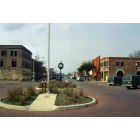
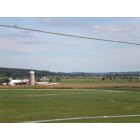
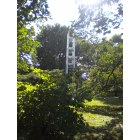
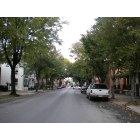
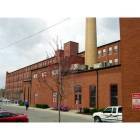
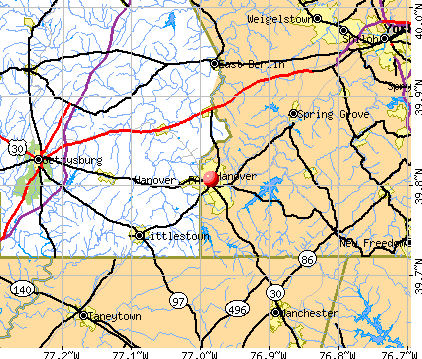


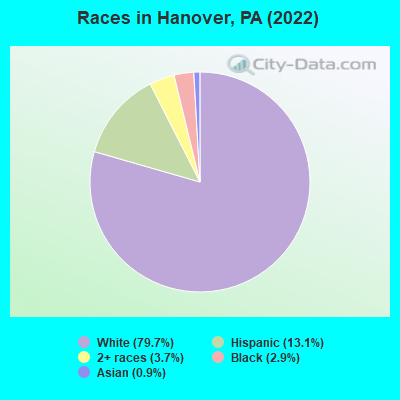

 Recent articles from our blog. Our writers, many of them Ph.D. graduates or candidates, create easy-to-read articles on a wide variety of topics.

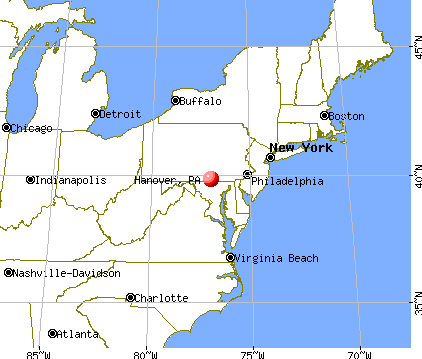
 (34.9 miles
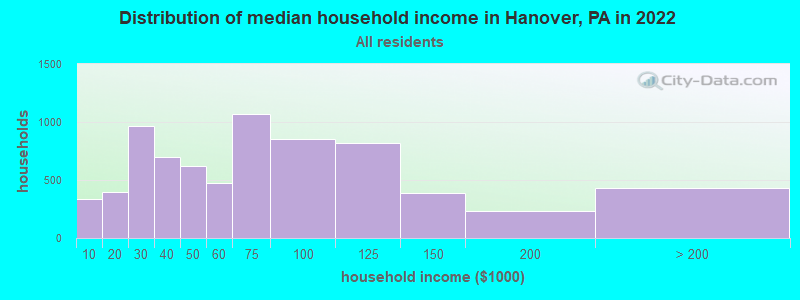
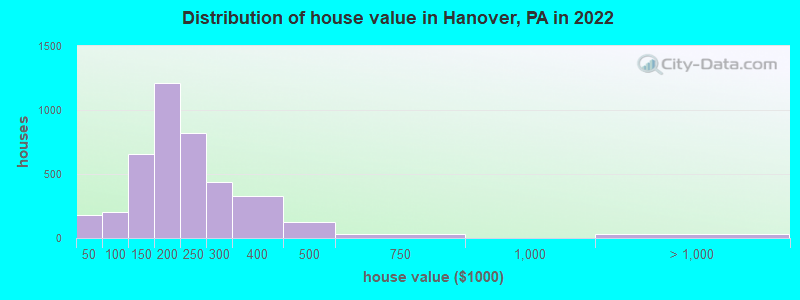
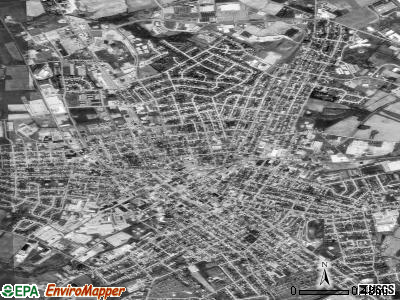
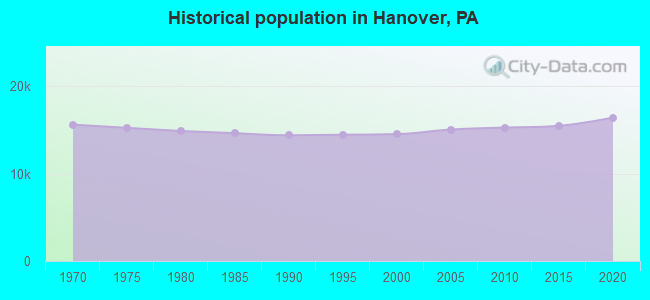
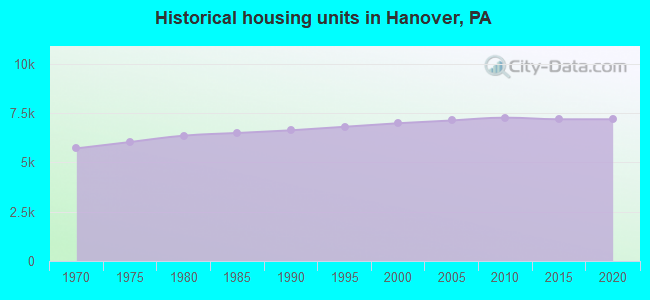
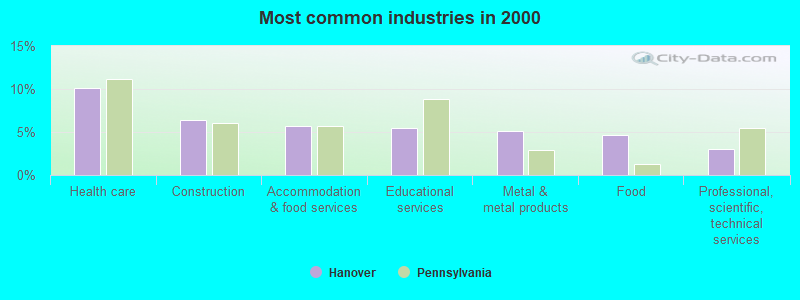
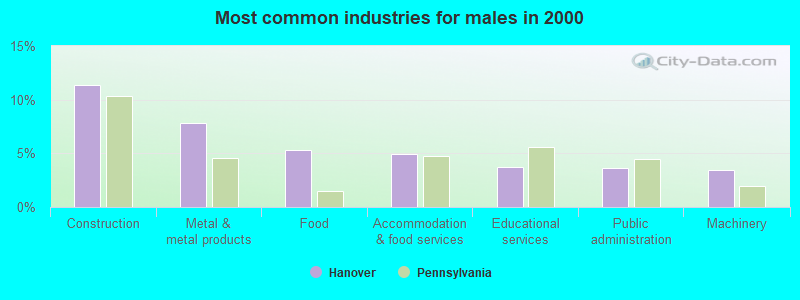
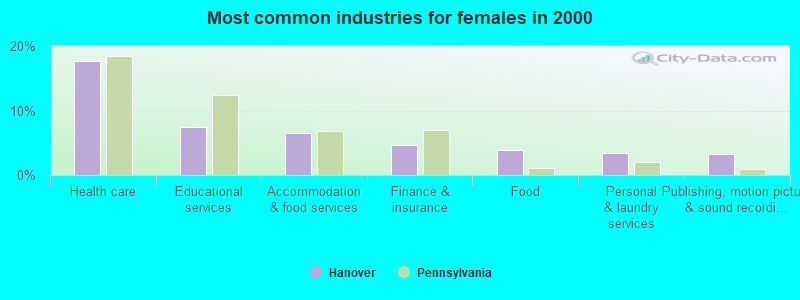
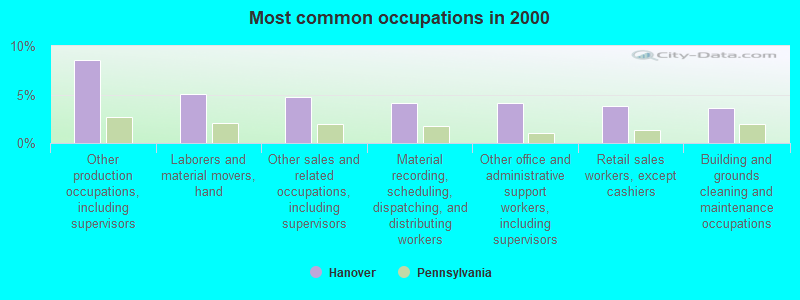
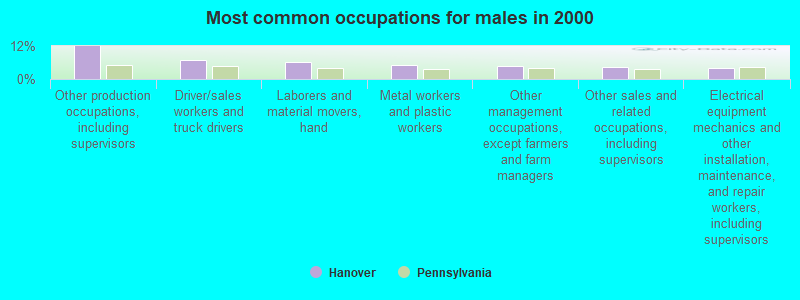
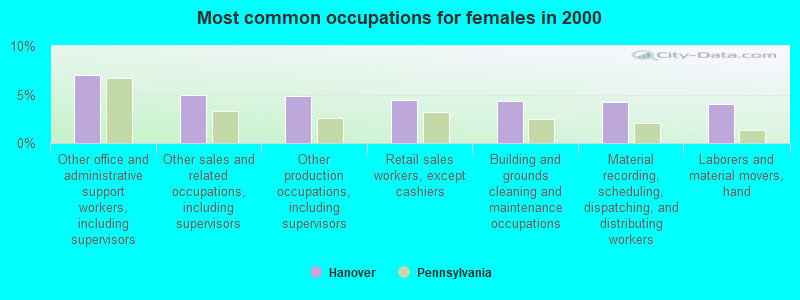
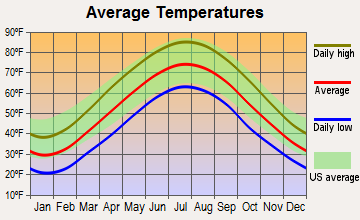
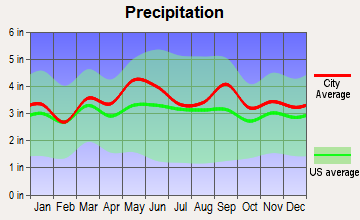
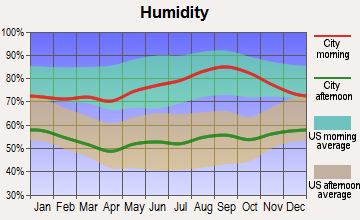
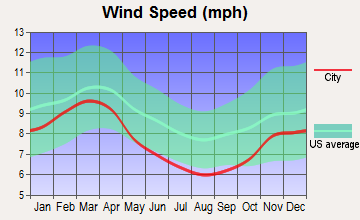
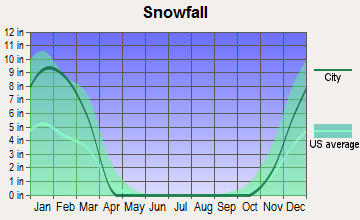
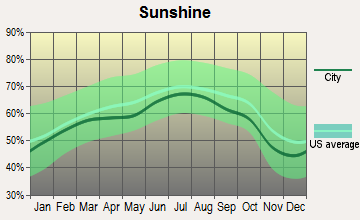
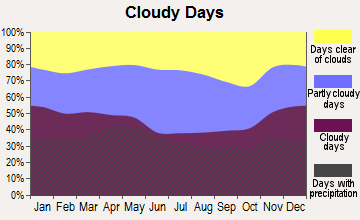


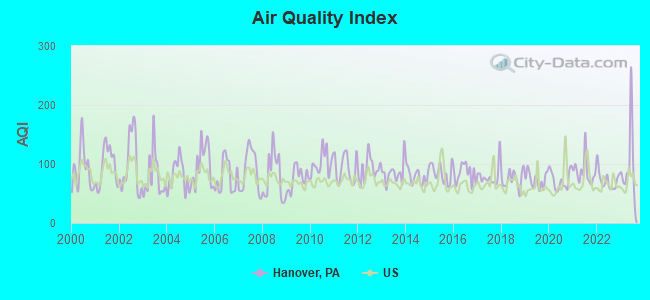
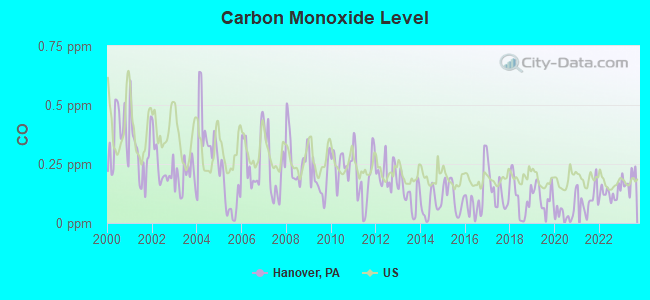
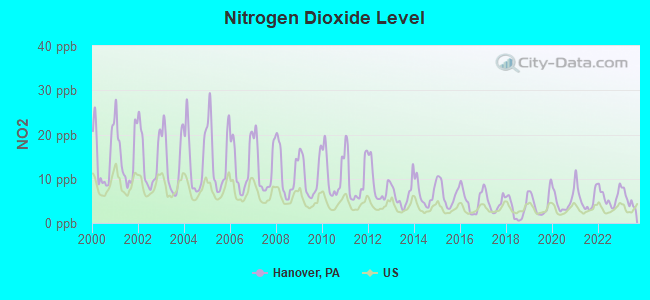
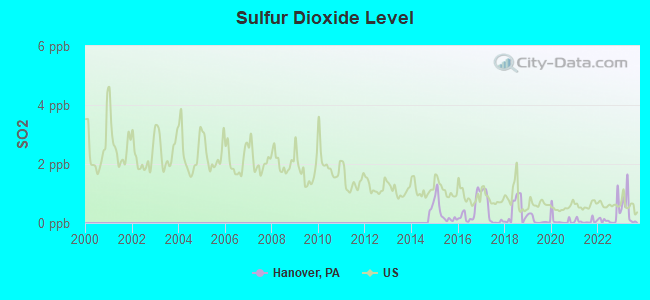
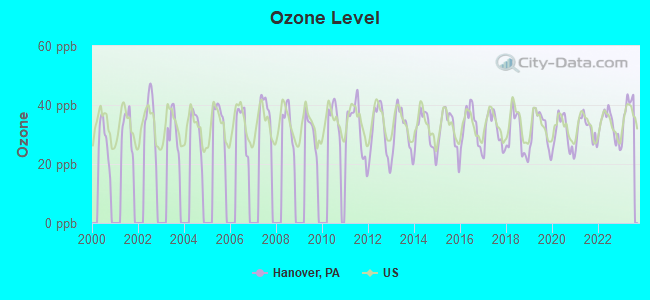
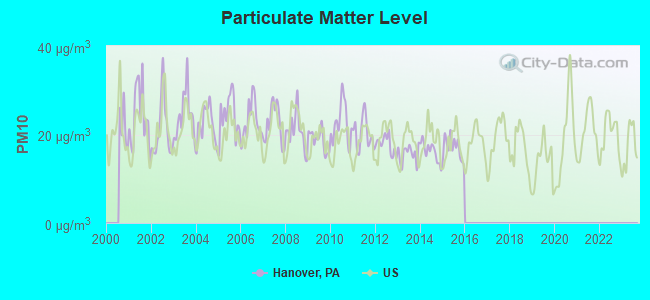
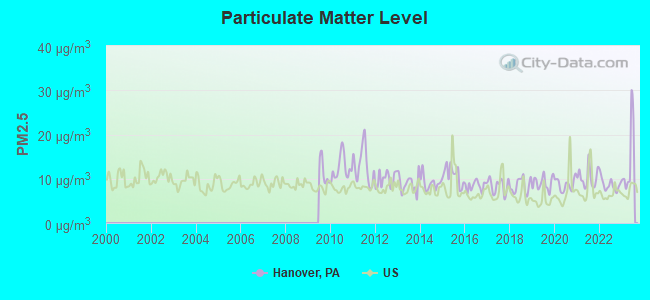
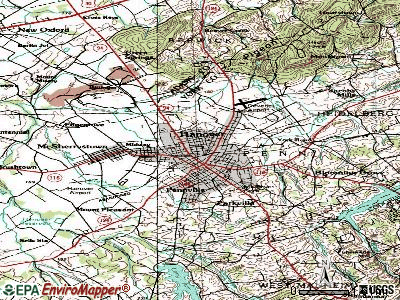
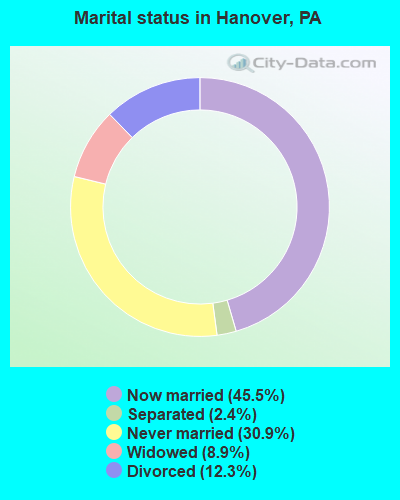
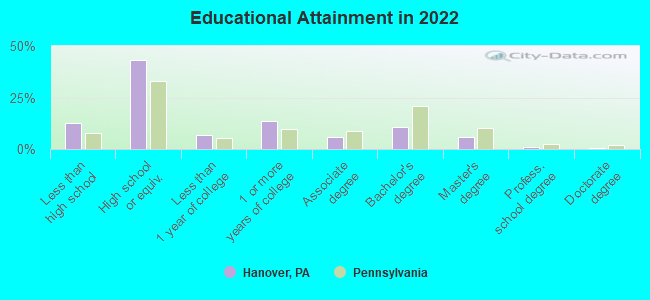
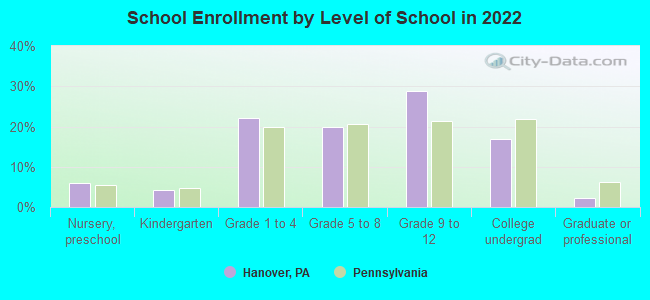
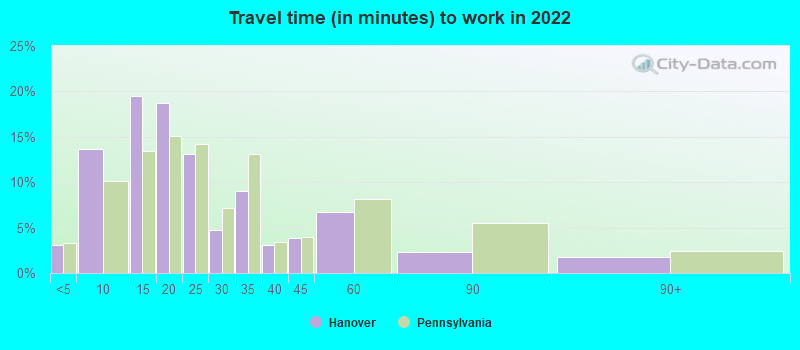

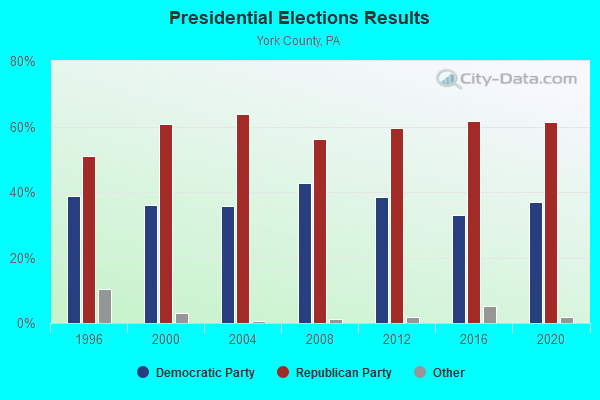
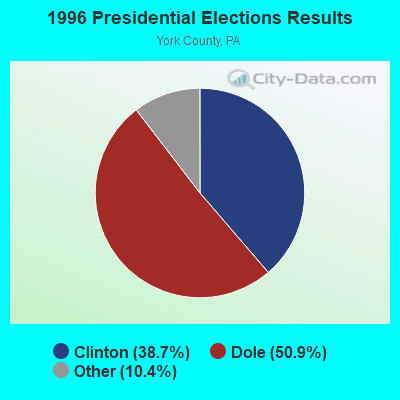
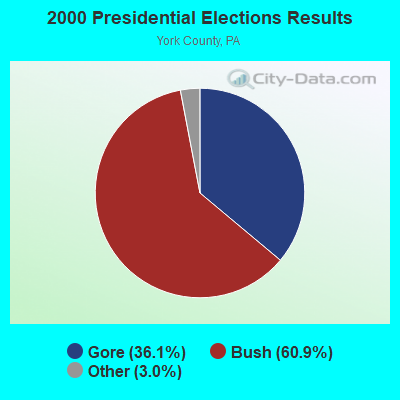
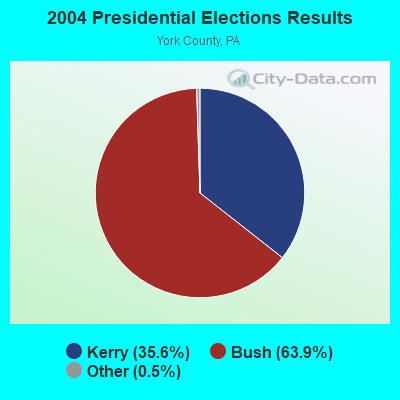
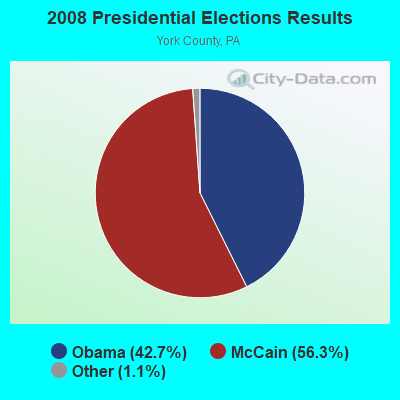
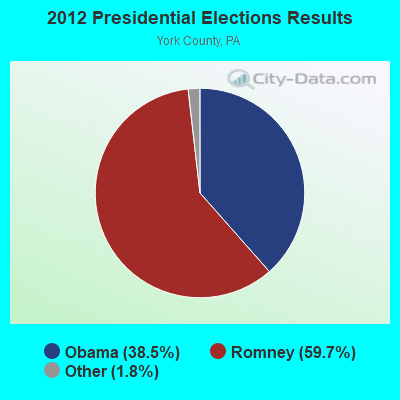
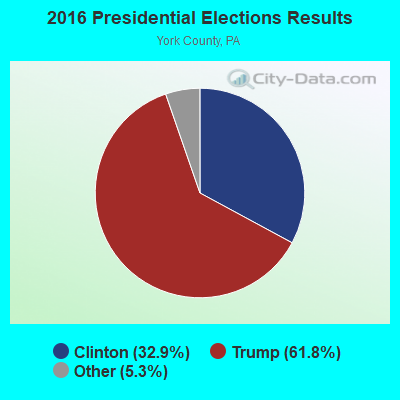
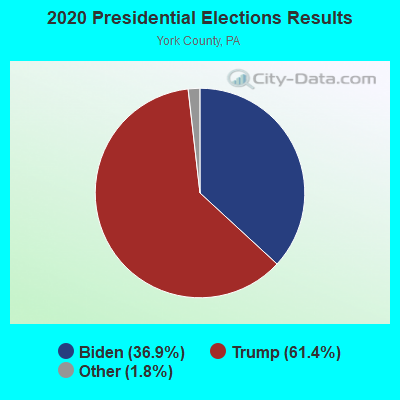
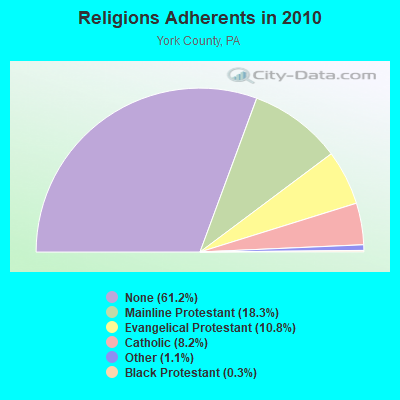
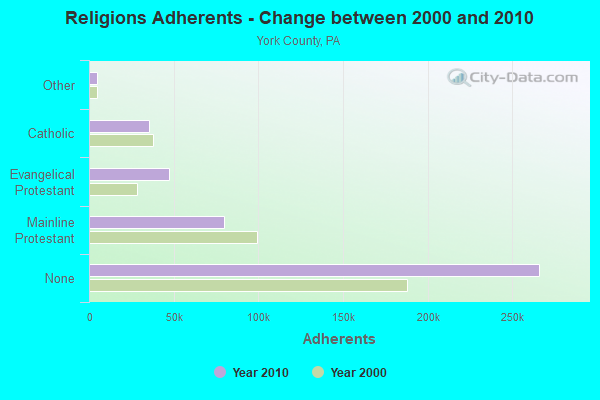
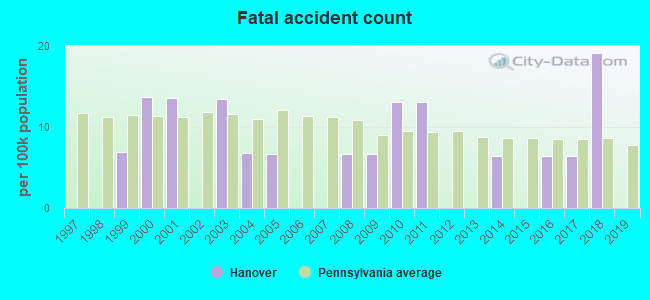
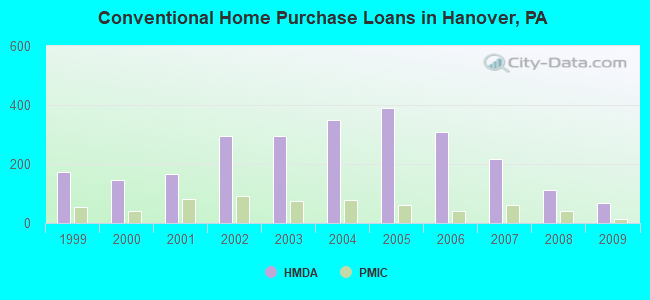
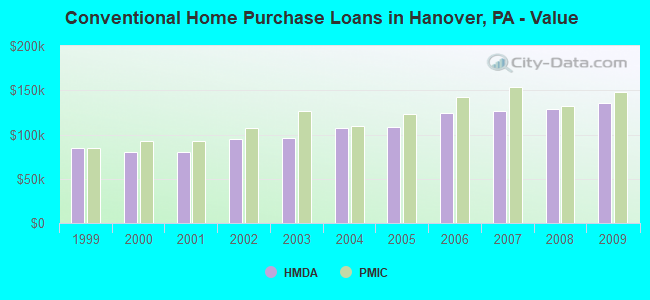
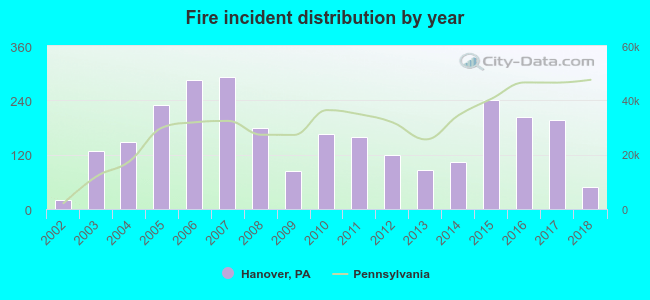 Based on the data from the years 2002 - 2018 the average number of fire incidents per year is 158. The highest number of reported fires - 292 took place in 2007, and the least - 20 in 2002. The data has a growing trend.
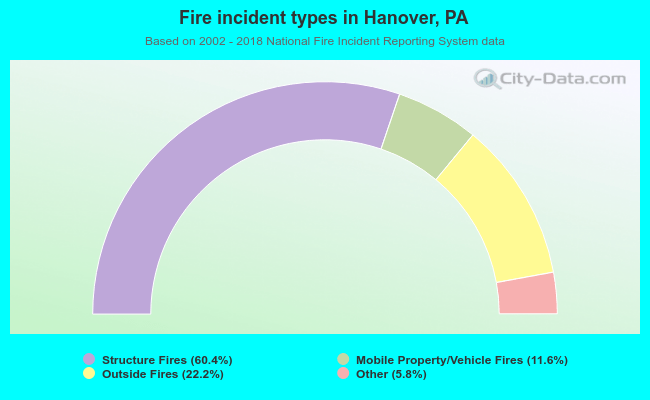 When looking into fire subcategories, the most incidents belonged to: Structure Fires (60.4%), and Outside Fires (22.2%).