Morro Bay, California Submit your own pictures of this city and show them to the world
OSM Map
General Map
Google Map
MSN Map
OSM Map
General Map
Google Map
MSN Map
OSM Map
General Map
Google Map
MSN Map
OSM Map
General Map
Google Map
MSN Map
Please wait while loading the map...
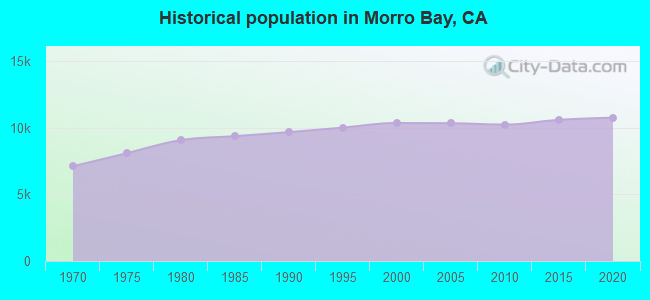
Population in 2022: 10,696 (99% urban, 1% rural). Population change since 2000: +3.3%Males: 5,188 Females: 5,508
March 2022 cost of living index in Morro Bay: 111.9 (more than average, U.S. average is 100) Percentage of residents living in poverty in 2022: 9.8%for White Non-Hispanic residents , 54.2% for Black residents , 10.2% for Hispanic or Latino residents , 82.3% for American Indian residents , 14.8% for other race residents , 10.6% for two or more races residents )
Profiles of local businesses
Business Search - 14 Million verified businesses
Data:
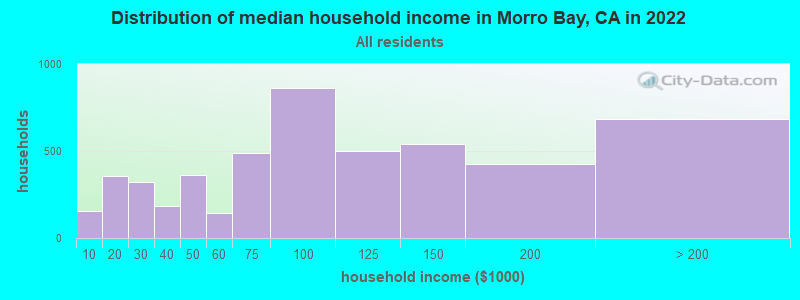
Median household income ($)
Median household income (% change since 2000)
Household income diversity
Ratio of average income to average house value (%)
Ratio of average income to average rent
Median household income ($) - White
Median household income ($) - Black or African American
Median household income ($) - Asian
Median household income ($) - Hispanic or Latino
Median household income ($) - American Indian and Alaska Native
Median household income ($) - Multirace
Median household income ($) - Other Race
Median household income for houses/condos with a mortgage ($)
Median household income for apartments without a mortgage ($)
Races - White alone (%)
Races - White alone (% change since 2000)
Races - Black alone (%)
Races - Black alone (% change since 2000)
Races - American Indian alone (%)
Races - American Indian alone (% change since 2000)
Races - Asian alone (%)
Races - Asian alone (% change since 2000)
Races - Hispanic (%)
Races - Hispanic (% change since 2000)
Races - Native Hawaiian and Other Pacific Islander alone (%)
Races - Native Hawaiian and Other Pacific Islander alone (% change since 2000)
Races - Two or more races (%)
Races - Two or more races (% change since 2000)
Races - Other race alone (%)
Races - Other race alone (% change since 2000)
Racial diversity
Unemployment (%)
Unemployment (% change since 2000)
Unemployment (%) - White
Unemployment (%) - Black or African American
Unemployment (%) - Asian
Unemployment (%) - Hispanic or Latino
Unemployment (%) - American Indian and Alaska Native
Unemployment (%) - Multirace
Unemployment (%) - Other Race
Population density (people per square mile)
Population - Males (%)
Population - Females (%)
Population - Males (%) - White
Population - Males (%) - Black or African American
Population - Males (%) - Asian
Population - Males (%) - Hispanic or Latino
Population - Males (%) - American Indian and Alaska Native
Population - Males (%) - Multirace
Population - Males (%) - Other Race
Population - Females (%) - White
Population - Females (%) - Black or African American
Population - Females (%) - Asian
Population - Females (%) - Hispanic or Latino
Population - Females (%) - American Indian and Alaska Native
Population - Females (%) - Multirace
Population - Females (%) - Other Race
Coronavirus confirmed cases (Apr 27, 2024)
Deaths caused by coronavirus (Apr 27, 2024)
Coronavirus confirmed cases (per 100k population) (Apr 27, 2024)
Deaths caused by coronavirus (per 100k population) (Apr 27, 2024)
Daily increase in number of cases (Apr 27, 2024)
Weekly increase in number of cases (Apr 27, 2024)
Cases doubled (in days) (Apr 27, 2024)
Hospitalized patients (Apr 18, 2022)
Negative test results (Apr 18, 2022)
Total test results (Apr 18, 2022)
COVID Vaccine doses distributed (per 100k population) (Sep 19, 2023)
COVID Vaccine doses administered (per 100k population) (Sep 19, 2023)
COVID Vaccine doses distributed (Sep 19, 2023)
COVID Vaccine doses administered (Sep 19, 2023)
Likely homosexual households (%)
Likely homosexual households (% change since 2000)
Likely homosexual households - Lesbian couples (%)
Likely homosexual households - Lesbian couples (% change since 2000)
Likely homosexual households - Gay men (%)
Likely homosexual households - Gay men (% change since 2000)
Cost of living index
Median gross rent ($)
Median contract rent ($)
Median monthly housing costs ($)
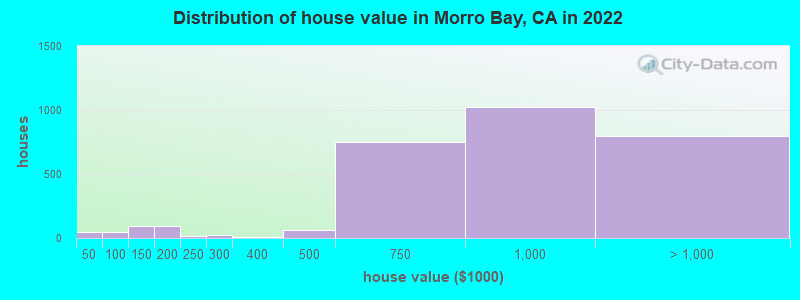
Median house or condo value ($)
Median house or condo value ($ change since 2000)
Mean house or condo value by units in structure - 1, detached ($)
Mean house or condo value by units in structure - 1, attached ($)
Mean house or condo value by units in structure - 2 ($)
Mean house or condo value by units in structure by units in structure - 3 or 4 ($)
Mean house or condo value by units in structure - 5 or more ($)
Mean house or condo value by units in structure - Boat, RV, van, etc. ($)
Mean house or condo value by units in structure - Mobile home ($)
Median house or condo value ($) - White
Median house or condo value ($) - Black or African American
Median house or condo value ($) - Asian
Median house or condo value ($) - Hispanic or Latino
Median house or condo value ($) - American Indian and Alaska Native
Median house or condo value ($) - Multirace
Median house or condo value ($) - Other Race
Median resident age
Resident age diversity
Median resident age - Males
Median resident age - Females
Median resident age - White
Median resident age - Black or African American
Median resident age - Asian
Median resident age - Hispanic or Latino
Median resident age - American Indian and Alaska Native
Median resident age - Multirace
Median resident age - Other Race
Median resident age - Males - White
Median resident age - Males - Black or African American
Median resident age - Males - Asian
Median resident age - Males - Hispanic or Latino
Median resident age - Males - American Indian and Alaska Native
Median resident age - Males - Multirace
Median resident age - Males - Other Race
Median resident age - Females - White
Median resident age - Females - Black or African American
Median resident age - Females - Asian
Median resident age - Females - Hispanic or Latino
Median resident age - Females - American Indian and Alaska Native
Median resident age - Females - Multirace
Median resident age - Females - Other Race
Commute - mean travel time to work (minutes)
Travel time to work - Less than 5 minutes (%)
Travel time to work - Less than 5 minutes (% change since 2000)
Travel time to work - 5 to 9 minutes (%)
Travel time to work - 5 to 9 minutes (% change since 2000)
Travel time to work - 10 to 19 minutes (%)
Travel time to work - 10 to 19 minutes (% change since 2000)
Travel time to work - 20 to 29 minutes (%)
Travel time to work - 20 to 29 minutes (% change since 2000)
Travel time to work - 30 to 39 minutes (%)
Travel time to work - 30 to 39 minutes (% change since 2000)
Travel time to work - 40 to 59 minutes (%)
Travel time to work - 40 to 59 minutes (% change since 2000)
Travel time to work - 60 to 89 minutes (%)
Travel time to work - 60 to 89 minutes (% change since 2000)
Travel time to work - 90 or more minutes (%)
Travel time to work - 90 or more minutes (% change since 2000)
Marital status - Never married (%)
Marital status - Now married (%)
Marital status - Separated (%)
Marital status - Widowed (%)
Marital status - Divorced (%)
Median family income ($)
Median family income (% change since 2000)
Median non-family income ($)
Median non-family income (% change since 2000)
Median per capita income ($)
Median per capita income (% change since 2000)
Median family income ($) - White
Median family income ($) - Black or African American
Median family income ($) - Asian
Median family income ($) - Hispanic or Latino
Median family income ($) - American Indian and Alaska Native
Median family income ($) - Multirace
Median family income ($) - Other Race
Median year house/condo built
Median year apartment built
Year house built - Built 2005 or later (%)
Year house built - Built 2000 to 2004 (%)
Year house built - Built 1990 to 1999 (%)
Year house built - Built 1980 to 1989 (%)
Year house built - Built 1970 to 1979 (%)
Year house built - Built 1960 to 1969 (%)
Year house built - Built 1950 to 1959 (%)
Year house built - Built 1940 to 1949 (%)
Year house built - Built 1939 or earlier (%)
Average household size
Household density (households per square mile)
Average household size - White
Average household size - Black or African American
Average household size - Asian
Average household size - Hispanic or Latino
Average household size - American Indian and Alaska Native
Average household size - Multirace
Average household size - Other Race
Occupied housing units (%)
Vacant housing units (%)
Owner occupied housing units (%)
Renter occupied housing units (%)
Vacancy status - For rent (%)
Vacancy status - For sale only (%)
Vacancy status - Rented or sold, not occupied (%)
Vacancy status - For seasonal, recreational, or occasional use (%)
Vacancy status - For migrant workers (%)
Vacancy status - Other vacant (%)
Residents with income below the poverty level (%)
Residents with income below 50% of the poverty level (%)
Children below poverty level (%)
Poor families by family type - Married-couple family (%)
Poor families by family type - Male, no wife present (%)
Poor families by family type - Female, no husband present (%)
Poverty status for native-born residents (%)
Poverty status for foreign-born residents (%)
Poverty among high school graduates not in families (%)
Poverty among people who did not graduate high school not in families (%)
Residents with income below the poverty level (%) - White
Residents with income below the poverty level (%) - Black or African American
Residents with income below the poverty level (%) - Asian
Residents with income below the poverty level (%) - Hispanic or Latino
Residents with income below the poverty level (%) - American Indian and Alaska Native
Residents with income below the poverty level (%) - Multirace
Residents with income below the poverty level (%) - Other Race
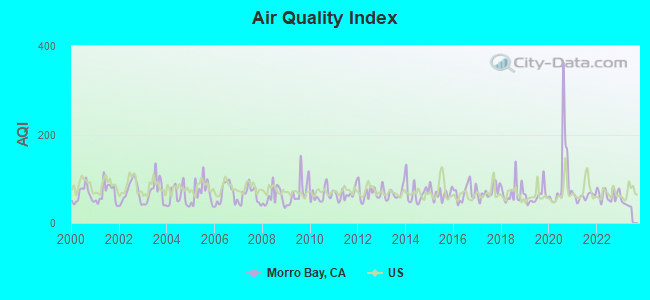
Air pollution - Air Quality Index (AQI)
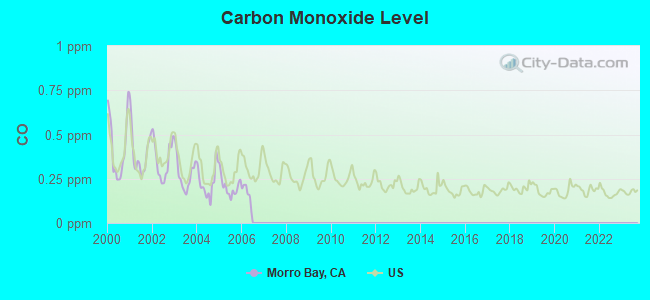
Air pollution - CO
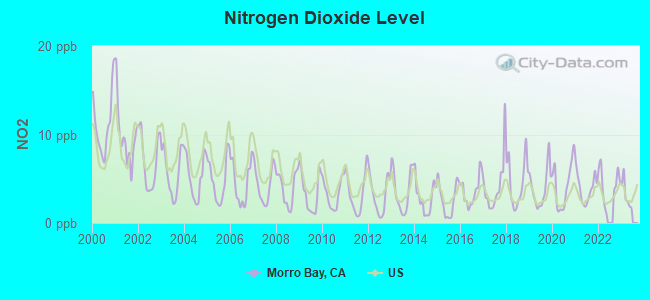
Air pollution - NO2
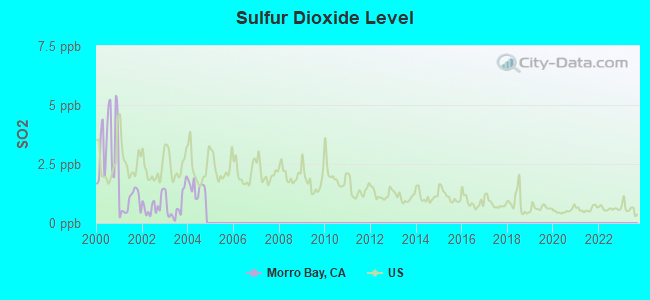
Air pollution - SO2
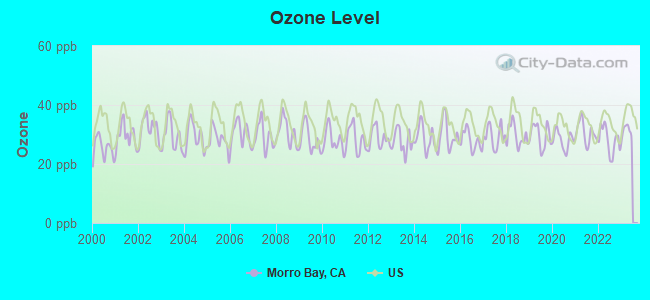
Air pollution - Ozone
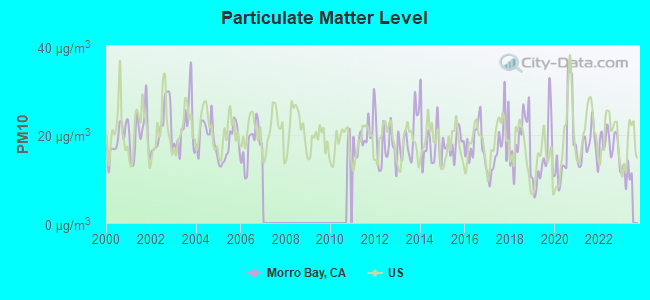
Air pollution - PM10
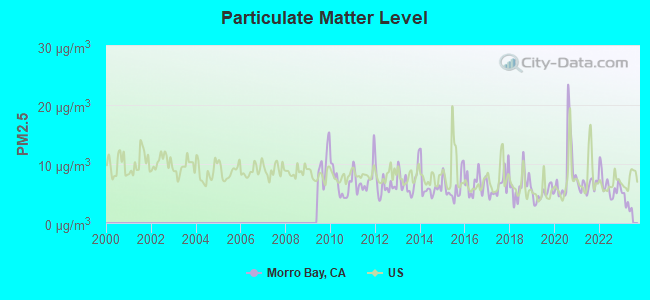
Air pollution - PM25
Air pollution - Pb
Crime - Murders per 100,000 population
Crime - Rapes per 100,000 population
Crime - Robberies per 100,000 population
Crime - Assaults per 100,000 population
Crime - Burglaries per 100,000 population
Crime - Thefts per 100,000 population
Crime - Auto thefts per 100,000 population
Crime - Arson per 100,000 population
Crime - City-data.com crime index
Crime - Violent crime index
Crime - Property crime index
Crime - Murders per 100,000 population (5 year average)
Crime - Rapes per 100,000 population (5 year average)
Crime - Robberies per 100,000 population (5 year average)
Crime - Assaults per 100,000 population (5 year average)
Crime - Burglaries per 100,000 population (5 year average)
Crime - Thefts per 100,000 population (5 year average)
Crime - Auto thefts per 100,000 population (5 year average)
Crime - Arson per 100,000 population (5 year average)
Crime - City-data.com crime index (5 year average)
Crime - Violent crime index (5 year average)
Crime - Property crime index (5 year average)
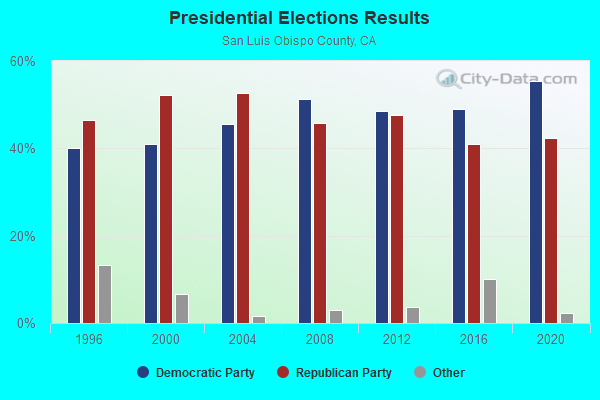
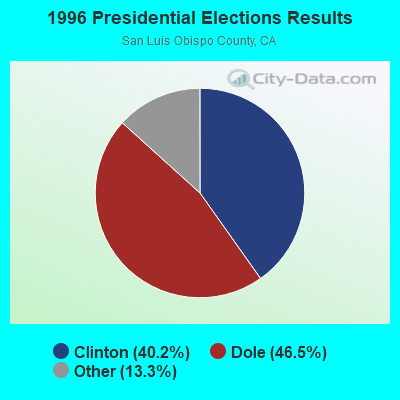
1996 Presidential Elections Results (%) - Democratic Party (Clinton)
1996 Presidential Elections Results (%) - Republican Party (Dole)
1996 Presidential Elections Results (%) - Other
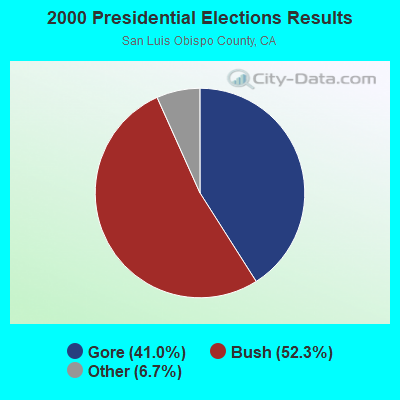
2000 Presidential Elections Results (%) - Democratic Party (Gore)
2000 Presidential Elections Results (%) - Republican Party (Bush)
2000 Presidential Elections Results (%) - Other
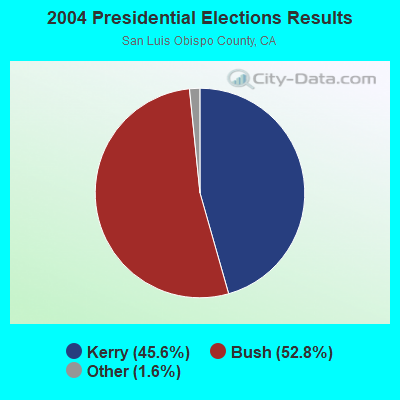
2004 Presidential Elections Results (%) - Democratic Party (Kerry)
2004 Presidential Elections Results (%) - Republican Party (Bush)
2004 Presidential Elections Results (%) - Other
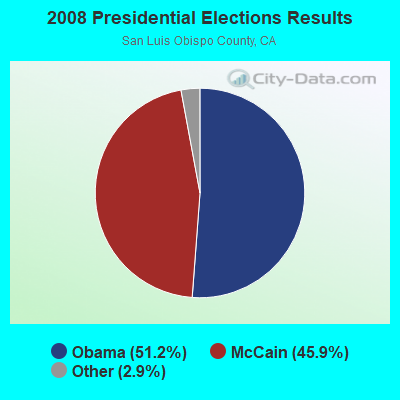
2008 Presidential Elections Results (%) - Democratic Party (Obama)
2008 Presidential Elections Results (%) - Republican Party (McCain)
2008 Presidential Elections Results (%) - Other
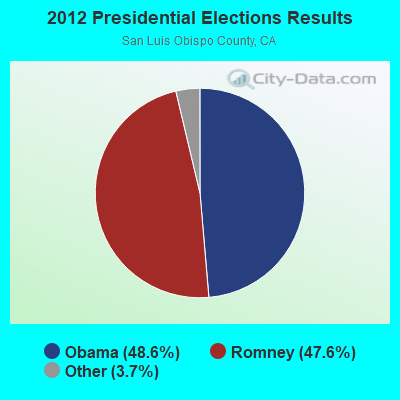
2012 Presidential Elections Results (%) - Democratic Party (Obama)
2012 Presidential Elections Results (%) - Republican Party (Romney)
2012 Presidential Elections Results (%) - Other
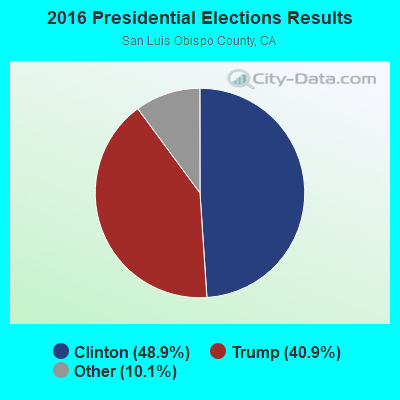
2016 Presidential Elections Results (%) - Democratic Party (Clinton)
2016 Presidential Elections Results (%) - Republican Party (Trump)
2016 Presidential Elections Results (%) - Other
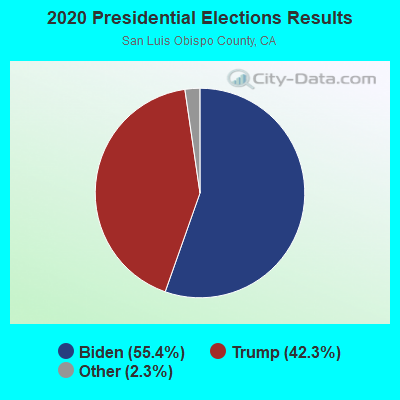
2020 Presidential Elections Results (%) - Democratic Party (Biden)
2020 Presidential Elections Results (%) - Republican Party (Trump)
2020 Presidential Elections Results (%) - Other
Ancestries Reported - Arab (%)
Ancestries Reported - Czech (%)
Ancestries Reported - Danish (%)
Ancestries Reported - Dutch (%)
Ancestries Reported - English (%)
Ancestries Reported - French (%)
Ancestries Reported - French Canadian (%)
Ancestries Reported - German (%)
Ancestries Reported - Greek (%)
Ancestries Reported - Hungarian (%)
Ancestries Reported - Irish (%)
Ancestries Reported - Italian (%)
Ancestries Reported - Lithuanian (%)
Ancestries Reported - Norwegian (%)
Ancestries Reported - Polish (%)
Ancestries Reported - Portuguese (%)
Ancestries Reported - Russian (%)
Ancestries Reported - Scotch-Irish (%)
Ancestries Reported - Scottish (%)
Ancestries Reported - Slovak (%)
Ancestries Reported - Subsaharan African (%)
Ancestries Reported - Swedish (%)
Ancestries Reported - Swiss (%)
Ancestries Reported - Ukrainian (%)
Ancestries Reported - United States (%)
Ancestries Reported - Welsh (%)
Ancestries Reported - West Indian (%)
Ancestries Reported - Other (%)
Educational Attainment - No schooling completed (%)
Educational Attainment - Less than high school (%)
Educational Attainment - High school or equivalent (%)
Educational Attainment - Less than 1 year of college (%)
Educational Attainment - 1 or more years of college (%)
Educational Attainment - Associate degree (%)
Educational Attainment - Bachelor's degree (%)
Educational Attainment - Master's degree (%)
Educational Attainment - Professional school degree (%)
Educational Attainment - Doctorate degree (%)
School Enrollment - Nursery, preschool (%)
School Enrollment - Kindergarten (%)
School Enrollment - Grade 1 to 4 (%)
School Enrollment - Grade 5 to 8 (%)
School Enrollment - Grade 9 to 12 (%)
School Enrollment - College undergrad (%)
School Enrollment - Graduate or professional (%)
School Enrollment - Not enrolled in school (%)
School enrollment - Public schools (%)
School enrollment - Private schools (%)
School enrollment - Not enrolled (%)
Median number of rooms in houses and condos
Median number of rooms in apartments
Housing units lacking complete plumbing facilities (%)
Housing units lacking complete kitchen facilities (%)
Density of houses
Urban houses (%)
Rural houses (%)
Households with people 60 years and over (%)
Households with people 65 years and over (%)
Households with people 75 years and over (%)
Households with one or more nonrelatives (%)
Households with no nonrelatives (%)
Population in households (%)
Family households (%)
Nonfamily households (%)
Population in families (%)
Family households with own children (%)
Median number of bedrooms in owner occupied houses
Mean number of bedrooms in owner occupied houses
Median number of bedrooms in renter occupied houses
Mean number of bedrooms in renter occupied houses
Median number of vehichles in owner occupied houses
Mean number of vehichles in owner occupied houses
Median number of vehichles in renter occupied houses
Mean number of vehichles in renter occupied houses
Mortgage status - with mortgage (%)
Mortgage status - with second mortgage (%)
Mortgage status - with home equity loan (%)
Mortgage status - with both second mortgage and home equity loan (%)
Mortgage status - without a mortgage (%)
Average family size
Average family size - White
Average family size - Black or African American
Average family size - Asian
Average family size - Hispanic or Latino
Average family size - American Indian and Alaska Native
Average family size - Multirace
Average family size - Other Race
Geographical mobility - Same house 1 year ago (%)
Geographical mobility - Moved within same county (%)
Geographical mobility - Moved from different county within same state (%)
Geographical mobility - Moved from different state (%)
Geographical mobility - Moved from abroad (%)
Place of birth - Born in state of residence (%)
Place of birth - Born in other state (%)
Place of birth - Native, outside of US (%)
Place of birth - Foreign born (%)
Housing units in structures - 1, detached (%)
Housing units in structures - 1, attached (%)
Housing units in structures - 2 (%)
Housing units in structures - 3 or 4 (%)
Housing units in structures - 5 to 9 (%)
Housing units in structures - 10 to 19 (%)
Housing units in structures - 20 to 49 (%)
Housing units in structures - 50 or more (%)
Housing units in structures - Mobile home (%)
Housing units in structures - Boat, RV, van, etc. (%)
House/condo owner moved in on average (years ago)
Renter moved in on average (years ago)
Year householder moved into unit - Moved in 1999 to March 2000 (%)
Year householder moved into unit - Moved in 1995 to 1998 (%)
Year householder moved into unit - Moved in 1990 to 1994 (%)
Year householder moved into unit - Moved in 1980 to 1989 (%)
Year householder moved into unit - Moved in 1970 to 1979 (%)
Year householder moved into unit - Moved in 1969 or earlier (%)
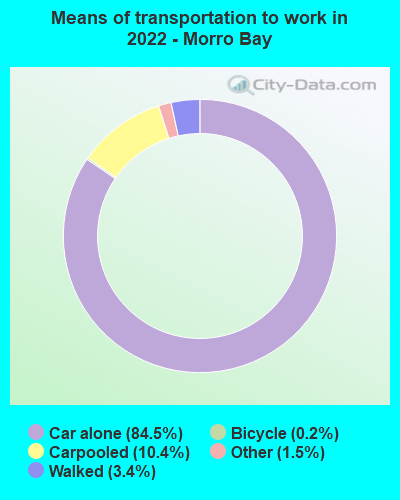
Means of transportation to work - Drove car alone (%)
Means of transportation to work - Carpooled (%)
Means of transportation to work - Public transportation (%)
Means of transportation to work - Bus or trolley bus (%)
Means of transportation to work - Streetcar or trolley car (%)
Means of transportation to work - Subway or elevated (%)
Means of transportation to work - Railroad (%)
Means of transportation to work - Ferryboat (%)
Means of transportation to work - Taxicab (%)
Means of transportation to work - Motorcycle (%)
Means of transportation to work - Bicycle (%)
Means of transportation to work - Walked (%)
Means of transportation to work - Other means (%)
Working at home (%)
Industry diversity
Most Common Industries - Agriculture, forestry, fishing and hunting, and mining (%)
Most Common Industries - Agriculture, forestry, fishing and hunting (%)
Most Common Industries - Mining, quarrying, and oil and gas extraction (%)
Most Common Industries - Construction (%)
Most Common Industries - Manufacturing (%)
Most Common Industries - Wholesale trade (%)
Most Common Industries - Retail trade (%)
Most Common Industries - Transportation and warehousing, and utilities (%)
Most Common Industries - Transportation and warehousing (%)
Most Common Industries - Utilities (%)
Most Common Industries - Information (%)
Most Common Industries - Finance and insurance, and real estate and rental and leasing (%)
Most Common Industries - Finance and insurance (%)
Most Common Industries - Real estate and rental and leasing (%)
Most Common Industries - Professional, scientific, and management, and administrative and waste management services (%)
Most Common Industries - Professional, scientific, and technical services (%)
Most Common Industries - Management of companies and enterprises (%)
Most Common Industries - Administrative and support and waste management services (%)
Most Common Industries - Educational services, and health care and social assistance (%)
Most Common Industries - Educational services (%)
Most Common Industries - Health care and social assistance (%)
Most Common Industries - Arts, entertainment, and recreation, and accommodation and food services (%)
Most Common Industries - Arts, entertainment, and recreation (%)
Most Common Industries - Accommodation and food services (%)
Most Common Industries - Other services, except public administration (%)
Most Common Industries - Public administration (%)
Occupation diversity
Most Common Occupations - Management, business, science, and arts occupations (%)
Most Common Occupations - Management, business, and financial occupations (%)
Most Common Occupations - Management occupations (%)
Most Common Occupations - Business and financial operations occupations (%)
Most Common Occupations - Computer, engineering, and science occupations (%)
Most Common Occupations - Computer and mathematical occupations (%)
Most Common Occupations - Architecture and engineering occupations (%)
Most Common Occupations - Life, physical, and social science occupations (%)
Most Common Occupations - Education, legal, community service, arts, and media occupations (%)
Most Common Occupations - Community and social service occupations (%)
Most Common Occupations - Legal occupations (%)
Most Common Occupations - Education, training, and library occupations (%)
Most Common Occupations - Arts, design, entertainment, sports, and media occupations (%)
Most Common Occupations - Healthcare practitioners and technical occupations (%)
Most Common Occupations - Health diagnosing and treating practitioners and other technical occupations (%)
Most Common Occupations - Health technologists and technicians (%)
Most Common Occupations - Service occupations (%)
Most Common Occupations - Healthcare support occupations (%)
Most Common Occupations - Protective service occupations (%)
Most Common Occupations - Fire fighting and prevention, and other protective service workers including supervisors (%)
Most Common Occupations - Law enforcement workers including supervisors (%)
Most Common Occupations - Food preparation and serving related occupations (%)
Most Common Occupations - Building and grounds cleaning and maintenance occupations (%)
Most Common Occupations - Personal care and service occupations (%)
Most Common Occupations - Sales and office occupations (%)
Most Common Occupations - Sales and related occupations (%)
Most Common Occupations - Office and administrative support occupations (%)
Most Common Occupations - Natural resources, construction, and maintenance occupations (%)
Most Common Occupations - Farming, fishing, and forestry occupations (%)
Most Common Occupations - Construction and extraction occupations (%)
Most Common Occupations - Installation, maintenance, and repair occupations (%)
Most Common Occupations - Production, transportation, and material moving occupations (%)
Most Common Occupations - Production occupations (%)
Most Common Occupations - Transportation occupations (%)
Most Common Occupations - Material moving occupations (%)
People in Group quarters - Institutionalized population (%)
People in Group quarters - Correctional institutions (%)
People in Group quarters - Federal prisons and detention centers (%)
People in Group quarters - Halfway houses (%)
People in Group quarters - Local jails and other confinement facilities (including police lockups) (%)
People in Group quarters - Military disciplinary barracks (%)
People in Group quarters - State prisons (%)
People in Group quarters - Other types of correctional institutions (%)
People in Group quarters - Nursing homes (%)
People in Group quarters - Hospitals/wards, hospices, and schools for the handicapped (%)
People in Group quarters - Hospitals/wards and hospices for chronically ill (%)
People in Group quarters - Hospices or homes for chronically ill (%)
People in Group quarters - Military hospitals or wards for chronically ill (%)
People in Group quarters - Other hospitals or wards for chronically ill (%)
People in Group quarters - Hospitals or wards for drug/alcohol abuse (%)
People in Group quarters - Mental (Psychiatric) hospitals or wards (%)
People in Group quarters - Schools, hospitals, or wards for the mentally retarded (%)
People in Group quarters - Schools, hospitals, or wards for the physically handicapped (%)
People in Group quarters - Institutions for the deaf (%)
People in Group quarters - Institutions for the blind (%)
People in Group quarters - Orthopedic wards and institutions for the physically handicapped (%)
People in Group quarters - Wards in general hospitals for patients who have no usual home elsewhere (%)
People in Group quarters - Wards in military hospitals for patients who have no usual home elsewhere (%)
People in Group quarters - Juvenile institutions (%)
People in Group quarters - Long-term care (%)
People in Group quarters - Homes for abused, dependent, and neglected children (%)
People in Group quarters - Residential treatment centers for emotionally disturbed children (%)
People in Group quarters - Training schools for juvenile delinquents (%)
People in Group quarters - Short-term care, detention or diagnostic centers for delinquent children (%)
People in Group quarters - Type of juvenile institution unknown (%)
People in Group quarters - Noninstitutionalized population (%)
People in Group quarters - College dormitories (includes college quarters off campus) (%)
People in Group quarters - Military quarters (%)
People in Group quarters - On base (%)
People in Group quarters - Barracks, unaccompanied personnel housing (UPH), (Enlisted/Officer), ;and similar group living quarters for military personnel (%)
People in Group quarters - Transient quarters for temporary residents (%)
People in Group quarters - Military ships (%)
People in Group quarters - Group homes (%)
People in Group quarters - Homes or halfway houses for drug/alcohol abuse (%)
People in Group quarters - Homes for the mentally ill (%)
People in Group quarters - Homes for the mentally retarded (%)
People in Group quarters - Homes for the physically handicapped (%)
People in Group quarters - Other group homes (%)
People in Group quarters - Religious group quarters (%)
People in Group quarters - Dormitories (%)
People in Group quarters - Agriculture workers' dormitories on farms (%)
People in Group quarters - Job Corps and vocational training facilities (%)
People in Group quarters - Other workers' dormitories (%)
People in Group quarters - Crews of maritime vessels (%)
People in Group quarters - Other nonhousehold living situations (%)
People in Group quarters - Other noninstitutional group quarters (%)
Residents speaking English at home (%)
Residents speaking English at home - Born in the United States (%)
Residents speaking English at home - Native, born elsewhere (%)
Residents speaking English at home - Foreign born (%)
Residents speaking Spanish at home (%)
Residents speaking Spanish at home - Born in the United States (%)
Residents speaking Spanish at home - Native, born elsewhere (%)
Residents speaking Spanish at home - Foreign born (%)
Residents speaking other language at home (%)
Residents speaking other language at home - Born in the United States (%)
Residents speaking other language at home - Native, born elsewhere (%)
Residents speaking other language at home - Foreign born (%)
Class of Workers - Employee of private company (%)
Class of Workers - Self-employed in own incorporated business (%)
Class of Workers - Private not-for-profit wage and salary workers (%)
Class of Workers - Local government workers (%)
Class of Workers - State government workers (%)
Class of Workers - Federal government workers (%)
Class of Workers - Self-employed workers in own not incorporated business and Unpaid family workers (%)
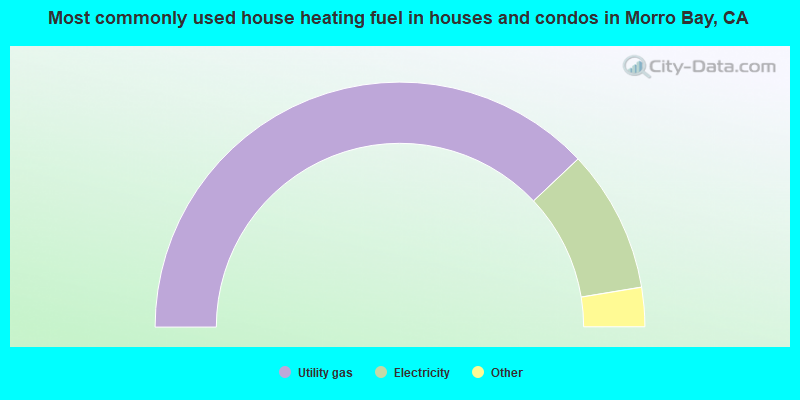
House heating fuel used in houses and condos - Utility gas (%)
House heating fuel used in houses and condos - Bottled, tank, or LP gas (%)
House heating fuel used in houses and condos - Electricity (%)
House heating fuel used in houses and condos - Fuel oil, kerosene, etc. (%)
House heating fuel used in houses and condos - Coal or coke (%)
House heating fuel used in houses and condos - Wood (%)
House heating fuel used in houses and condos - Solar energy (%)
House heating fuel used in houses and condos - Other fuel (%)
House heating fuel used in houses and condos - No fuel used (%)
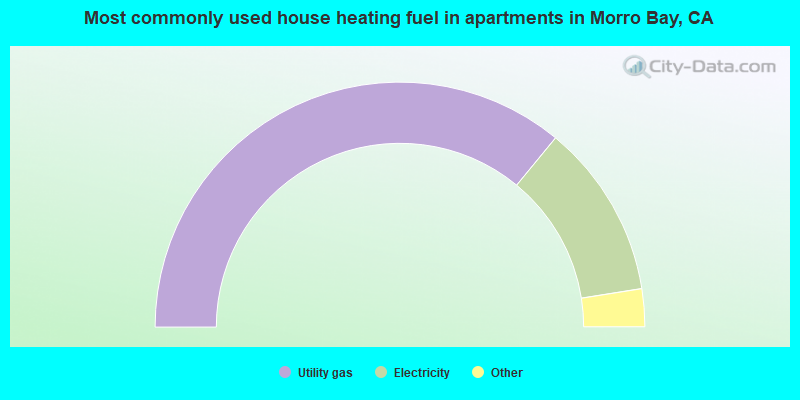
House heating fuel used in apartments - Utility gas (%)
House heating fuel used in apartments - Bottled, tank, or LP gas (%)
House heating fuel used in apartments - Electricity (%)
House heating fuel used in apartments - Fuel oil, kerosene, etc. (%)
House heating fuel used in apartments - Coal or coke (%)
House heating fuel used in apartments - Wood (%)
House heating fuel used in apartments - Solar energy (%)
House heating fuel used in apartments - Other fuel (%)
House heating fuel used in apartments - No fuel used (%)
Armed forces status - In Armed Forces (%)
Armed forces status - Civilian (%)
Armed forces status - Civilian - Veteran (%)
Armed forces status - Civilian - Nonveteran (%)
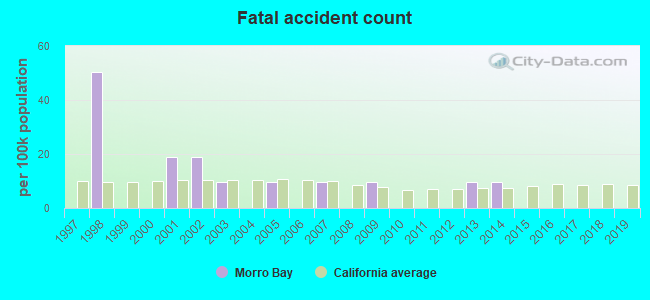
Fatal accidents locations in years 2005-2021
Fatal accidents locations in 2005
Fatal accidents locations in 2006
Fatal accidents locations in 2007
Fatal accidents locations in 2008
Fatal accidents locations in 2009
Fatal accidents locations in 2010
Fatal accidents locations in 2011
Fatal accidents locations in 2012
Fatal accidents locations in 2013
Fatal accidents locations in 2014
Fatal accidents locations in 2015
Fatal accidents locations in 2016
Fatal accidents locations in 2017
Fatal accidents locations in 2018
Fatal accidents locations in 2019
Fatal accidents locations in 2020
Fatal accidents locations in 2021
Alcohol use - People drinking some alcohol every month (%)
Alcohol use - People not drinking at all (%)
Alcohol use - Average days/month drinking alcohol
Alcohol use - Average drinks/week
Alcohol use - Average days/year people drink much
Audiometry - Average condition of hearing (%)
Audiometry - People that can hear a whisper from across a quiet room (%)
Audiometry - People that can hear normal voice from across a quiet room (%)
Audiometry - Ears ringing, roaring, buzzing (%)
Audiometry - Had a job exposure to loud noise (%)
Audiometry - Had off-work exposure to loud noise (%)
Blood Pressure & Cholesterol - Has high blood pressure (%)
Blood Pressure & Cholesterol - Checking blood pressure at home (%)
Blood Pressure & Cholesterol - Frequently checking blood cholesterol (%)
Blood Pressure & Cholesterol - Has high cholesterol level (%)
Consumer Behavior - Money monthly spent on food at supermarket/grocery store
Consumer Behavior - Money monthly spent on food at other stores
Consumer Behavior - Money monthly spent on eating out
Consumer Behavior - Money monthly spent on carryout/delivered foods
Consumer Behavior - Income spent on food at supermarket/grocery store (%)
Consumer Behavior - Income spent on food at other stores (%)
Consumer Behavior - Income spent on eating out (%)
Consumer Behavior - Income spent on carryout/delivered foods (%)
Current Health Status - General health condition (%)
Current Health Status - Blood donors (%)
Current Health Status - Has blood ever tested for HIV virus (%)
Current Health Status - Left-handed people (%)
Dermatology - People using sunscreen (%)
Diabetes - Diabetics (%)
Diabetes - Had a blood test for high blood sugar (%)
Diabetes - People taking insulin (%)
Diet Behavior & Nutrition - Diet health (%)
Diet Behavior & Nutrition - Milk product consumption (# of products/month)
Diet Behavior & Nutrition - Meals not home prepared (#/week)
Diet Behavior & Nutrition - Meals from fast food or pizza place (#/week)
Diet Behavior & Nutrition - Ready-to-eat foods (#/month)
Diet Behavior & Nutrition - Frozen meals/pizza (#/month)
Drug Use - People that ever used marijuana or hashish (%)
Drug Use - Ever used hard drugs (%)
Drug Use - Ever used any form of cocaine (%)
Drug Use - Ever used heroin (%)
Drug Use - Ever used methamphetamine (%)
Health Insurance - People covered by health insurance (%)
Kidney Conditions-Urology - Avg. # of times urinating at night
Medical Conditions - People with asthma (%)
Medical Conditions - People with anemia (%)
Medical Conditions - People with psoriasis (%)
Medical Conditions - People with overweight (%)
Medical Conditions - Elderly people having difficulties in thinking or remembering (%)
Medical Conditions - People who ever received blood transfusion (%)
Medical Conditions - People having trouble seeing even with glass/contacts (%)
Medical Conditions - People with arthritis (%)
Medical Conditions - People with gout (%)
Medical Conditions - People with congestive heart failure (%)
Medical Conditions - People with coronary heart disease (%)
Medical Conditions - People with angina pectoris (%)
Medical Conditions - People who ever had heart attack (%)
Medical Conditions - People who ever had stroke (%)
Medical Conditions - People with emphysema (%)
Medical Conditions - People with thyroid problem (%)
Medical Conditions - People with chronic bronchitis (%)
Medical Conditions - People with any liver condition (%)
Medical Conditions - People who ever had cancer or malignancy (%)
Mental Health - People who have little interest in doing things (%)
Mental Health - People feeling down, depressed, or hopeless (%)
Mental Health - People who have trouble sleeping or sleeping too much (%)
Mental Health - People feeling tired or having little energy (%)
Mental Health - People with poor appetite or overeating (%)
Mental Health - People feeling bad about themself (%)
Mental Health - People who have trouble concentrating on things (%)
Mental Health - People moving or speaking slowly or too fast (%)
Mental Health - People having thoughts they would be better off dead (%)
Oral Health - Average years since last visit a dentist
Oral Health - People embarrassed because of mouth (%)
Oral Health - People with gum disease (%)
Oral Health - General health of teeth and gums (%)
Oral Health - Average days a week using dental floss/device
Oral Health - Average days a week using mouthwash for dental problem
Oral Health - Average number of teeth
Pesticide Use - Households using pesticides to control insects (%)
Pesticide Use - Households using pesticides to kill weeds (%)
Physical Activity - People doing vigorous-intensity work activities (%)
Physical Activity - People doing moderate-intensity work activities (%)
Physical Activity - People walking or bicycling (%)
Physical Activity - People doing vigorous-intensity recreational activities (%)
Physical Activity - People doing moderate-intensity recreational activities (%)
Physical Activity - Average hours a day doing sedentary activities
Physical Activity - Average hours a day watching TV or videos
Physical Activity - Average hours a day using computer
Physical Functioning - People having limitations keeping them from working (%)
Physical Functioning - People limited in amount of work they can do (%)
Physical Functioning - People that need special equipment to walk (%)
Physical Functioning - People experiencing confusion/memory problems (%)
Physical Functioning - People requiring special healthcare equipment (%)
Prescription Medications - Average number of prescription medicines taking
Preventive Aspirin Use - Adults 40+ taking low-dose aspirin (%)
Reproductive Health - Vaginal deliveries (%)
Reproductive Health - Cesarean deliveries (%)
Reproductive Health - Deliveries resulted in a live birth (%)
Reproductive Health - Pregnancies resulted in a delivery (%)
Reproductive Health - Women breastfeeding newborns (%)
Reproductive Health - Women that had a hysterectomy (%)
Reproductive Health - Women that had both ovaries removed (%)
Reproductive Health - Women that have ever taken birth control pills (%)
Reproductive Health - Women taking birth control pills (%)
Reproductive Health - Women that have ever used Depo-Provera or injectables (%)
Reproductive Health - Women that have ever used female hormones (%)
Sexual Behavior - People 18+ that ever had sex (vaginal, anal, or oral) (%)
Sexual Behavior - Males 18+ that ever had vaginal sex with a woman (%)
Sexual Behavior - Males 18+ that ever performed oral sex on a woman (%)
Sexual Behavior - Males 18+ that ever had anal sex with a woman (%)
Sexual Behavior - Males 18+ that ever had any sex with a man (%)
Sexual Behavior - Females 18+ that ever had vaginal sex with a man (%)
Sexual Behavior - Females 18+ that ever performed oral sex on a man (%)
Sexual Behavior - Females 18+ that ever had anal sex with a man (%)
Sexual Behavior - Females 18+ that ever had any kind of sex with a woman (%)
Sexual Behavior - Average age people first had sex
Sexual Behavior - Average number of female sex partners in lifetime (males 18+)
Sexual Behavior - Average number of female vaginal sex partners in lifetime (males 18+)
Sexual Behavior - Average age people first performed oral sex on a woman (18+)
Sexual Behavior - Average number of woman performed oral sex on in lifetime (18+)
Sexual Behavior - Average number of male sex partners in lifetime (males 18+)
Sexual Behavior - Average number of male anal sex partners in lifetime (males 18+)
Sexual Behavior - Average age people first performed oral sex on a man (18+)
Sexual Behavior - Average number of male oral sex partners in lifetime (18+)
Sexual Behavior - People using protection when performing oral sex (%)
Sexual Behavior - Average number of times people have vaginal or anal sex a year
Sexual Behavior - People having sex without condom (%)
Sexual Behavior - Average number of male sex partners in lifetime (females 18+)
Sexual Behavior - Average number of male vaginal sex partners in lifetime (females 18+)
Sexual Behavior - Average number of female sex partners in lifetime (females 18+)
Sexual Behavior - Circumcised males 18+ (%)
Sleep Disorders - Average hours sleeping at night
Sleep Disorders - People that has trouble sleeping (%)
Smoking-Cigarette Use - People smoking cigarettes (%)
Taste & Smell - People 40+ having problems with smell (%)
Taste & Smell - People 40+ having problems with taste (%)
Taste & Smell - People 40+ that ever had wisdom teeth removed (%)
Taste & Smell - People 40+ that ever had tonsils teeth removed (%)
Taste & Smell - People 40+ that ever had a loss of consciousness because of a head injury (%)
Taste & Smell - People 40+ that ever had a broken nose or other serious injury to face or skull (%)
Taste & Smell - People 40+ that ever had two or more sinus infections (%)
Weight - Average height (inches)
Weight - Average weight (pounds)
Weight - Average BMI
Weight - People that are obese (%)
Weight - People that ever were obese (%)
Weight - People trying to lose weight (%)
7,867 73.0% White alone 1,559 14.5% Hispanic 571 5.3% Asian alone 446 4.1% Other race alone 355 3.3% Two or more races 47 0.4% American Indian alone 22 0.2% Black alone
According to our research of California and other state lists, there were 14 registered sex offenders living in Morro Bay, California as of April 27, 2024 . The ratio of all residents to sex offenders in Morro Bay is 763 to 1.The ratio of registered sex offenders to all residents in this city is near the state average.
Officers per 1,000 residents here:
1.51California average:
2.30
Latest news from Morro Bay, CA collected exclusively by city-data.com from local newspapers, TV, and radio stations
Ancestries: English (12.0%), Irish (10.9%), American (8.0%), German (7.0%), European (4.5%), Italian (3.8%).
Current Local Time:
Land area: 5.16 square miles.
Population density: 2,074 people per square mile (low).
627 residents are foreign born (2.6% Latin America , 1.8% Asia , 1.0% Europe ).
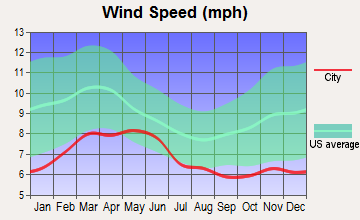
This city:
5.8%California:
26.5%
Median real estate property taxes paid for housing units with mortgages in 2022: $5,383 (0.6%)Median real estate property taxes paid for housing units with no mortgage in 2022: $2,970 (0.4%)
Nearest city with pop. 50,000+: Santa Maria, CA
Nearest city with pop. 200,000+: Bakersfield, CA
Nearest city with pop. 1,000,000+: Los Angeles, CA
Nearest cities:
Latitude: 35.38 N, Longitude: 120.85 W
Daytime population change due to commuting: -453 (-4.2%)Workers who live and work in this city: 2,114 (42.4%)
Morro Bay tourist attractions:
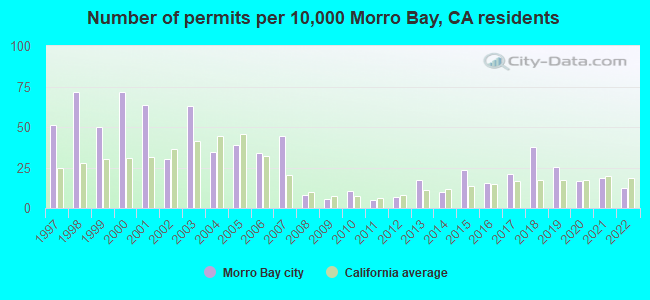
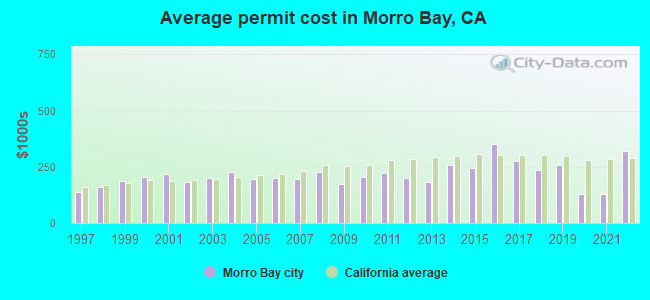
Single-family new house construction building permits:
2022: 13 buildings , average cost: $320,0002021: 19 buildings , average cost: $130,3002020: 17 buildings , average cost: $130,3002019: 26 buildings , average cost: $259,5002018: 39 buildings , average cost: $235,3002017: 22 buildings , average cost: $274,1002016: 16 buildings , average cost: $350,0002015: 24 buildings , average cost: $242,7002014: 10 buildings , average cost: $257,3002013: 18 buildings , average cost: $184,0002012: 7 buildings , average cost: $200,6002011: 5 buildings , average cost: $221,6002010: 11 buildings , average cost: $203,0002009: 6 buildings , average cost: $173,2002008: 8 buildings , average cost: $225,2002007: 46 buildings , average cost: $193,7002006: 35 buildings , average cost: $198,2002005: 40 buildings , average cost: $195,6002004: 36 buildings , average cost: $225,2002003: 65 buildings , average cost: $201,1002002: 31 buildings , average cost: $182,9002001: 66 buildings , average cost: $215,5002000: 74 buildings , average cost: $203,7001999: 52 buildings , average cost: $185,2001998: 74 buildings , average cost: $161,5001997: 53 buildings , average cost: $136,300Unemployment in December 2023:
Population change in the 1990s: +754 (+7.9%).
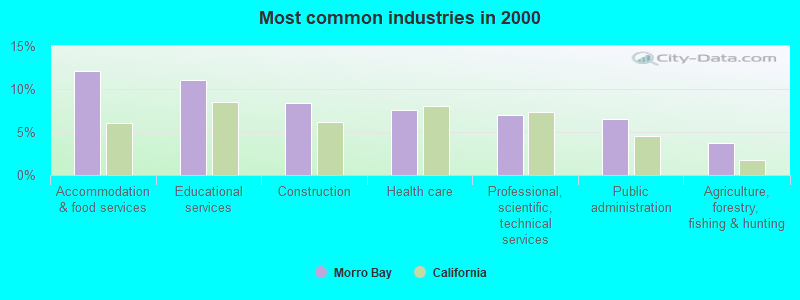
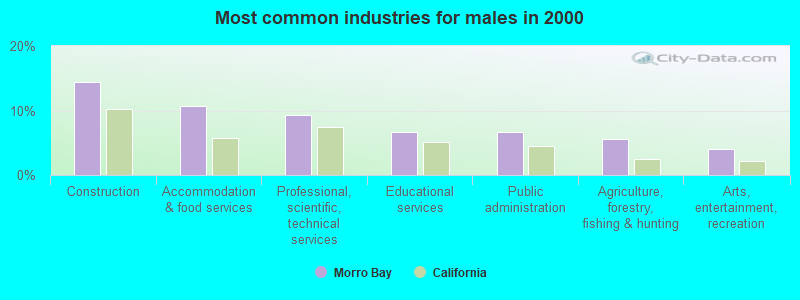
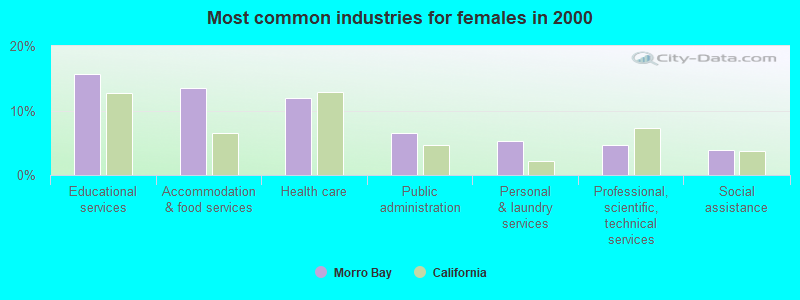
Most common industries in Morro Bay, CA (%)
Both Males Females
Accommodation & food services (12.1%)
Educational services (11.1%)
Construction (8.3%)
Health care (7.6%)
Professional, scientific, technical services (7.0%)
Public administration (6.5%)
Agriculture, forestry, fishing & hunting (3.7%)
Construction (14.3%)
Accommodation & food services (10.8%)
Professional, scientific, technical services (9.2%)
Educational services (6.6%)
Public administration (6.6%)
Agriculture, forestry, fishing & hunting (5.6%)
Arts, entertainment, recreation (4.1%)
Educational services (15.7%)
Accommodation & food services (13.6%)
Health care (11.9%)
Public administration (6.5%)
Personal & laundry services (5.2%)
Professional, scientific, technical services (4.7%)
Social assistance (3.9%)
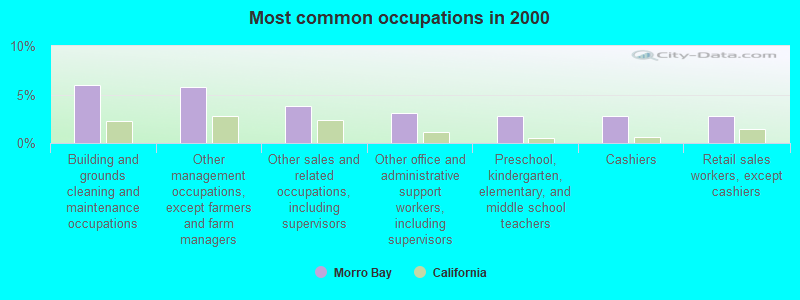
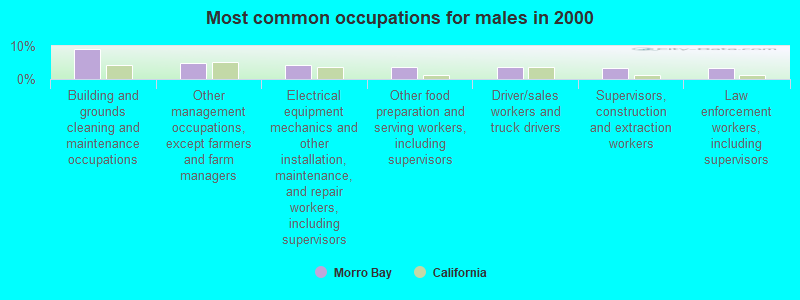
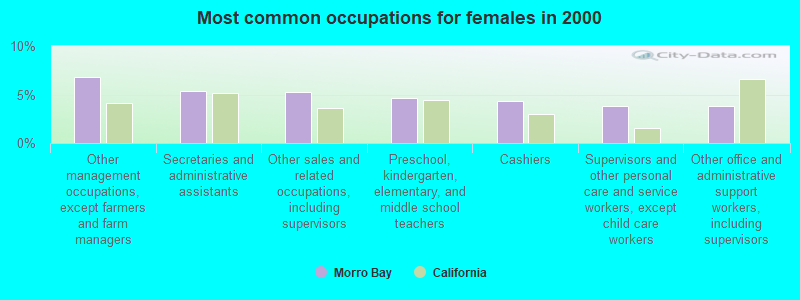
Most common occupations in Morro Bay, CA (%)
Both Males Females
Building and grounds cleaning and maintenance occupations (6.0%)
Other management occupations, except farmers and farm managers (5.7%)
Other sales and related occupations, including supervisors (3.9%)
Other office and administrative support workers, including supervisors (3.1%)
Preschool, kindergarten, elementary, and middle school teachers (2.8%)
Cashiers (2.8%)
Retail sales workers, except cashiers (2.8%)
Building and grounds cleaning and maintenance occupations (9.1%)
Other management occupations, except farmers and farm managers (4.7%)
Electrical equipment mechanics and other installation, maintenance, and repair workers, including supervisors (4.4%)
Other food preparation and serving workers, including supervisors (3.6%)
Driver/sales workers and truck drivers (3.5%)
Supervisors, construction and extraction workers (3.4%)
Law enforcement workers, including supervisors (3.4%)
Other management occupations, except farmers and farm managers (6.8%)
Secretaries and administrative assistants (5.4%)
Other sales and related occupations, including supervisors (5.2%)
Preschool, kindergarten, elementary, and middle school teachers (4.6%)
Cashiers (4.3%)
Supervisors and other personal care and service workers, except child care workers (3.9%)
Other office and administrative support workers, including supervisors (3.8%)
Earthquake activity:
Morro Bay-area historical earthquake activity is significantly above California state average. It is 6828% greater than the overall U.S. average. On 11/4/1927 at 13:51:53, a magnitude 7.5 (7.5 UK, Class: Major, Intensity: VIII - XII) earthquake occurred 33.6 miles away from Morro Bay center On 7/21/1952 at 11:52:14, a magnitude 7.7 (7.7 UK) earthquake occurred 108.0 miles away from the city center, causing $50,000,000 total damage On 4/18/1906 at 13:12:21, a magnitude 7.9 (7.9 UK) earthquake occurred 216.9 miles away from Morro Bay center, causing $524,000,000 total damage On 10/18/1989 at 00:04:15, a magnitude 7.1 (6.5 MB, 7.1 MS, 6.9 MW, 7.0 ML) earthquake occurred 130.2 miles away from the city center, causing 62 deaths ( 62 shaking deaths) and 3757 injuries, causing $1,305,032,704 total damage On 6/28/1992 at 11:57:34, a magnitude 7.6 (6.2 MB, 7.6 MS, 7.3 MW, Depth: 0.7 mi) earthquake occurred 259.0 miles away from the city center, causing 3 deaths ( 1 shaking deaths, 2 other deaths) and 400 injuries, causing $100,000,000 total damage and $40,000,000 insured lossesOn 12/22/2003 at 19:15:56, a magnitude 6.6 (6.1 MB, 6.4 MS, 6.6 MW, 6.4 MW, Class: Strong, Intensity: VII - IX) earthquake occurred 20.7 miles away from Morro Bay center, causing 2 deaths ( 2 shaking deaths) and 40 injuries, causing $200,000,000 total damage Magnitude types: body-wave magnitude (MB), local magnitude (ML), surface-wave magnitude (MS), moment magnitude (MW) Natural disasters: The number of natural disasters in San Luis Obispo County (20) is greater than the US average (15).Major Disasters (Presidential) Declared: 14Emergencies Declared: 2Floods: 14, Storms: 7, Winter Storms: 7, Mudslides: 5, Landslides: 3, Drought: 1, Earthquake: 1, Fire: 1, Freeze: 1, Hurricane: 1, Tornado: 1, Other: 1 (Note: some incidents may be assigned to more than one category). Hospitals and medical centers in Morro Bay: BAYSIDE CARE CENTER (1405 TERESA DR)
Other hospitals and medical centers near Morro Bay: SIERRA VISTA REGIONAL MEDICAL CENTER (about 13 miles away; SAN LUIS OBISPO, CA)
MAXIM HEALTHCARE SERVICES INC (Home Health Center, about 13 miles away; SAN LUIS OBISPO, CA)
CENTRAL COAST NEUROBEHAVIOR CENTER - ADOLESCENTS (Hospital, about 13 miles away; ATASCADERO, CA)
SAN LUIS OBISPO DIALYSIS (Dialysis Facility, about 13 miles away; SAN LUIS OBISPO, CA)
BESTCARE CENTRAL COAST HHA (Home Health Center, about 14 miles away; SAN LUIS OBISPO, CA)
HOSPICE PARTNERS OF THE CENTRAL COAST (Hospital, about 14 miles away; SAN LUIS OBISPO, CA)
DANISH CARE CENTER (Nursing Home, about 14 miles away; ATASCADERO, CA)
Amtrak stations near Morro Bay: 13 miles: SAN LUIS OBISPO-CAL POLY (SAN LUIS OBISPO, GRAND AVE.) - Bus Station Services: fully wheelchair accessible, public payphones, full-service food facilities, call for car rental service, call for taxi service.
14 miles: ATASCADERO (EAST MALL & PALMA AVE.) - Bus Station Services: fully wheelchair accessible, public payphones, taxi stand.
14 miles: SAN LUIS OBISPO (RAILROAD AVE & SANTA ROSA ST.) Services: ticket office, fully wheelchair accessible, enclosed waiting area, public restrooms, public payphones, vending machines, free short-term parking, free long-term parking, call for car rental service, call for taxi service, public transit connection.
Operable nuclear power plants near Morro Bay:
16 miles: Diablo Canyon 1 and 2 in Avila Beach, CA.
Colleges/universities with over 2000 students nearest to Morro Bay:
Cuesta College (about 8 miles; San Luis Obispo, CA ; Full-time enrollment: 6,518)
California Polytechnic State University-San Luis Obispo (about 13 miles; San Luis Obispo, CA ; FT enrollment: 17,345)
Allan Hancock College (about 39 miles; Santa Maria, CA ; FT enrollment: 6,639)
Taft College (about 81 miles; Taft, CA ; FT enrollment: 2,121)
West Hills College-Lemoore (about 86 miles; Lemoore, CA ; FT enrollment: 2,314)
University of California-Santa Barbara (about 88 miles; Santa Barbara, CA ; FT enrollment: 22,806)
Santa Barbara City College (about 94 miles; Santa Barbara, CA ; FT enrollment: 12,568)
Public high school in Morro Bay: MORRO BAY HIGH Students: 638, Location: 235 ATASCADERO RD., Grades: 9-12)Public elementary/middle school in Morro Bay: DEL MAR ELEMENTARY Location: 501 SEQUOIA ST., Grades: KG-5)
See full list of schools located in Morro Bay
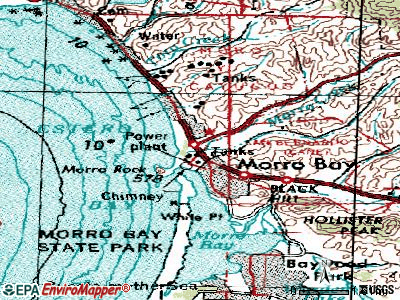
Notable locations in Morro Bay: (A) , Morro Bay State Park Marina (B) , Morro Bay State Park Headquarters (C) , Morro Bay Boat Launch (D) , Chorro Willows Camp Ground (E) , Black Mountain Golf Course (F) , South T Pier (G) , North T Pier (H) , Morro Bay Power Plant (I) , Morro Bay Museum of Natural History (J) , Veterans Memorial Building (K) , Morro Bay Branch San Luis Obispo City-County Library (L) , Morro Bay Community Center (M) , Morro Bay Fire Department Station 2 (N) , Morro Bay Fire Department Station 1 (O) . Display/hide their locations on the map
Churches in Morro Bay include: (A) , Estero Bay United Methodist Church (B) , First Baptist Church (C) , First Christian Church (D) , Morro Bay Christian Center (E) , Morro Bay Foursquare Church (F) , Seventh Day Adventist Church (G) , Calvary Evangelical Lutheran Church (H) , Church of Christ (I) . Display/hide their locations on the map
Creeks: (A) , Alva Paul Creek (B) . Display/hide their locations on the map
Parks in Morro Bay include: (1) , LIla Keiser Park (2) , Anchor Street Park (3) , Tidelands Park (4) , Dunes Street Park (5) , Atascadero State Beach (6) , Morro Bay State Park (7) . Display/hide their locations on the map
Hotels:
San Luis Obispo County has a predicted average indoor radon screening level between 2 and 4 pCi/L (pico curies per liter) - Moderate Potential Drinking water stations with addresses in Morro Bay and their reported violations in the past:
MONTANA DE ORO STATE PARK (Address: 11 State Park Road Population served: 994, Groundwater):
Past monitoring violations:
One routine major monitoring violation
Average household size: This city:
2.1 peopleCalifornia:
2.9 people
Percentage of family households: This city:
53.6%Whole state:
68.7%
Percentage of households with unmarried partners: This city:
7.5%Whole state:
7.2%
Likely homosexual households (counted as self-reported same-sex unmarried-partner households)
Lesbian couples: 0.5% of all households Gay men: 0.2% of all households
People in group quarters in Morro Bay in 2010:
125 people in nursing facilities/skilled-nursing facilities
20 people in residential treatment centers for adults
16 people in other noninstitutional facilities
People in group quarters in Morro Bay in 2000:
178 people in nursing homes
11 people in other noninstitutional group quarters
8 people in homes for the mentally retarded
Banks with branches in Morro Bay (2011 data):
Heritage Oaks Bank: Morro Bay Branch at 310 Morro Bay Boulevard, branch established on 1989/03/01. Info updated 2012/01/06: Bank assets: $982.9 mil, Deposits: $786.8 mil, headquarters in Paso Robles, CA, positive income , Commercial Lending Specialization, 14 total offices , Holding Company: Heritage Oaks Bancorp
Coast National Bank: Morro Bay Branch at 948 Morro Bay Boulevard, branch established on 1998/06/01. Info updated 2006/11/03: Bank assets: $132.2 mil, Deposits: $124.4 mil, headquarters in San Luis Obispo, CA, negative income in the last year , Commercial Lending Specialization, 5 total offices , Holding Company: Coast Bancorp
Bank of America, National Association: Morro Bay Branch at 390 Morro Bay Boulevard, branch established on 1949/10/17. Info updated 2009/11/18: Bank assets: $1,451,969.3 mil, Deposits: $1,077,176.8 mil, headquarters in Charlotte, NC, positive income , 5782 total offices , Holding Company: Bank Of America Corporation
JPMorgan Chase Bank, National Association: Morro Bay Branch at 595 Morro Bay Bavd, branch established on 1934/11/01. Info updated 2011/11/10: Bank assets: $1,811,678.0 mil, Deposits: $1,190,738.0 mil, headquarters in Columbus, OH, positive income , International Specialization, 5577 total offices , Holding Company: Jpmorgan Chase & Co.
Rabobank, National Association: Morro Bay Branch at 251 Harbor Boulevard, branch established on 1973/10/19. Info updated 2011/01/27: Bank assets: $11,745.0 mil, Deposits: $8,446.0 mil, headquarters in Roseville, CA, positive income , Agricultural Specialization, 124 total offices , Holding Company: Cooperatieve Centrale Raiffeisen-Boerenleenbank B.A., "rabobank Nederland
Wells Fargo Bank, National Association: Albertsons Morro Bay Branch at 730 Quintana Road, branch established on 1997/05/14. Info updated 2011/04/05: Bank assets: $1,161,490.0 mil, Deposits: $905,653.0 mil, headquarters in Sioux Falls, SD, positive income , 6395 total offices , Holding Company: Wells Fargo & Company
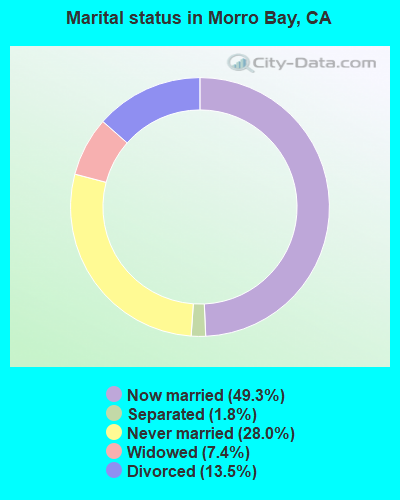
For population 15 years and over in Morro Bay:
Never married: 28.0%Now married: 49.3%Separated: 1.8%Widowed: 7.4%Divorced: 13.5% For population 25 years and over in Morro Bay:
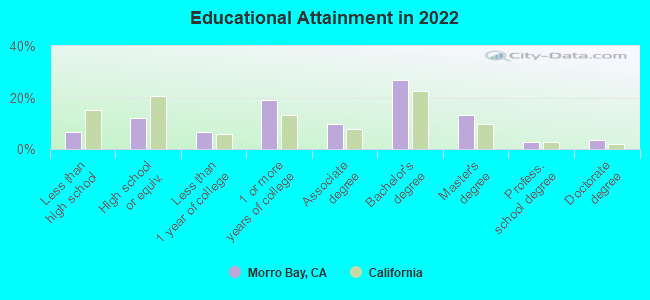
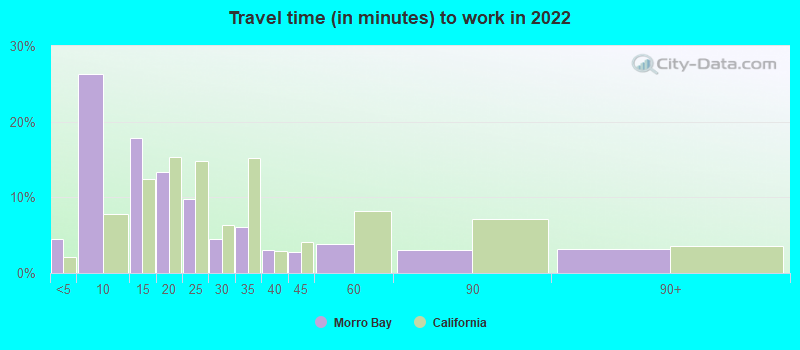
High school or higher: 93.4%Bachelor's degree or higher: 43.2%Graduate or professional degree: 18.8%Unemployed: 3.8%Mean travel time to work (commute): 17.8 minutes
Education Gini index (Inequality in education) Here:
10.4California average:
15.5
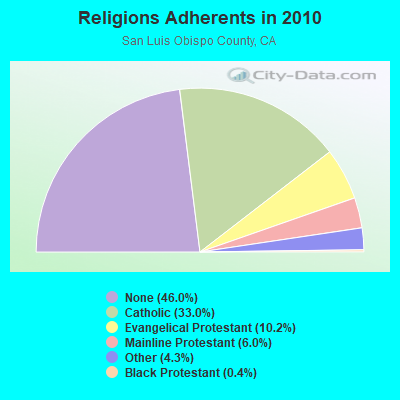
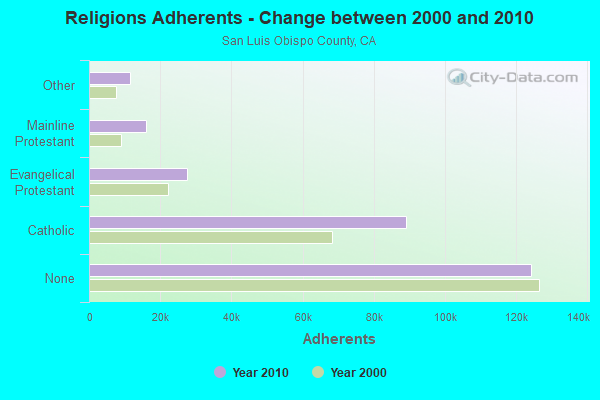
Religion statistics for Morro Bay, CA (based on San Luis Obispo County data)
Religion Adherents Congregations Catholic 89,075 17 Evangelical Protestant 27,483 138 Mainline Protestant 16,099 56 Other 11,530 47 Black Protestant 1,078 3 Orthodox 205 2 None 124,167 -
Source: Clifford Grammich, Kirk Hadaway, Richard Houseal, Dale E.Jones, Alexei Krindatch, Richie Stanley and Richard H.Taylor. 2012. 2010 U.S.Religion Census: Religious Congregations & Membership Study. Association of Statisticians of American Religious Bodies. Jones, Dale E., et al. 2002. Congregations and Membership in the United States 2000. Nashville, TN: Glenmary Research Center. Graphs represent county-level data
Food Environment Statistics: Number of grocery stores : 60This county :
2.29 / 10,000 pop.California :
2.14 / 10,000 pop.
Number of supercenters and club stores : 1San Luis Obispo County :
0.04 / 10,000 pop.California :
0.04 / 10,000 pop.
Number of convenience stores (no gas) : 18This county :
0.69 / 10,000 pop.California :
0.62 / 10,000 pop.
Number of convenience stores (with gas) : 58San Luis Obispo County :
2.22 / 10,000 pop.California :
1.49 / 10,000 pop.
Number of full-service restaurants : 288San Luis Obispo County :
11.00 / 10,000 pop.California :
7.42 / 10,000 pop.
Adult diabetes rate : This county :
6.1%California :
7.3%
Adult obesity rate : San Luis Obispo County :
21.5%California :
21.3%
Low-income preschool obesity rate : Here :
14.5%California :
17.9%
Health and Nutrition: Healthy diet rate : Morro Bay:
51.7%California:
49.4%
Average overall health of teeth and gums : This city:
49.2%California:
48.0%
People feeling badly about themselves : This city:
19.8%State:
20.2%
People not drinking alcohol at all : Here:
10.0%California:
11.2%
Average hours sleeping at night : Overweight people : Here:
34.5%California:
31.5%
General health condition : Morro Bay:
56.8%California:
56.4%
Average condition of hearing : Morro Bay:
77.3%State:
80.9%
More about Health and Nutrition of Morro Bay, CA Residents
Local government employment and payroll (March 2022)
Function
Full-time employees
Monthly full-time payroll
Average yearly full-time wage
Part-time employees
Monthly part-time payroll
Streets and Highways
16 $106,299 $79,724 3 $5,016 Police Protection - Officers
16 $153,531 $115,148 0 $0 Firefighters
14 $155,741 $133,492 3 $6,016 Sewerage
12 $76,555 $76,555 0 $0 Financial Administration
7 $60,202 $103,203 1 $2,193 Housing and Community Development (Local)
6 $46,551 $93,102 4 $10,421 Water Transport and Terminals
6 $50,144 $100,288 3 $9,654 Water Supply
5 $32,721 $78,530 0 $0 Parks and Recreation
4 $24,646 $73,938 60 $87,215 Other Government Administration
3 $35,937 $143,748 5 $2,759 Police - Other
2 $12,032 $72,192 2 $3,173 Transit
1 $5,389 $64,668 0 $0 Fire - Other
1 $10,887 $130,644 0 $0
Totals for Government
93 $770,635 $99,437 81 $126,448
Morro Bay government finances - Expenditure in 2017 (per resident):
Construction - Local Fire Protection: $2,045,000 ($191.19)
Sewerage: $937,000 ($87.60)Parks and Recreation: $609,000 ($56.94)Regular Highways: $278,000 ($25.99)Current Operations - Police Protection: $3,513,000 ($328.44)
Central Staff Services: $3,502,000 ($327.41)Water Utilities: $3,329,000 ($311.24)Sewerage: $2,901,000 ($271.22)Local Fire Protection: $2,856,000 ($267.02)Regular Highways: $2,362,000 ($220.83)Parks and Recreation: $2,045,000 ($191.19)Sea and Inland Port Facilities: $1,919,000 ($179.41)Housing and Community Development: $840,000 ($78.53)Protective Inspection and Regulation - Other: $704,000 ($65.82)Financial Administration: $680,000 ($63.58)Transit Utilities: $587,000 ($54.88)General - Other: $10,000 ($0.93)General - Interest on Debt: $181,000 ($16.92)
Intergovernmental to Local - Other - Water Utilities: $1,641,000 ($153.42)
Other - Police Protection: $252,000 ($23.56)Other - Local Fire Protection: $115,000 ($10.75)Other Capital Outlay - Water Utilities: $77,000 ($7.20)
Police Protection: $56,000 ($5.24)Total Salaries and Wages: $80,000 ($7.48)
Morro Bay government finances - Revenue in 2017 (per resident):
Charges - Sewerage: $5,754,000 ($537.96)
Sea and Inland Port Facilities: $1,892,000 ($176.89)Other: $1,023,000 ($95.64)Parks and Recreation: $468,000 ($43.75)Federal Intergovernmental - Other: $8,000 ($0.75)
Housing and Community Development: $6,000 ($0.56)Local Intergovernmental - Transit Utilities: $250,000 ($23.37)
Miscellaneous - General Revenue - Other: $2,121,000 ($198.30)
Rents: $586,000 ($54.79)Interest Earnings: $190,000 ($17.76)Special Assessments: $188,000 ($17.58)Fines and Forfeits: $9,000 ($0.84)Donations From Private Sources: $7,000 ($0.65)Revenue - Water Utilities: $5,036,000 ($470.83)
Transit Utilities: $85,000 ($7.95)State Intergovernmental - Other: $673,000 ($62.92)
Highways: $218,000 ($20.38)Transit Utilities: $161,000 ($15.05)General Local Government Support: $19,000 ($1.78)Tax - Other Selective Sales: $4,144,000 ($387.43)
Property: $3,917,000 ($366.21)General Sales and Gross Receipts: $2,057,000 ($192.31)Other: $1,077,000 ($100.69)Public Utilities Sales: $512,000 ($47.87)Occupation and Business License - Other: $347,000 ($32.44)Other License: $120,000 ($11.22)Documentary and Stock Transfer: $88,000 ($8.23)
Morro Bay government finances - Debt in 2017 (per resident):
Long Term Debt - Beginning Outstanding - Unspecified Public Purpose: $2,031,000 ($189.88)
Outstanding Unspecified Public Purpose: $1,947,000 ($182.03)Retired Unspecified Public Purpose: $135,000 ($12.62)Issue, Unspecified Public Purpose: $51,000 ($4.77)
Morro Bay government finances - Cash and Securities in 2017 (per resident):
Bond Funds - Cash and Securities: $111,000 ($10.38)
Other Funds - Cash and Securities: $22,296,000 ($2084.52)
6.17% of this county's 2020 resident taxpayers moved to other counties in 2021 ($68,140 average adjusted gross income )
Here:
6.17%California average:
6.14%
0.02% of residents moved to foreign countries ($212 average AGI )San Luis Obispo County:
0.02%California average:
0.02%
Top counties to which taxpayers relocated from this county between 2020 and 2021:
Businesses in Morro Bay, CA
Name Count Name Count
Ace Hardware 1 Motel 6 1 Albertsons 1 RadioShack 1 AutoZone 1 Rite Aid 1 Best Western 3 Rodeway Inn 1 Burger King 1 Starbucks 1 Days Inn 1 Subway 1 Domino's Pizza 1 Taco Bell 1 Econo Lodge 1 Travelodge 1 FedEx 2 U-Haul 1 GNC 1 UPS 1 H&R Block 1 Vans 2 McDonald's 1
Strongest AM radio stations in Morro Bay:
KGDP (660 AM; 50 kW; ORCUTT, CA; Owner: RADIO REPRESENTATIVES, INC.)
KJDJ (1030 AM; 2 kW; SAN LUIS OBISPO, CA; Owner: PADRE SERRA COMMUNICATIONS, INC)
KXTK (1280 AM; 10 kW; ARROYO GRANDE, CA; Owner: PAMPLIN BROADCASTING, INC.)
KLFF (890 AM; 5 kW; ARROYO GRANDE, CA; Owner: JERRY J. COLLINS)
KVEC (920 AM; 1 kW; SAN LUIS OBISPO, CA; Owner: CLEVELAND RADIO LICENSES, LLC)
KERI (1180 AM; 50 kW; WASCO-GREENACRES, CA; Owner: KWSO, INC.)
KMJ (580 AM; 50 kW; FRESNO, CA; Owner: INFINITY RADIO OPERATIONS INC.)
KKJL (1400 AM; 1 kW; SAN LUIS OBISPO, CA; Owner: SAN LUIS OBISPO BROADCASTING, INC)
KWRU (940 AM; 50 kW; FRESNO, CA)
KYNS (1340 AM; 1 kW; SAN LUIS OBISPO, CA; Owner: MAPLETON COMMUNICATIONS, LLC)
KUHL (1440 AM; 5 kW; SANTA MARIA, CA; Owner: MAPLETON COMMUNICATIONS, LLC)
KSPN (710 AM; 50 kW; LOS ANGELES, CA; Owner: KABC-AM RADIO, INC.)
KNBR (680 AM; 50 kW; SAN FRANCISCO, CA; Owner: KNBR LICO, INC.)
Strongest FM radio stations in Morro Bay:
KLMM (94.1 FM; MORRO BAY, CA; Owner: LAZER BROADCASTING CORPORATION)
KSTT-FM (101.3 FM; LOS OSOS-BAYWOOD PAR, CA; Owner: CLEAR CHANNEL BROADCASTING LICENSES, INC.)
KSLY-FM (96.1 FM; SAN LUIS OBISPO, CA; Owner: CLEAR CHANNEL BROADCASTING LICENSES, INC.)
KKAL (99.7 FM; MORRO BAY, CA; Owner: SALISBURY BROADCASTING CORP.)
KZOZ (93.3 FM; SAN LUIS OBISPO, CA; Owner: AMERICAN GENERAL MEDIA-TEXAS, INC.)
KWSR (92.5 FM; PASO ROBLES, CA; Owner: LAGNIAPPE BROADCASTING, INC)
KKJG (98.1 FM; SAN LUIS OBISPO, CA; Owner: AGM SAN LUIS OBISPO, L.P.)
KWWV (106.1 FM; SANTA MARGARITA, CA; Owner: SALISBURY RADIO LLC)
K209CE (89.7 FM; SAN LUIS OBISPO, CA; Owner: FAMILY STATIONS, INC.)
KLRM (97.1 FM; SAN LUIS OBISPO, CA; Owner: GTM SAN LUIS OBISPO)
KIQO (104.5 FM; ATASCADERO, CA; Owner: AMERICAN GENERAL MEDIA OF TEXAS, INC)
KCBX (90.1 FM; SAN LUIS OBISPO, CA; Owner: KCBX, INC.)
KLVH (88.5 FM; SAN LUIS OBISPO, CA; Owner: EDUCATIONAL MEDIA FOUNDATION)
K213CO (90.5 FM; SAN LUIS OBISPO, CA; Owner: PENSACOLA CHRISTIAN COLLEGE, INC.)
KURQ (107.3 FM; GROVER BEACH, CA; Owner: CLEAR CHANNEL BROADCASTING LICENSES, INC.)
KXDZ (100.5 FM; TEMPLETON, CA; Owner: MAPLETON COMMUNICATIONS, LLC)
KLUN (103.1 FM; PASO ROBLES, CA; Owner: LAZER BROADCASTING CORPORATION)
KBDH (91.7 FM; SAN ARDO, CA; Owner: PATAPHYSICAL BROADCASTING FOUNDATION)
K206CC (89.1 FM; LOCKWOOD, CA; Owner: PRUNEDALE EDUC. F'DATION/CENTRAL CA)
KRKC-FM (102.1 FM; KING CITY, CA; Owner: KING CITY COMMUNICATIONS CORPORATION)
TV broadcast stations around Morro Bay:
KSBY (Channel 6; SAN LUIS OBISPO, CA; Owner: NVG-SANTA BARBARA II, LLC)
KPXA-LP (Channel 42; SAN LUIS OBISPO, CA; Owner: CAMINO REAL COMMUNICATIONS LLC)
K28FK (Channel 28; SAN LUIS OBISPO, CA; Owner: ENTRAVISION HOLDINGS, LLC)
KCCE-LP (Channel 50; SAN LUIS OBISPO, CA; Owner: ANET COMMUNICATIONS, INC.)
K07WA (Channel 7; ATASCADERO, CA; Owner: CHARLES R. MEEKER)
K09UF (Channel 9; MORRO BAY, CA; Owner: RAUL AND CONSUELO PALAZUELOS)
K47GD (Channel 47; SAN LUIS OBISPO, CA; Owner: ESTRELLA LICENSE CORPORATION)
K15BD (Channel 15; SAN LUIS OBISPO, CA; Owner: COMMUNITY TV OF SOUTHERN CALIFORNIA)
K22EE (Channel 22; MORRO BAY, CA; Owner: CENTRAL COAST GOOD NEWS, INC.)
KTAS (Channel 33; SAN LUIS OBISPO, CA; Owner: RAUL & CONSUELO PALAZUELOS)
KKFX-CA (Channel 24; SAN LUIS OBISPO, CA; Owner: ACKERLEY MEDIA GROUP, INC.)
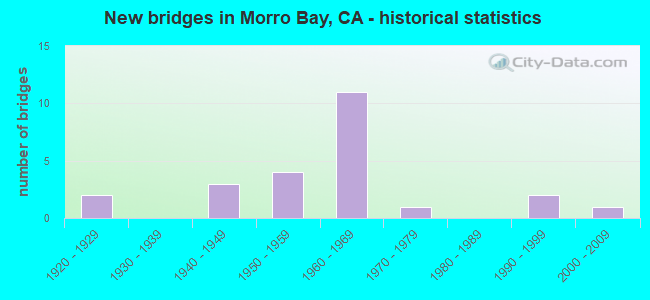
National Bridge Inventory (NBI) Statistics 24 Number of bridges187ft / 57.3m Total length219,344 Total average daily traffic8,317 Total average daily truck traffic
New bridges - historical statistics
2 1920-1929 3 1940-1949 4 1950-1959 11 1960-1969 1 1970-1979 2 1990-1999 1 2000-2009
See full National Bridge Inventory statistics for Morro Bay, CA
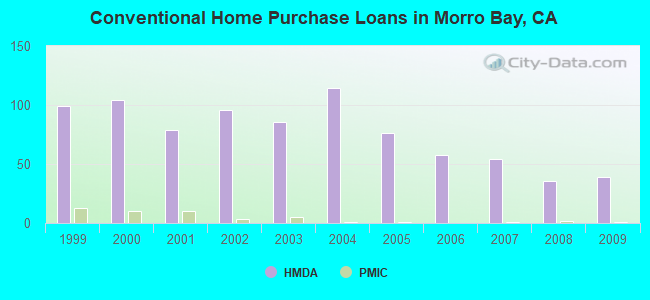
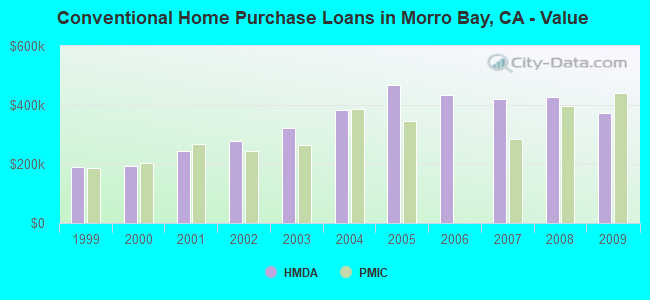
Home Mortgage Disclosure Act Aggregated Statistics For Year 2009(Based on 2 partial tracts) A) FHA, FSA/RHS & VA B) Conventional C) Refinancings D) Home Improvement Loans F) Non-occupant Loans on G) Loans On Manufactured Number Average Value Number Average Value Number Average Value Number Average Value Number Average Value Number Average Value
LOANS ORIGINATED 3 $520,623 39 $371,231 154 $303,967 5 $262,978 65 $338,706 1 $170,190 APPLICATIONS APPROVED, NOT ACCEPTED 1 $248,470 3 $233,957 14 $312,615 0 $0 6 $331,003 1 $33,470 APPLICATIONS DENIED 2 $353,425 5 $389,526 46 $396,115 2 $245,640 18 $399,023 1 $137,120 APPLICATIONS WITHDRAWN 1 $580,320 5 $331,884 26 $348,478 2 $442,905 10 $355,324 1 $166,500 FILES CLOSED FOR INCOMPLETENESS 1 $522,550 1 $325,600 6 $332,892 0 $0 3 $338,597 0 $0
Aggregated Statistics For Year 2008(Based on 2 partial tracts) A) FHA, FSA/RHS & VA B) Conventional C) Refinancings D) Home Improvement Loans F) Non-occupant Loans on G) Loans On Manufactured Number Average Value Number Average Value Number Average Value Number Average Value Number Average Value Number Average Value
LOANS ORIGINATED 0 $0 36 $426,264 68 $315,632 5 $245,776 47 $370,819 0 $0 APPLICATIONS APPROVED, NOT ACCEPTED 0 $0 7 $340,369 14 $328,843 1 $149,010 9 $328,143 1 $165,790 APPLICATIONS DENIED 0 $0 8 $314,452 31 $469,248 3 $401,890 11 $368,352 1 $41,090 APPLICATIONS WITHDRAWN 1 $298,940 4 $415,062 19 $353,085 1 $211,870 7 $423,307 1 $146,010 FILES CLOSED FOR INCOMPLETENESS 0 $0 0 $0 5 $406,846 0 $0 0 $0 0 $0
Aggregated Statistics For Year 2007(Based on 2 partial tracts) B) Conventional C) Refinancings D) Home Improvement Loans F) Non-occupant Loans on G) Loans On Manufactured Number Average Value Number Average Value Number Average Value Number Average Value Number Average Value
LOANS ORIGINATED 54 $419,033 114 $395,679 17 $300,489 77 $403,004 4 $111,180 APPLICATIONS APPROVED, NOT ACCEPTED 11 $446,275 26 $386,689 2 $327,615 9 $445,316 1 $20,490 APPLICATIONS DENIED 12 $356,489 33 $432,690 3 $257,120 12 $406,536 2 $106,365 APPLICATIONS WITHDRAWN 5 $336,312 18 $412,999 2 $293,175 9 $391,153 1 $184,430 FILES CLOSED FOR INCOMPLETENESS 0 $0 8 $347,064 0 $0 2 $393,250 0 $0
Aggregated Statistics For Year 2006(Based on 2 partial tracts) B) Conventional C) Refinancings D) Home Improvement Loans F) Non-occupant Loans on G) Loans On Manufactured Number Average Value Number Average Value Number Average Value Number Average Value Number Average Value
LOANS ORIGINATED 58 $433,706 112 $410,185 16 $277,769 62 $415,044 1 $52,090 APPLICATIONS APPROVED, NOT ACCEPTED 11 $341,619 22 $406,857 2 $263,360 11 $433,382 3 $60,450 APPLICATIONS DENIED 10 $460,061 37 $384,022 3 $358,167 11 $430,792 1 $147,440 APPLICATIONS WITHDRAWN 10 $356,090 26 $443,969 3 $310,627 7 $385,664 1 $34,840 FILES CLOSED FOR INCOMPLETENESS 1 $968,560 7 $394,230 1 $115,700 3 $327,787 0 $0
Aggregated Statistics For Year 2005(Based on 2 partial tracts) B) Conventional C) Refinancings D) Home Improvement Loans E) Loans on Dwellings For 5+ Families F) Non-occupant Loans on G) Loans On Manufactured Number Average Value Number Average Value Number Average Value Number Average Value Number Average Value Number Average Value
LOANS ORIGINATED 76 $467,694 143 $377,364 21 $323,098 1 $1,174,690 76 $435,175 1 $104,350 APPLICATIONS APPROVED, NOT ACCEPTED 7 $361,530 23 $334,273 1 $520,970 0 $0 8 $322,368 0 $0 APPLICATIONS DENIED 11 $531,119 36 $367,959 5 $123,624 0 $0 11 $375,725 1 $101,900 APPLICATIONS WITHDRAWN 11 $324,205 29 $351,736 3 $426,513 0 $0 9 $389,656 1 $76,700 FILES CLOSED FOR INCOMPLETENESS 2 $264,545 14 $376,060 0 $0 0 $0 3 $463,210 0 $0
Aggregated Statistics For Year 2004(Based on 2 partial tracts) B) Conventional C) Refinancings D) Home Improvement Loans E) Loans on Dwellings For 5+ Families F) Non-occupant Loans on G) Loans On Manufactured Number Average Value Number Average Value Number Average Value Number Average Value Number Average Value Number Average Value
LOANS ORIGINATED 114 $383,292 152 $300,615 12 $199,733 1 $411,120 108 $347,226 0 $0 APPLICATIONS APPROVED, NOT ACCEPTED 15 $353,112 20 $283,855 2 $251,110 0 $0 11 $317,050 0 $0 APPLICATIONS DENIED 22 $329,348 30 $336,598 5 $133,978 0 $0 12 $388,489 3 $114,977 APPLICATIONS WITHDRAWN 19 $342,020 42 $324,183 2 $246,500 0 $0 15 $410,511 1 $122,740 FILES CLOSED FOR INCOMPLETENESS 1 $665,510 10 $255,210 0 $0 0 $0 3 $272,120 0 $0
Aggregated Statistics For Year 2003(Based on 2 partial tracts) B) Conventional C) Refinancings D) Home Improvement Loans E) Loans on Dwellings For 5+ Families F) Non-occupant Loans on Number Average Value Number Average Value Number Average Value Number Average Value Number Average Value
LOANS ORIGINATED 86 $323,413 401 $220,285 8 $116,029 1 $256,150 153 $244,968 APPLICATIONS APPROVED, NOT ACCEPTED 7 $310,371 34 $213,567 0 $0 0 $0 14 $241,748 APPLICATIONS DENIED 11 $328,916 48 $262,112 1 $158,900 0 $0 15 $271,893 APPLICATIONS WITHDRAWN 12 $284,666 53 $248,820 2 $38,410 0 $0 13 $248,791 FILES CLOSED FOR INCOMPLETENESS 3 $357,010 12 $226,142 0 $0 0 $0 4 $237,938
Aggregated Statistics For Year 2002(Based on 2 partial tracts) B) Conventional C) Refinancings D) Home Improvement Loans E) Loans on Dwellings For 5+ Families F) Non-occupant Loans on Number Average Value Number Average Value Number Average Value Number Average Value Number Average Value
LOANS ORIGINATED 96 $277,882 276 $216,132 7 $73,480 1 $681,870 120 $238,138 APPLICATIONS APPROVED, NOT ACCEPTED 7 $242,764 32 $236,906 0 $0 0 $0 10 $253,996 APPLICATIONS DENIED 7 $254,449 28 $266,710 3 $46,320 0 $0 9 $286,579 APPLICATIONS WITHDRAWN 7 $206,169 26 $242,568 1 $142,370 1 $496,930 5 $182,234 FILES CLOSED FOR INCOMPLETENESS 3 $204,840 10 $277,830 0 $0 0 $0 2 $308,940
Aggregated Statistics For Year 2001(Based on 2 partial tracts) A) FHA, FSA/RHS & VA B) Conventional C) Refinancings D) Home Improvement Loans E) Loans on Dwellings For 5+ Families F) Non-occupant Loans on Number Average Value Number Average Value Number Average Value Number Average Value Number Average Value Number Average Value
LOANS ORIGINATED 2 $140,100 79 $245,695 206 $204,244 7 $53,524 2 $2,320,975 81 $223,211 APPLICATIONS APPROVED, NOT ACCEPTED 0 $0 7 $260,003 20 $193,280 0 $0 0 $0 5 $239,222 APPLICATIONS DENIED 0 $0 7 $221,877 24 $203,265 3 $94,163 0 $0 4 $203,622 APPLICATIONS WITHDRAWN 0 $0 8 $251,119 30 $178,911 2 $112,100 0 $0 10 $171,152 FILES CLOSED FOR INCOMPLETENESS 0 $0 2 $329,960 8 $235,265 0 $0 0 $0 1 $321,390
Aggregated Statistics For Year 2000(Based on 2 partial tracts) A) FHA, FSA/RHS & VA B) Conventional C) Refinancings D) Home Improvement Loans F) Non-occupant Loans on Number Average Value Number Average Value Number Average Value Number Average Value Number Average Value
LOANS ORIGINATED 3 $203,997 104 $194,888 43 $161,408 7 $49,496 50 $190,302 APPLICATIONS APPROVED, NOT ACCEPTED 0 $0 9 $193,274 7 $143,879 1 $54,800 5 $145,962 APPLICATIONS DENIED 1 $141,270 9 $157,038 17 $162,108 3 $52,060 5 $200,468 APPLICATIONS WITHDRAWN 1 $220,010 5 $187,596 10 $205,588 0 $0 2 $266,470 FILES CLOSED FOR INCOMPLETENESS 0 $0 3 $204,663 1 $116,710 0 $0 1 $342,040
Aggregated Statistics For Year 1999(Based on 2 partial tracts) A) FHA, FSA/RHS & VA B) Conventional C) Refinancings D) Home Improvement Loans E) Loans on Dwellings For 5+ Families F) Non-occupant Loans on Number Average Value Number Average Value Number Average Value Number Average Value Number Average Value Number Average Value
LOANS ORIGINATED 8 $155,728 99 $189,780 84 $151,791 5 $42,962 1 $219,760 53 $170,607 APPLICATIONS APPROVED, NOT ACCEPTED 0 $0 8 $199,384 12 $154,866 0 $0 0 $0 5 $196,104 APPLICATIONS DENIED 0 $0 11 $215,782 20 $133,975 1 $43,940 0 $0 7 $196,847 APPLICATIONS WITHDRAWN 0 $0 8 $197,352 13 $144,538 1 $24,660 0 $0 4 $198,532 FILES CLOSED FOR INCOMPLETENESS 0 $0 2 $287,450 3 $204,587 0 $0 0 $0 1 $201,770
Detailed HMDA statistics for the following Tracts:
0105.00
, 0106.00
Private Mortgage Insurance Companies Aggregated Statistics For Year 2009(Based on 2 partial tracts) A) Conventional B) Refinancings Number Average Value Number Average Value
LOANS ORIGINATED 1 $440,320 1 $220,820 APPLICATIONS APPROVED, NOT ACCEPTED 1 $178,880 0 $0 APPLICATIONS DENIED 0 $0 0 $0 APPLICATIONS WITHDRAWN 1 $133,710 0 $0 FILES CLOSED FOR INCOMPLETENESS 0 $0 0 $0
Aggregated Statistics For Year 2008(Based on 2 partial tracts) A) Conventional B) Refinancings C) Non-occupant Loans on Number Average Value Number Average Value Number Average Value
LOANS ORIGINATED 2 $397,135 0 $0 1 $329,020 APPLICATIONS APPROVED, NOT ACCEPTED 1 $410,450 1 $494,290 0 $0 APPLICATIONS DENIED 0 $0 0 $0 0 $0 APPLICATIONS WITHDRAWN 0 $0 0 $0 0 $0 FILES CLOSED FOR INCOMPLETENESS 0 $0 0 $0 0 $0
Aggregated Statistics For Year 2007(Based on 1 partial tract) A) Conventional B) Refinancings Number Average Value Number Average Value
LOANS ORIGINATED 1 $285,020 1 $518,450 APPLICATIONS APPROVED, NOT ACCEPTED 0 $0 0 $0 APPLICATIONS DENIED 0 $0 0 $0 APPLICATIONS WITHDRAWN 0 $0 0 $0 FILES CLOSED FOR INCOMPLETENESS 0 $0 0 $0
Aggregated Statistics For Year 2006(Based on 2 partial tracts) A) Conventional Number Average Value
LOANS ORIGINATED 0 $0 APPLICATIONS APPROVED, NOT ACCEPTED 1 $276,130 APPLICATIONS DENIED 0 $0 APPLICATIONS WITHDRAWN 0 $0 FILES CLOSED FOR INCOMPLETENESS 0 $0
Aggregated Statistics For Year 2005(Based on 2 partial tracts) A) Conventional B) Refinancings Number Average Value Number Average Value
LOANS ORIGINATED 1 $346,470 1 $59,430 APPLICATIONS APPROVED, NOT ACCEPTED 0 $0 0 $0 APPLICATIONS DENIED 0 $0 0 $0 APPLICATIONS WITHDRAWN 0 $0 0 $0 FILES CLOSED FOR INCOMPLETENESS 0 $0 0 $0
Aggregated Statistics For Year 2004(Based on 2 partial tracts) A) Conventional B) Refinancings C) Non-occupant Loans on Number Average Value Number Average Value Number Average Value
LOANS ORIGINATED 1 $385,440 1 $164,450 1 $212,090 APPLICATIONS APPROVED, NOT ACCEPTED 0 $0 0 $0 0 $0 APPLICATIONS DENIED 0 $0 0 $0 0 $0 APPLICATIONS WITHDRAWN 0 $0 0 $0 0 $0 FILES CLOSED FOR INCOMPLETENESS 0 $0 0 $0 0 $0
Aggregated Statistics For Year 2003(Based on 2 partial tracts) A) Conventional B) Refinancings C) Non-occupant Loans on Number Average Value Number Average Value Number Average Value
LOANS ORIGINATED 5 $264,498 2 $248,820 2 $317,630 APPLICATIONS APPROVED, NOT ACCEPTED 0 $0 1 $363,320 0 $0 APPLICATIONS DENIED 0 $0 0 $0 0 $0 APPLICATIONS WITHDRAWN 0 $0 0 $0 0 $0 FILES CLOSED FOR INCOMPLETENESS 0 $0 0 $0 0 $0
Aggregated Statistics For Year 2002(Based on 2 partial tracts) A) Conventional B) Refinancings C) Non-occupant Loans on Number Average Value Number Average Value Number Average Value
LOANS ORIGINATED 3 $244,667 2 $289,060 1 $272,300 APPLICATIONS APPROVED, NOT ACCEPTED 1 $236,510 0 $0 1 $161,300 APPLICATIONS DENIED 0 $0 0 $0 0 $0 APPLICATIONS WITHDRAWN 0 $0 0 $0 0 $0 FILES CLOSED FOR INCOMPLETENESS 0 $0 0 $0 0 $0
Aggregated Statistics For Year 2001(Based on 2 partial tracts) A) Conventional B) Refinancings C) Non-occupant Loans on Number Average Value Number Average Value Number Average Value
LOANS ORIGINATED 10 $266,909 1 $148,590 3 $213,670 APPLICATIONS APPROVED, NOT ACCEPTED 1 $252,120 2 $202,880 1 $313,230 APPLICATIONS DENIED 1 $350,270 0 $0 1 $104,000 APPLICATIONS WITHDRAWN 0 $0 0 $0 0 $0 FILES CLOSED FOR INCOMPLETENESS 0 $0 0 $0 0 $0
Aggregated Statistics For Year 2000(Based on 2 partial tracts) A) Conventional B) Refinancings C) Non-occupant Loans on Number Average Value Number Average Value Number Average Value
LOANS ORIGINATED 10 $203,140 1 $78,380 4 $181,170 APPLICATIONS APPROVED, NOT ACCEPTED 1 $284,560 1 $132,170 0 $0 APPLICATIONS DENIED 1 $164,410 0 $0 0 $0 APPLICATIONS WITHDRAWN 0 $0 0 $0 0 $0 FILES CLOSED FOR INCOMPLETENESS 0 $0 0 $0 0 $0
Aggregated Statistics For Year 1999(Based on 2 partial tracts) A) Conventional B) Refinancings C) Non-occupant Loans on Number Average Value Number Average Value Number Average Value
LOANS ORIGINATED 13 $187,006 2 $137,825 2 $196,520 APPLICATIONS APPROVED, NOT ACCEPTED 1 $212,620 1 $196,960 0 $0 APPLICATIONS DENIED 1 $168,320 0 $0 0 $0 APPLICATIONS WITHDRAWN 0 $0 0 $0 0 $0 FILES CLOSED FOR INCOMPLETENESS 0 $0 0 $0 0 $0
Detailed PMIC statistics for the following Tracts:
0105.00
, 0106.00 Fire-safe hotels and motels in Morro Bay, California:
Embarcadero Inn, 456 Embarcadero, Morro Bay, California 93442 Phone: (805) 772-2700
Blue Sail Inn, 851 Market Ave, Morro Bay, California 93442 Phone: (805) 772-7132, Fax: (805) 772-8406
El Ranch Best Western, 2460 Main St, Morro Bay, California 93442 Phone: (805) 772-2212
Comfort Inn Downtown, 590 Morro Ave, Morro bay, California 93442 Phone: (805) 772-4483
All 4 fire-safe hotels and motels in Morro Bay, California
Most common first names in Morro Bay, CA among deceased individuals Name Count Lived (average)
John 143 76.5 years William 121 78.1 years Mary 97 80.7 years Robert 85 73.8 years James 78 74.8 years George 69 77.6 years Charles 59 78.6 years Margaret 51 78.3 years Helen 49 82.9 years Dorothy 43 78.4 years
Most common last names in Morro Bay, CA among deceased individuals Last name Count Lived (average)
Smith 51 77.3 years Williams 35 76.5 years Johnson 35 80.3 years Brown 28 73.8 years Jones 23 81.3 years Roberts 19 75.0 years White 18 77.4 years Miller 16 74.7 years Campbell 16 80.7 years Wilson 16 75.8 years
Morro Bay compared to California state average:
Unemployed percentage significantly below state average. Black race population percentage significantly below state average. Hispanic race population percentage below state average. Median age significantly above state average. Foreign-born population percentage significantly below state average. Percentage of population with a bachelor's degree or higher above state average.
#53 on the list of "Top 101 cities with the most users submitting photos to our site per 10,000 residents (population 5,000+)"
#60 on the list of "Top 100 cities with highest ratio of median house value to median household income (pop. 5,000+)"
#4 on the list of "Top 101 counties with the lowest Sulfur Oxides Annual air pollution readings in 2012 (µg/m3 )"
#39 on the list of "Top 101 counties with highest percentage of residents voting for 3rd party candidates in the 2012 Presidential Election (pop. 50,000+)"
#50 on the list of "Top 101 counties with the lowest number of births per 1000 residents 2007-2013"
#60 on the list of "Top 101 counties with the lowest Particulate Matter (PM2.5 ) Annual air pollution readings in 2012 (µg/m3 )"
#74 on the list of "Top 101 counties with the largest increase in the number of births per 1000 residents 2000-2006 to 2007-2013 (pop 50,000+)"
Top Patent Applicants
Randall M. Lee (5)
Samuel J. Falcone (3)
Ming L. Sartee (3)
Peter B. Sanford (3)
Jon Jason Linker (2)
Michael L. Baird (2)
Brant W. Berger (2)
Richard P. Watts (2)
Jaywant Philip Parmar (2)
Robert W. Haynes (2)
Total of 41 patent applications in 2008-2024.
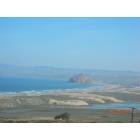
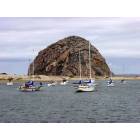
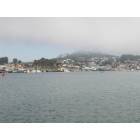
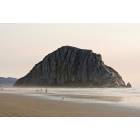
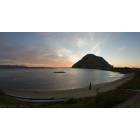
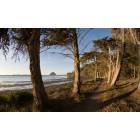
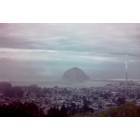
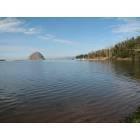

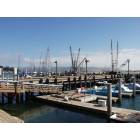
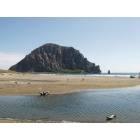
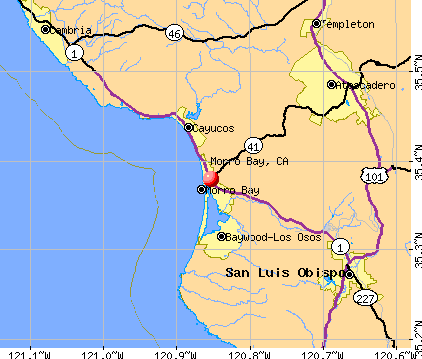


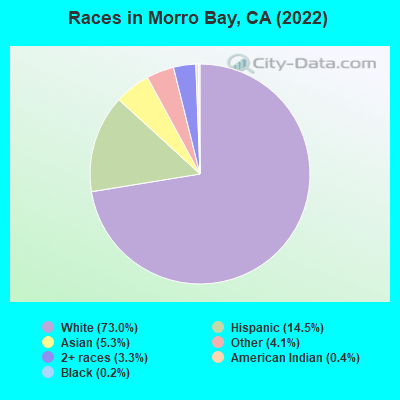
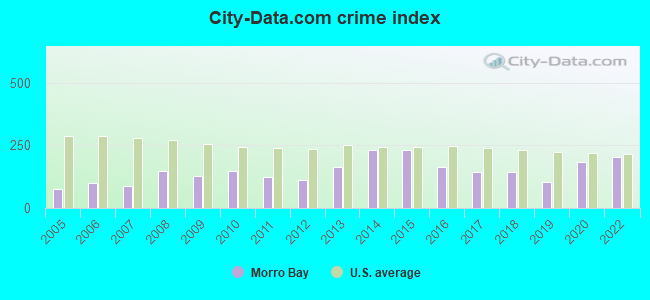
 Recent articles from our blog. Our writers, many of them Ph.D. graduates or candidates, create easy-to-read articles on a wide variety of topics.

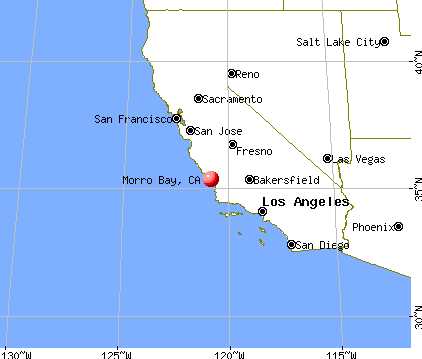
 (37.9 miles