Oakdale, California Submit your own pictures of this city and show them to the world
OSM Map
General Map
Google Map
MSN Map
OSM Map
General Map
Google Map
MSN Map
OSM Map
General Map
Google Map
MSN Map
OSM Map
General Map
Google Map
MSN Map
Please wait while loading the map...
Population in 2022: 23,176 (100% urban, 0% rural). Population change since 2000: +49.5%Males: 11,543 Females: 11,633
March 2022 cost of living index in Oakdale: 98.2 (near average, U.S. average is 100) Percentage of residents living in poverty in 2022: 13.0%for White Non-Hispanic residents , 66.3% for Black residents , 16.5% for Hispanic or Latino residents , 15.3% for American Indian residents , 11.1% for other race residents , 14.4% for two or more races residents )
Profiles of local businesses
Business Search - 14 Million verified businesses
Data:
Median household income ($)
Median household income (% change since 2000)
Household income diversity
Ratio of average income to average house value (%)
Ratio of average income to average rent
Median household income ($) - White
Median household income ($) - Black or African American
Median household income ($) - Asian
Median household income ($) - Hispanic or Latino
Median household income ($) - American Indian and Alaska Native
Median household income ($) - Multirace
Median household income ($) - Other Race
Median household income for houses/condos with a mortgage ($)
Median household income for apartments without a mortgage ($)
Races - White alone (%)
Races - White alone (% change since 2000)
Races - Black alone (%)
Races - Black alone (% change since 2000)
Races - American Indian alone (%)
Races - American Indian alone (% change since 2000)
Races - Asian alone (%)
Races - Asian alone (% change since 2000)
Races - Hispanic (%)
Races - Hispanic (% change since 2000)
Races - Native Hawaiian and Other Pacific Islander alone (%)
Races - Native Hawaiian and Other Pacific Islander alone (% change since 2000)
Races - Two or more races (%)
Races - Two or more races (% change since 2000)
Races - Other race alone (%)
Races - Other race alone (% change since 2000)
Racial diversity
Unemployment (%)
Unemployment (% change since 2000)
Unemployment (%) - White
Unemployment (%) - Black or African American
Unemployment (%) - Asian
Unemployment (%) - Hispanic or Latino
Unemployment (%) - American Indian and Alaska Native
Unemployment (%) - Multirace
Unemployment (%) - Other Race
Population density (people per square mile)
Population - Males (%)
Population - Females (%)
Population - Males (%) - White
Population - Males (%) - Black or African American
Population - Males (%) - Asian
Population - Males (%) - Hispanic or Latino
Population - Males (%) - American Indian and Alaska Native
Population - Males (%) - Multirace
Population - Males (%) - Other Race
Population - Females (%) - White
Population - Females (%) - Black or African American
Population - Females (%) - Asian
Population - Females (%) - Hispanic or Latino
Population - Females (%) - American Indian and Alaska Native
Population - Females (%) - Multirace
Population - Females (%) - Other Race
Coronavirus confirmed cases (Apr 27, 2024)
Deaths caused by coronavirus (Apr 27, 2024)
Coronavirus confirmed cases (per 100k population) (Apr 27, 2024)
Deaths caused by coronavirus (per 100k population) (Apr 27, 2024)
Daily increase in number of cases (Apr 27, 2024)
Weekly increase in number of cases (Apr 27, 2024)
Cases doubled (in days) (Apr 27, 2024)
Hospitalized patients (Apr 18, 2022)
Negative test results (Apr 18, 2022)
Total test results (Apr 18, 2022)
COVID Vaccine doses distributed (per 100k population) (Sep 19, 2023)
COVID Vaccine doses administered (per 100k population) (Sep 19, 2023)
COVID Vaccine doses distributed (Sep 19, 2023)
COVID Vaccine doses administered (Sep 19, 2023)
Likely homosexual households (%)
Likely homosexual households (% change since 2000)
Likely homosexual households - Lesbian couples (%)
Likely homosexual households - Lesbian couples (% change since 2000)
Likely homosexual households - Gay men (%)
Likely homosexual households - Gay men (% change since 2000)
Cost of living index
Median gross rent ($)
Median contract rent ($)
Median monthly housing costs ($)
Median house or condo value ($)
Median house or condo value ($ change since 2000)
Mean house or condo value by units in structure - 1, detached ($)
Mean house or condo value by units in structure - 1, attached ($)
Mean house or condo value by units in structure - 2 ($)
Mean house or condo value by units in structure by units in structure - 3 or 4 ($)
Mean house or condo value by units in structure - 5 or more ($)
Mean house or condo value by units in structure - Boat, RV, van, etc. ($)
Mean house or condo value by units in structure - Mobile home ($)
Median house or condo value ($) - White
Median house or condo value ($) - Black or African American
Median house or condo value ($) - Asian
Median house or condo value ($) - Hispanic or Latino
Median house or condo value ($) - American Indian and Alaska Native
Median house or condo value ($) - Multirace
Median house or condo value ($) - Other Race
Median resident age
Resident age diversity
Median resident age - Males
Median resident age - Females
Median resident age - White
Median resident age - Black or African American
Median resident age - Asian
Median resident age - Hispanic or Latino
Median resident age - American Indian and Alaska Native
Median resident age - Multirace
Median resident age - Other Race
Median resident age - Males - White
Median resident age - Males - Black or African American
Median resident age - Males - Asian
Median resident age - Males - Hispanic or Latino
Median resident age - Males - American Indian and Alaska Native
Median resident age - Males - Multirace
Median resident age - Males - Other Race
Median resident age - Females - White
Median resident age - Females - Black or African American
Median resident age - Females - Asian
Median resident age - Females - Hispanic or Latino
Median resident age - Females - American Indian and Alaska Native
Median resident age - Females - Multirace
Median resident age - Females - Other Race
Commute - mean travel time to work (minutes)
Travel time to work - Less than 5 minutes (%)
Travel time to work - Less than 5 minutes (% change since 2000)
Travel time to work - 5 to 9 minutes (%)
Travel time to work - 5 to 9 minutes (% change since 2000)
Travel time to work - 10 to 19 minutes (%)
Travel time to work - 10 to 19 minutes (% change since 2000)
Travel time to work - 20 to 29 minutes (%)
Travel time to work - 20 to 29 minutes (% change since 2000)
Travel time to work - 30 to 39 minutes (%)
Travel time to work - 30 to 39 minutes (% change since 2000)
Travel time to work - 40 to 59 minutes (%)
Travel time to work - 40 to 59 minutes (% change since 2000)
Travel time to work - 60 to 89 minutes (%)
Travel time to work - 60 to 89 minutes (% change since 2000)
Travel time to work - 90 or more minutes (%)
Travel time to work - 90 or more minutes (% change since 2000)
Marital status - Never married (%)
Marital status - Now married (%)
Marital status - Separated (%)
Marital status - Widowed (%)
Marital status - Divorced (%)
Median family income ($)
Median family income (% change since 2000)
Median non-family income ($)
Median non-family income (% change since 2000)
Median per capita income ($)
Median per capita income (% change since 2000)
Median family income ($) - White
Median family income ($) - Black or African American
Median family income ($) - Asian
Median family income ($) - Hispanic or Latino
Median family income ($) - American Indian and Alaska Native
Median family income ($) - Multirace
Median family income ($) - Other Race
Median year house/condo built
Median year apartment built
Year house built - Built 2005 or later (%)
Year house built - Built 2000 to 2004 (%)
Year house built - Built 1990 to 1999 (%)
Year house built - Built 1980 to 1989 (%)
Year house built - Built 1970 to 1979 (%)
Year house built - Built 1960 to 1969 (%)
Year house built - Built 1950 to 1959 (%)
Year house built - Built 1940 to 1949 (%)
Year house built - Built 1939 or earlier (%)
Average household size
Household density (households per square mile)
Average household size - White
Average household size - Black or African American
Average household size - Asian
Average household size - Hispanic or Latino
Average household size - American Indian and Alaska Native
Average household size - Multirace
Average household size - Other Race
Occupied housing units (%)
Vacant housing units (%)
Owner occupied housing units (%)
Renter occupied housing units (%)
Vacancy status - For rent (%)
Vacancy status - For sale only (%)
Vacancy status - Rented or sold, not occupied (%)
Vacancy status - For seasonal, recreational, or occasional use (%)
Vacancy status - For migrant workers (%)
Vacancy status - Other vacant (%)
Residents with income below the poverty level (%)
Residents with income below 50% of the poverty level (%)
Children below poverty level (%)
Poor families by family type - Married-couple family (%)
Poor families by family type - Male, no wife present (%)
Poor families by family type - Female, no husband present (%)
Poverty status for native-born residents (%)
Poverty status for foreign-born residents (%)
Poverty among high school graduates not in families (%)
Poverty among people who did not graduate high school not in families (%)
Residents with income below the poverty level (%) - White
Residents with income below the poverty level (%) - Black or African American
Residents with income below the poverty level (%) - Asian
Residents with income below the poverty level (%) - Hispanic or Latino
Residents with income below the poverty level (%) - American Indian and Alaska Native
Residents with income below the poverty level (%) - Multirace
Residents with income below the poverty level (%) - Other Race
Air pollution - Air Quality Index (AQI)
Air pollution - CO
Air pollution - NO2
Air pollution - SO2
Air pollution - Ozone
Air pollution - PM10
Air pollution - PM25
Air pollution - Pb
Crime - Murders per 100,000 population
Crime - Rapes per 100,000 population
Crime - Robberies per 100,000 population
Crime - Assaults per 100,000 population
Crime - Burglaries per 100,000 population
Crime - Thefts per 100,000 population
Crime - Auto thefts per 100,000 population
Crime - Arson per 100,000 population
Crime - City-data.com crime index
Crime - Violent crime index
Crime - Property crime index
Crime - Murders per 100,000 population (5 year average)
Crime - Rapes per 100,000 population (5 year average)
Crime - Robberies per 100,000 population (5 year average)
Crime - Assaults per 100,000 population (5 year average)
Crime - Burglaries per 100,000 population (5 year average)
Crime - Thefts per 100,000 population (5 year average)
Crime - Auto thefts per 100,000 population (5 year average)
Crime - Arson per 100,000 population (5 year average)
Crime - City-data.com crime index (5 year average)
Crime - Violent crime index (5 year average)
Crime - Property crime index (5 year average)
1996 Presidential Elections Results (%) - Democratic Party (Clinton)
1996 Presidential Elections Results (%) - Republican Party (Dole)
1996 Presidential Elections Results (%) - Other
2000 Presidential Elections Results (%) - Democratic Party (Gore)
2000 Presidential Elections Results (%) - Republican Party (Bush)
2000 Presidential Elections Results (%) - Other
2004 Presidential Elections Results (%) - Democratic Party (Kerry)
2004 Presidential Elections Results (%) - Republican Party (Bush)
2004 Presidential Elections Results (%) - Other
2008 Presidential Elections Results (%) - Democratic Party (Obama)
2008 Presidential Elections Results (%) - Republican Party (McCain)
2008 Presidential Elections Results (%) - Other
2012 Presidential Elections Results (%) - Democratic Party (Obama)
2012 Presidential Elections Results (%) - Republican Party (Romney)
2012 Presidential Elections Results (%) - Other
2016 Presidential Elections Results (%) - Democratic Party (Clinton)
2016 Presidential Elections Results (%) - Republican Party (Trump)
2016 Presidential Elections Results (%) - Other
2020 Presidential Elections Results (%) - Democratic Party (Biden)
2020 Presidential Elections Results (%) - Republican Party (Trump)
2020 Presidential Elections Results (%) - Other
Ancestries Reported - Arab (%)
Ancestries Reported - Czech (%)
Ancestries Reported - Danish (%)
Ancestries Reported - Dutch (%)
Ancestries Reported - English (%)
Ancestries Reported - French (%)
Ancestries Reported - French Canadian (%)
Ancestries Reported - German (%)
Ancestries Reported - Greek (%)
Ancestries Reported - Hungarian (%)
Ancestries Reported - Irish (%)
Ancestries Reported - Italian (%)
Ancestries Reported - Lithuanian (%)
Ancestries Reported - Norwegian (%)
Ancestries Reported - Polish (%)
Ancestries Reported - Portuguese (%)
Ancestries Reported - Russian (%)
Ancestries Reported - Scotch-Irish (%)
Ancestries Reported - Scottish (%)
Ancestries Reported - Slovak (%)
Ancestries Reported - Subsaharan African (%)
Ancestries Reported - Swedish (%)
Ancestries Reported - Swiss (%)
Ancestries Reported - Ukrainian (%)
Ancestries Reported - United States (%)
Ancestries Reported - Welsh (%)
Ancestries Reported - West Indian (%)
Ancestries Reported - Other (%)
Educational Attainment - No schooling completed (%)
Educational Attainment - Less than high school (%)
Educational Attainment - High school or equivalent (%)
Educational Attainment - Less than 1 year of college (%)
Educational Attainment - 1 or more years of college (%)
Educational Attainment - Associate degree (%)
Educational Attainment - Bachelor's degree (%)
Educational Attainment - Master's degree (%)
Educational Attainment - Professional school degree (%)
Educational Attainment - Doctorate degree (%)
School Enrollment - Nursery, preschool (%)
School Enrollment - Kindergarten (%)
School Enrollment - Grade 1 to 4 (%)
School Enrollment - Grade 5 to 8 (%)
School Enrollment - Grade 9 to 12 (%)
School Enrollment - College undergrad (%)
School Enrollment - Graduate or professional (%)
School Enrollment - Not enrolled in school (%)
School enrollment - Public schools (%)
School enrollment - Private schools (%)
School enrollment - Not enrolled (%)
Median number of rooms in houses and condos
Median number of rooms in apartments
Housing units lacking complete plumbing facilities (%)
Housing units lacking complete kitchen facilities (%)
Density of houses
Urban houses (%)
Rural houses (%)
Households with people 60 years and over (%)
Households with people 65 years and over (%)
Households with people 75 years and over (%)
Households with one or more nonrelatives (%)
Households with no nonrelatives (%)
Population in households (%)
Family households (%)
Nonfamily households (%)
Population in families (%)
Family households with own children (%)
Median number of bedrooms in owner occupied houses
Mean number of bedrooms in owner occupied houses
Median number of bedrooms in renter occupied houses
Mean number of bedrooms in renter occupied houses
Median number of vehichles in owner occupied houses
Mean number of vehichles in owner occupied houses
Median number of vehichles in renter occupied houses
Mean number of vehichles in renter occupied houses
Mortgage status - with mortgage (%)
Mortgage status - with second mortgage (%)
Mortgage status - with home equity loan (%)
Mortgage status - with both second mortgage and home equity loan (%)
Mortgage status - without a mortgage (%)
Average family size
Average family size - White
Average family size - Black or African American
Average family size - Asian
Average family size - Hispanic or Latino
Average family size - American Indian and Alaska Native
Average family size - Multirace
Average family size - Other Race
Geographical mobility - Same house 1 year ago (%)
Geographical mobility - Moved within same county (%)
Geographical mobility - Moved from different county within same state (%)
Geographical mobility - Moved from different state (%)
Geographical mobility - Moved from abroad (%)
Place of birth - Born in state of residence (%)
Place of birth - Born in other state (%)
Place of birth - Native, outside of US (%)
Place of birth - Foreign born (%)
Housing units in structures - 1, detached (%)
Housing units in structures - 1, attached (%)
Housing units in structures - 2 (%)
Housing units in structures - 3 or 4 (%)
Housing units in structures - 5 to 9 (%)
Housing units in structures - 10 to 19 (%)
Housing units in structures - 20 to 49 (%)
Housing units in structures - 50 or more (%)
Housing units in structures - Mobile home (%)
Housing units in structures - Boat, RV, van, etc. (%)
House/condo owner moved in on average (years ago)
Renter moved in on average (years ago)
Year householder moved into unit - Moved in 1999 to March 2000 (%)
Year householder moved into unit - Moved in 1995 to 1998 (%)
Year householder moved into unit - Moved in 1990 to 1994 (%)
Year householder moved into unit - Moved in 1980 to 1989 (%)
Year householder moved into unit - Moved in 1970 to 1979 (%)
Year householder moved into unit - Moved in 1969 or earlier (%)
Means of transportation to work - Drove car alone (%)
Means of transportation to work - Carpooled (%)
Means of transportation to work - Public transportation (%)
Means of transportation to work - Bus or trolley bus (%)
Means of transportation to work - Streetcar or trolley car (%)
Means of transportation to work - Subway or elevated (%)
Means of transportation to work - Railroad (%)
Means of transportation to work - Ferryboat (%)
Means of transportation to work - Taxicab (%)
Means of transportation to work - Motorcycle (%)
Means of transportation to work - Bicycle (%)
Means of transportation to work - Walked (%)
Means of transportation to work - Other means (%)
Working at home (%)
Industry diversity
Most Common Industries - Agriculture, forestry, fishing and hunting, and mining (%)
Most Common Industries - Agriculture, forestry, fishing and hunting (%)
Most Common Industries - Mining, quarrying, and oil and gas extraction (%)
Most Common Industries - Construction (%)
Most Common Industries - Manufacturing (%)
Most Common Industries - Wholesale trade (%)
Most Common Industries - Retail trade (%)
Most Common Industries - Transportation and warehousing, and utilities (%)
Most Common Industries - Transportation and warehousing (%)
Most Common Industries - Utilities (%)
Most Common Industries - Information (%)
Most Common Industries - Finance and insurance, and real estate and rental and leasing (%)
Most Common Industries - Finance and insurance (%)
Most Common Industries - Real estate and rental and leasing (%)
Most Common Industries - Professional, scientific, and management, and administrative and waste management services (%)
Most Common Industries - Professional, scientific, and technical services (%)
Most Common Industries - Management of companies and enterprises (%)
Most Common Industries - Administrative and support and waste management services (%)
Most Common Industries - Educational services, and health care and social assistance (%)
Most Common Industries - Educational services (%)
Most Common Industries - Health care and social assistance (%)
Most Common Industries - Arts, entertainment, and recreation, and accommodation and food services (%)
Most Common Industries - Arts, entertainment, and recreation (%)
Most Common Industries - Accommodation and food services (%)
Most Common Industries - Other services, except public administration (%)
Most Common Industries - Public administration (%)
Occupation diversity
Most Common Occupations - Management, business, science, and arts occupations (%)
Most Common Occupations - Management, business, and financial occupations (%)
Most Common Occupations - Management occupations (%)
Most Common Occupations - Business and financial operations occupations (%)
Most Common Occupations - Computer, engineering, and science occupations (%)
Most Common Occupations - Computer and mathematical occupations (%)
Most Common Occupations - Architecture and engineering occupations (%)
Most Common Occupations - Life, physical, and social science occupations (%)
Most Common Occupations - Education, legal, community service, arts, and media occupations (%)
Most Common Occupations - Community and social service occupations (%)
Most Common Occupations - Legal occupations (%)
Most Common Occupations - Education, training, and library occupations (%)
Most Common Occupations - Arts, design, entertainment, sports, and media occupations (%)
Most Common Occupations - Healthcare practitioners and technical occupations (%)
Most Common Occupations - Health diagnosing and treating practitioners and other technical occupations (%)
Most Common Occupations - Health technologists and technicians (%)
Most Common Occupations - Service occupations (%)
Most Common Occupations - Healthcare support occupations (%)
Most Common Occupations - Protective service occupations (%)
Most Common Occupations - Fire fighting and prevention, and other protective service workers including supervisors (%)
Most Common Occupations - Law enforcement workers including supervisors (%)
Most Common Occupations - Food preparation and serving related occupations (%)
Most Common Occupations - Building and grounds cleaning and maintenance occupations (%)
Most Common Occupations - Personal care and service occupations (%)
Most Common Occupations - Sales and office occupations (%)
Most Common Occupations - Sales and related occupations (%)
Most Common Occupations - Office and administrative support occupations (%)
Most Common Occupations - Natural resources, construction, and maintenance occupations (%)
Most Common Occupations - Farming, fishing, and forestry occupations (%)
Most Common Occupations - Construction and extraction occupations (%)
Most Common Occupations - Installation, maintenance, and repair occupations (%)
Most Common Occupations - Production, transportation, and material moving occupations (%)
Most Common Occupations - Production occupations (%)
Most Common Occupations - Transportation occupations (%)
Most Common Occupations - Material moving occupations (%)
People in Group quarters - Institutionalized population (%)
People in Group quarters - Correctional institutions (%)
People in Group quarters - Federal prisons and detention centers (%)
People in Group quarters - Halfway houses (%)
People in Group quarters - Local jails and other confinement facilities (including police lockups) (%)
People in Group quarters - Military disciplinary barracks (%)
People in Group quarters - State prisons (%)
People in Group quarters - Other types of correctional institutions (%)
People in Group quarters - Nursing homes (%)
People in Group quarters - Hospitals/wards, hospices, and schools for the handicapped (%)
People in Group quarters - Hospitals/wards and hospices for chronically ill (%)
People in Group quarters - Hospices or homes for chronically ill (%)
People in Group quarters - Military hospitals or wards for chronically ill (%)
People in Group quarters - Other hospitals or wards for chronically ill (%)
People in Group quarters - Hospitals or wards for drug/alcohol abuse (%)
People in Group quarters - Mental (Psychiatric) hospitals or wards (%)
People in Group quarters - Schools, hospitals, or wards for the mentally retarded (%)
People in Group quarters - Schools, hospitals, or wards for the physically handicapped (%)
People in Group quarters - Institutions for the deaf (%)
People in Group quarters - Institutions for the blind (%)
People in Group quarters - Orthopedic wards and institutions for the physically handicapped (%)
People in Group quarters - Wards in general hospitals for patients who have no usual home elsewhere (%)
People in Group quarters - Wards in military hospitals for patients who have no usual home elsewhere (%)
People in Group quarters - Juvenile institutions (%)
People in Group quarters - Long-term care (%)
People in Group quarters - Homes for abused, dependent, and neglected children (%)
People in Group quarters - Residential treatment centers for emotionally disturbed children (%)
People in Group quarters - Training schools for juvenile delinquents (%)
People in Group quarters - Short-term care, detention or diagnostic centers for delinquent children (%)
People in Group quarters - Type of juvenile institution unknown (%)
People in Group quarters - Noninstitutionalized population (%)
People in Group quarters - College dormitories (includes college quarters off campus) (%)
People in Group quarters - Military quarters (%)
People in Group quarters - On base (%)
People in Group quarters - Barracks, unaccompanied personnel housing (UPH), (Enlisted/Officer), ;and similar group living quarters for military personnel (%)
People in Group quarters - Transient quarters for temporary residents (%)
People in Group quarters - Military ships (%)
People in Group quarters - Group homes (%)
People in Group quarters - Homes or halfway houses for drug/alcohol abuse (%)
People in Group quarters - Homes for the mentally ill (%)
People in Group quarters - Homes for the mentally retarded (%)
People in Group quarters - Homes for the physically handicapped (%)
People in Group quarters - Other group homes (%)
People in Group quarters - Religious group quarters (%)
People in Group quarters - Dormitories (%)
People in Group quarters - Agriculture workers' dormitories on farms (%)
People in Group quarters - Job Corps and vocational training facilities (%)
People in Group quarters - Other workers' dormitories (%)
People in Group quarters - Crews of maritime vessels (%)
People in Group quarters - Other nonhousehold living situations (%)
People in Group quarters - Other noninstitutional group quarters (%)
Residents speaking English at home (%)
Residents speaking English at home - Born in the United States (%)
Residents speaking English at home - Native, born elsewhere (%)
Residents speaking English at home - Foreign born (%)
Residents speaking Spanish at home (%)
Residents speaking Spanish at home - Born in the United States (%)
Residents speaking Spanish at home - Native, born elsewhere (%)
Residents speaking Spanish at home - Foreign born (%)
Residents speaking other language at home (%)
Residents speaking other language at home - Born in the United States (%)
Residents speaking other language at home - Native, born elsewhere (%)
Residents speaking other language at home - Foreign born (%)
Class of Workers - Employee of private company (%)
Class of Workers - Self-employed in own incorporated business (%)
Class of Workers - Private not-for-profit wage and salary workers (%)
Class of Workers - Local government workers (%)
Class of Workers - State government workers (%)
Class of Workers - Federal government workers (%)
Class of Workers - Self-employed workers in own not incorporated business and Unpaid family workers (%)
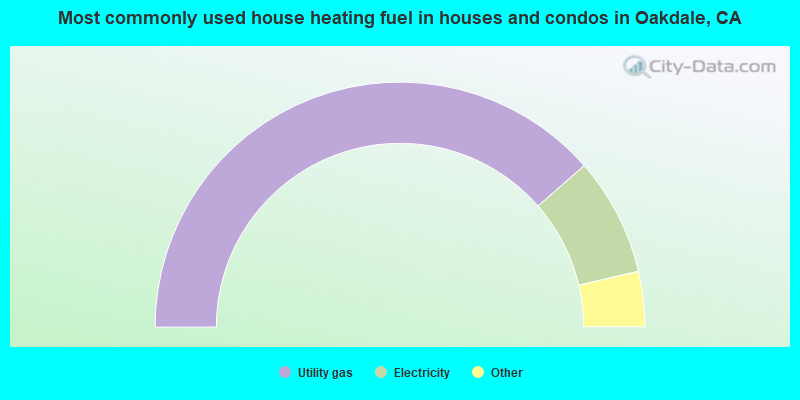
House heating fuel used in houses and condos - Utility gas (%)
House heating fuel used in houses and condos - Bottled, tank, or LP gas (%)
House heating fuel used in houses and condos - Electricity (%)
House heating fuel used in houses and condos - Fuel oil, kerosene, etc. (%)
House heating fuel used in houses and condos - Coal or coke (%)
House heating fuel used in houses and condos - Wood (%)
House heating fuel used in houses and condos - Solar energy (%)
House heating fuel used in houses and condos - Other fuel (%)
House heating fuel used in houses and condos - No fuel used (%)
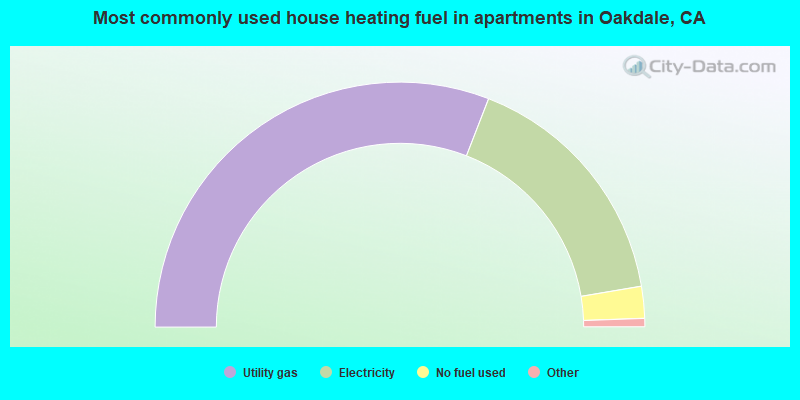
House heating fuel used in apartments - Utility gas (%)
House heating fuel used in apartments - Bottled, tank, or LP gas (%)
House heating fuel used in apartments - Electricity (%)
House heating fuel used in apartments - Fuel oil, kerosene, etc. (%)
House heating fuel used in apartments - Coal or coke (%)
House heating fuel used in apartments - Wood (%)
House heating fuel used in apartments - Solar energy (%)
House heating fuel used in apartments - Other fuel (%)
House heating fuel used in apartments - No fuel used (%)
Armed forces status - In Armed Forces (%)
Armed forces status - Civilian (%)
Armed forces status - Civilian - Veteran (%)
Armed forces status - Civilian - Nonveteran (%)
Fatal accidents locations in years 2005-2021
Fatal accidents locations in 2005
Fatal accidents locations in 2006
Fatal accidents locations in 2007
Fatal accidents locations in 2008
Fatal accidents locations in 2009
Fatal accidents locations in 2010
Fatal accidents locations in 2011
Fatal accidents locations in 2012
Fatal accidents locations in 2013
Fatal accidents locations in 2014
Fatal accidents locations in 2015
Fatal accidents locations in 2016
Fatal accidents locations in 2017
Fatal accidents locations in 2018
Fatal accidents locations in 2019
Fatal accidents locations in 2020
Fatal accidents locations in 2021
Alcohol use - People drinking some alcohol every month (%)
Alcohol use - People not drinking at all (%)
Alcohol use - Average days/month drinking alcohol
Alcohol use - Average drinks/week
Alcohol use - Average days/year people drink much
Audiometry - Average condition of hearing (%)
Audiometry - People that can hear a whisper from across a quiet room (%)
Audiometry - People that can hear normal voice from across a quiet room (%)
Audiometry - Ears ringing, roaring, buzzing (%)
Audiometry - Had a job exposure to loud noise (%)
Audiometry - Had off-work exposure to loud noise (%)
Blood Pressure & Cholesterol - Has high blood pressure (%)
Blood Pressure & Cholesterol - Checking blood pressure at home (%)
Blood Pressure & Cholesterol - Frequently checking blood cholesterol (%)
Blood Pressure & Cholesterol - Has high cholesterol level (%)
Consumer Behavior - Money monthly spent on food at supermarket/grocery store
Consumer Behavior - Money monthly spent on food at other stores
Consumer Behavior - Money monthly spent on eating out
Consumer Behavior - Money monthly spent on carryout/delivered foods
Consumer Behavior - Income spent on food at supermarket/grocery store (%)
Consumer Behavior - Income spent on food at other stores (%)
Consumer Behavior - Income spent on eating out (%)
Consumer Behavior - Income spent on carryout/delivered foods (%)
Current Health Status - General health condition (%)
Current Health Status - Blood donors (%)
Current Health Status - Has blood ever tested for HIV virus (%)
Current Health Status - Left-handed people (%)
Dermatology - People using sunscreen (%)
Diabetes - Diabetics (%)
Diabetes - Had a blood test for high blood sugar (%)
Diabetes - People taking insulin (%)
Diet Behavior & Nutrition - Diet health (%)
Diet Behavior & Nutrition - Milk product consumption (# of products/month)
Diet Behavior & Nutrition - Meals not home prepared (#/week)
Diet Behavior & Nutrition - Meals from fast food or pizza place (#/week)
Diet Behavior & Nutrition - Ready-to-eat foods (#/month)
Diet Behavior & Nutrition - Frozen meals/pizza (#/month)
Drug Use - People that ever used marijuana or hashish (%)
Drug Use - Ever used hard drugs (%)
Drug Use - Ever used any form of cocaine (%)
Drug Use - Ever used heroin (%)
Drug Use - Ever used methamphetamine (%)
Health Insurance - People covered by health insurance (%)
Kidney Conditions-Urology - Avg. # of times urinating at night
Medical Conditions - People with asthma (%)
Medical Conditions - People with anemia (%)
Medical Conditions - People with psoriasis (%)
Medical Conditions - People with overweight (%)
Medical Conditions - Elderly people having difficulties in thinking or remembering (%)
Medical Conditions - People who ever received blood transfusion (%)
Medical Conditions - People having trouble seeing even with glass/contacts (%)
Medical Conditions - People with arthritis (%)
Medical Conditions - People with gout (%)
Medical Conditions - People with congestive heart failure (%)
Medical Conditions - People with coronary heart disease (%)
Medical Conditions - People with angina pectoris (%)
Medical Conditions - People who ever had heart attack (%)
Medical Conditions - People who ever had stroke (%)
Medical Conditions - People with emphysema (%)
Medical Conditions - People with thyroid problem (%)
Medical Conditions - People with chronic bronchitis (%)
Medical Conditions - People with any liver condition (%)
Medical Conditions - People who ever had cancer or malignancy (%)
Mental Health - People who have little interest in doing things (%)
Mental Health - People feeling down, depressed, or hopeless (%)
Mental Health - People who have trouble sleeping or sleeping too much (%)
Mental Health - People feeling tired or having little energy (%)
Mental Health - People with poor appetite or overeating (%)
Mental Health - People feeling bad about themself (%)
Mental Health - People who have trouble concentrating on things (%)
Mental Health - People moving or speaking slowly or too fast (%)
Mental Health - People having thoughts they would be better off dead (%)
Oral Health - Average years since last visit a dentist
Oral Health - People embarrassed because of mouth (%)
Oral Health - People with gum disease (%)
Oral Health - General health of teeth and gums (%)
Oral Health - Average days a week using dental floss/device
Oral Health - Average days a week using mouthwash for dental problem
Oral Health - Average number of teeth
Pesticide Use - Households using pesticides to control insects (%)
Pesticide Use - Households using pesticides to kill weeds (%)
Physical Activity - People doing vigorous-intensity work activities (%)
Physical Activity - People doing moderate-intensity work activities (%)
Physical Activity - People walking or bicycling (%)
Physical Activity - People doing vigorous-intensity recreational activities (%)
Physical Activity - People doing moderate-intensity recreational activities (%)
Physical Activity - Average hours a day doing sedentary activities
Physical Activity - Average hours a day watching TV or videos
Physical Activity - Average hours a day using computer
Physical Functioning - People having limitations keeping them from working (%)
Physical Functioning - People limited in amount of work they can do (%)
Physical Functioning - People that need special equipment to walk (%)
Physical Functioning - People experiencing confusion/memory problems (%)
Physical Functioning - People requiring special healthcare equipment (%)
Prescription Medications - Average number of prescription medicines taking
Preventive Aspirin Use - Adults 40+ taking low-dose aspirin (%)
Reproductive Health - Vaginal deliveries (%)
Reproductive Health - Cesarean deliveries (%)
Reproductive Health - Deliveries resulted in a live birth (%)
Reproductive Health - Pregnancies resulted in a delivery (%)
Reproductive Health - Women breastfeeding newborns (%)
Reproductive Health - Women that had a hysterectomy (%)
Reproductive Health - Women that had both ovaries removed (%)
Reproductive Health - Women that have ever taken birth control pills (%)
Reproductive Health - Women taking birth control pills (%)
Reproductive Health - Women that have ever used Depo-Provera or injectables (%)
Reproductive Health - Women that have ever used female hormones (%)
Sexual Behavior - People 18+ that ever had sex (vaginal, anal, or oral) (%)
Sexual Behavior - Males 18+ that ever had vaginal sex with a woman (%)
Sexual Behavior - Males 18+ that ever performed oral sex on a woman (%)
Sexual Behavior - Males 18+ that ever had anal sex with a woman (%)
Sexual Behavior - Males 18+ that ever had any sex with a man (%)
Sexual Behavior - Females 18+ that ever had vaginal sex with a man (%)
Sexual Behavior - Females 18+ that ever performed oral sex on a man (%)
Sexual Behavior - Females 18+ that ever had anal sex with a man (%)
Sexual Behavior - Females 18+ that ever had any kind of sex with a woman (%)
Sexual Behavior - Average age people first had sex
Sexual Behavior - Average number of female sex partners in lifetime (males 18+)
Sexual Behavior - Average number of female vaginal sex partners in lifetime (males 18+)
Sexual Behavior - Average age people first performed oral sex on a woman (18+)
Sexual Behavior - Average number of woman performed oral sex on in lifetime (18+)
Sexual Behavior - Average number of male sex partners in lifetime (males 18+)
Sexual Behavior - Average number of male anal sex partners in lifetime (males 18+)
Sexual Behavior - Average age people first performed oral sex on a man (18+)
Sexual Behavior - Average number of male oral sex partners in lifetime (18+)
Sexual Behavior - People using protection when performing oral sex (%)
Sexual Behavior - Average number of times people have vaginal or anal sex a year
Sexual Behavior - People having sex without condom (%)
Sexual Behavior - Average number of male sex partners in lifetime (females 18+)
Sexual Behavior - Average number of male vaginal sex partners in lifetime (females 18+)
Sexual Behavior - Average number of female sex partners in lifetime (females 18+)
Sexual Behavior - Circumcised males 18+ (%)
Sleep Disorders - Average hours sleeping at night
Sleep Disorders - People that has trouble sleeping (%)
Smoking-Cigarette Use - People smoking cigarettes (%)
Taste & Smell - People 40+ having problems with smell (%)
Taste & Smell - People 40+ having problems with taste (%)
Taste & Smell - People 40+ that ever had wisdom teeth removed (%)
Taste & Smell - People 40+ that ever had tonsils teeth removed (%)
Taste & Smell - People 40+ that ever had a loss of consciousness because of a head injury (%)
Taste & Smell - People 40+ that ever had a broken nose or other serious injury to face or skull (%)
Taste & Smell - People 40+ that ever had two or more sinus infections (%)
Weight - Average height (inches)
Weight - Average weight (pounds)
Weight - Average BMI
Weight - People that are obese (%)
Weight - People that ever were obese (%)
Weight - People trying to lose weight (%)
12,684 54.9% White alone 7,723 33.5% Hispanic 1,669 7.2% Two or more races 367 1.6% Asian alone 226 1.0% Black alone 86 0.4% American Indian alone 66 0.3% Other race alone 35 0.2% Native Hawaiian and Other
Officers per 1,000 residents here:
0.94California average:
2.30
Latest news from Oakdale, CA collected exclusively by city-data.com from local newspapers, TV, and radio stations
Ancestries: American (9.4%), European (6.1%), Italian (4.9%), Irish (4.7%), German (3.4%), English (3.1%).
Current Local Time:
Land area: 5.03 square miles.
Population density: 4,611 people per square mile (average).
2,413 residents are foreign born (8.3% Latin America ).
This city:
10.5%California:
26.5%
Median real estate property taxes paid for housing units with mortgages in 2022: $3,589 (0.8%)Median real estate property taxes paid for housing units with no mortgage in 2022: $2,814 (0.6%)
Nearest city with pop. 50,000+: Modesto, CA
Nearest city with pop. 200,000+: Stockton, CA
Nearest city with pop. 1,000,000+: Los Angeles, CA
Nearest cities:
Latitude: 37.77 N, Longitude: 120.86 W
Nickname or alias (official or unofficial): Cowboy Capital of the World
Daytime population change due to commuting: -1,257 (-5.4%)Workers who live and work in this city: 2,890 (28.1%)
Single-family new house construction building permits:
2022: 22 buildings , average cost: $377,3002021: 40 buildings , average cost: $301,8002020: 37 buildings , average cost: $293,5002019: 5 buildings , average cost: $242,2002018: 66 buildings , average cost: $263,3002017: 111 buildings , average cost: $271,3002016: 109 buildings , average cost: $268,1002015: 92 buildings , average cost: $238,3002014: 76 buildings , average cost: $238,3002013: 55 buildings , average cost: $184,9002012: 51 buildings , average cost: $153,1002011: 14 buildings , average cost: $185,0002010: 23 buildings , average cost: $179,7002009: 100 buildings , average cost: $138,3002008: 65 buildings , average cost: $126,8002007: 211 buildings , average cost: $98,6002006: 390 buildings , average cost: $107,1002005: 383 buildings , average cost: $205,1002004: 376 buildings , average cost: $190,2002003: 166 buildings , average cost: $157,8002002: 184 buildings , average cost: $141,4002001: 174 buildings , average cost: $146,8002000: 93 buildings , average cost: $137,9001999: 26 buildings , average cost: $169,9001998: 36 buildings , average cost: $111,4001997: 18 buildings , average cost: $88,500Unemployment in December 2023:
Population change in the 1990s: +3,301 (+27.1%).
Most common occupations in Oakdale, CA (%)
Both Males Females
Other production occupations, including supervisors (4.9%)
Driver/sales workers and truck drivers (4.9%)
Other management occupations, except farmers and farm managers (4.0%)
Electrical equipment mechanics and other installation, maintenance, and repair workers, including supervisors (3.8%)
Material recording, scheduling, dispatching, and distributing workers (3.2%)
Other office and administrative support workers, including supervisors (3.0%)
Building and grounds cleaning and maintenance occupations (2.8%)
Driver/sales workers and truck drivers (9.0%)
Electrical equipment mechanics and other installation, maintenance, and repair workers, including supervisors (7.2%)
Other management occupations, except farmers and farm managers (3.8%)
Other production occupations, including supervisors (3.7%)
Metal workers and plastic workers (3.5%)
Agricultural workers, including supervisors (3.5%)
Other material moving workers, except laborers (3.4%)
Other production occupations, including supervisors (6.3%)
Other office and administrative support workers, including supervisors (5.6%)
Material recording, scheduling, dispatching, and distributing workers (4.3%)
Other management occupations, except farmers and farm managers (4.2%)
Cashiers (4.1%)
Secretaries and administrative assistants (4.0%)
Building and grounds cleaning and maintenance occupations (3.9%)
Earthquake activity:
Oakdale-area historical earthquake activity is significantly above California state average. It is 8135% greater than the overall U.S. average. On 4/18/1906 at 13:12:21, a magnitude 7.9 (7.9 UK, Class: Major, Intensity: VIII - XII) earthquake occurred 118.1 miles away from the city center, causing $524,000,000 total damage On 10/18/1989 at 00:04:15, a magnitude 7.1 (6.5 MB, 7.1 MS, 6.9 MW, 7.0 ML) earthquake occurred 67.8 miles away from Oakdale center, causing 62 deaths ( 62 shaking deaths) and 3757 injuries, causing $1,305,032,704 total damage On 7/21/1952 at 11:52:14, a magnitude 7.7 (7.7 UK) earthquake occurred 217.7 miles away from Oakdale center, causing $50,000,000 total damage On 11/4/1927 at 13:51:53, a magnitude 7.5 (7.5 UK) earthquake occurred 197.7 miles away from Oakdale center On 12/21/1932 at 06:10:09, a magnitude 7.2 (7.2 UK) earthquake occurred 159.3 miles away from Oakdale center On 10/3/1915 at 06:52:48, a magnitude 7.6 (7.6 UK) earthquake occurred 260.9 miles away from Oakdale center Magnitude types: body-wave magnitude (MB), local magnitude (ML), surface-wave magnitude (MS), moment magnitude (MW) Natural disasters: The number of natural disasters in Stanislaus County (13) is near the US average (15).Major Disasters (Presidential) Declared: 8Emergencies Declared: 2Floods: 8, Storms: 4, Winter Storms: 3, Landslides: 2, Mudslides: 2, Drought: 1, Fire: 1, Freeze: 1, Heavy Rain: 1, Hurricane: 1, Tornado: 1, Other: 1 (Note: some incidents may be assigned to more than one category). Hospitals and medical centers in Oakdale: OAK VALLEY DISTRICT HOSPITAL (Government - Hospital District or Authority, 350 S OAK AVE) OAK VALLEY CARE CENTER D/P SNF (275 SOUTH OAK AVENUE)
OAKDALE KIDNEY CENTER, LLC (1405 WEST F STREET SUITE B)
Airports located in Oakdale: Amtrak stations near Oakdale: 8 miles: MODESTO (1700 HELD DRIVE) Services: ticket office, fully wheelchair accessible, enclosed waiting area, public restrooms, public payphones, vending machines, free short-term parking, free long-term parking, call for car rental service, call for taxi service, public transit connection.
17 miles: TURLOCK-DENAIR (DENAIR, SANTA FE ST. AT ELM ST.) Services: fully wheelchair accessible, public payphones, vending machines, free short-term parking, free long-term parking, call for taxi service.
Colleges/universities with over 2000 students nearest to Oakdale:
Modesto Junior College (about 12 miles; Modesto, CA ; Full-time enrollment: 10,635)
California State University-Stanislaus (about 17 miles; Turlock, CA ; FT enrollment: 7,054)
University of the Pacific (about 29 miles; Stockton, CA ; FT enrollment: 4,999)
San Joaquin Delta College (about 30 miles; Stockton, CA ; FT enrollment: 12,167)
Merced College (about 37 miles; Merced, CA ; FT enrollment: 6,973)
University of California-Merced (about 37 miles; Merced, CA ; FT enrollment: 5,981)
Las Positas College (about 53 miles; Livermore, CA ; FT enrollment: 5,112)
Public high schools in Oakdale: OAKDALE HIGH Students: 1,170, Location: 739 W. G ST., Grades: 9-12)EAST STANISLAUS HIGH Students: 50, Location: 250 HINKLEY AVE., Grades: 9-12)OAKDALE CHARTER HIGH Students: 42, Location: 1235 E. D ST., Grades: 9-12, Charter school )VALLEY OAK JUNIOR AND SENIOR HIGH Students: 28, Location: 200 HINKLEY AVE., Grades: 7-12)Public elementary/middle schools in Oakdale: OAKDALE JUNIOR HIGH Students: 771, Location: 400 MAAG AVE., Grades: 7-8)FAIR OAKS ELEMENTARY Students: 544, Location: 151 N. LEE AVE., Grades: KG-6)SIERRA VIEW ELEMENTARY Students: 511, Location: 1323 E. J ST., Grades: KG-6)CLOVERLAND ELEMENTARY Students: 347, Location: 201 E. JOHNSON ST., Grades: KG-6)MESA VERDE ELEMENTARY Location: 4850 MESA DR., Grades: KG-5)
MAGNOLIA ELEMENTARY Location: 739 MAGNOLIA ST., Grades: KG-6)
Private elementary/middle school in Oakdale: FOSTER-MOORE CHRISTIAN SCHOOL Students: 6, Location: 1501 MAGNOLIA ST, Grades: 4-8)
See full list of schools located in Oakdale User-submitted facts and corrections:
Add www.KRVR.com FM105.5 Smooth Jazz. comes in strong in Oakdale. Thanks added by mc
FM Station KCIV owned by Bott Radio Network
Notable locations in Oakdale: (A) , Oakdale Branch Stanislaus County Free Library (B) , Oak Valley Care Center (C) , Oakdale City Fire Department Station 2 (D) , Oakdale Rural Fire Protection District Station 1 (E) , Oakdale City Fire Department Station 1 (F) , Oakdale City Hall (G) . Display/hide their locations on the map
Churches in Oakdale include: (A) , First Baptist Church (B) , First Church of Christ Scientist (C) , Free Methodist Church (D) , Pentecostal Church of God (E) , Saint Lukes Lutheran Church (F) , Saint Marys Roman Catholic Church (G) , Saint Matthias Episcopal Church (H) , Seventh Day Adventist Church (I) . Display/hide their locations on the map
Parks in Oakdale include: (1) , Dorada Park (2) , Gilbert Park (3) , Fair Oaks Park (4) , Oak Valley Park (5) , Oakdale Recreation Area (6) , Santa Fe Park (7) , William Meyer Park (8) . Display/hide their locations on the map
Hotel:
Birthplace of: Bruce Coslet - Football player and coach, March Fong Eu - Politician, Jane Swagerty - Swimmer, Melinda Sward - Soap opera actor, Michael Allsup - Musician.
Stanislaus County has a predicted average indoor radon screening level less than 2 pCi/L (pico curies per liter) - Low Potential Drinking water stations with addresses in Oakdale and their reported violations in the past:
4N MOBILEHOME PARK (Population served: 165, Groundwater):
Past health violations:
MCL, Monthly (TCR) - In MAY-2009, Contaminant: Coliform. Follow-up actions: St Violation/Reminder Notice (MAY-18-2009)
MCL, Monthly (TCR) - In MAY-2009, Contaminant: Coliform. Follow-up actions: St Violation/Reminder Notice (MAY-18-2009)
MCL, Monthly (TCR) - In SEP-2006, Contaminant: Coliform. Follow-up actions: St Violation/Reminder Notice (SEP-21-2006), St Site Visit (enforcement) (SEP-21-2006)
MCL, Monthly (TCR) - In SEP-2006, Contaminant: Coliform. Follow-up actions: St Violation/Reminder Notice (SEP-21-2006), St Site Visit (enforcement) (SEP-21-2006)
Population served: 150, Groundwater):
Past health violations:
MCL, Monthly (TCR) - In APR-2014, Contaminant: Coliform. Follow-up actions: St AO (w/o penalty) issued (APR-29-2014)
MCL, Monthly (TCR) - In MAR-2014, Contaminant: Coliform. Follow-up actions: St AO (w/o penalty) issued (MAR-31-2014)
MCL, Monthly (TCR) - In JAN-2014, Contaminant: Coliform. Follow-up actions: St AO (w/o penalty) issued (MAR-18-2014)
MCL, Monthly (TCR) - In OCT-2011, Contaminant: Coliform. Follow-up actions: St Violation/Reminder Notice (OCT-01-2011)
MCL, Monthly (TCR) - In OCT-2008, Contaminant: Coliform. Follow-up actions: St Violation/Reminder Notice (OCT-21-2008)
MCL, Monthly (TCR) - In OCT-2008, Contaminant: Coliform. Follow-up actions: St Violation/Reminder Notice (OCT-21-2008)
4 other older health violations
Population served: 26, Groundwater):
Past health violations:
MCL, Monthly (TCR) - In JUL-2009, Contaminant: Coliform. Follow-up actions: St Violation/Reminder Notice (2 times from JUL-31-2009 to AUG-03-2009), St Tech Assistance Visit (AUG-06-2009)
MCL, Monthly (TCR) - In JUL-2009, Contaminant: Coliform. Follow-up actions: St Public Notif received (SEP-14-1998), St Public Notif requested (SEP-14-1998), St Violation/Reminder Notice (2 times from JUL-31-2009 to AUG-03-2009), St Tech Assistance Visit (AUG-06-2009)
MCL, Monthly (TCR) - In AUG-2008, Contaminant: Coliform. Follow-up actions: St Violation/Reminder Notice (AUG-22-2008)
MCL, Monthly (TCR) - In AUG-2008, Contaminant: Coliform. Follow-up actions: St Violation/Reminder Notice (AUG-22-2008)
Population served: 26, Groundwater):
Past health violations:
MCL, Monthly (TCR) - In MAR-2014, Contaminant: Coliform. Follow-up actions: St AO (w/o penalty) issued (APR-02-2014)
MCL, Monthly (TCR) - In JUN-2011, Contaminant: Coliform. Follow-up actions: St Violation/Reminder Notice (JUN-13-2011)
Population served: 26, Groundwater):
Past monitoring violations:
2 routine major monitoring violations
Population served: 25, Groundwater):
Past health violations:
MCL, Monthly (TCR) - In DEC-2012, Contaminant: Coliform. Follow-up actions: St Public Notif requested (DEC-01-2012)
Past monitoring violations:
3 minor monitoring violations
Population served: 25, Groundwater):
Past health violations:
MCL, Monthly (TCR) - In JUN-2012, Contaminant: Coliform. Follow-up actions: St Violation/Reminder Notice (JUN-11-2012)
MCL, Monthly (TCR) - Between APR-2012 and JUN-2012, Contaminant: Coliform. Follow-up actions: St Violation/Reminder Notice (APR-01-2012)
Past monitoring violations:
One routine major monitoring violation
Drinking water stations with addresses in Oakdale that have no violations reported:
RIVER OAK GRACE-WATER SYSTEM (Population served: 500, Primary Water Source Type: Groundwater)
WHISKEY RIVER SALOON (Population served: 26, Primary Water Source Type: Groundwater)
OAKDALE GOLF & COUNTRY CLUB (EH) (Population served: 25, Primary Water Source Type: Groundwater)
OAKDALE CHEESE & SPECIALTIES (Population served: 25, Primary Water Source Type: Groundwater)
Average household size: This city:
2.8 peopleCalifornia:
2.9 people
Percentage of family households: This city:
72.7%Whole state:
68.7%
Percentage of households with unmarried partners: This city:
7.6%Whole state:
7.2%
Likely homosexual households (counted as self-reported same-sex unmarried-partner households)
Lesbian couples: 0.4% of all households Gay men: 0.1% of all households
People in group quarters in Oakdale in 2010:
112 people in nursing facilities/skilled-nursing facilities
65 people in group homes intended for adults
6 people in college/university student housing
2 people in workers' group living quarters and job corps centers
2 people in other noninstitutional facilities
People in group quarters in Oakdale in 2000:
106 people in nursing homes
64 people in other noninstitutional group quarters
8 people in homes for the mentally retarded
Banks with branches in Oakdale (2011 data):
Oak Valley Community Bank: Oakdale Branch at 125n. Third Avenue, branch established on 1991/05/28; at 125 North Third Avenue, branch established on 1991/05/28. Info updated 2006/11/03: Bank assets: $612.4 mil, Deposits: $536.2 mil, local headquarters , positive income , Commercial Lending Specialization, 14 total offices , Holding Company: Oak Valley Bancorp
JPMorgan Chase Bank, National Association: 325 East F Street Branch at 325 East F Street, branch established on 1988/12/27. Info updated 2011/11/10: Bank assets: $1,811,678.0 mil, Deposits: $1,190,738.0 mil, headquarters in Columbus, OH, positive income , International Specialization, 5577 total offices , Holding Company: Jpmorgan Chase & Co.
Wells Fargo Bank, National Association: Oakdale Branch at 105 West F Street, branch established on 1963/10/10. Info updated 2011/04/05: Bank assets: $1,161,490.0 mil, Deposits: $905,653.0 mil, headquarters in Sioux Falls, SD, positive income , 6395 total offices , Holding Company: Wells Fargo & Company
Bank of America, National Association: Oakdale Branch at 305 East F Street, branch established on 1930/11/03. Info updated 2009/11/18: Bank assets: $1,451,969.3 mil, Deposits: $1,077,176.8 mil, headquarters in Charlotte, NC, positive income , 5782 total offices , Holding Company: Bank Of America Corporation
Compass Bank: Oakdale In-Store Branch at 1550 East F Street, branch established on 2009/08/22. Info updated 2011/02/24: Bank assets: $63,107.0 mil, Deposits: $46,232.4 mil, headquarters in Birmingham, AL, negative income in the last year , Commercial Lending Specialization, 720 total offices , Holding Company: Banco Bilbao Vizcaya Argentaria, S.A.
Bank of the West: Oakdale Branch at 134 Maag Avenue, branch established on 1990/07/09. Info updated 2009/11/16: Bank assets: $62,408.3 mil, Deposits: $43,995.2 mil, headquarters in San Francisco, CA, positive income , 647 total offices , Holding Company: Bnp Paribas
Bank of Stockton: Oakdale Branch at 346 East 'f' Street, branch established on 2003/02/10. Info updated 2010/04/08: Bank assets: $2,047.8 mil, Deposits: $1,722.4 mil, headquarters in Stockton, CA, positive income , Commercial Lending Specialization, 16 total offices , Holding Company: 1867 Western Financial Corporation
For population 15 years and over in Oakdale:
Never married: 31.4%Now married: 50.9%Separated: 1.3%Widowed: 5.5%Divorced: 10.9% For population 25 years and over in Oakdale:
High school or higher: 85.3%Bachelor's degree or higher: 20.8%Graduate or professional degree: 8.0%Unemployed: 10.3%Mean travel time to work (commute): 33.0 minutes
Education Gini index (Inequality in education) Here:
11.7California average:
15.5
Religion statistics for Oakdale, CA (based on Stanislaus County data)
Religion Adherents Congregations Catholic 107,529 18 Evangelical Protestant 65,976 268 Other 19,198 59 Mainline Protestant 7,730 34 Black Protestant 1,312 8 Orthodox 625 2 None 312,083 -
Source: Clifford Grammich, Kirk Hadaway, Richard Houseal, Dale E.Jones, Alexei Krindatch, Richie Stanley and Richard H.Taylor. 2012. 2010 U.S.Religion Census: Religious Congregations & Membership Study. Association of Statisticians of American Religious Bodies. Jones, Dale E., et al. 2002. Congregations and Membership in the United States 2000. Nashville, TN: Glenmary Research Center. Graphs represent county-level data
Food Environment Statistics: Number of grocery stores : 133Stanislaus County :
2.61 / 10,000 pop.California :
2.14 / 10,000 pop.
Number of supercenters and club stores : 2Stanislaus County :
0.04 / 10,000 pop.California :
0.04 / 10,000 pop.
Number of convenience stores (no gas) : 33Stanislaus County :
0.65 / 10,000 pop.California :
0.62 / 10,000 pop.
Number of convenience stores (with gas) : 113This county :
2.22 / 10,000 pop.California :
1.49 / 10,000 pop.
Number of full-service restaurants : 282Here :
5.54 / 10,000 pop.California :
7.42 / 10,000 pop.
Adult diabetes rate : Stanislaus County :
8.9%State :
7.3%
Adult obesity rate : Stanislaus County :
28.0%California :
21.3%
Low-income preschool obesity rate : Health and Nutrition: Healthy diet rate : This city:
48.9%State:
49.4%
Average overall health of teeth and gums : Oakdale:
46.6%California:
48.0%
People feeling badly about themselves : People not drinking alcohol at all : Oakdale:
10.2%California:
11.2%
Average hours sleeping at night : Oakdale:
6.8California:
6.8
General health condition : This city:
55.8%California:
56.4%
Average condition of hearing : Here:
79.1%California:
80.9%
More about Health and Nutrition of Oakdale, CA Residents
Local government employment and payroll (March 2022)
Function
Full-time employees
Monthly full-time payroll
Average yearly full-time wage
Part-time employees
Monthly part-time payroll
Police Protection - Officers
22 $192,551 $105,028 1 $2,582 Sewerage
15 $94,101 $75,281 0 $0 Police - Other
12 $63,974 $63,974 6 $12,381 Parks and Recreation
8 $39,449 $59,174 8 $16,173 Other and Unallocable
7 $43,035 $73,774 2 $6,528 Water Supply
7 $49,896 $85,536 0 $0 Financial Administration
6 $39,539 $79,078 1 $82 Other Government Administration
3 $38,255 $153,020 5 $1,722 Streets and Highways
2 $7,571 $45,426 0 $0 Airports
1 $7,262 $87,144 0 $0
Totals for Government
83 $575,633 $83,224 23 $39,468
Oakdale government finances - Expenditure in 2017 (per resident):
Construction - Housing and Community Development: $1,555,000 ($67.10)
Regular Highways: $1,082,000 ($46.69)Sewerage: $181,000 ($7.81)Air Transportation: $151,000 ($6.52)Current Operations - Police Protection: $4,540,000 ($195.89)
Sewerage: $2,746,000 ($118.48)Water Utilities: $2,626,000 ($113.31)Local Fire Protection: $2,502,000 ($107.96)Central Staff Services: $1,814,000 ($78.27)Regular Highways: $1,813,000 ($78.23)Parks and Recreation: $882,000 ($38.06)Protective Inspection and Regulation - Other: $336,000 ($14.50)Health - Other: $335,000 ($14.45)Air Transportation: $278,000 ($12.00)Parking Facilities: $20,000 ($0.86)General - Interest on Debt: $1,456,000 ($62.82)
Intergovernmental to Local - Other - Local Fire Protection: $1,755,000 ($75.72)
Other Capital Outlay - Local Fire Protection: $367,000 ($15.84)
Water Utilities: $104,000 ($4.49)Central Staff Services: $31,000 ($1.34)Police Protection: $25,000 ($1.08)Parks and Recreation: $20,000 ($0.86)Regular Highways: $1,000 ($0.04)
Oakdale government finances - Revenue in 2017 (per resident):
Charges - Sewerage: $6,621,000 ($285.68)
Regular Highways: $909,000 ($39.22)Other: $629,000 ($27.14)Air Transportation: $294,000 ($12.69)Parks and Recreation: $38,000 ($1.64)Parking Facilities: $30,000 ($1.29)Federal Intergovernmental - Air Transportation: $285,000 ($12.30)
Housing and Community Development: $19,000 ($0.82)Other: $6,000 ($0.26)Miscellaneous - General Revenue - Other: $1,132,000 ($48.84)
Interest Earnings: $325,000 ($14.02)Special Assessments: $283,000 ($12.21)Fines and Forfeits: $280,000 ($12.08)Rents: $97,000 ($4.19)Revenue - Water Utilities: $3,427,000 ($147.87)
State Intergovernmental - Other: $2,744,000 ($118.40)
Highways: $427,000 ($18.42)Sewerage: $20,000 ($0.86)General Local Government Support: $18,000 ($0.78)Tax - General Sales and Gross Receipts: $5,404,000 ($233.17)
Property: $4,819,000 ($207.93)Public Utilities Sales: $997,000 ($43.02)Other: $767,000 ($33.09)Other License: $420,000 ($18.12)Documentary and Stock Transfer: $339,000 ($14.63)Other Selective Sales: $311,000 ($13.42)Occupation and Business License - Other: $141,000 ($6.08)
Oakdale government finances - Debt in 2017 (per resident):
Long Term Debt - Beginning Outstanding - Unspecified Public Purpose: $38,167,000 ($1646.83)
Outstanding Unspecified Public Purpose: $36,599,000 ($1579.18)Retired Unspecified Public Purpose: $1,568,000 ($67.66)
Oakdale government finances - Cash and Securities in 2017 (per resident):
Bond Funds - Cash and Securities: $797,000 ($34.39)
Other Funds - Cash and Securities: $29,208,000 ($1260.27)
Sinking Funds - Cash and Securities: $2,632,000 ($113.57)
5.00% of this county's 2021 resident taxpayers lived in other counties in 2020 ($56,165 average adjusted gross income )
Here:
5.00%California average:
5.19%
0.01% of residents moved from foreign countries ($94 average AGI )Stanislaus County:
0.01%California average:
0.03%
Top counties from which taxpayers relocated into this county between 2020 and 2021:
5.39% of this county's 2020 resident taxpayers moved to other counties in 2021 ($61,321 average adjusted gross income )
Here:
5.39%California average:
6.14%
0.01% of residents moved to foreign countries ($87 average AGI )Stanislaus County:
0.01%California average:
0.02%
Top counties to which taxpayers relocated from this county between 2020 and 2021:
Businesses in Oakdale, CA
Name Count Name Count
7-Eleven 2 Jack In The Box 1 AT&T 1 KFC 1 Ace Hardware 1 Kmart 1 AutoZone 1 Kroger 1 Baskin-Robbins 1 La-Z-Boy 1 Best Western 1 Little Caesars Pizza 1 Blockbuster 1 McDonald's 1 Burger King 1 Motel 6 1 CVS 1 Nike 1 Carl\s Jr. 1 Payless 1 Chevrolet 1 RadioShack 1 Circle K 1 Rite Aid 3 Cold Stone Creamery 1 Sears 1 Curves 1 Starbucks 2 Dennys 1 Subway 2 FedEx 2 Taco Bell 1 Ford 1 U-Haul 1 GNC 2 UPS 3 H&R Block 1 Walgreens 1 Holiday Inn 1
Strongest AM radio stations in Oakdale:
KCBC (770 AM; 50 kW; RIVERBANK, CA; Owner: KIERTRON, INC.)
KFIV (1360 AM; 4 kW; MODESTO, CA; Owner: CAPSTAR TX LIMITED PARTNERSHIP)
KVIN (920 AM; 2 kW; CERES, CA; Owner: THRESHOLD COMMUNICATIONS)
KHTK (1140 AM; 50 kW; SACRAMENTO, CA; Owner: INFINITY RADIO SUBSIDIARY OPERATIONS INC.)
KESP (970 AM; 1 kW; MODESTO, CA; Owner: CITADEL BROADCASTING COMPANY)
KSTE (650 AM; 25 kW; RANCHO CORDOVA, CA; Owner: AMFM RADIO LICENSES, L.L.C.)
KGO (810 AM; 50 kW; SAN FRANCISCO, CA; Owner: KGO-AM RADIO, INC.)
KNBR (680 AM; 50 kW; SAN FRANCISCO, CA; Owner: KNBR LICO, INC.)
KLOK (1170 AM; 50 kW; SAN JOSE, CA; Owner: ENTRAVISION HOLDINGS, LLC)
KLOC (1390 AM; 5 kW; TURLOCK, CA)
KTCT (1050 AM; 50 kW; SAN MATEO, CA; Owner: SUSQUEHANNA RADIO CORP.)
KFAX (1100 AM; 50 kW; SAN FRANCISCO, CA; Owner: GOLDEN GATE BROADCASTING CO, INC.)
KTRB (860 AM; 50 kW; MODESTO, CA; Owner: PAPPAS RADIO OF CALIFORNIA, A CALIFORNIA LIMITED PARTNERSHIP)
Strongest FM radio stations in Oakdale:
KHOP (95.1 FM; OAKDALE, CA; Owner: CITADEL BROADCASTING COMPANY)
KOSO (93.1 FM; PATTERSON, CA; Owner: CAPSTAR TX LIMITED PARTNERSHIP)
K238AC (95.5 FM; SALIDA, CA; Owner: FAMILY STATIONS, INC.)
KJOY (99.3 FM; STOCKTON, CA; Owner: CITADEL BROADCASTING COMPANY)
KJSN (102.3 FM; MODESTO, CA; Owner: CAPSTAR TX LIMITED PARTNERSHIP)
KRVR (105.5 FM; COPPEROPOLIS, CA; Owner: THRESHOLD COMMUNICATIONS)
KUOP (91.3 FM; STOCKTON, CA; Owner: UNIVERSITY OF THE PACIFIC)
KKBN (93.5 FM; TWAIN HARTE, CA; Owner: CLARKE BROADCASTING CORPORATION)
KKSF-FM1 (103.7 FM; PLEASANTON, ETC., CA; Owner: AMFM RADIO LICENSES, L.L.C.)
KEJC (93.9 FM; MODESTO, CA; Owner: MODESTO COMMUNICATIONS CORPORATION)
KCVR-FM (98.9 FM; COLUMBIA, CA; Owner: ENTRAVISION HOLDINGS, LLC)
KHTN (104.7 FM; LOS BANOS, CA; Owner: BUCKLEY COMMUNICATIONS, INC.)
KFRC-FM3 (99.7 FM; WALNUT CREEK, CA; Owner: INFINITY KFRC-FM, INC.)
KZBR-FM1 (95.7 FM; WALNUT CREEK, CA; Owner: BONNEVILLE HOLDING COMPANY)
KBLX-FM2 (102.9 FM; PLEASANTON, CA; Owner: ICBC BROADCAST HOLDINGS -CA, INC.)
KSOL-FM3 (98.9 FM; PLEASANTON, CA; Owner: TMS LICENSE CALIFORNIA, INC)
KAMB (101.5 FM; MERCED, CA; Owner: CENTRAL VALLEY BROADCASTING CO. INC.)
KZSQ-FM (92.7 FM; SONORA, CA; Owner: CLARKE BROADCASTING CORPORATION)
KISQ-FM3 (98.1 FM; CONCORD, CA; Owner: AMFM RADIO LICENSES, L.L.C.)
KWNN (98.3 FM; TURLOCK, CA; Owner: SILVERADO BROADCASTING COMPANY)
TV broadcast stations around Oakdale:
KBSV (Channel 23; CERES, CA; Owner: BET-NAHRAIN, INC.)
KOVR (Channel 13; STOCKTON, CA; Owner: SCI - SACRAMENTO LICENSEE, LLC)
KXTV (Channel 10; SACRAMENTO, CA; Owner: KXTV, INC.)
KUVS (Channel 19; MODESTO, CA; Owner: KUVS LICENSE PARTNERSHIP, G.P.)
KCRA-TV (Channel 3; SACRAMENTO, CA; Owner: KCRA HEARST-ARGYLE TELEVISION, INC.)
KSPX (Channel 29; SACRAMENTO, CA; Owner: PAXSON SACRAMENTO LICENSE, INC.)
KQCA (Channel 58; STOCKTON, CA; Owner: KCRA HEARST-ARGYLE TELEVISION, INC.)
KTXL (Channel 40; SACRAMENTO, CA; Owner: CHANNEL 40, INC.)
KMAX-TV (Channel 31; SACRAMENTO, CA; Owner: UPN STATIONS GROUP INC.)
KVIE (Channel 6; SACRAMENTO, CA; Owner: KVIE, INC.)
KMMK-LP (Channel 14; SACRAMENTO, CA; Owner: CABALLERO TELEVISION TEXAS, L.L.C.)
KACA-LP (Channel 61; MODESTO, CA; Owner: WORD OF GOD FELLOWSHIP, INC.)
National Bridge Inventory (NBI) Statistics 2 Number of bridges43ft / 13.4m Total length $7,102,000 Total costs22,700 Total average daily traffic2,582 Total average daily truck traffic48,680 Total future (year 2040) average daily traffic
Home Mortgage Disclosure Act Aggregated Statistics For Year 2009(Based on 1 full and 3 partial tracts) A) FHA, FSA/RHS & VA B) Conventional C) Refinancings D) Home Improvement Loans E) Loans on Dwellings For 5+ Families F) Non-occupant Loans on G) Loans On Manufactured Number Average Value Number Average Value Number Average Value Number Average Value Number Average Value Number Average Value Number Average Value
LOANS ORIGINATED 141 $197,430 89 $160,443 152 $200,064 5 $113,542 1 $1,331,400 36 $117,588 0 $0 APPLICATIONS APPROVED, NOT ACCEPTED 14 $172,154 8 $176,550 18 $201,091 1 $77,040 0 $0 6 $105,282 0 $0 APPLICATIONS DENIED 27 $207,053 16 $189,466 84 $204,707 3 $75,003 0 $0 12 $117,582 1 $257,610 APPLICATIONS WITHDRAWN 8 $248,324 10 $164,688 43 $197,559 4 $110,202 0 $0 7 $92,463 0 $0 FILES CLOSED FOR INCOMPLETENESS 6 $184,925 2 $196,900 9 $164,058 2 $45,425 0 $0 2 $123,220 0 $0
Aggregated Statistics For Year 2008(Based on 1 full and 3 partial tracts) A) FHA, FSA/RHS & VA B) Conventional C) Refinancings D) Home Improvement Loans E) Loans on Dwellings For 5+ Families F) Non-occupant Loans on G) Loans On Manufactured Number Average Value Number Average Value Number Average Value Number Average Value Number Average Value Number Average Value Number Average Value
LOANS ORIGINATED 105 $234,492 126 $216,749 96 $191,631 18 $71,059 1 $992,160 31 $170,032 1 $65,000 APPLICATIONS APPROVED, NOT ACCEPTED 15 $189,739 15 $215,583 26 $223,815 3 $61,823 0 $0 5 $200,206 0 $0 APPLICATIONS DENIED 14 $260,060 39 $239,474 102 $257,323 20 $63,422 0 $0 13 $178,748 2 $65,155 APPLICATIONS WITHDRAWN 11 $255,712 23 $220,278 38 $229,041 3 $18,077 0 $0 9 $190,393 0 $0 FILES CLOSED FOR INCOMPLETENESS 0 $0 6 $220,195 14 $311,756 7 $74,053 0 $0 3 $259,553 0 $0
Aggregated Statistics For Year 2007(Based on 1 full and 3 partial tracts) A) FHA, FSA/RHS & VA B) Conventional C) Refinancings D) Home Improvement Loans F) Non-occupant Loans on G) Loans On Manufactured Number Average Value Number Average Value Number Average Value Number Average Value Number Average Value Number Average Value
LOANS ORIGINATED 3 $365,303 184 $242,489 240 $215,881 36 $115,863 56 $201,144 2 $155,275 APPLICATIONS APPROVED, NOT ACCEPTED 0 $0 29 $239,254 75 $229,694 9 $101,243 14 $223,634 1 $102,080 APPLICATIONS DENIED 1 $480,900 56 $273,344 199 $276,637 23 $142,799 28 $253,493 1 $76,300 APPLICATIONS WITHDRAWN 0 $0 17 $216,871 90 $258,729 6 $132,350 11 $248,221 0 $0 FILES CLOSED FOR INCOMPLETENESS 0 $0 9 $273,019 33 $267,057 1 $226,340 4 $158,435 0 $0
Aggregated Statistics For Year 2006(Based on 1 full and 3 partial tracts) A) FHA, FSA/RHS & VA B) Conventional C) Refinancings D) Home Improvement Loans E) Loans on Dwellings For 5+ Families F) Non-occupant Loans on G) Loans On Manufactured Number Average Value Number Average Value Number Average Value Number Average Value Number Average Value Number Average Value Number Average Value
LOANS ORIGINATED 1 $350,120 364 $262,749 418 $241,764 68 $125,649 1 $273,820 68 $236,206 1 $34,560 APPLICATIONS APPROVED, NOT ACCEPTED 0 $0 47 $263,130 75 $225,917 12 $83,399 0 $0 18 $198,696 1 $192,470 APPLICATIONS DENIED 0 $0 81 $293,071 194 $267,047 49 $171,649 0 $0 26 $272,357 2 $188,705 APPLICATIONS WITHDRAWN 0 $0 45 $279,609 148 $252,658 16 $149,111 0 $0 14 $312,128 0 $0 FILES CLOSED FOR INCOMPLETENESS 0 $0 19 $290,548 39 $271,959 1 $204,680 0 $0 7 $234,780 0 $0
Aggregated Statistics For Year 2005(Based on 1 full and 3 partial tracts) A) FHA, FSA/RHS & VA B) Conventional C) Refinancings D) Home Improvement Loans E) Loans on Dwellings For 5+ Families F) Non-occupant Loans on G) Loans On Manufactured Number Average Value Number Average Value Number Average Value Number Average Value Number Average Value Number Average Value Number Average Value
LOANS ORIGINATED 1 $284,410 438 $243,580 513 $223,529 53 $139,582 1 $1,296,930 110 $225,542 2 $86,900 APPLICATIONS APPROVED, NOT ACCEPTED 1 $187,800 71 $233,653 69 $229,097 6 $137,313 0 $0 19 $234,931 3 $54,760 APPLICATIONS DENIED 0 $0 92 $222,883 178 $232,122 33 $147,833 0 $0 33 $229,924 6 $80,650 APPLICATIONS WITHDRAWN 0 $0 61 $236,555 160 $216,928 19 $136,651 0 $0 15 $247,040 1 $116,170 FILES CLOSED FOR INCOMPLETENESS 0 $0 16 $241,836 47 $238,607 10 $155,722 0 $0 5 $213,322 0 $0
Aggregated Statistics For Year 2004(Based on 1 full and 3 partial tracts) A) FHA, FSA/RHS & VA B) Conventional C) Refinancings D) Home Improvement Loans E) Loans on Dwellings For 5+ Families F) Non-occupant Loans on G) Loans On Manufactured Number Average Value Number Average Value Number Average Value Number Average Value Number Average Value Number Average Value Number Average Value
LOANS ORIGINATED 6 $131,342 352 $198,781 436 $171,017 50 $93,971 1 $427,950 108 $171,223 4 $107,082 APPLICATIONS APPROVED, NOT ACCEPTED 0 $0 49 $202,376 65 $171,515 8 $51,808 0 $0 10 $163,997 3 $120,173 APPLICATIONS DENIED 1 $122,430 60 $185,345 142 $178,898 32 $69,248 0 $0 23 $212,345 1 $143,400 APPLICATIONS WITHDRAWN 1 $87,240 42 $216,407 127 $170,291 16 $111,293 0 $0 13 $148,588 0 $0 FILES CLOSED FOR INCOMPLETENESS 0 $0 7 $215,433 60 $192,508 2 $100,840 0 $0 6 $151,693 0 $0
Aggregated Statistics For Year 2003(Based on 1 full and 3 partial tracts) A) FHA, FSA/RHS & VA B) Conventional C) Refinancings D) Home Improvement Loans E) Loans on Dwellings For 5+ Families F) Non-occupant Loans on Number Average Value Number Average Value Number Average Value Number Average Value Number Average Value Number Average Value
LOANS ORIGINATED 21 $162,710 263 $174,792 780 $148,113 26 $37,538 4 $454,135 94 $140,634 APPLICATIONS APPROVED, NOT ACCEPTED 0 $0 40 $137,516 103 $140,050 9 $35,076 0 $0 14 $135,418 APPLICATIONS DENIED 0 $0 56 $145,579 190 $147,577 17 $34,263 0 $0 16 $146,035 APPLICATIONS WITHDRAWN 3 $169,050 30 $180,994 135 $152,899 3 $94,330 0 $0 12 $146,327 FILES CLOSED FOR INCOMPLETENESS 0 $0 7 $198,686 25 $150,798 2 $54,315 0 $0 2 $192,440
Aggregated Statistics For Year 2002(Based on 1 full and 2 partial tracts) A) FHA, FSA/RHS & VA B) Conventional C) Refinancings D) Home Improvement Loans E) Loans on Dwellings For 5+ Families F) Non-occupant Loans on Number Average Value Number Average Value Number Average Value Number Average Value Number Average Value Number Average Value
LOANS ORIGINATED 21 $146,152 230 $158,799 468 $133,838 33 $36,097 3 $1,193,503 68 $120,581 APPLICATIONS APPROVED, NOT ACCEPTED 0 $0 24 $172,507 54 $132,646 12 $24,766 0 $0 8 $125,629 APPLICATIONS DENIED 2 $150,210 28 $142,216 110 $124,348 27 $25,469 0 $0 12 $115,335 APPLICATIONS WITHDRAWN 1 $137,890 21 $174,396 91 $140,083 6 $32,975 0 $0 5 $132,714 FILES CLOSED FOR INCOMPLETENESS 0 $0 3 $125,797 29 $121,604 1 $23,820 0 $0 2 $145,350
Aggregated Statistics For Year 2001(Based on 1 full and 2 partial tracts) A) FHA, FSA/RHS & VA B) Conventional C) Refinancings D) Home Improvement Loans E) Loans on Dwellings For 5+ Families F) Non-occupant Loans on Number Average Value Number Average Value Number Average Value Number Average Value Number Average Value Number Average Value
LOANS ORIGINATED 37 $132,364 203 $136,423 381 $125,666 16 $26,884 1 $763,130 57 $118,656 APPLICATIONS APPROVED, NOT ACCEPTED 3 $100,770 19 $129,450 52 $112,611 3 $58,010 0 $0 7 $114,366 APPLICATIONS DENIED 2 $138,640 31 $114,151 102 $107,906 14 $21,732 1 $75,720 7 $106,446 APPLICATIONS WITHDRAWN 3 $83,600 25 $142,975 93 $118,374 6 $39,832 1 $127,220 4 $78,388 FILES CLOSED FOR INCOMPLETENESS 0 $0 3 $154,323 15 $124,968 0 $0 1 $475,500 3 $105,827
Aggregated Statistics For Year 2000(Based on 1 full and 2 partial tracts) A) FHA, FSA/RHS & VA B) Conventional C) Refinancings D) Home Improvement Loans E) Loans on Dwellings For 5+ Families F) Non-occupant Loans on Number Average Value Number Average Value Number Average Value Number Average Value Number Average Value Number Average Value
LOANS ORIGINATED 42 $114,186 146 $120,316 67 $83,264 21 $29,039 1 $732,750 20 $94,064 APPLICATIONS APPROVED, NOT ACCEPTED 4 $92,915 16 $106,332 13 $186,822 14 $38,936 0 $0 0 $0 APPLICATIONS DENIED 8 $110,972 35 $97,839 57 $76,595 13 $24,875 0 $0 7 $61,339 APPLICATIONS WITHDRAWN 7 $104,437 14 $115,622 35 $97,445 2 $43,610 0 $0 4 $108,915 FILES CLOSED FOR INCOMPLETENESS 3 $84,230 5 $96,918 4 $116,505 1 $28,180 0 $0 1 $45,440
Aggregated Statistics For Year 1999(Based on 4 partial tracts) A) FHA, FSA/RHS & VA B) Conventional C) Refinancings D) Home Improvement Loans E) Loans on Dwellings For 5+ Families F) Non-occupant Loans on Number Average Value Number Average Value Number Average Value Number Average Value Number Average Value Number Average Value
LOANS ORIGINATED 51 $110,480 101 $107,494 140 $94,356 25 $26,103 1 $1,362,940 32 $74,915 APPLICATIONS APPROVED, NOT ACCEPTED 1 $106,470 12 $103,712 32 $94,858 10 $25,716 0 $0 4 $97,735 APPLICATIONS DENIED 5 $91,414 20 $103,380 76 $89,495 12 $22,155 0 $0 9 $92,998 APPLICATIONS WITHDRAWN 3 $117,843 15 $123,741 68 $95,215 4 $97,070 1 $87,920 9 $77,102 FILES CLOSED FOR INCOMPLETENESS 0 $0 6 $80,323 14 $103,328 0 $0 0 $0 1 $85,010
Detailed HMDA statistics for the following Tracts:
0001.02
, 0002.01 , 0002.02 , 0002.03
Private Mortgage Insurance Companies Aggregated Statistics For Year 2009(Based on 1 full and 3 partial tracts) A) Conventional B) Refinancings Number Average Value Number Average Value
LOANS ORIGINATED 11 $225,212 1 $232,040 APPLICATIONS APPROVED, NOT ACCEPTED 2 $311,075 2 $214,665 APPLICATIONS DENIED 0 $0 0 $0 APPLICATIONS WITHDRAWN 0 $0 0 $0 FILES CLOSED FOR INCOMPLETENESS 1 $234,540 0 $0
Aggregated Statistics For Year 2008(Based on 1 full and 3 partial tracts) A) Conventional B) Refinancings C) Non-occupant Loans on Number Average Value Number Average Value Number Average Value
LOANS ORIGINATED 46 $283,817 8 $313,804 1 $244,410 APPLICATIONS APPROVED, NOT ACCEPTED 19 $295,006 8 $269,904 2 $335,940 APPLICATIONS DENIED 3 $186,930 1 $214,010 1 $327,330 APPLICATIONS WITHDRAWN 3 $261,697 0 $0 0 $0 FILES CLOSED FOR INCOMPLETENESS 1 $472,360 0 $0 1 $373,740
Aggregated Statistics For Year 2007(Based on 1 full and 3 partial tracts) A) Conventional B) Refinancings C) Non-occupant Loans on Number Average Value Number Average Value Number Average Value
LOANS ORIGINATED 29 $331,848 17 $324,280 2 $517,195 APPLICATIONS APPROVED, NOT ACCEPTED 2 $316,330 8 $335,279 0 $0 APPLICATIONS DENIED 1 $338,890 0 $0 0 $0 APPLICATIONS WITHDRAWN 3 $323,657 0 $0 0 $0 FILES CLOSED FOR INCOMPLETENESS 0 $0 0 $0 0 $0
Aggregated Statistics For Year 2006(Based on 1 full and 2 partial tracts) A) Conventional B) Refinancings C) Non-occupant Loans on Number Average Value Number Average Value Number Average Value
LOANS ORIGINATED 9 $352,798 6 $362,182 0 $0 APPLICATIONS APPROVED, NOT ACCEPTED 2 $218,725 4 $347,560 1 $238,050 APPLICATIONS DENIED 0 $0 0 $0 0 $0 APPLICATIONS WITHDRAWN 2 $385,590 0 $0 1 $499,180 FILES CLOSED FOR INCOMPLETENESS 0 $0 0 $0 0 $0
Aggregated Statistics For Year 2005(Based on 1 full and 2 partial tracts) A) Conventional B) Refinancings C) Non-occupant Loans on Number Average Value Number Average Value Number Average Value
LOANS ORIGINATED 16 $318,189 5 $297,788 2 $273,620 APPLICATIONS APPROVED, NOT ACCEPTED 3 $365,133 4 $274,408 0 $0 APPLICATIONS DENIED 0 $0 0 $0 0 $0 APPLICATIONS WITHDRAWN 3 $240,437 0 $0 1 $235,050 FILES CLOSED FOR INCOMPLETENESS 0 $0 0 $0 0 $0
Aggregated Statistics For Year 2004(Based on 1 full and 3 partial tracts) A) Conventional B) Refinancings C) Non-occupant Loans on Number Average Value Number Average Value Number Average Value
LOANS ORIGINATED 23 $267,036 10 $237,394 3 $209,947 APPLICATIONS APPROVED, NOT ACCEPTED 5 $259,646 7 $182,219 1 $186,400 APPLICATIONS DENIED 0 $0 0 $0 0 $0 APPLICATIONS WITHDRAWN 0 $0 1 $191,040 0 $0 FILES CLOSED FOR INCOMPLETENESS 0 $0 0 $0 0 $0
Aggregated Statistics For Year 2003(Based on 1 full and 3 partial tracts) A) Conventional B) Refinancings C) Non-occupant Loans on Number Average Value Number Average Value Number Average Value
LOANS ORIGINATED 61 $219,908 39 $195,468 5 $206,346 APPLICATIONS APPROVED, NOT ACCEPTED 8 $208,096 12 $204,128 0 $0 APPLICATIONS DENIED 1 $242,490 0 $0 0 $0 APPLICATIONS WITHDRAWN 1 $241,530 1 $106,020 0 $0 FILES CLOSED FOR INCOMPLETENESS 0 $0 0 $0 0 $0
Aggregated Statistics For Year 2002(Based on 1 full and 2 partial tracts) A) Conventional B) Refinancings C) Non-occupant Loans on Number Average Value Number Average Value Number Average Value
LOANS ORIGINATED 53 $184,839 23 $175,810 4 $133,218 APPLICATIONS APPROVED, NOT ACCEPTED 5 $198,116 7 $151,570 1 $60,580 APPLICATIONS DENIED 1 $78,750 1 $106,020 0 $0 APPLICATIONS WITHDRAWN 5 $128,408 4 $150,418 0 $0 FILES CLOSED FOR INCOMPLETENESS 0 $0 0 $0 0 $0
Aggregated Statistics For Year 2001(Based on 1 full and 2 partial tracts) A) Conventional B) Refinancings C) Non-occupant Loans on Number Average Value Number Average Value Number Average Value
LOANS ORIGINATED 57 $158,365 33 $154,329 5 $137,988 APPLICATIONS APPROVED, NOT ACCEPTED 5 $158,756 10 $143,000 2 $126,550 APPLICATIONS DENIED 0 $0 2 $213,540 0 $0 APPLICATIONS WITHDRAWN 0 $0 0 $0 0 $0 FILES CLOSED FOR INCOMPLETENESS 0 $0 0 $0 0 $0
Aggregated Statistics For Year 2000(Based on 1 full and 2 partial tracts) A) Conventional B) Refinancings C) Non-occupant Loans on Number Average Value Number Average Value Number Average Value
LOANS ORIGINATED 37 $132,886 7 $87,677 4 $67,918 APPLICATIONS APPROVED, NOT ACCEPTED 6 $133,348 0 $0 0 $0 APPLICATIONS DENIED 1 $144,350 1 $103,590 0 $0 APPLICATIONS WITHDRAWN 0 $0 1 $101,170 1 $101,170 FILES CLOSED FOR INCOMPLETENESS 0 $0 0 $0 0 $0
Aggregated Statistics For Year 1999(Based on 4 partial tracts) A) Conventional B) Refinancings C) Non-occupant Loans on Number Average Value Number Average Value Number Average Value
LOANS ORIGINATED 30 $129,659 16 $120,075 1 $91,700 APPLICATIONS APPROVED, NOT ACCEPTED 2 $99,875 5 $146,242 1 $99,910 APPLICATIONS DENIED 0 $0 0 $0 0 $0 APPLICATIONS WITHDRAWN 1 $71,320 0 $0 0 $0 FILES CLOSED FOR INCOMPLETENESS 0 $0 1 $209,510 0 $0
Detailed PMIC statistics for the following Tracts:
0001.02
, 0002.01 , 0002.02 , 0002.03 Oakdale compared to California state average:
Median house value below state average. Black race population percentage significantly below state average. Foreign-born population percentage below state average.
Top Patent Applicants
Brian Mathew Blocher (4)
Jon R. Reed (3)
William J. Keegan (2)
Donald Alan Dolly (2)
Alan Zachary (2)
Steve Williamson (2)
Donald R. Faubion (2)
David Ratchford (1)
Wail George Mansour (1)
Bret De Jeor (1)
Total of 40 patent applications in 2008-2024.

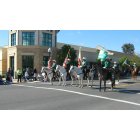
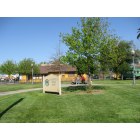
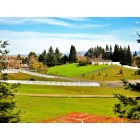
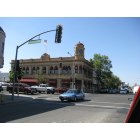
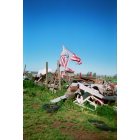
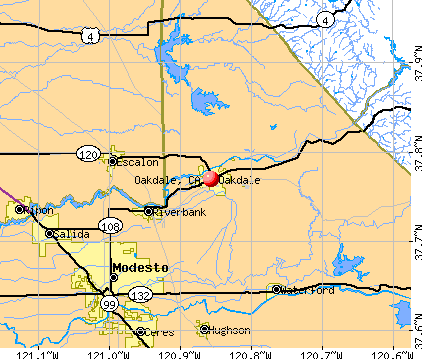


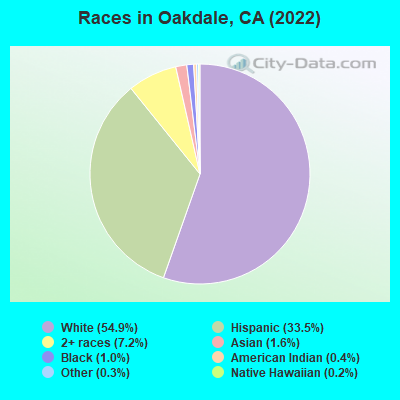
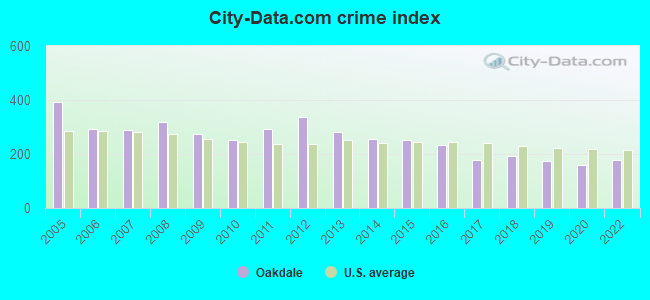
 Recent articles from our blog. Our writers, many of them Ph.D. graduates or candidates, create easy-to-read articles on a wide variety of topics.

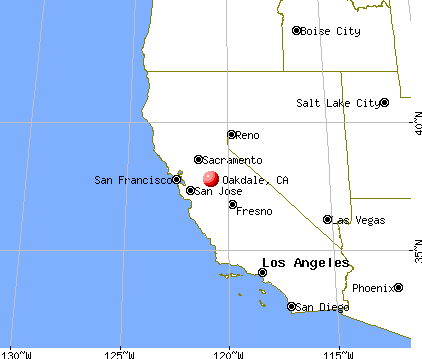
 (10.6 miles
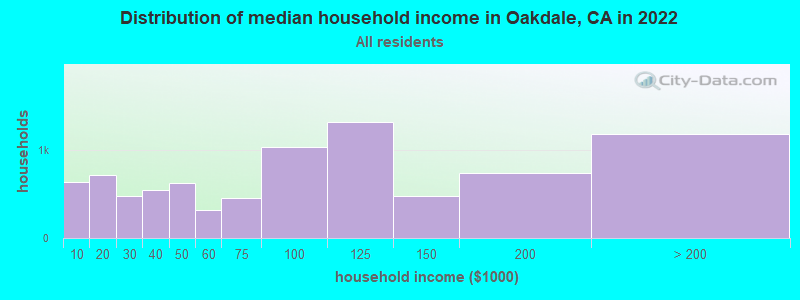
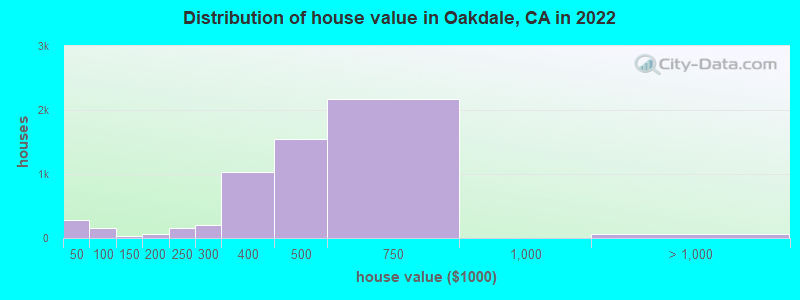
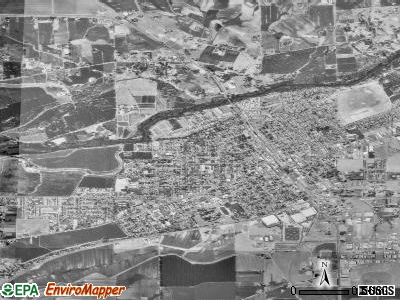
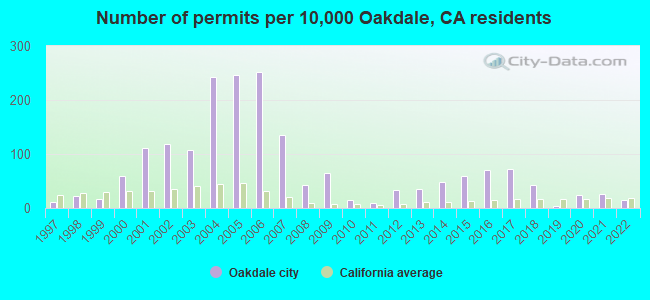
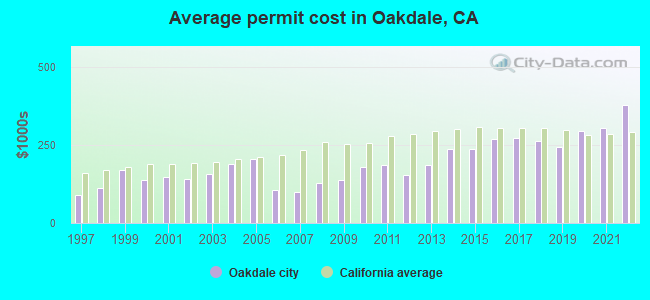
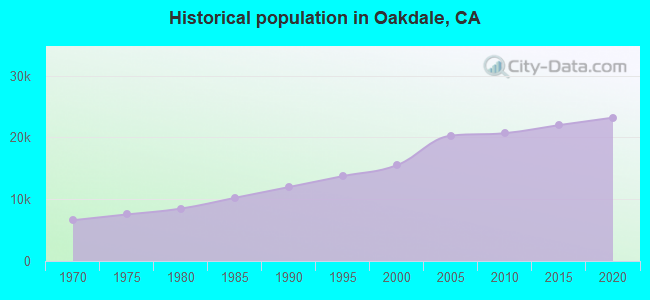
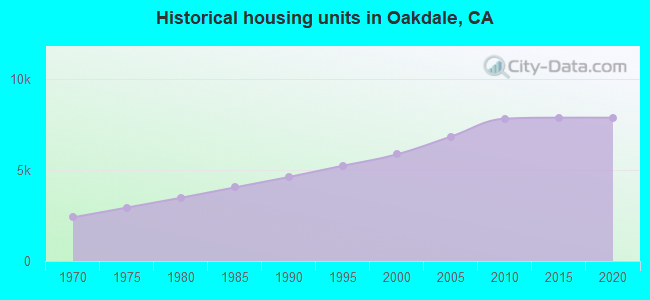
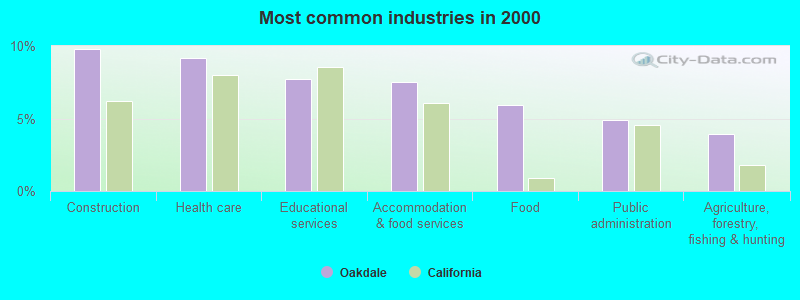
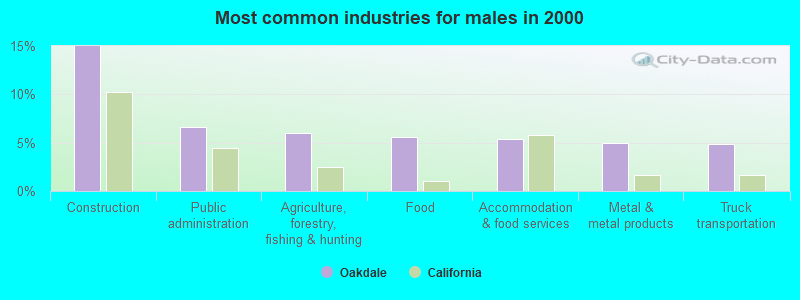
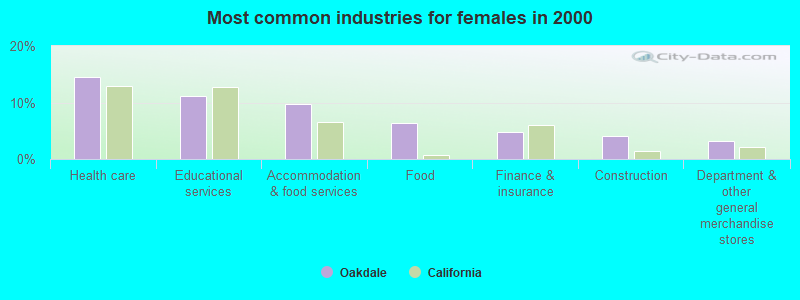
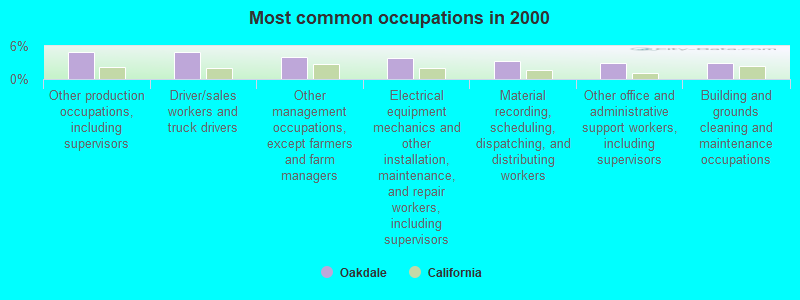
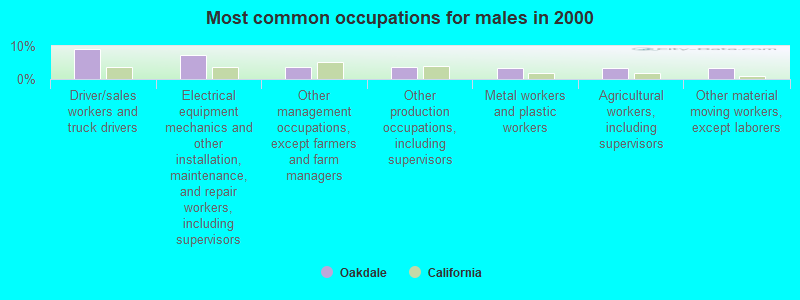
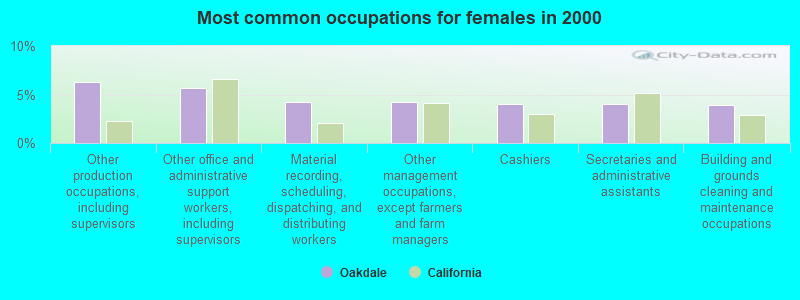
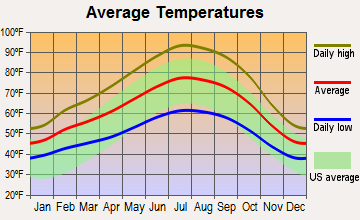
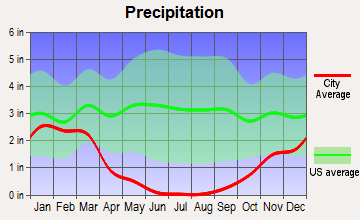
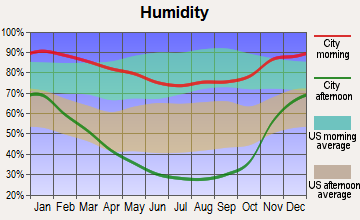
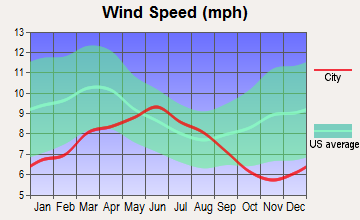
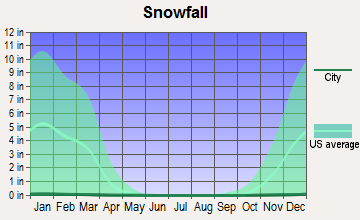
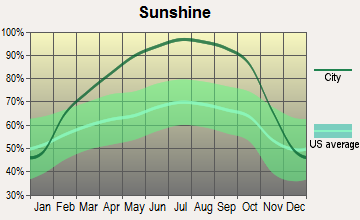
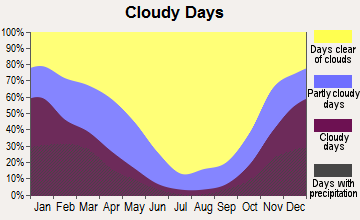
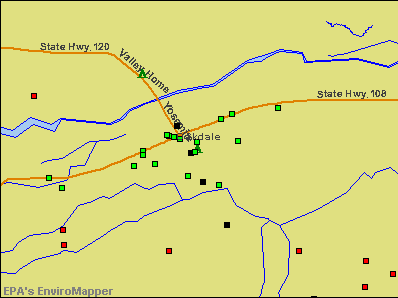

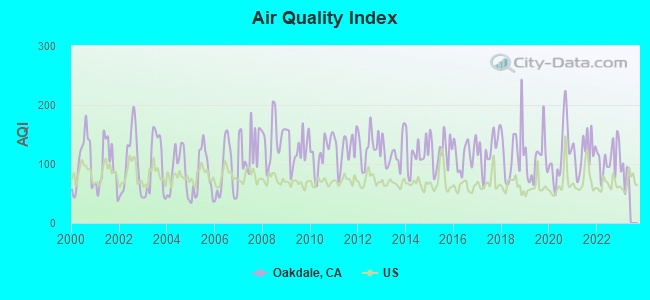
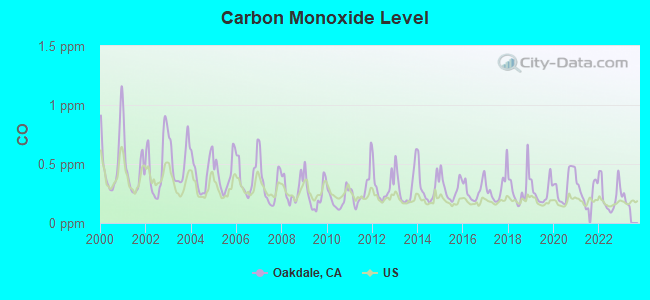
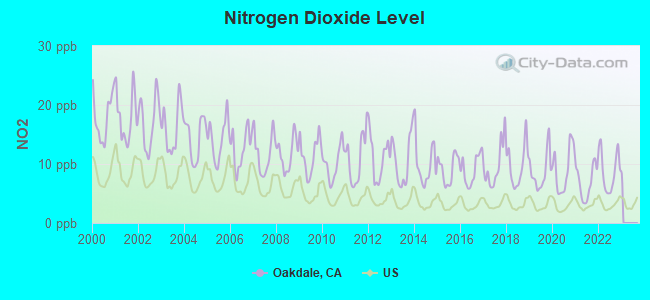
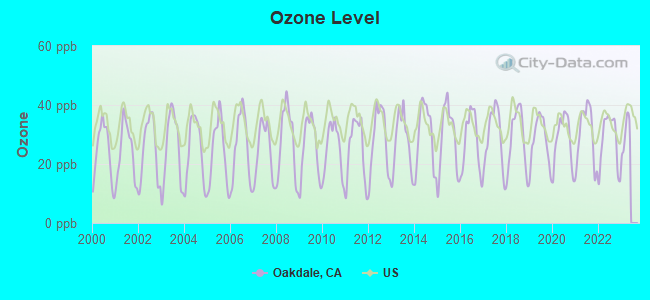
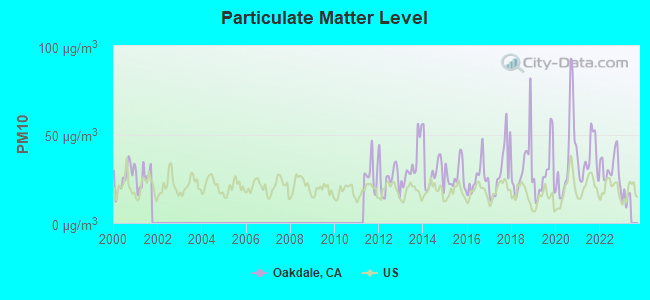
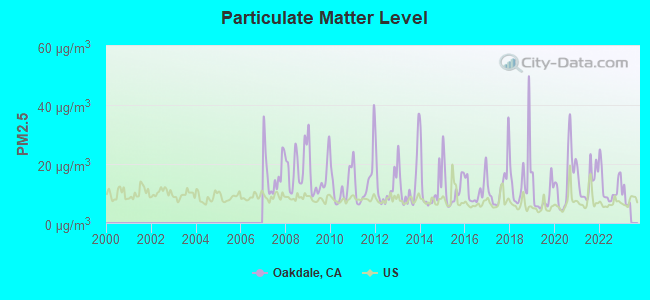
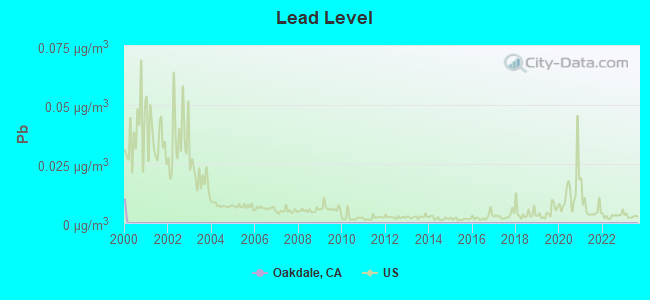
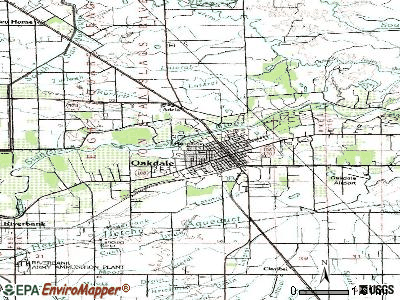
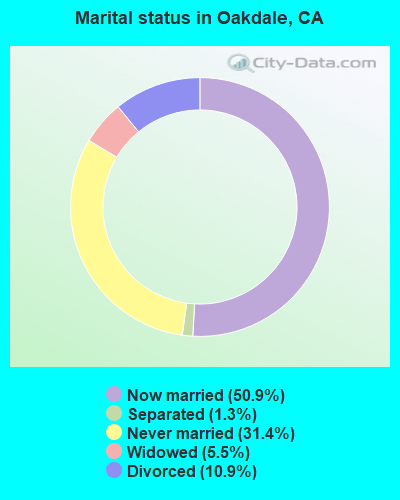
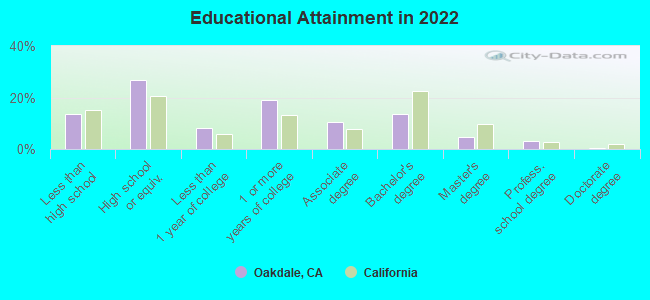
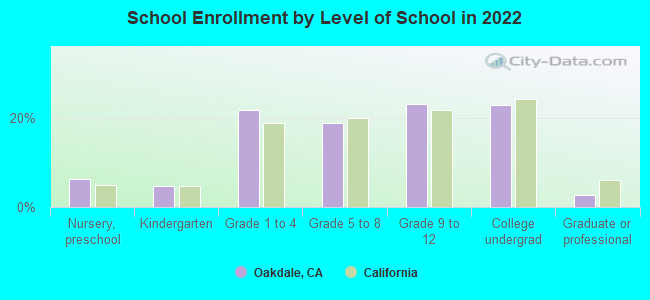
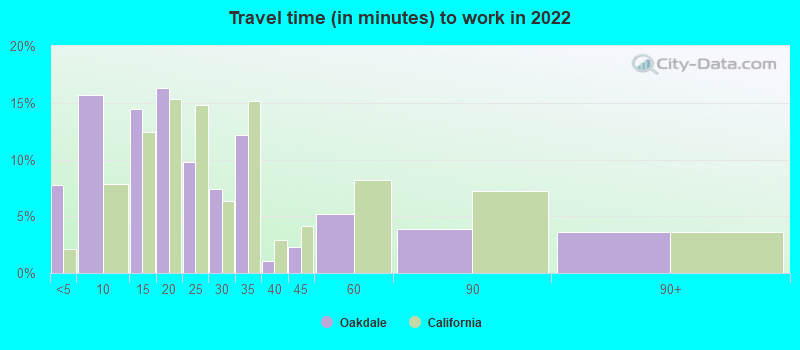
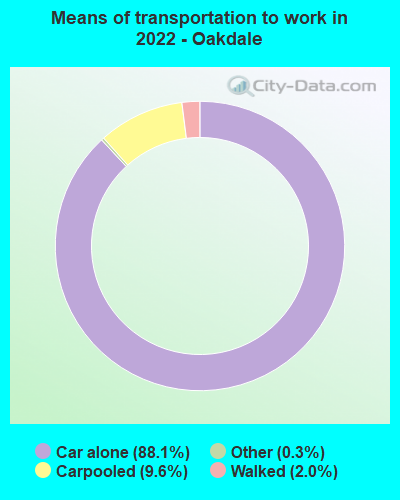
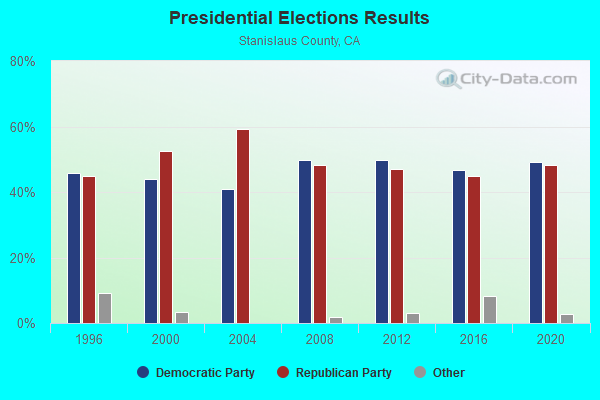
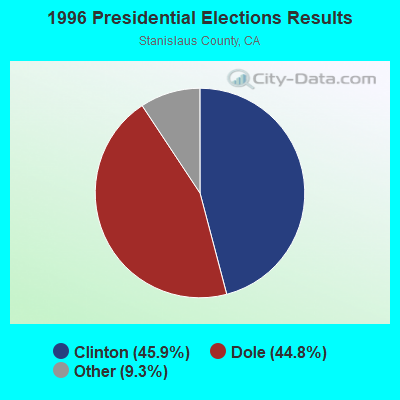
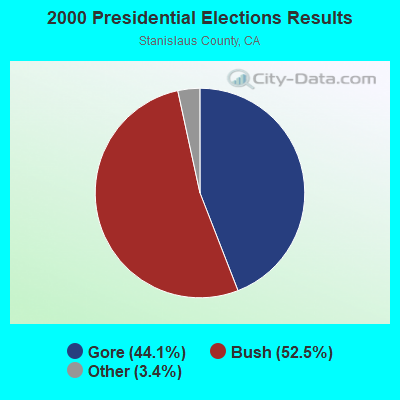
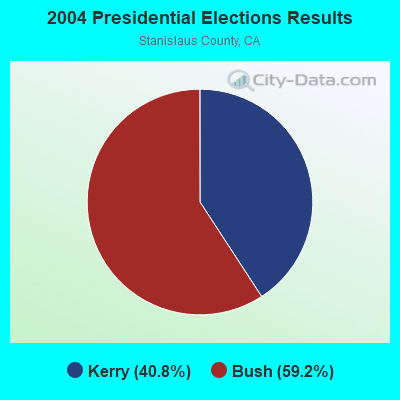
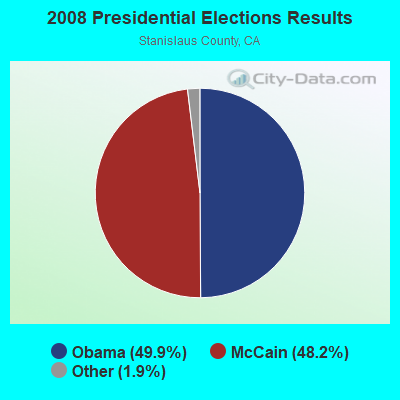
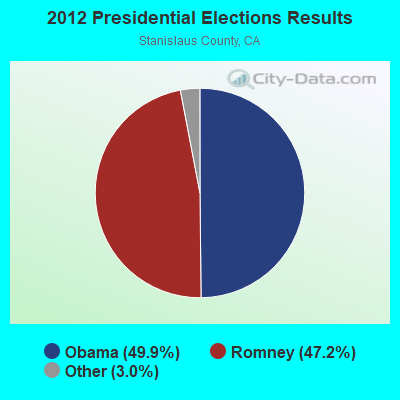

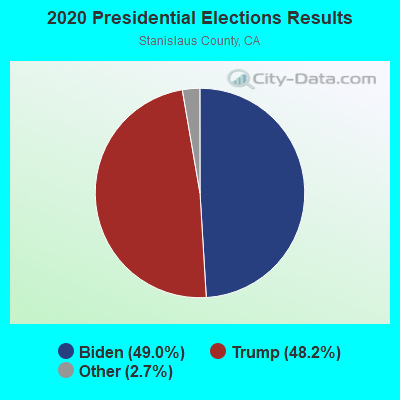
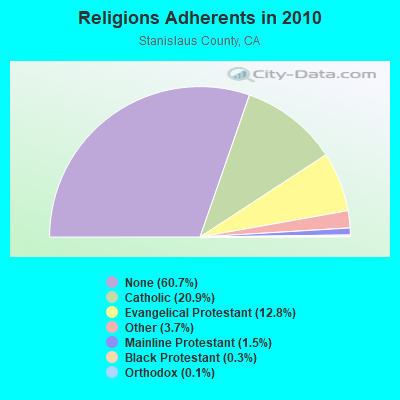
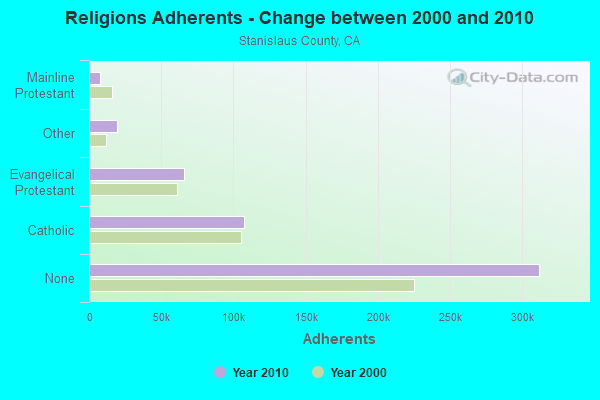
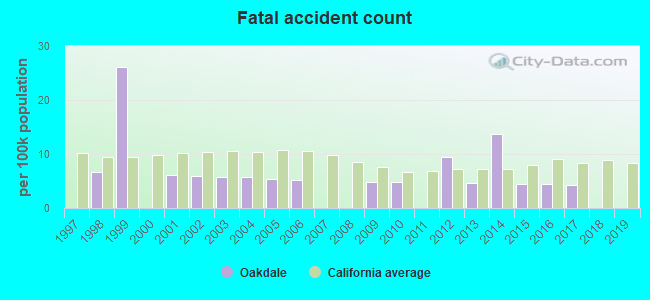
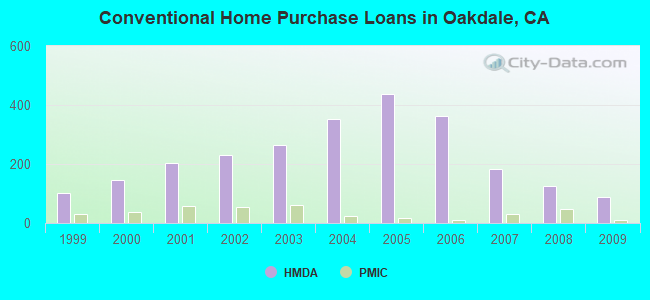
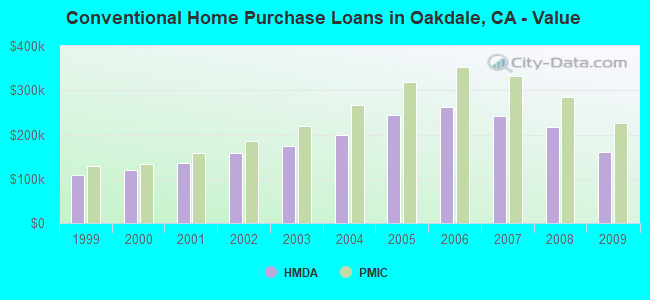
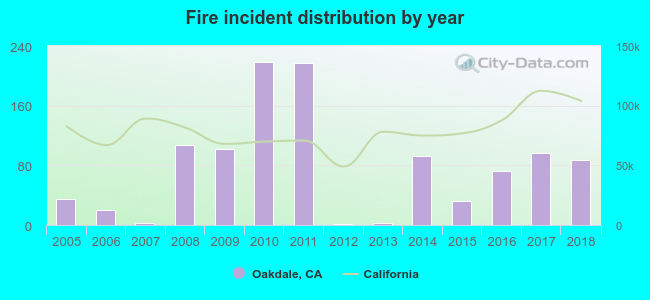 Based on the data from the years 2005 - 2018 the average number of fires per year is 78. The highest number of fires - 219 took place in 2010, and the least - 1 in 2012. The data has a growing trend.
 When looking into fire subcategories, the most reports belonged to: Outside Fires (53.8%), and Structure Fires (30.8%).